
Abstract
Synovium-derived stem cell (SDSC) is one of valuable sources for cartilage regeneration. Basic fibroblast growth factor (bFGF) was reported to augment the differentiation potential of mesenchymal stem cells originating from a variety of sources. In this study, we applied various concentrations of bFGF to monolayer cultures of SDSCs and evaluated its effects on proliferation and chondrogenesis. SDSCs expressed mRNAs of FGF receptor 1, 2, 3, and 4, but produced only FGF receptor 3 protein. The SDSCs were expanded as monolayer supplemented with various concentrations of bFGF (0, 0.1, 1, 10, and 100 ng/mL) before chondrogenesis. Cell shrinkage and increased actin expression was noted as well as enhanced proliferation by bFGF treatment in monolayer cultures. Cell surface marker CD34 and CD49a expression of SDSCs was decreased with 10 and 100 ng/mL of bFGF. In micromass pellet cultures, bFGF-treated SDSCs showed augmented sizes, weights, and glycosaminoglycan accumulation of pellets by bFGF supplementation. Messenger RNA and protein expression of type II and type X collagen were upregulated in pellets cultured bFGF. These results demonstrated that bFGF was an effective agent for the enhancement of SDSC proliferation and chondrogenesis. From the results in this study, we could elect the 10 ng/mL of bFGF as an optimal concentration for pretreatment of SDSCs before chondrogenic differentiation.
Introduction
The application of effective cytokines to induce chondrogenesis of MSCs is one of the most important factors in cartilage tissue engineering. In addition to our previous study in which SDSCs were isolated and characterized as a type of MSCs, we looked for the optimal growth factor for chondrogenic differentiation of SDSCs, and found that the combination of 10 ng of transforming growth factor (TGF)-β1 and 100 ng of bone morphogenic protein-2 (BMP-2) was the most favorable condition among the combinations tested.12,13 However, we concluded that the growth factor condition to push SDSCs to chondrogenic differentiation was still by far limited, since there was still discrepancy between the histological findings of the pellets of SDSCs cultured with TGF and BMP and those observed in native cartilage as well as gene expression. Therefore, we have undertaken an effort to determine more effective methods to promote chondrogenesis of SDSCs.
Basic fibroblast growth factor (bFGF) has been known to promote matrix synthesis by the prechondrogenic cells and chondrocytes although it was not effective in chondrogenesis of SDSCs when it was administered during micromass pellet culture. 13 In vitro treatment with bFGF also showed selection for the survival of a particular subset of cells enriched in pluripotent mesenchymal precursors and has been shown to be useful in acquiring a large number of cells with preserved differentiation potential for mesenchymal tissue repair as well.14,15 Basic FGF increased chondrogenic Sox9 gene expression in chondrocytes via the mitogen-activated protein kinase (MAPK) pathway. 16 Basic FGF has also been shown to positively affect the mitotic and chondrogenic potentials of human bone marrow-derived MSCs. 17
We hypothesized that the administration of bFGF to monolayer cultures of SDSCs will augment their stem cell potential, positively affecting chondrogenesis eventually. In this study, we expanded SDSCs via bFGF treatment at various concentrations and induced chondrogenic differentiation of the SDSCs. The principal objective of this study was to evaluate the effects of bFGF on the proliferation and chondrogenesis of SDSCs, and to determine the most effective concentration of bFGF for those processes.
Materials and Methods
Chemicals and media
High-glucose Dulbecco's modified Eagle's medium (DMEM) was purchased from WelGENE. Low-glucose DMEM, antibiotic–antimycotic solution, fetal bovine serum, and calcium- and magnesium-free phosphate-buffered saline were purchased from Gibco. Dexamethasone, collagenase, proline, pyruvate, and ascorbate 2-phosphate were obtained from Sigma. ITS premix was purchased from BD Biosciences. Recombinant bFGF, TGF-β1, and BMP-2 were obtained from R&D Systems.
Isolation and expansion of human SDSCs
Synovial tissues were isolated from the knee joints of 20 patients (mean age, 68 years; range, 64–72 years) with osteoarthritis who were undergoing total knee replacement surgeries. Synovial tissues were minced and digested overnight with 0.02% collagenase at 37°C. After filtering through 70 μm cell strainers, the released cells were washed and resuspended in DMEM supplemented with 10% fetal bovine serum and antibiotic–antimycotic solution (referred to complete DMEM). The cells were not mixed and cells collected from one donor were considered as single batch and were divided into five groups for monolayer expansion and subsequent chondrogenic differentiation. These cells were plated at a density of 1.1 × 10² cells per cm2 and cultured at 37°C under an atmosphere of 5% CO2 with complete DMEM supplemented with each concentration of bFGF (0, 0.1, 1, 10, and 100 ng/mL), only during the monolayer culture period. The medium was changed twice weekly. After 14 days of expansion at passage 0 (P0), the cells were trypsinized and replated at a same density like as P0. P1 cells were used to conduct assays of monolayer cells and chondrogenic differentiation was induced with P2 cells. This study was approved by the Institutional Review Board, and informed consent was obtained from all study subjects.
Western blot analysis
To assay the expression level of fibroblast growth factor receptor (FGFR) 1, 2, 3, and 4 in SDSCs, proteins were collected using cell-lysis buffer from nontreated SDSCs and bFGF-treated SDSCs cultured for 2 weeks. Basic FGF was supplemented at a concentration of 10 ng/mL in the medium for bFGF-treated SDSCs. The cell lysates were centrifuged for 30 min at 15,000 rpm and 4°C after harvest, and the protein concentration of supernatant was measured by Bradford solution (Bio-Rad), mixed with sodium dodecyl sulfate (SDS) sample buffer, and heated at 95°C for 5 min. Prepared protein samples were separated by electrophoresis on 4%–12% SDS–polyacrylamide gel electrophoresis gradient gel (Invitrogen) and transferred onto a polyvinylidene difluoride membrane (Bio-Rad). Protein-transferred membrane was incubated with 0.05% Tris-Buffered Saline Tween-20 (TBS-T) added with 5% skim milk for blocking and then placed in the primary antibody solution for overnight at 4°C. All of primary antibodies for Western blot analysis were purchased from Santa Cruz Biotechnology and were diluted 1:500 with 0.05% Tris-Buffered Saline Tween-20 (TBS-T) and 1% skim milk. The membranes were further incubated with 1:3000 diluted horseradish peroxidase-conjugated secondary antibodies for 1 h at room temperature. Developing was performed using ECL Western blotting substrate (Promega Corporation). As a standard protein for protein quantization, β-actin was detected from same membrane.
Assessment of proliferation by MTS assay
To evaluate the effects of bFGF on the proliferation of SDSCs, monolayer-cultured SDSCs (P0) were detached and replated into 96-well tissue culture plates at a cell density of 2 × 10² cells/well. The cells were treated with various concentrations of bFGF during the culture period. After 3, 5, 7, 10, and 14 days, the viable cell numbers were determined using CellTiter 96® AQueous Cell Proliferation Assay (MTS) kit (Promega, Fitchburg, WI).
Immunofluorescence of SDSCs cultured on monolayer cultures
At P1, SDSCs treated with various concentrations of bFGF were seeded on slide glasses and cultured for 10 days. The SDSCs were fixed with 100% methanol and treated with anti-actin antibody (Santa Cruz Biotechnology) for overnight at 4°C. Then, the cells were incubated with goat anti-mouse IgG conjugated with PE-fluorescence (BD Biosciences) for 1 h at room temperature. 4',6-diamidino-2-phenylindole (DAPI) was utilized for nuclear-counterstaining. The staining was observed under confocal microscopy. The area occupied by the cells were measured using imaging software (ImageJ v. 1.43) to quantify the shrinkage of the cells, and the intensity of immunofluorescence of actin staining was quantified by computerized densitometry (Scion Corp.). Total area and intensity was measured and divided by the number of cells in the field to evaluate individual area and intensity per cell. The measurement of each sample was reported as the percentage of the control cultured without bFGF.
Flow cytometric analysis of surface molecule expression
The antibodies utilized in this study were mouse anti-human monoclonal antibodies conjugated directly to fluorochromes: CD29–phycoerythrin (PE), CD31-PE, CD34-PE, CD44-PE, CD45-PE, CD49a-PE, CD73-PE, CD105-PE, and CD166-PE (BD Biosciences). Irrelevant monoclonal antibodies were included as controls. About 2 × 10⁵ cells per each sample were incubated with directly conjugated monoclonal antibodies for 30 min at 4°C in a dark room. Nonspecific fluorescence was determined using equal aliquots of cell preparations that had been incubated with anti-mouse isotype monoclonal antibodies (BD Biosciences). Cell surface markers were detected using a FACSCalibur flow cytometer (Becton Dickinson) and analyzed with CellQuest software (Becton Dickinson).
In vitro chondrogenic differentiation
Chondrogenic differentiation was accomplished using a modification of a previously described protocol. 13 To induce chondrogenic differentiation, P1 cells cultured at different bFGF concentrations were trypsinized and separately resuspended in chondrogenic media at a concentration of 4 × 10⁵ cells/mL. The chondrogenic media consisted of low-glucose DMEM supplemented with 100 μM ascorbate-2-phosphate, 100 μg/mL pyruvate, 40 μg/mL proline, 100 nM dexamethasone, antibiotic–antimycotic solution, and ITSTM +premix universal culture supplement. The resuspended cells were then seeded in 15-mL tubes at a density of 2 × 10⁵ cells/tube and centrifuged to generate pellets, after which the caps of the tubes were loosened slightly to allow for air exchange. After 24 h of incubation at 37°C with 5% CO2, the media were replaced with chondrogenic media supplemented with 100 ng/mL of BMP-2 and 10 ng/mL of TGF-β1. No bFGF was added to the media during pellet culture period. The media were changed every other day. Pellets were harvested after 21 days, then subjected to sulfated GAG quantification, semi-quantitative polymerase chain reaction (PCR) and histological analysis.
GAG quantification
The dimethylmethylene blue (DMB) method was used for the detection of total GAG contents in pellets. The media were harvested at each changing of the media during the pellet culture. After 3 weeks of pellet culture, three pellets per group were harvested. The media and pellets were digested overnight in papain/buffer solution (0.1 M sodium formate, 200 μg/mL papain in 5 mM EDTA, and 5 mM L-cysteine; pH 3.0) at 55°C. After centrifugation, 50 μL aliquots of the papain-digested extracts were pipetted into each well of 96-well plates and 250 μL of DMB dye solution was added. The absorbance of these extracts was determined using an ELISA reader at 530 and 590 nm and compared to the absorbance of Chondroitin-6-sulfate standards. The total GAG quantities per sample were then normalized by their DNA contents determined via an Indole assay. The Indole assay was conducted as follows. After the DMB assay, the pellets were treated with 100 μL of 1 N NaOH and 100 μL of Indole reagent and incubated for 10 min at 100°C. The absorbance of these solutions was determined at 490 nm.
Histology
The harvested pellets of each group were fixed for 4 h in 4% paraformaldehyde at room temperature and embedded in the Tissue Tek embedding medium. Sections were prepared at a thickness of 5 μm. The specimens were subjected to Safranin-O staining for proteoglycan detection and immunohistochemical staining for the detection of type I, II, and X collagen. Normal human articular cartilage with subchondral bone was used as a control.
Safranin-O staining for proteoglycan
For Safranin-O staining, the specimens were stained for 30 s with fast-green solution and washed with distilled water. Safranin-O solution was added for 3 min and washed with distilled water. These specimens were counterstained for 1 min with hematoxylin and mounted. Safranin-O-stained pellets were graded using the visual histological score (Bern score) to evaluate synthesized cartilage matrix. 18
Immunohistochemistry for collagens type I, II, and X
The pellet sections were treated with 3% hydrogen peroxide in methanol for 10 min at room temperature to block endogenous peroxidase activity. After washing, specimens were incubated with 0.2% hyaluronidase solution for 30 min at 37°C and rewashed. Blocking was conducted with blocking solutions (Zymed Laboratories) for 30 min at room temperature. Primary antibodies to type I collagen (Neomarkers), type II collagen (Calbiochem), and type X collagen (Sigma) were added for overnight at 4°C. Broad-spectrum secondary antibody (Zymed Laboratories) was applied for 30 min, followed by 30 min of treatment with streptavidin peroxidase solution (Zymed Laboratories). To view the staining, 3-3′-diaminobenzidine solution was added to the sections. Hematoxylin was utilized for nuclear counterstaining. The sections were then mounted and observed under light microscopy.
Semi-quantitative reverse transcriptase–PCR and quantitative real-time PCR analysis
To evaluate the expression levels of FGFR 1, 2, 3, and 4 in normal SDSCs, we extracted total RNA from the bFGF-untreated SDSCs. Total mRNA was isolated using an RNeasy mini kit (Qiagen). Reverse transcription was conducted on 1 μg of RNA using a First strand cDNA synthesis kit (Fermentas-Life Sciences). Complementary DNA was amplified using AccuPower® PCR PreMix (Bioneer) and gene-specific primer sets. The primer sequences and PCR product sizes are listed in Table 1. PCR was conducted under the following conditions: 30 cycles of 30 s at 94°C for denaturation, 30 s at annealing temperature, and 30 s at 72°C for extension. The reaction products were then resolved via electrophoresis on agarose gels containing SYBR® Safe DNA gel stain (Invitrogen) and observed under ultraviolet light. A 100-bp DNA ladder (Bioneer) was utilized as a standard size marker. To determine the absolute transcript copy numbers of collagen type I, II, X, aggrecan, sox-9, osteocalcin, and alkaline phosphatase (ALP) in the pellets of SDSCs, quantitative real-time PCR analysis was performed. Pellets cultured for 3 weeks were assayed and normal chondrocytes were utilized as a positive control. The RNA extraction and cDNA synthesis procedures were identical to those of conventional PCR analysis. For the SDS 7000 system reactions, a master mix of the following components was prepared with the indicated end concentration and analyzed on an ABI Prism 7000 Sequence Detection System (Perkin-Elmer Applied Biosystems): 6.25 μL water, 1.25 primer (9 μM) and probe (2.5 μM), and 12.5 μL TaqMan PCR 2 × master mixture (Perkin-Elmer Applied Biosystems). Five microliters of complementary DNA was added as a PCR template. The PCR conditions were as follows: after the initial activation of uracyl-Nglycosylase at 50°C for 2 min, AmpliTaq Gold was activated at 95°C for 10 min; the subsequent PCR condition consisted of 45 cycles of denaturation at 95°C for 15 s and annealing extension at 60°C for 1 min per cycle. During the PCR amplification procedure, the amplified products were continuously measured by determination of the fluorescence emission. The levels of target gene expression were analyzed via the 2−ΔΔCT method and normalized to human GAPDH endogenous Control (VIC/MGB Probe, Primer Limited; Perkin-Elmer Applied Biosystems), and represented as relative expression. Ratio between the expressions of type II and type I collagen (type II/type I) was calculated and represented as the percentage of the control group (0 ng/mL bFGF). The PCR primer and probe sets for human collagen type I, II, X, aggrecan, Sox 9, ALP, and osteocalcin were designed with the Primer Express software (Perkin-Elmer Applied Biosystems), and the nucleotide sequences are listed in Table 2.
FGFR-1, fibroblast growth factor receptor-1; FGFR-2, fibroblast growth factor receptor-2; FGFR-3, fibroblast growth factor receptor-3; FGFR-4, fibroblast growth factor receptor-4; GAPDH, glyceraldehydes-3-phosphate dehydrogenase; (F), forward, sense primer; (R), reverse, antisense primer; bp, base pairs.
COL IA1, collagen, type I, alpha 1; COL IIA1, collagen, type II, alpha 1; COL XA1, collagen, type X, alpha 1; Sox 9, SRY (sex determining region Y)-box9; ALP, alkaline phosphatase; OC, bone-gamma-carboxyglutamate (gla) protein (osteocalcin).
Statistical analysis
All assays, including immunocytochemistry, MTS assay, flow cytometry, and GAG quantitation, were performed in triplicate and repeated three times with samples from three different donors. Descriptive statistics were employed to determine the group means and standard deviations of the numerical data. Data were analyzed via analysis of variance tests, followed by the Tukey HSD multiple significance test to determine whether the proliferation of SDSCs, the expression levels of cell surface markers, the wet weight of pellets, the GAG production, and gene expression level differed significantly with different bFGF concentrations. p-Values of <0.05 were considered statistically significant.
Results
FGFR expression in SDSCs
Reverse transcriptase–PCR and Western blot analysis were conducted to confirm the basal expression levels of various FGFRs in the SDSCs. The mRNAs of four types of FGFR (FGFR1, FGFR2, FGFR3, and FGFR4) were expressed in bFGF-untreated SDSCs (Fig. 1A). In Western blot analysis, only the FGFR3 protein was detected in the SDSCs (Fig. 1B) and the expression pattern was not changed after 2 weeks of 10 ng/mL bFGF treatment (Fig. 1C).
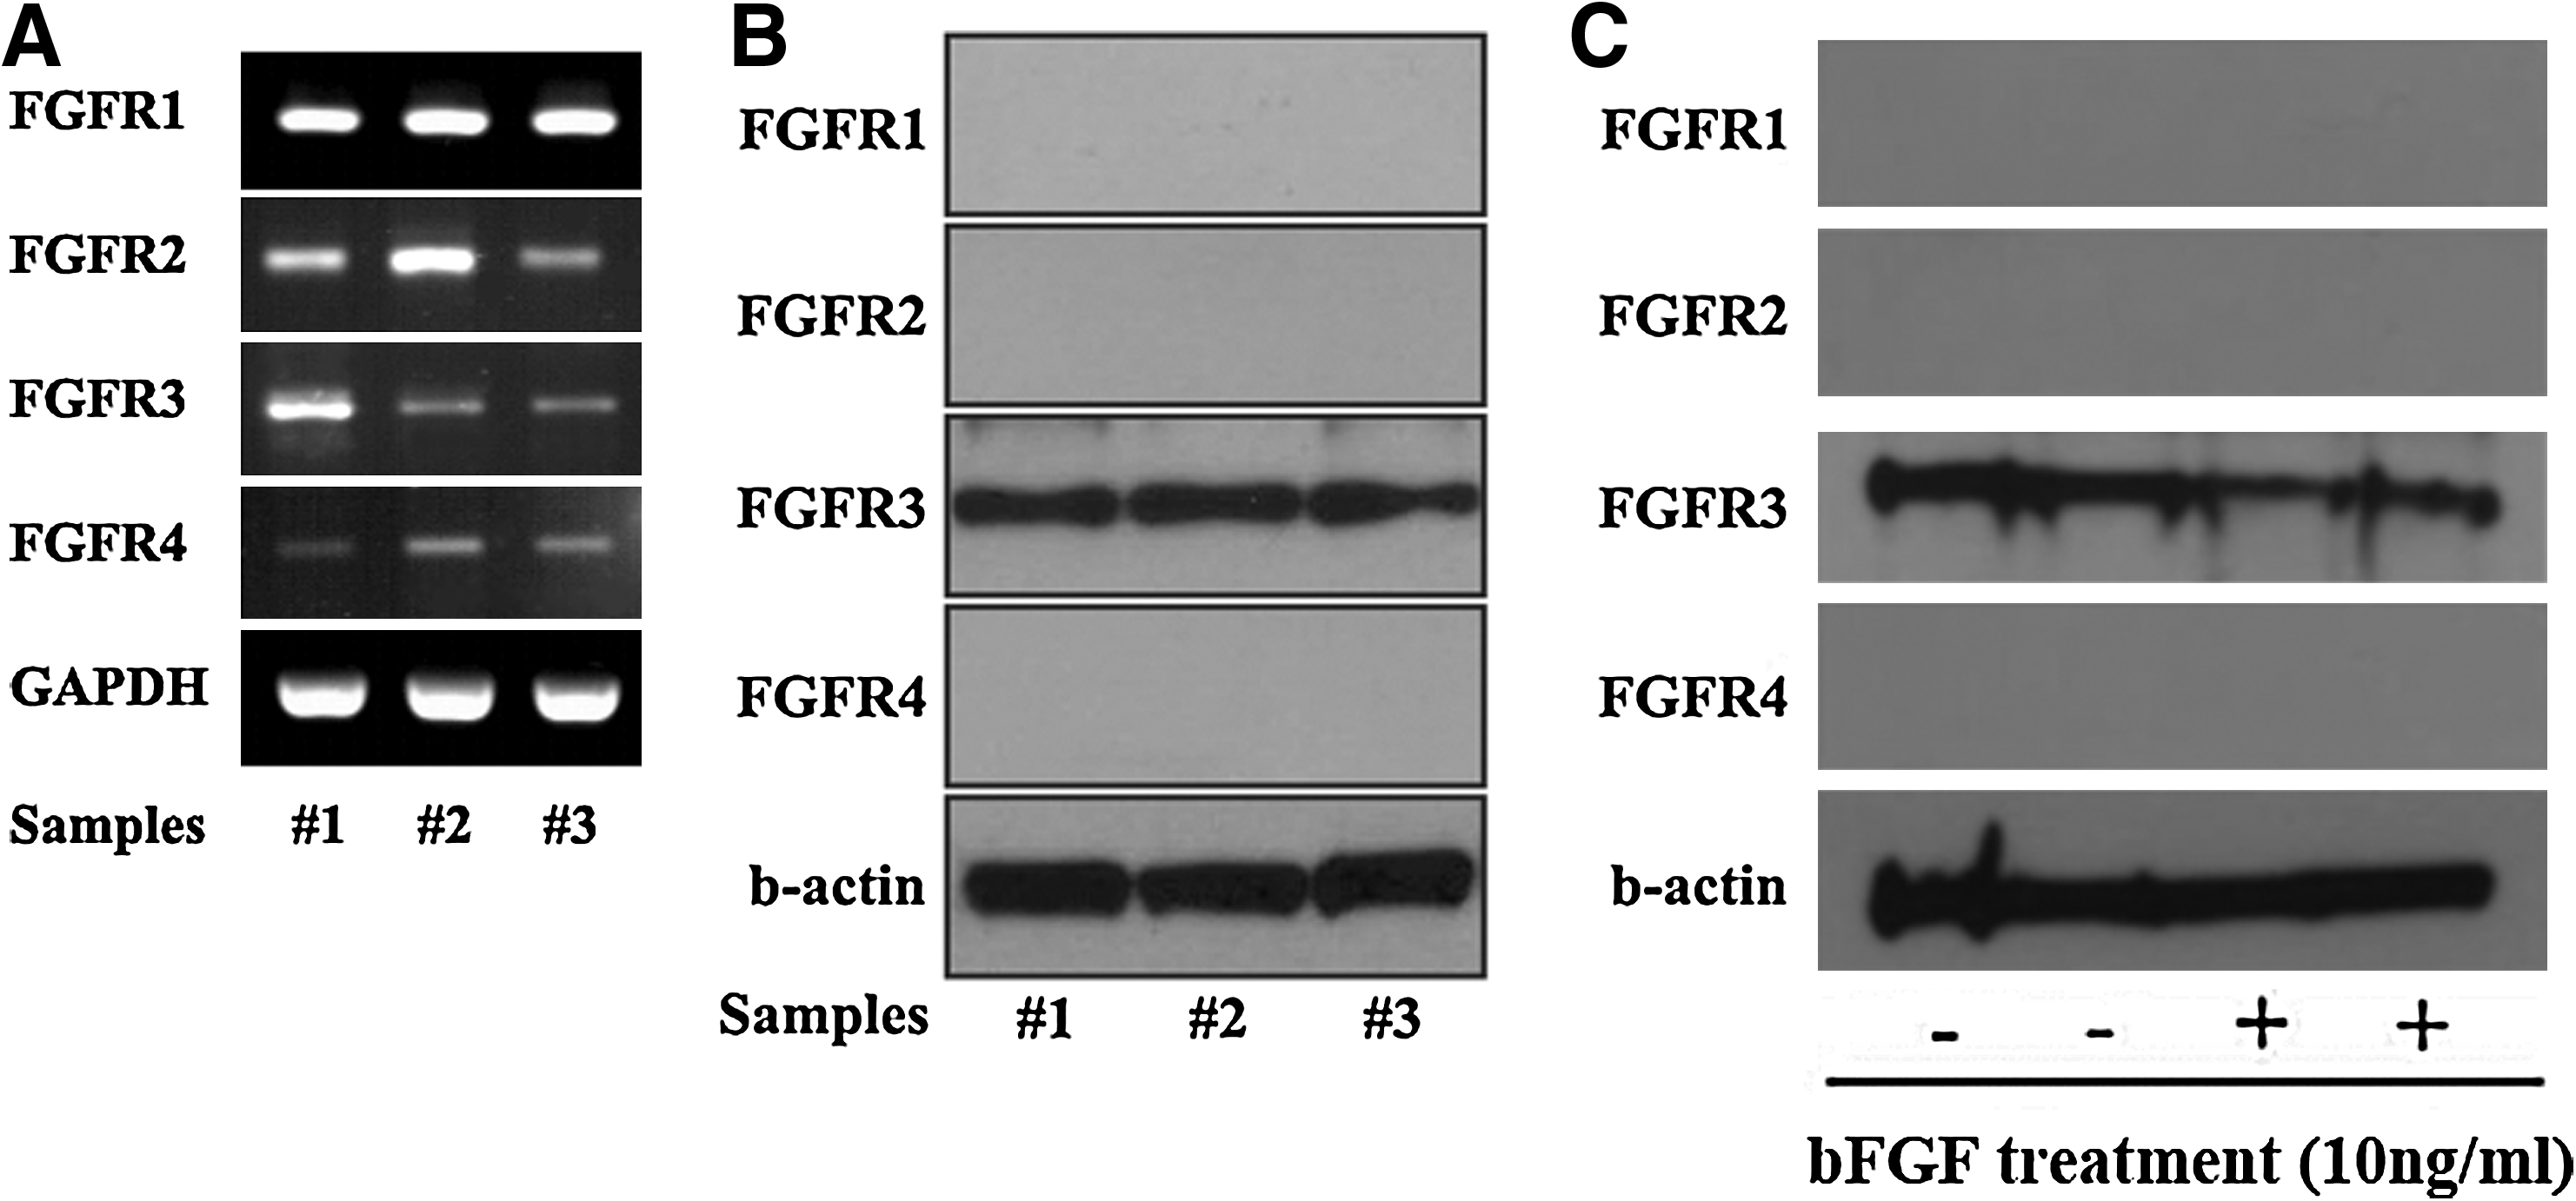
Expression of FGFRs in SDSCs. Messenger RNA and proteins were obtained from SDSCs cultured in Dulbecco's modified Eagle's medium supplemented with 10% fetal bovine serum for 2 weeks on monolayer, and the expression levels of FGFR-1, 2, 3, and 4 were analyzed via RT-PCR and Western blotting.
The effect of basic FGF on expansion of SDSCs
Cell morphology and proliferation
Basic FGF resulted in changes of morphology and enhanced proliferation of monolayer-cultured SDSCs. SDSCs were divided into five groups and treated with various concentrations (0, 0.1, 1, 10, and 100 ng/mL) of bFGF from P0 to P1 (for 4 weeks). Cell morphology and numbers were observed under a light microscope at P1. SDSCs were shrunken via bFGF treatment and more cell numbers were noted in the bFGF-treated dishes (Fig. 2A). The distribution of actin-cytoskeleton in SDSCs was detected by a confocal microscopy (Fig. 2B). To confirm the numbers of viable cells, we conducted serial MTS assays on days 3, 5, 7, and 14 of P1. In the MTS assay, cells treated with bFGF proliferated more rapidly than nontreated cells from 5 days of culture. On day 14, SDSCs treated with 10 and 100 ng/mL of bFGF evidenced the maximum increase in proliferation (Fig. 2C). The cells showed shrunken cytoplasmic morphology and fluoresence intensity per cell was greater in the culture with 10 and 100 ng/mL of bFGF (Fig. 2D, E, and F).
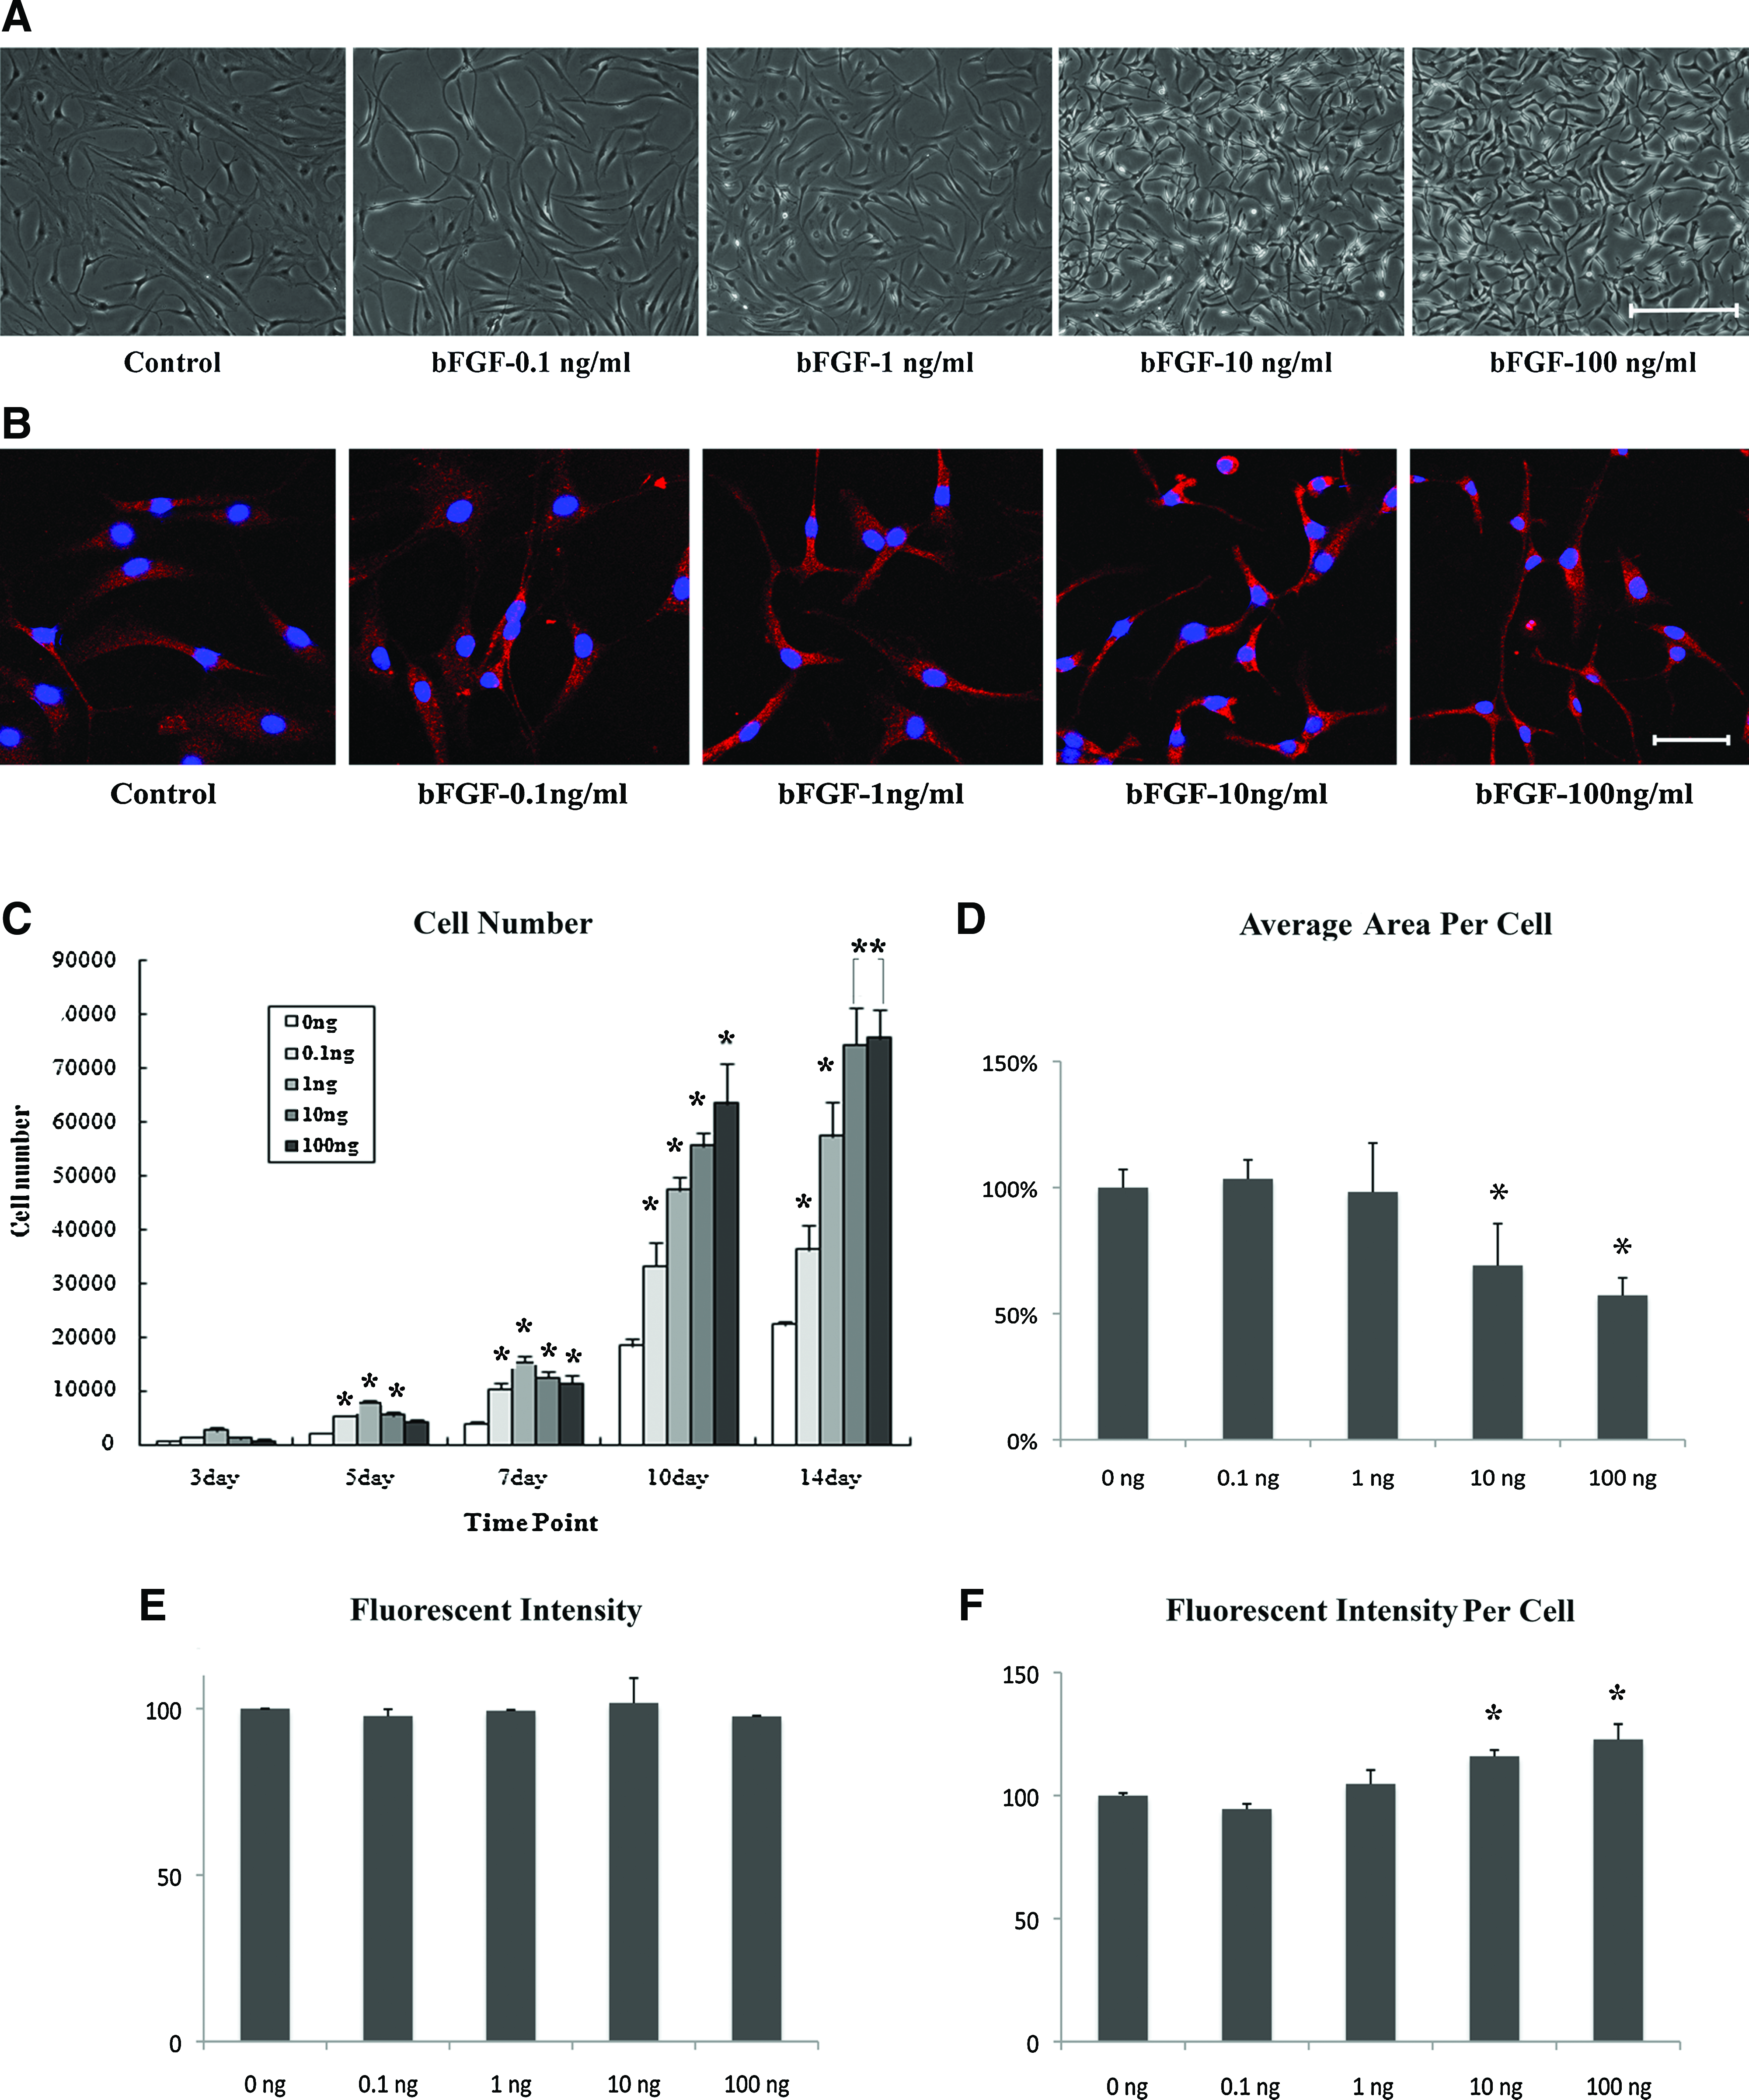
Effects of bFGF on morphology and proliferation of SDSCs. SDSCs cultured on monolayers were treated with various concentrations of bFGF (0, 0.1, 1, 10, and 100 ng/mL) during the culture.
Cell surface marker expression
To evaluate the effects of bFGF on surface marker expression of SDSCs, cells expanded on monolayers with bFGF were detached and flow cytometry staining was conducted for CD29, 31, 34, 44, 45, 49a, 73, 105, and 166. Almost 100% of the SDSCs expressed mesenchymal surface markers (CD29, 44, 73, 105 and 166), and these expressions were unchanged by bFGF. Approximately 5% of the SDSCs also expressed hematopoietic surface marker (CD34) when the SDSCs were not exposed to bFGF and this was reduced to 1% by 10 and 100 ng/mL of bFGF. About 0.5% of nontreated SDSCs expressed endothelial cell surface marker (CD31), but the expression was increased to near 4% by 10 and 100 ng/mL of bFGF treatment. Alpha-1 integrin (CD49a) expression of nontreated SDSCs was nearly 90% and the expression level was decreased dose dependently by bFGF (Fig. 3).
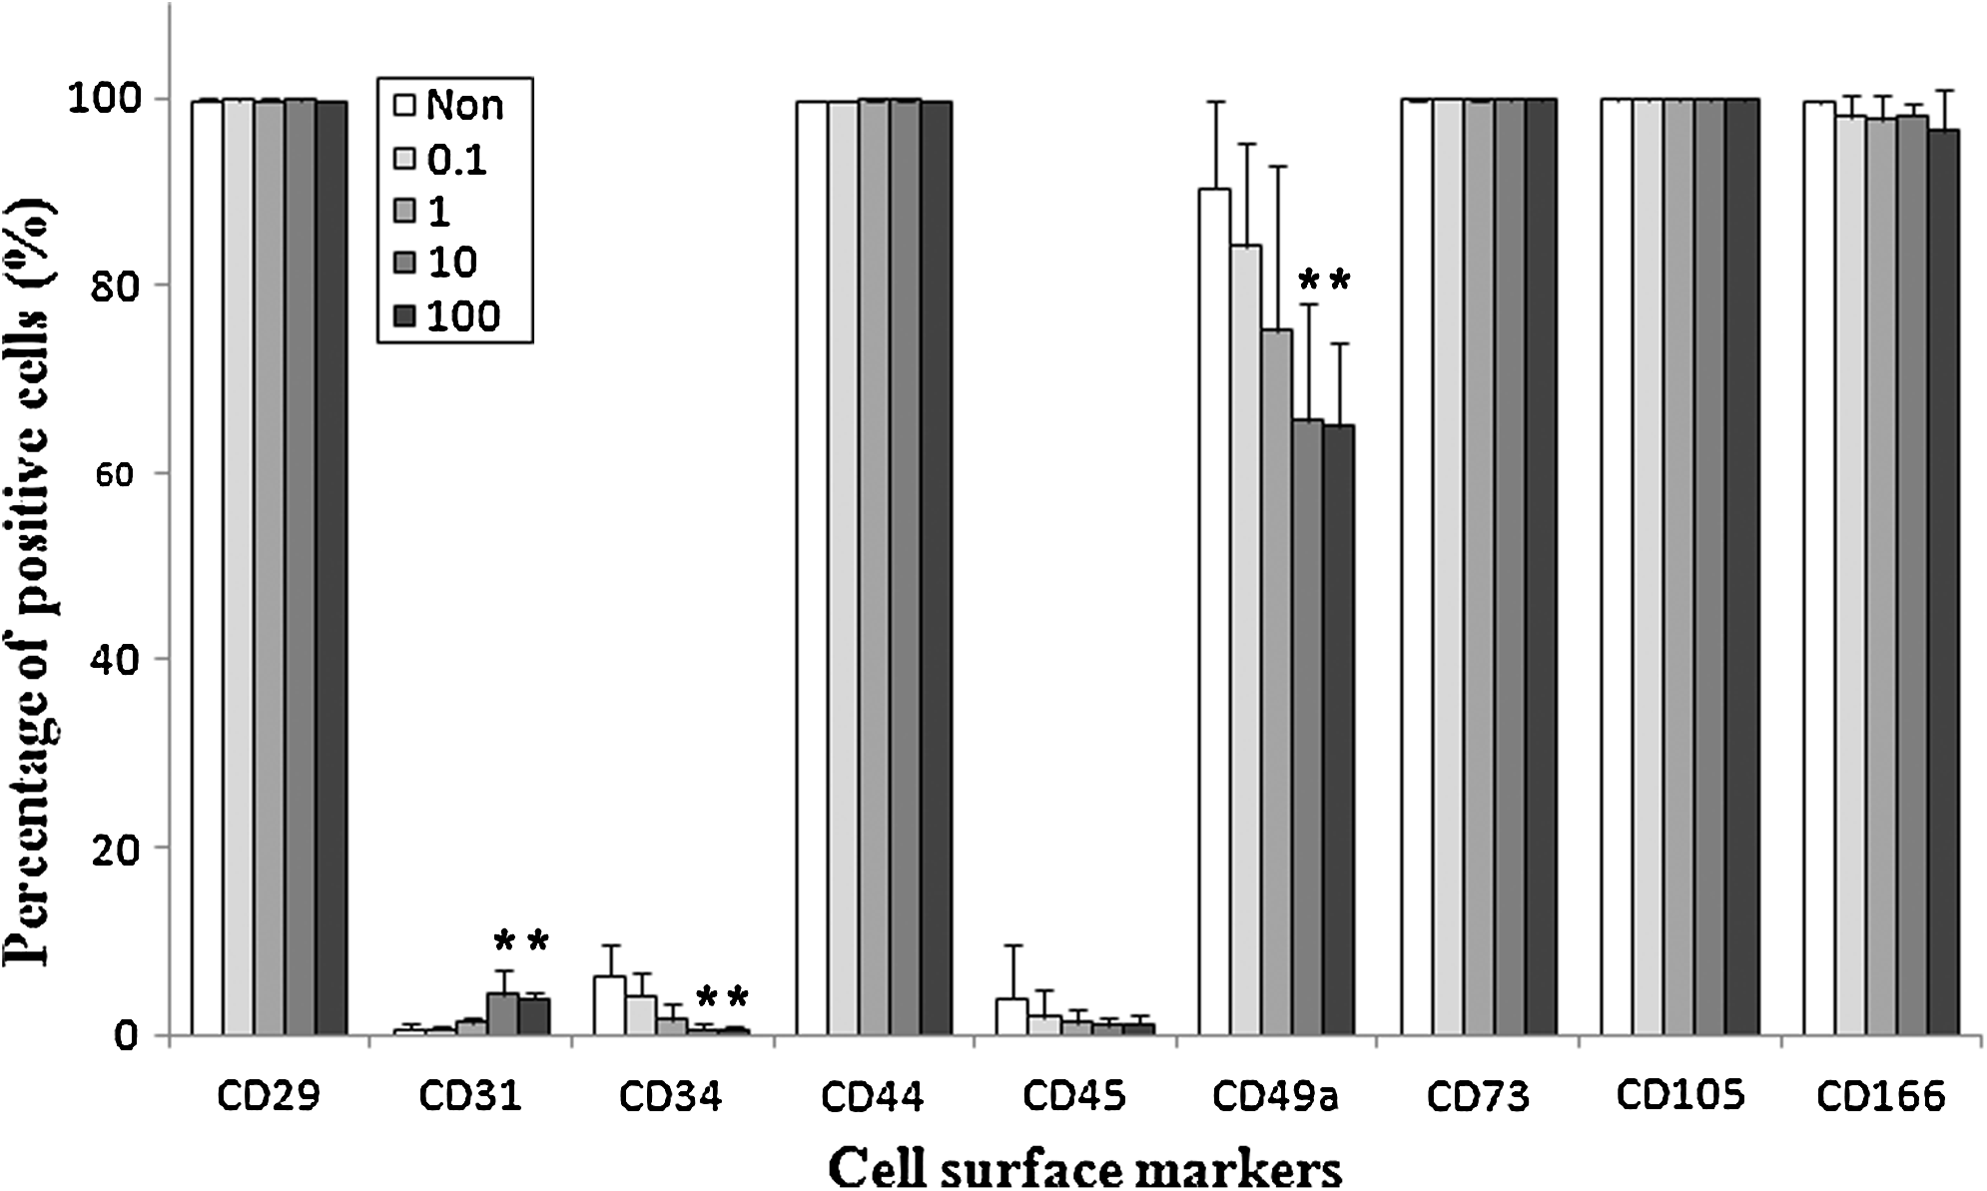
Change in cell surface marker expression of SDSCs by bFGF. At passage 1, SDSCs treated with variable concentrations of bFGF were detached and the expression levels of surface markers (CD29, 31, 34, 44, 45, 49a, 73, 105, and 166) of the SDSCs were assessed via FACS analysis. Mesenchymal cell surface markers, CD29, 44, 73, 105, and 166, were expressed by almost 100% of SDSCs, and this expression level was not altered by bFGF treatment. However, the expression levels of hematopoietic surface marker (CD34) and alpha-1 integrin (CD49a) were reduced by bFGF. Endothelial cell surface marker-CD31 was increased by 10 and 100 ng/mL of bFGF treatment. *p < 0.05 vs. control.
The effect of bFGF on chondrogenic differentiation of SDSCs
Gross morphology and weights
The macroscopic appearance of the pellets demonstrated that the chondrogenesis of SDSCs was enhanced by bFGF. The pellets made with cells expanded in the presence of 10 and 100 ng/mL bFGF were larger than those of other groups (Fig. 4A). Ten and 100 ng/mL of bFGF resulted in significant effect on the weight of pellets (Fig. 4B).
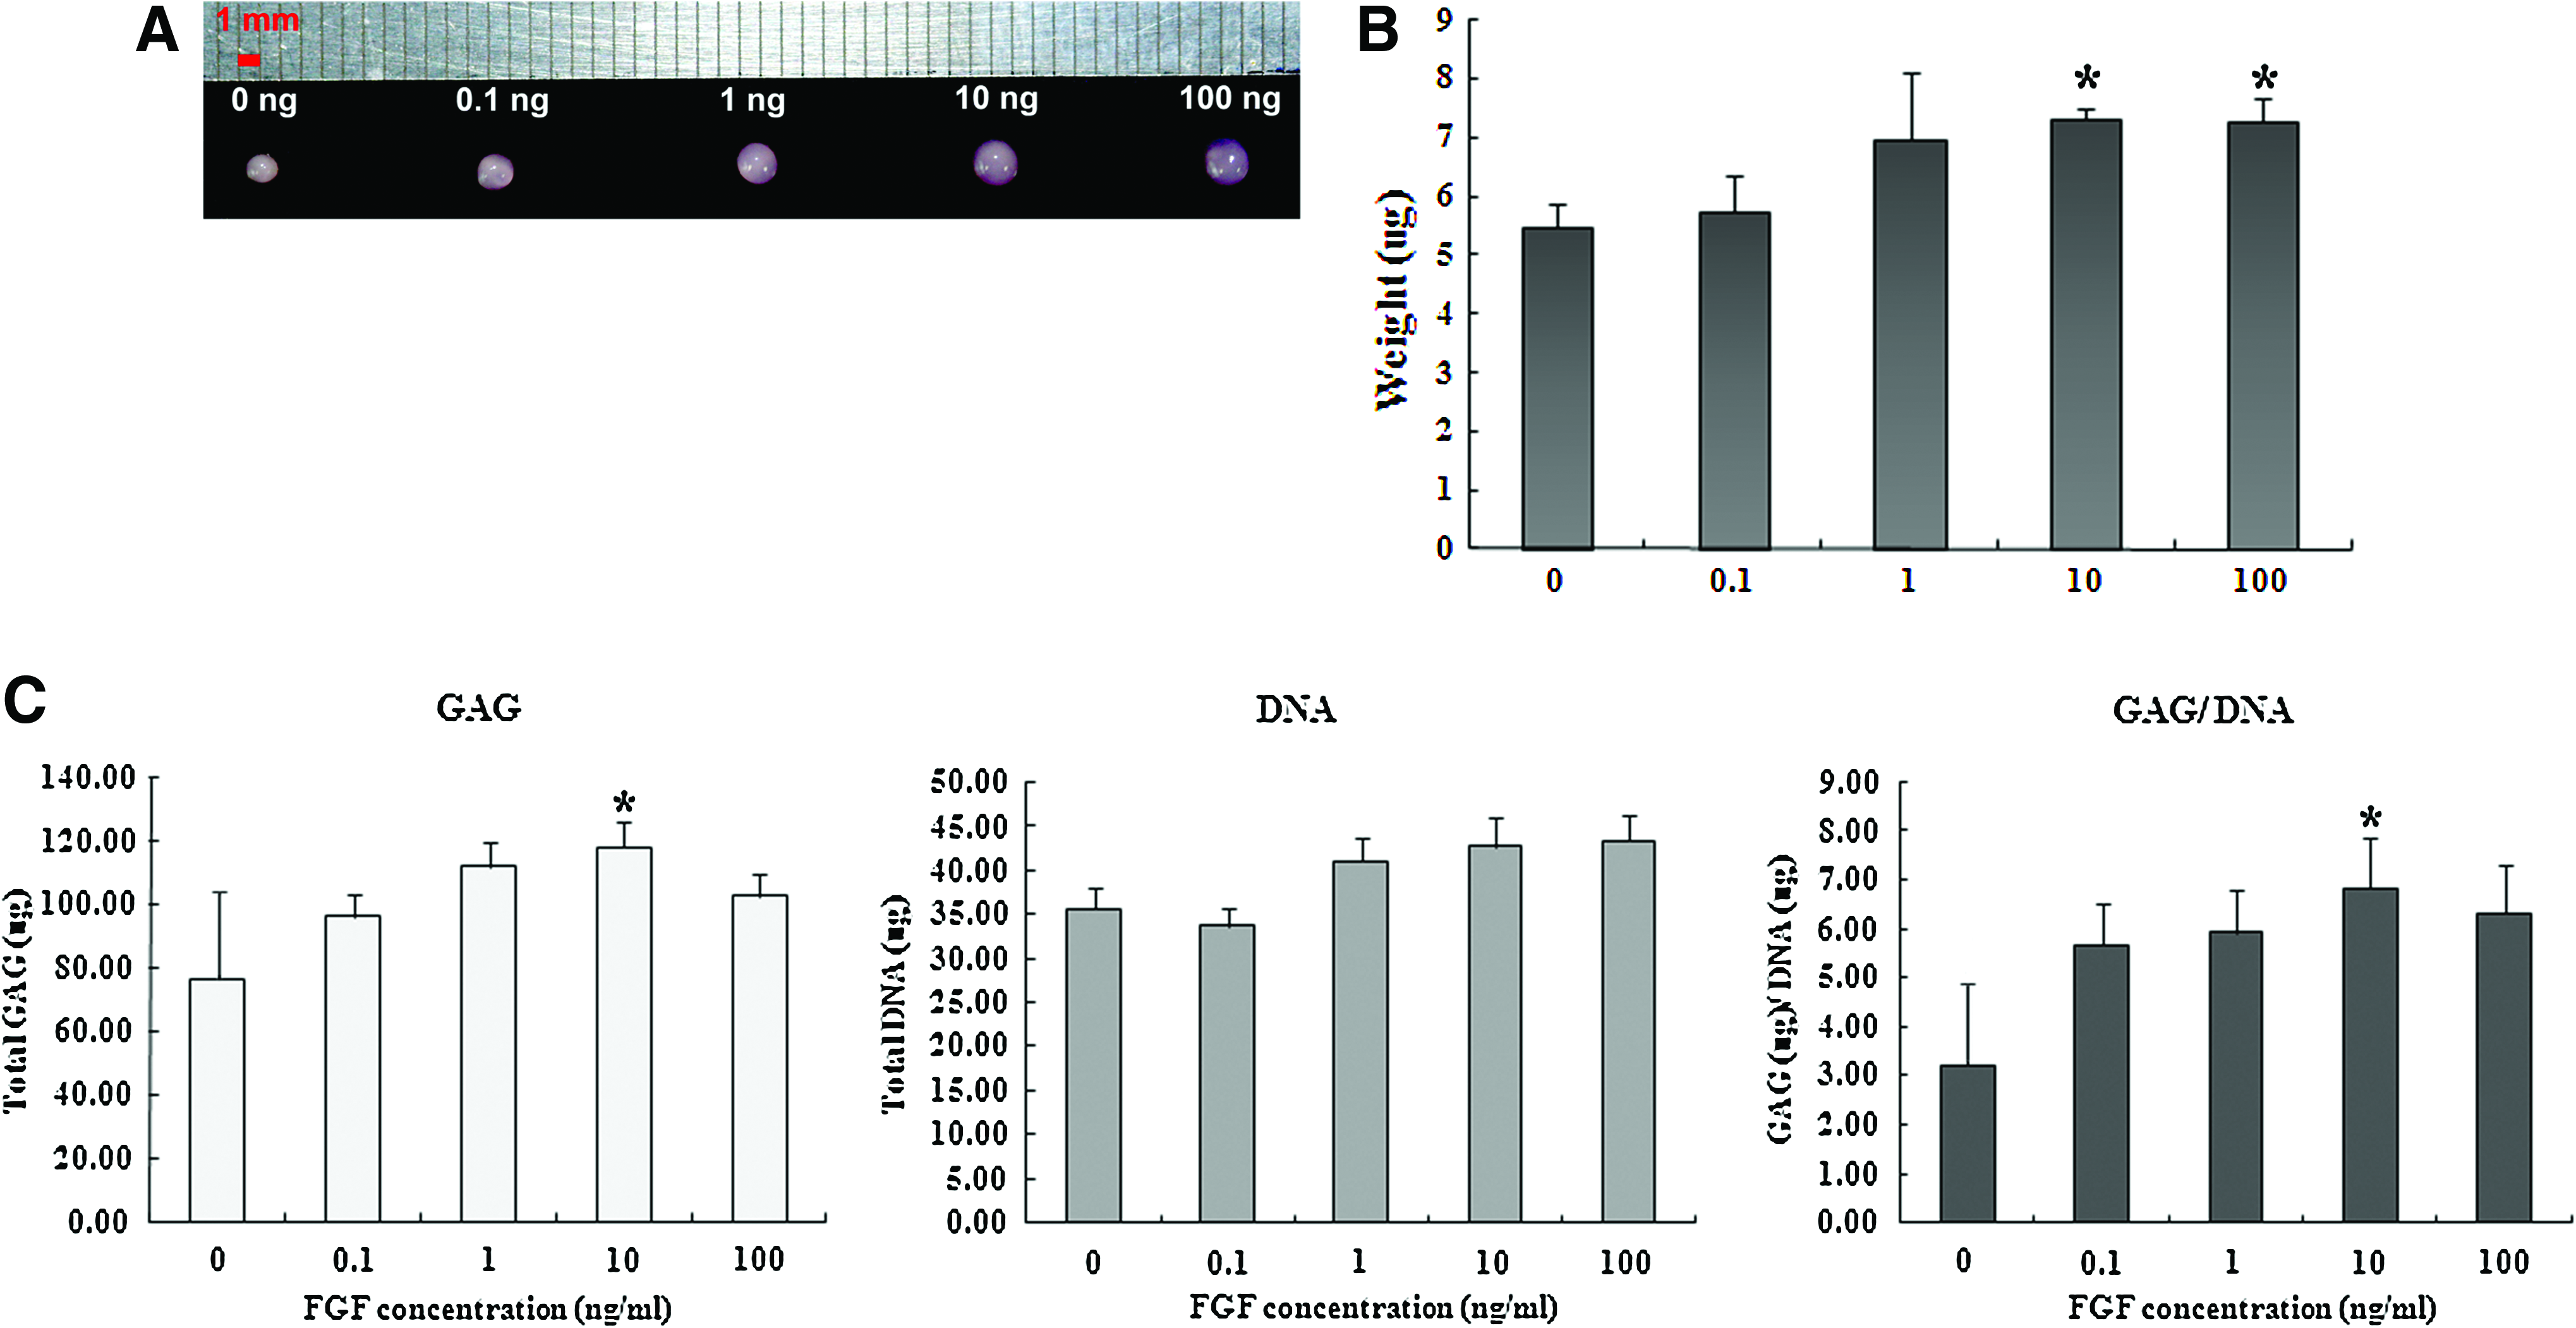
Effects of bFGF on macroscopic appearances, weights, and glycosaminoglycan (GAG) production of pellets. bFGF-expanded passage-1 SDSCs were cultured for up to 3 weeks under chondrogenic conditions.
GAG synthesis in pellets
Analysis of total GAG synthesis in pellets cultured for 3 weeks was conducted via a DMB assay and normalized by total amount of DNA (Fig. 4C). The amount of DNA was not different among the pellets of all groups. However, GAG production was significantly greater in culture with 10 ng/mL bFGF than in untreated control group. GAG content normalized to DNA amount was also greater with 10 ng/mL of bFGF. Other groups did not make any differences from control.
Histological analysis
Safranin-O and fast-green staining showed proteoglycan production in all pellets cultured for 3 weeks (Fig. 5A). Type I, II, and X collagen expression was detected in the pellets via immunohistochemistry. The expression level of type I and II collagen were generally stronger in the outer zones of the pellets than in the central zones. Type I collagen was expressed in all pellets, and no notable differences in expression levels were detected between groups (Fig. 5B). The level of type II collagen expression was consistently increased in response to the bFGF concentration, and 10 and 100 ng/mL of bFGF exerted more profound effects on expression (Fig. 5C). Basic FGF also had an effect on the augmentation of type X collagen (Fig. 5D). Histological evaluation using the visual histological score revealed a difference among groups, and the pellets with 10 ng/mL of bFGF made a significant difference from the control in Safranin-O staining (Fig. 5E).
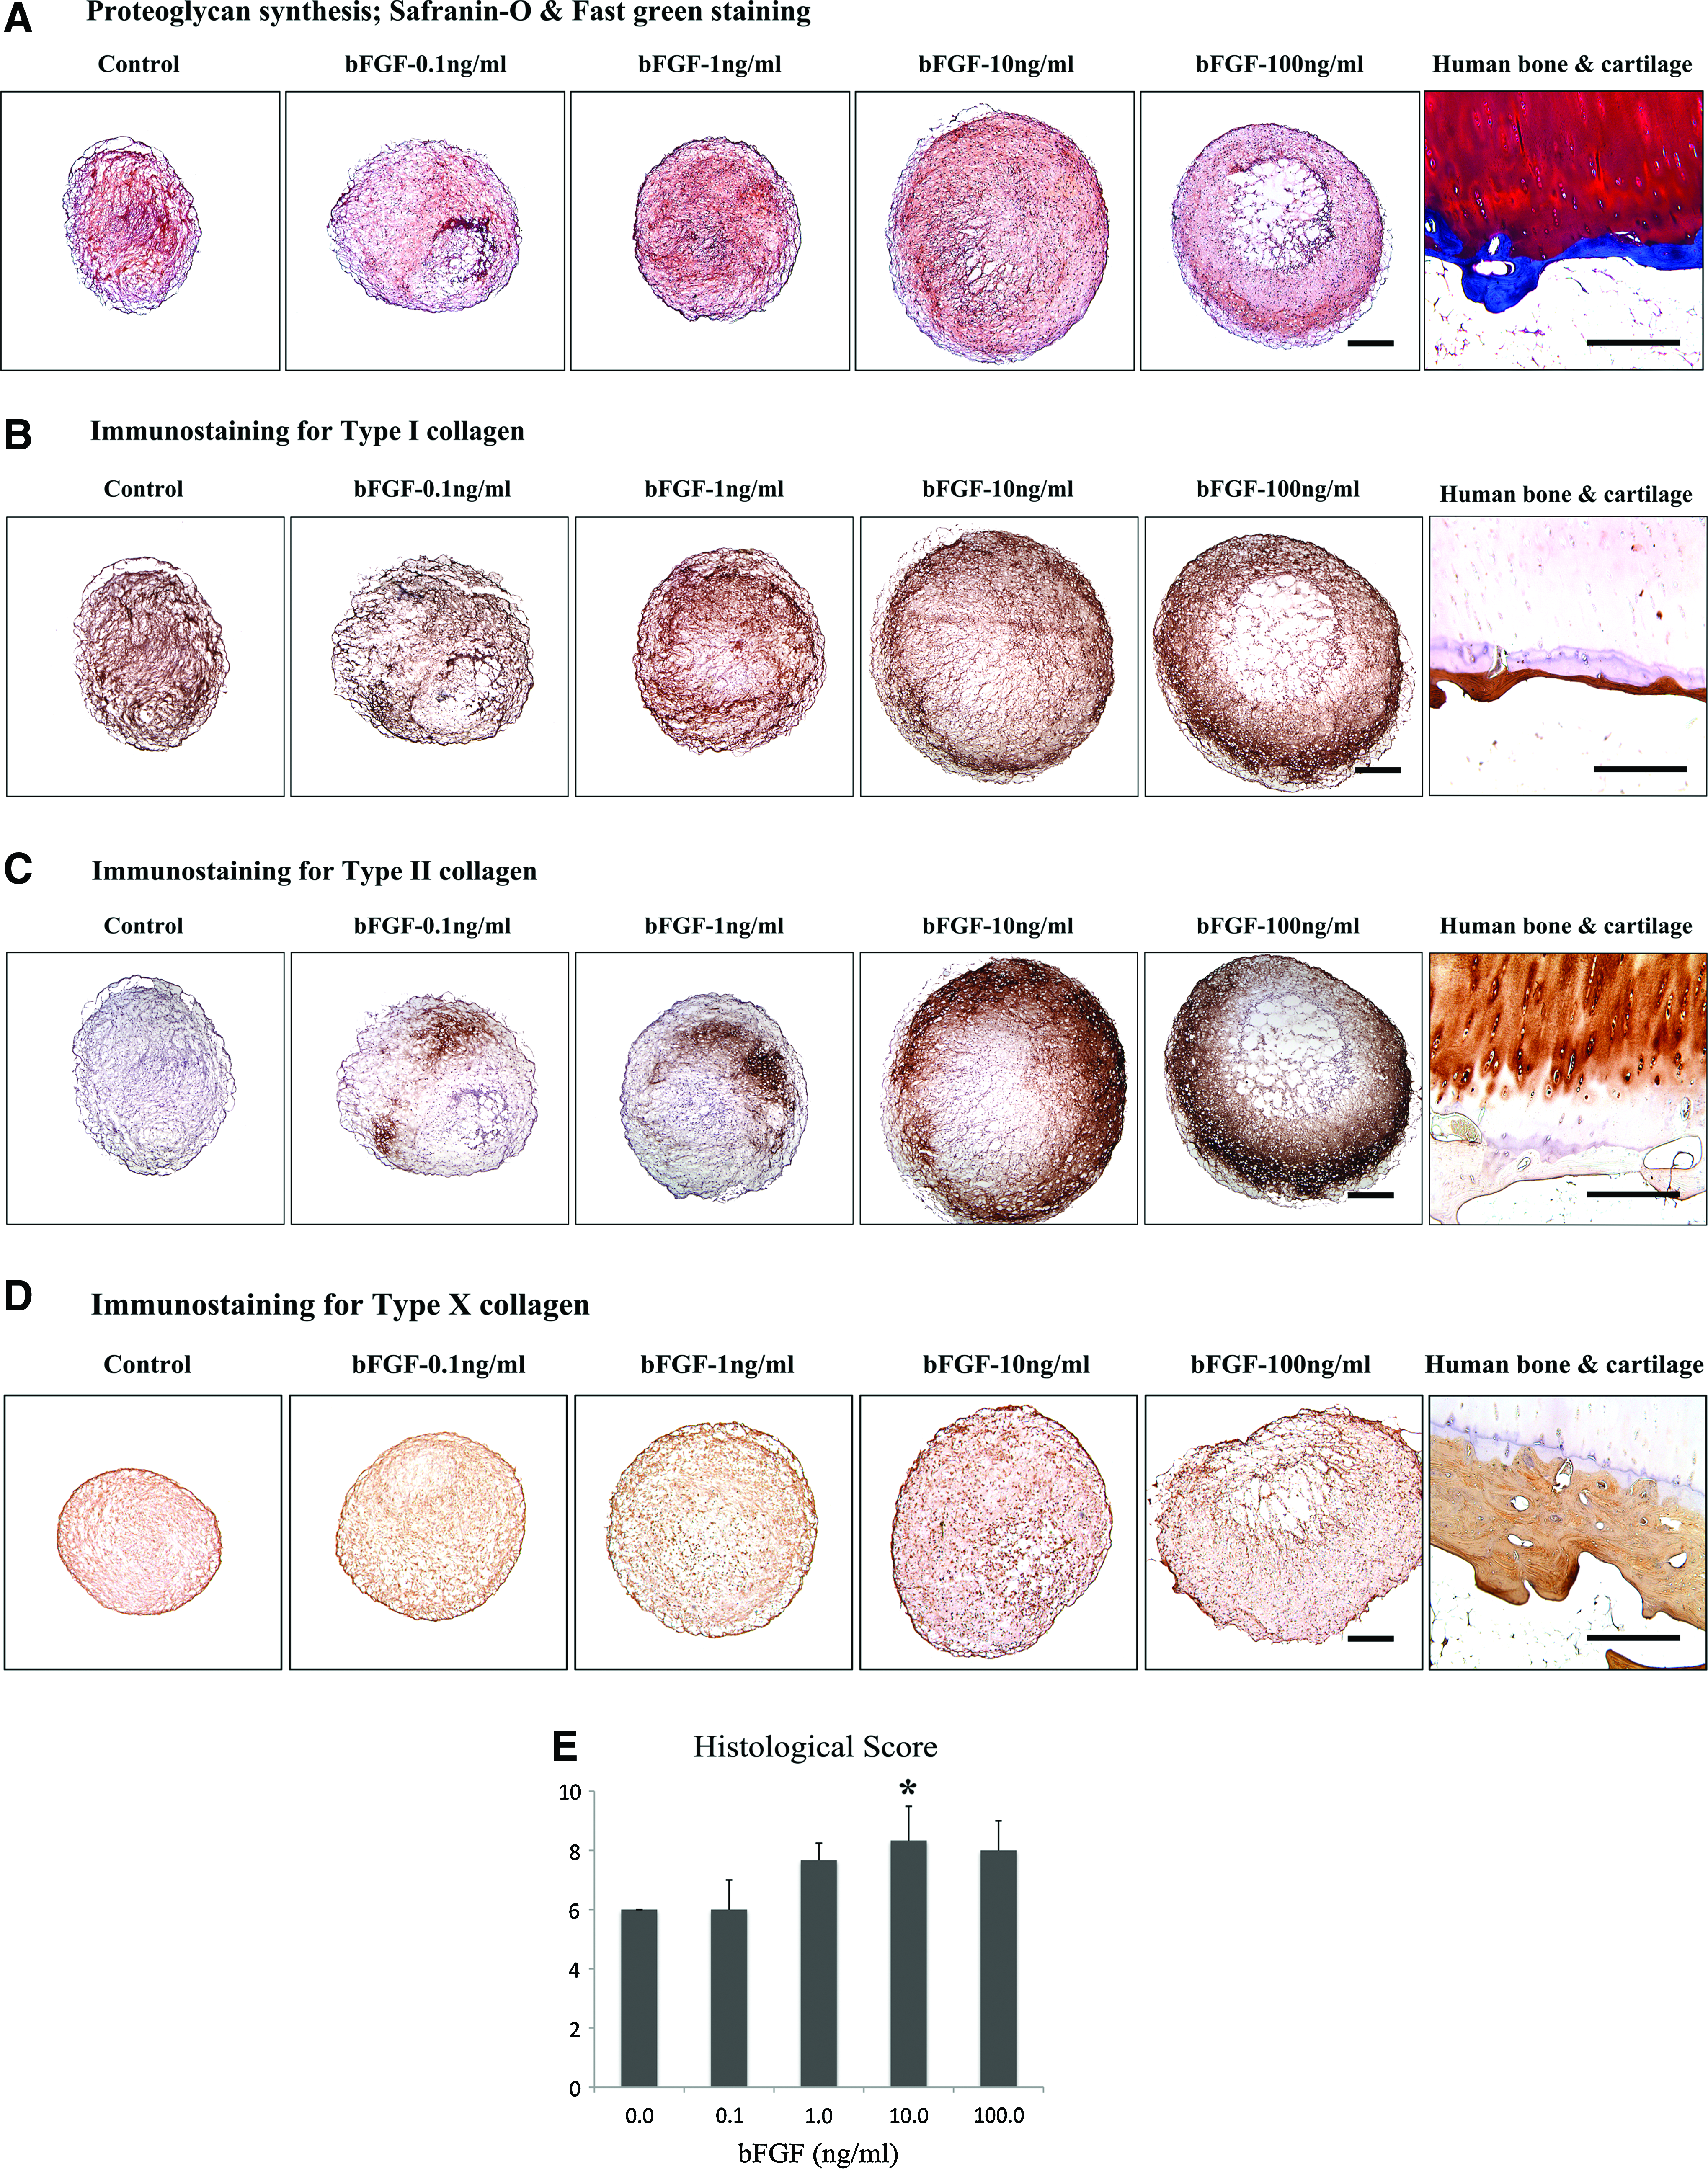
Histological analysis of pellets cultured for 3 weeks.
Quantitative real-time PCR analysis
The effects of bFGF on the gene expression of collagen type I, II, X, SOX-9, aggrecan, osteocalcin, and ALP were observed via quantitative real-time PCR analysis. Type I collagen mRNA expression was reduced, except in the case of 1 ng/mL of bFGF (Fig. 6A). Type II collagen expression was increased by almost twofold upon the administration of 1, 10, and 100 ng/mL of bFGF (Fig. 6B). Ratio between the expression levels of type II and type I collagen (type II/type I) was significantly greater in groups with 0.1, 10, and 100 ng/mL of bFGF (Fig. 6C). Type X collagen expression in pellets showed similar tendency as type II collagen, exhibiting increased expression with 1, 10, and 100 ng/mL of bFGF (Fig. 6D). ALP expression was downregulated by 10 and 100 ng/mL of bFGF treatment (Fig. 6E). The other genes (aggrecan, SOX-9, and osteocalcin) evidenced no alterations in the gene expression level as the result of bFGF treatment (Fig. 6F–H).
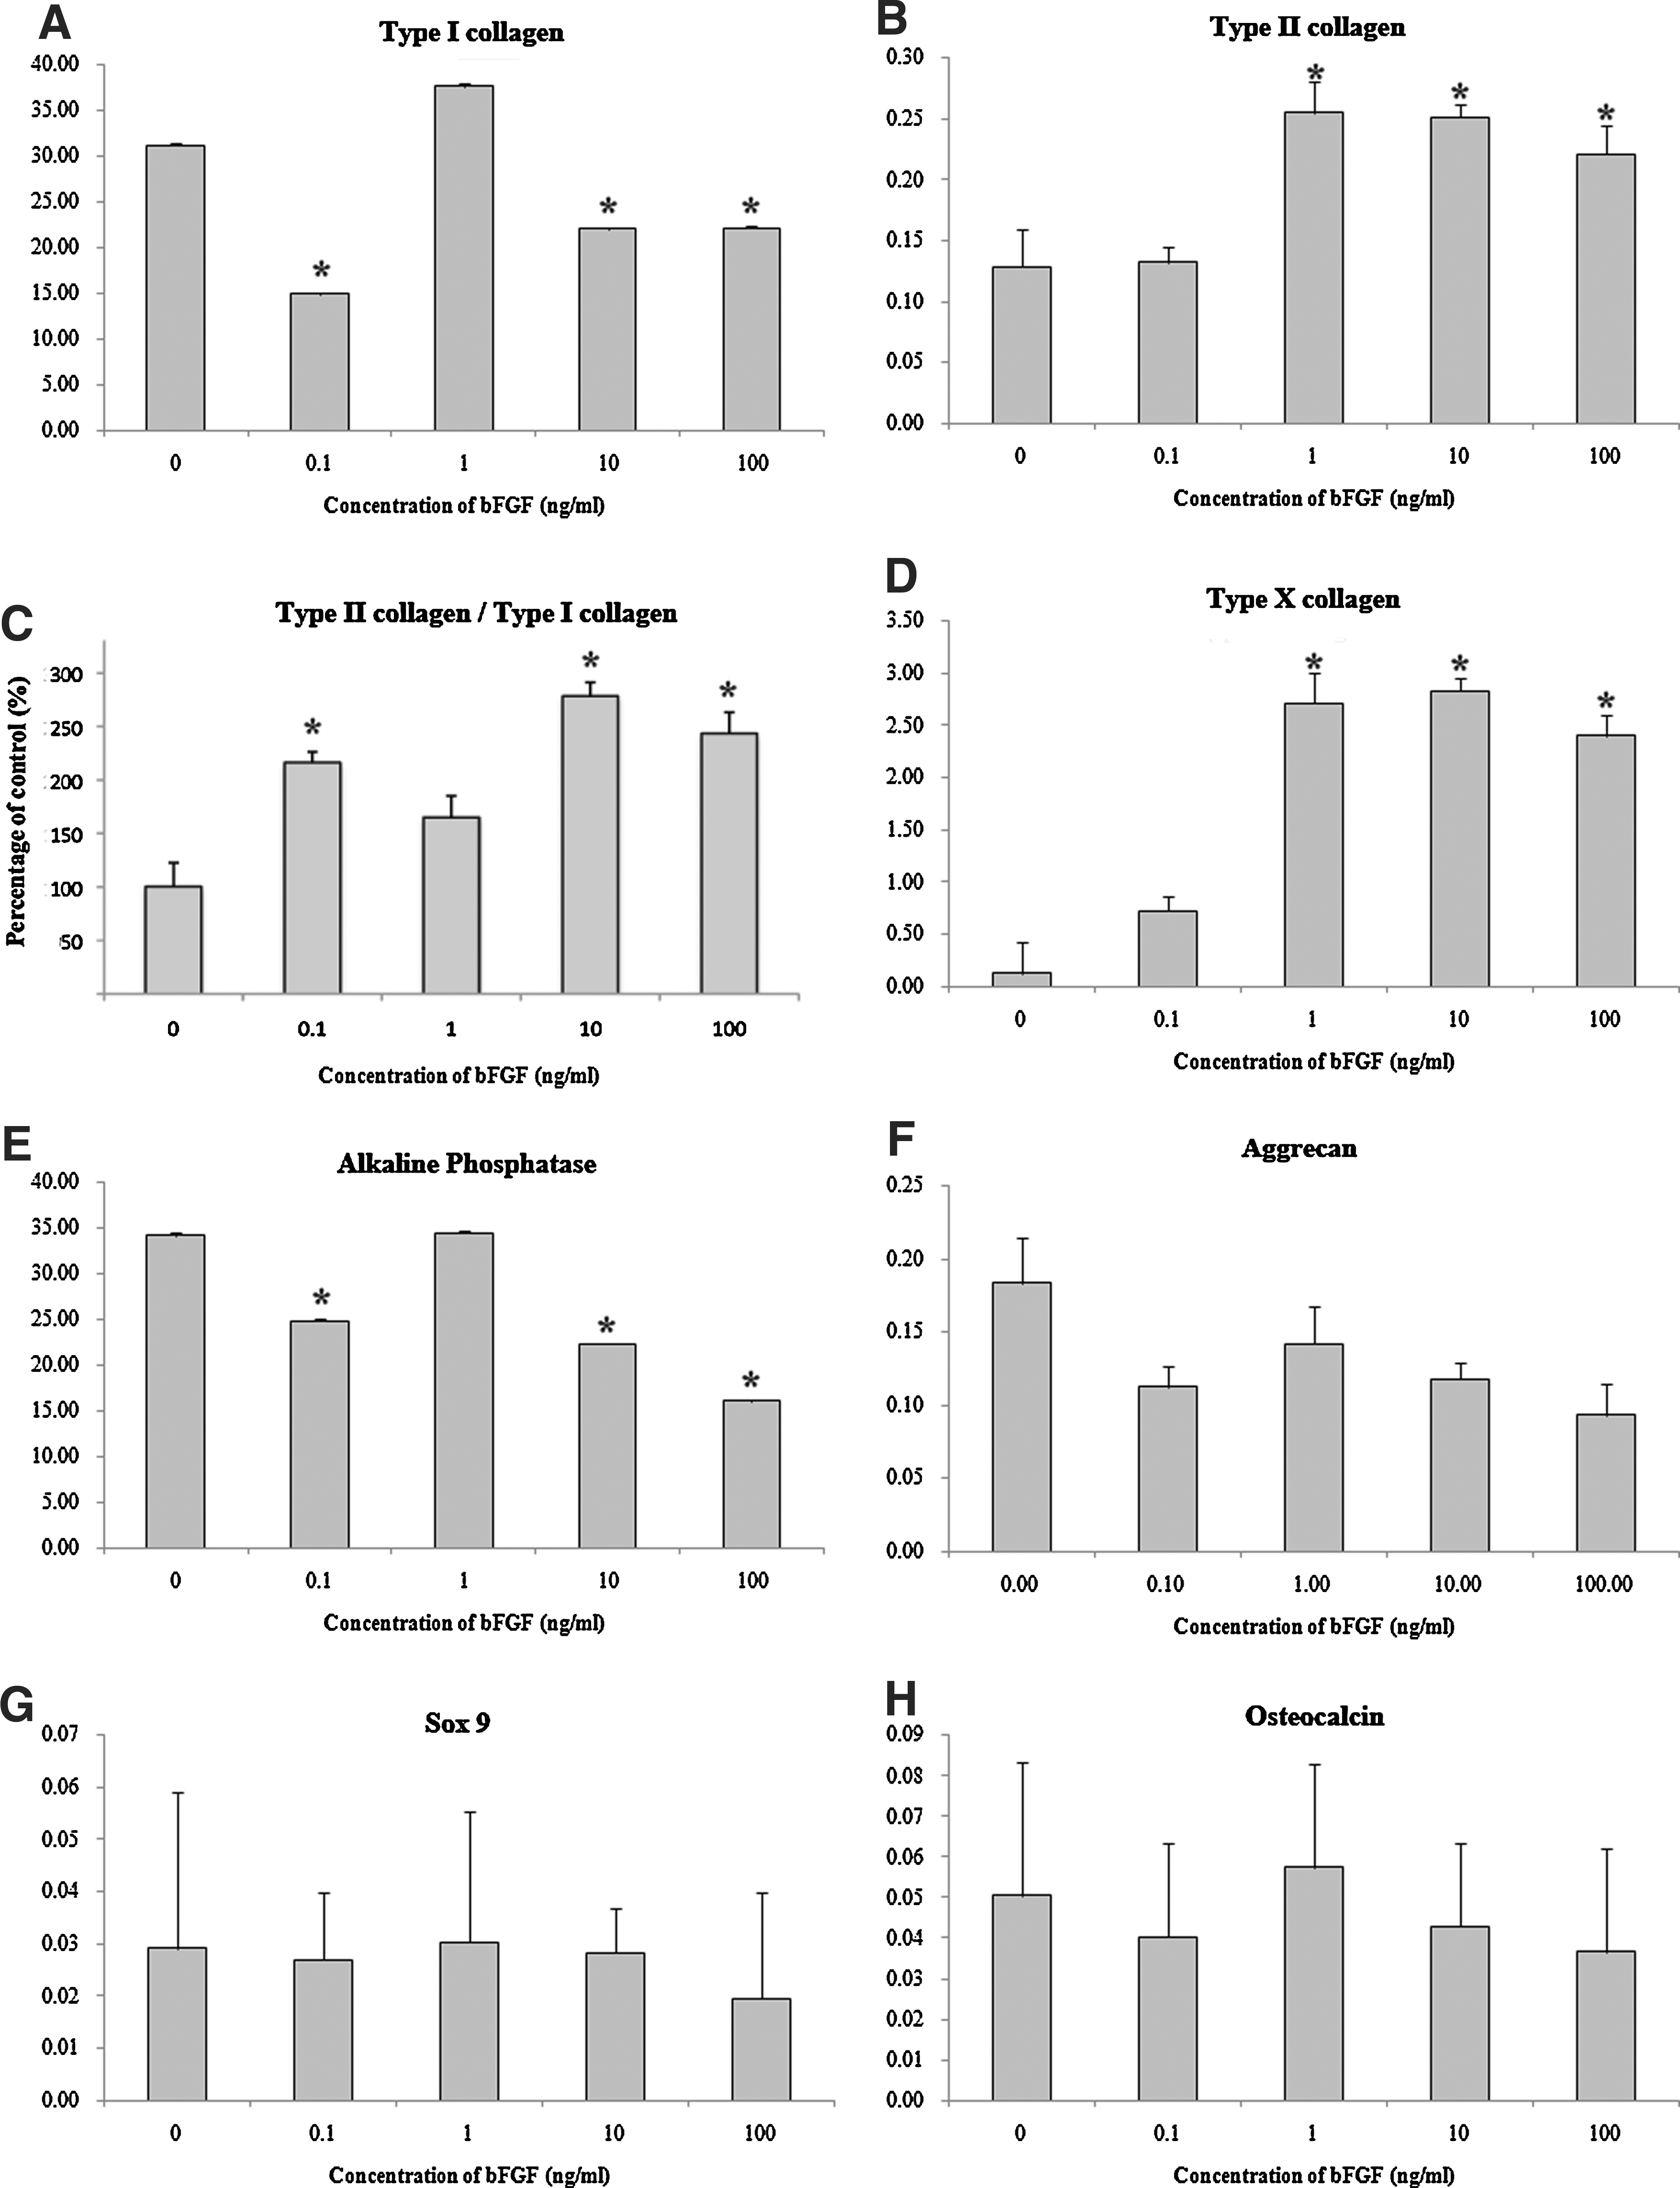
Gene expression levels in pellets. Semi-quantitative RT-PCR analyses were performed to observe the expression levels of cartilage matrix-related genes (type I collagen, type II collagen, type X collagen, SOX-9, aggrecan, alkaline phosphatase, and osteocalcin) in pellets cultured for 3 weeks. The expression of marker genes was calculated as the percentage of the expression of the housekeeping gene glyceraldehyde-3-phosphate dehydrogenase (GAPDH).
Discussion
The exposure of SDSCs to bFGF during mitotic expansion was shown to increase cell yields and augment chondrogenic potential. We have seen a similar tendency consistently with cells from a total of 20 patients. These results are in agreement with the findings of other studies in which bFGF affects the proliferation and chondrogenesis of MSCs from a variety of sources.14,15,17,19–22
The concentrations of bFGF utilized in other experiments varied and the results were also correspondingly different. It is possible the results depend on the type and the source of cells used in the study. The chondrogenic potential of MSCs from equine bone marrow increased in a bFGF-dose-dependent manner and exhibited maximal potential at a concentration of 100 ng/mL, whereas the tissue-derived mesenchymal cells from mice evidenced maximal potential at lower concentrations (10 ng/mL).19,22 Results vary with regard to human cells: some reports have utilized a bFGF concentration of 10 ng/mL to determine the maximum effect of bFGF on proliferation or chondrogenesis17,23,24; 1 ng/mL of bFGF was also efficacious in other experiments.14,15 We could find that 10 ng/mL of bFGF treatment was comparable to or better than 100 ng/mL of bFGF treatment in terms of the proliferation and chondrogenesis of SDSCs, whereas 0, 0.1, and 1 ng/mL concentrations of bFGF evidenced far less effects than the higher concentrations. Thus, 10 ng/mL of bFGF could be determined as an efficient and practical concentration to supplement the medium for optimal cell acquisition and chondrogenic effects in our study.
Morphological change demonstrated in cytoplasm was the first manifestation noticeable in SDSCs cultured with bFGF. The finding shown by actin-cytoskeleton staining is well in agreement with other reports in which actin-related proteins producing morphological characteristics of consistent spindle shape and elongated form rather than increased spread-out morphology were expressed abundantly in bFGF-treated cell surfaces and these proteins may play an important role in differentiation potential.25,26 Actin-related proteins primarily function in cell motility, migration, and cardiomyocytic differentiation, but may also have, though largely unclear, protein binding function involving molecular signaling and differentiation potential.26–28 Indeed, aged MSCs with compromised cellular function have once been demonstrated to be related with altered migratory activity associated with cytoskeleton organization and the authors assumed that this was related with regulation of ion channel affecting ROS release. 29 There is no direct evidence that increased actin filament will increase the chondrogenic potential, but this could be further investigated.
The results of FACS data analysis may implicate the possible mechanism of bFGF in the maintenance of the stemness of SDSCs by modulation of heterogeneous SDSCs to more specific mesenchymal lineages. Hematopoietic progenitor cell surface marker such as CD34 of SDSCs appeared to be reduced by bFGF treatment. Alpha-1 integrin (CD49a) was also decreased by exposure to bFGF, and those downregulations were inversely related with the differentiation ability of SDSCs. We could not find any report particularly reporting the correlation between CD49a and SDSC stemness, but beta-1 integrin blocking by antibody treatment induced morphological change of Bone marrow stromal cells (BMSCs) in one study, although the multi-lineage differentiation potential was unchanged. 30
There was a discrepancy between FGFR mRNAs and their protein expressions. An earlier study conducted to characterize multipotent MSCs from the human synovial membrane demonstrated that the cells between P3 and P10 did not express FGFR3 mRNA but did express FGFR1 and FGFR2 mRNA. 4 Discrepancy between studies may be due to cellular heterogeneity or donor variation, since there were no specific differences in harvest, isolation, and expansion procedures of SDSCs in our study. The function of bFGF regulating undifferentiated state and multi-lineage differentiation potential of stem cells was shown to be conducted by signal transduction through FGFR3 in embryonic, cancer, neural, and bone marrow stem cells in following studies.14,31–34 Self-renewal state of cortical neural stem cells was maintained by bFGF through coactivation of FGFR1 and FGFR3. 34 FGFR3 has been identified as a marker of mesenchymal precartilaginous stem cells and detected at the margins of the cartilage nodules of synovial chondromatosis.35–37 Several studies have also demonstrated that FGFR3 promoted chondrogenesis.38,39 The observed FGFR3 production in our study may indicate that the subsequent chondrogenesis of SDSCs are related with their FGFR3 in some way. However, the time of bFGF treatment was critical, as basic FGF treatment on micromass pellet culture of SDSCs suppressed chondrogenic differentiation in our previous study. 13 Basic FGF induced the cartilage degradation evidenced by MMP-13 and aggrecanase production in one study. 39
The MAPK pathway was shown to be related with the effects of bFGF. Basic FGF enhanced the expression levels of the chondrogenic SOX-9 gene in MSCs via the MAPK pathway, and all four FGFRs might be involved in this activity. 16 DNA microarray analysis revealed that the MAPK and Wnt pathways are the most crucial pathways in this phenomenon related to the increase of mitotic and chondrogenic potentiality of bone-marrow-derived MSCs by bFGF. 17 Additionally, it has been shown in several studies that MAPK signaling controls cartilage formation and maturation. Three major MAPK signaling pathways, ERK1/2, p38, and JNK pathways were shown to be involved in all aspects of the chondrogenesis program, from the embryonic through the postnatal stages of development. 40 The downstream signaling of bFGF in stem cell chondrogenesis should be studied in greater detail to elucidate the mechanism of its function.
Mixed phenotype of chondrogenic pellets is the most troubling in SDSC chondrogenesis, which is one of the limitations of this study. Even though it is evident that chondrogenesis was enhanced by bFGF, high expression level of type I collagen mRNA represents imperfect chondrogenic differentiation of SDSCs. Early hypertrophy commonly seen in stem cell chondrogenesis could not be solved either, of which mechanism requires more profound knowledge of cell biology and behavior. Recently, several authors have reported the methods to suppress the undesired effect of chondrogenesis and growth factor treatment that would potentially optimize our cartilage engineering.41–43
We demonstrated herein that bFGF exerted positive effects on the proliferation and chondrogenic differentiation activities of SDSCs. The heterogeneity of SDSCs was modulated to a more homogeneous mesenchymal lineage and actin cytoskelton changed quantitatively by bFGF. According to our results, bFGF was identified as a useful growth factor for the improved chondrogenesis of SDSCs, and supplementation of the medium with 10 ng/mL of bFGF elicited the optimal effects in terms of cell acquisition and chondrogenesis. Further, this is the first study to demonstrate the dose–response relationship between bFGF treatment and the proliferation and chondrogenesis behavior of human SDSCs. The results should be carefully translated when considering that bFGF supplementation during pellet culture period had negative role on chondrogenesis in our previous study. 13 The results pertain to possible MSC therapy in cartilage repair. Appropriate number of SDSCs with more chondrogenic potential may lead to efficient differentiation, thus improving the quality of cartilage regeneration. The results of this study may play a role in the study elucidating the underlying mechanism of bFGF function on chondrogenesis, with emphasis specifically on determining how the SDSCs could be afforded more chondrogenic potential, or whether specific subpopulation is selected.
Footnotes
Acknowledgments
This study was supported by a grant from the Innovative Research Institute for Cell Therapy, Republic of Korea (No: A062260), and by a grant from the SNUH Research Fund (No: 04-2006-018-0).
Disclosure Statement
No competing financial interests exist.