
Abstract
Nanofiber scaffolds, produced by the electrospinning technique, have gained widespread attention in tissue engineering due to their morphological similarities to the native extracellular matrix. For cartilage repair, studies have examined their feasibility; however these studies have been limited, excluding the influence of other scaffold design features. This study evaluated the effect of scaffold design, specifically examining a range of nano to micron-sized fibers and resulting pore size and mechanical properties, on human mesenchymal stem cells (MSCs) derived from the adult bone marrow during chondrogenesis. MSC differentiation was examined on these scaffolds with an emphasis on temporal gene expression of chondrogenic markers and the pluripotent gene, Sox2, which has yet to be explored for MSCs during chondrogenesis and in combination with tissue engineering scaffolds. Chondrogenic markers of aggrecan, chondroadherin, sox9, and collagen type II were highest for cells on micron-sized fibers (5 and 9 μm) with pore sizes of 27 and 29 μm, respectively, in comparison to cells on nano-sized fibers (300 nm and 600 to 1400 nm) having pore sizes of 2 and 3 μm, respectively. Undifferentiated MSCs expressed high levels of the Sox2 gene but displayed negligible levels on all scaffolds with or without the presence of inductive factors, suggesting that the physical features of the scaffold play an important role in differentiation. Micron-sized fibers with large pore structures and mechanical properties comparable to the cartilage ECM enhanced chondrogenesis, demonstrating architectural features as well as mechanical properties of electrospun fibrous scaffolds enhance differentiation.
Introduction
In the body, adult stem cells are often localized to specific chemically and topologically complex microenvironments, or the so-called niches. Increasing experimental evidence supports the notion that stem cells can adjust their properties according to their surroundings, and select specific lineages according to the cues they receive from their niche.7,8 During cartilage development, one of the earliest events is precartilage mesenchymal cell aggregation and condensation resulting from cell–cell interaction, which is mediated by both cell–cell and cell–matrix adhesion (fibronectin, proteoglycans, hyaluronic acid, and collagens). 9 Type I collagen being the predominant matrix protein present in the early stages of development is later transformed to type II collagen by increased cell synthesis during differentiation. 10 Gaining considerable interest in tissue engineering for cartilage applications is the approach of combining cells with a biomaterial scaffold that mimics the architectural characteristics of the extracellular matrix, specifically the fibrous structure of collagen.11,12 Scaffolds consisting of random and/or oriented nanofibers, prepared using the electrospinning technique, have shown promise for many tissue engineering applications. Nanoscale alterations in scaffold topography elicit diverse cell behavior, ranging from changes in cell adhesion, motility, activation of tyrosine kinases, and modulation of intracellular signaling pathways leading to changes in gene expression. 13 However, studies examining MSC chondrogenic differentiation on nanofibrous scaffolds are limited.12,14–16 Comparative studies of MSC chondrogenesis on fibrous scaffolds having a wide range of fiber diameters that also account for changes in other scaffold design characteristics have yet to be explored. Pore size/interfiber spacing and mechanical properties of these fibrous scaffolds are critical determinants of adequate cartilage tissue formation and integration into the surrounding host cartilage in vivo. 17
This study evaluated the effect of scaffold design, specifically examining fiber size and resulting pore size and mechanical properties, on MSC chondrogenesis. Poly (L-lactide) (PLLA) scaffolds with average fiber diameters in the nano to micron range were used. PLLA was chosen since it is a routinely investigated biomaterial and degrades over a period of 2 years, 18 providing a stable scaffold structure for long-term cell culture experiments 19 as well as in vivo applications. 18 In addition, slow-degrading biomaterials can provide long-term mechanical support to the defect site which, in turn, may be important for the maintenance of the chondrocyte phenotype for severe osteoarthritic cases.17,20 MSC differentiation along the chondrogenic lineage was examined on these scaffolds with an emphasis on temporal gene expression of chondrogenic markers and the pluripotent gene, Sox2, which has yet to be explored for MSCs during chondrogenesis and on tissue engineering scaffolds.
Materials and Methods
Materials
PLLA (RESOMER® L207S) with an inherent viscosity of 1.5–2.0 dL/g was purchased from Boehringer Ingelheim, Inc. 1,1,1,3,3,3-Hexafluoro-2-propanol, chloroform, ethanol and dichloromethane, dexamethasone, sodium pyruvate, L-proline, guanidine hydrochloride, and Trizma® hydrochloride were obtained from Sigma-Aldrich, Inc. Dulbecco's modified Eagle's medium, low glucose (DMEM–low glucose), DMEM, high glucose with no phenol red (DMEM–high glucose), Dulbecco's phosphate-buffered saline (PBS), L-glutamine, penicillin–streptomycin, antibiotic–antimycotic, Quant-iT PicoGreen® dsDNA Reagent, nuclear DNA stain (4',6-diamidino-2-phenylindole), and actin cystoskeleton stain (Alexa Fluor 488 phalloidin) were purchased from Invitrogen, Inc. Fetal bovine serum was obtained from Hyclone, Inc. Transforming growth factor-beta3 (TGF-β3) was obtained from Lonza Inc. L-ascorbic acid phosphate magnesium salt n-hydrate was obtained from Wako Chemicals USA, Inc., and ITS+ Premix was obtained from BD Biosciences, Inc. The antibodies, rabbit anti-human collagen type II polyclonal antibody, goat anti-rabbit IgG, rhodamine conjugate, and anti-focal adhesion kinase (FAK), were obtained from Millipore, Inc. Bovine serum albumim was obtained from Fisher Scientific. Glycosaminoglycan (GAG), Proteoglycan, and Blyscan Kit were obtained from Biocolor, Ltd. One-Step QuantiTect SYBR Green RT-PCR Kit, QIA Shredder, RNeasy Micro Kit, and Quantitect Primer Assays were purchased from Qiagen, Inc.
Scaffold fabrication
All polymer solutions were prepared at room temperature for electrospinning. PLLA was dissolved in 10 wt.% 1,1,1,3,3,3-hexafluoro-2-propanol to create nanofibers. PLLA was dissolved in 10 wt.% chloroform, 15 wt.% dichloromethane, or 15 wt.% chloroform to achieve small to large micron-sized fiber dimensions, respectively. A homogeneous solution of the polymer to be electrospun was prepared in glassware by slow agitation with a magnetic stirrer. The agitation was slow to avoid mechanical degradation of the polymer chains. Electrospinning technique was used to fabricate PLLA at four distinct fiber diameters (Table 1). The electrospinning setup had a 10 mL syringe fitted with a needle (12–22 gauge), mounted on a Harvard Syringe Pump Model 901 (Harvard Apparatus). The polymer solution to be electrospun was filled in the syringe and delivered at a constant flow rate of 0.05–0.1 mL/min. The positive output lead of a high-voltage power supply (Gamma High Voltage Power Supply ES30P; Gamma High Voltage Research, Inc.) was attached to the needle. An electrically grounded stainless steel plate of 25 × 30 cm dimension was used as the collector. The applied voltage and the collector to needle distance were 20 kV and 30 cm, respectively. The electrospinning process was carried out in an environmental chamber at room temperature with the relative humidity below 15%. The fibers were collected from the plate when they attained a thickness of ∼1 mm.
p < 0.05, statistically different from all other groups.
p < 0.05, statistically different from PLLA1.
p < 0.05, statistically different from PLLA1 and PLLA2.
PLLA, poly (L-lactide).
Fiber morphology and dimension
The morphology and fiber dimensions of the electrospun mats were examined using scanning electron microscopy (SEM; LEO 1530 Gemini). Samples were sputter coated with carbon (Bal-TEC 020 HR Sputtering Coater). An accelerating voltage of 8–10 kV and a working distance of 8 to 12 mm were used for viewing the samples. The average fiber size of electrospun mats was determined from the SEM images using Image J software (National Institutes of Health). Diameters of 80 fibers, 16 each from five samples per group, were measured.
Scaffold pore size and porosity
The pore size of electrospun mats was determined using capillary flow analysis (1100 AEX Capillary Flow Porometer; Porous Materials, Inc., Analytical Services Division). 21 The porosity of the samples was calculated using the following formula, as modified from previously published protocols 21 : Porosity (%) = (1 − Dmat/Draw) × 100, where the density of the electrospun mat (Dmat) was calculated by measuring the diameter and thickness of the mat to determine the volume and the mass of the mat using an analytical balance. Dmat was then determined by dividing the mass of the mat by its volume. Draw is the density of the raw material, which is 1.25 g/cm3.
Mechanical testing
The mechanical properties of electrospun mats were determined using an Instron Model 3342. The specimens were cut into rectangular strips having the dimension of 12 × 30 mm. The strips were cut at angles of 0°, 45°, and 90° to evaluate the changes in mechanical properties at different angles for determining the anisotropic mechanical properties. The samples were immersed in PBS at 37°C for 24 h before the test. Specimens were then tested in tension with a gauge length of 10 mm and a cross-head speed of 10 mm/min. Mechanical properties of elastic moduli were determined. Five samples per angle per group were tested.
MSC isolation and characterization
Human MSCs were isolated from commercially obtained whole bone marrow aspirates (Lonza Biosciences, Inc.) collected from the superior iliac crest of the pelvis of male donors of ages ranging from 18 to 32. The isolation and culture-expansion of MSCs have been described in detail by Haynesworth et al. 22 MSCs were cultured in control medium: DMEM containing 10% fetal bovine serum and 1% antibiotic–antimycotic, at 37°C, 5% CO2 in a humidified incubator. Colony formation was monitored for up to a 14–17-day period. At near confluency, MSCs were detached from the tissue culture plate with 0.25% Trypsin-EDTA and resuspended in control medium. The cells were subcultured up to a maximum of two passages and then cyropreserved until use. MSCs were characterized for expression of mesenchymal surface antigens CD29, CD44, CD73, CD90, and CD105 and a lack of hematopoietic antigens, CD14, CD34, and CD45, as determined by immunofluorescent staining and flow cytometry.23,24 Their multipotential ability was also confirmed by differentiation into osteoblasts, chondrocytes, and adipocytes.
Chondrogenesis
Mats were sterilized by immersing in 100% ethanol for 20 min followed by washing three times with PBS. Six-mm disc mats were used for biochemical analyses and 15.6-mm disc mats were used for gene expression and immunohistochemical analyses. They were placed in 96-well or 24-well polypropylene culture plates, respectively. MSCs were seeded onto the discs at 1 × 10³ cells/cm2, which is a low seeding density to examine cell–substrate interaction. 25 Since the standard experimental model for MSC chondrogenesis is a three-dimensional culture, 26 tissue culture plastic was not examined as a control surface since it does not support chondrogenesis. The MSC seeded mats were maintained in three types of media: DMEM–high glucose supplemented with 1 × 10⁻⁷ M dexamethasone, 0.1 mM ascorbic acid-2-phosphate, 1% ITS+ premix, 1 mM sodium pyruvate, 0.35 mM L-proline, 4 mM L-Glutamine, and 1% antibiotic-antimycotic (CCM−), CCM− supplemented with the 10 ng/mL TGF-β3 (chondrogenic induction media, 4 CCM+), or Control media, which is standard growth media. CCM− and Control medium were serum-free and serum-containing negative controls, respectively. MSC-seeded PLLA mats were maintained at 37°C, in a humidified atmosphere of 5% CO2 for up to 28 days.
Cell morphology and immunohistochemical staining
The samples were harvested on day 28, washed with PBS, and fixed in 4% paraformaldehyde at room temperature for 20 min. The samples were then permeabilized with 0.1% Triton-X at room temperature for 5 min. Nonspecific antibody binding was blocked by treating the samples with 10% bovine serum albumim. The samples were then incubated with Rabbit anti-human Collagen type II or anti-FAK polyclonal antibody for an hour at room temperature followed by a series of PBS washes. Samples were then incubated for 1 hour with the secondary antibody, goat anti-rabbit IgG conjugated with Rhodamine, and phalloidin for actin filament observation. The nucleus was stained with 4′,6-diamidino-2-phenylindole. All samples were viewed using a confocal fluorescence microscope (Eclipse C1si; Nikon).
GAG assay
Samples were harvested on day 28 for biochemical analyses. They were washed with PBS and stored at −80°C for 2 days. Then, they were bio-pulverized using a homogenizer and digested with 3M Guanidine hydrochloride buffer (Guanidine hydrochloride dissolved in TRIZMA) hydrochloride overnight at 4°C. The lysed extract was used for sulfated GAG and normalized to cell number. Sulfated GAG was measured using the Glycosaminoglycan Proteoglycan Blyscan Kit using chondroitin sulfate as the standard according to the manufacturer's protocol. Cell number was determined using the Quant-iT PicoGreen dsDNA Reagent using a modification to the manufacturer's protocol. 25 Standards of known cell number were prepared to generate a standard curve, which was used for calculating the cell number based on fluorescent intensity.
Gene expression
Quantitative reverse transcriptase (RT)-polymerase chain reaction (PCR) analysis was performed with the One Step QuantiTect SYBR Green RT-PCR Kit using the MX4000 detection system (Stratagene), according to the manufacturers' instructions. Relative gene expression for pluripotent transcription factor, Sox2, chondrogenic markers (aggrecan, collagen type I, collagen type IIα1, chondroadherin, and Sox9), and FAK as an indicator of cell–substrate interaction were analyzed at days 1, 14, and 28. Sox2 was also analyzed for MSCs at day 0, before cell seeding. Total RNA was isolated from samples using the RNeasy Mini Kit including the homogenization (QIA Shredder) and DNA digestion step (RNase Free DNase Set). The reverse transcription step ran for 30 min at 50°C, followed by PCR activation for 15 min at 95°C. Forty amplification cycles were run, consisting of 15 s denaturation at 94°C, 30 s of annealing at 55°C, and 30 s of extension at 72°C. For each reaction, a melting curve analysis of the RT-PCR product was included. Samples were assayed in triplicate and the values were normalized to the relative amounts of the housekeeping gene RPLPO (ribosomal protein, large, PO) according to Muller et al. 27
Statistical analyses
For biochemical analyses, data were analyzed for n of 4 per condition. For real-time RT-PCR analysis, a sample size of n of 3 was used. All studies were performed twice per MSC donor. Three MSC donors were used. Analysis of variance and post hoc Tukey tests were used to determine statistical differences at p < 0.05.
Results
Fiber morphology and dimensions
The fibers had a uniform cylindrical appearance and were arranged randomly as a nonwoven mat (Fig. 1). The average fiber diameters are listed in Table 1. Each PLLA mat had statistically distinct fiber diameters going from the smallest fiber diameters, PLLA1, of 290 nm to the largest fiber diameters, PLLA4, of 9 μm.
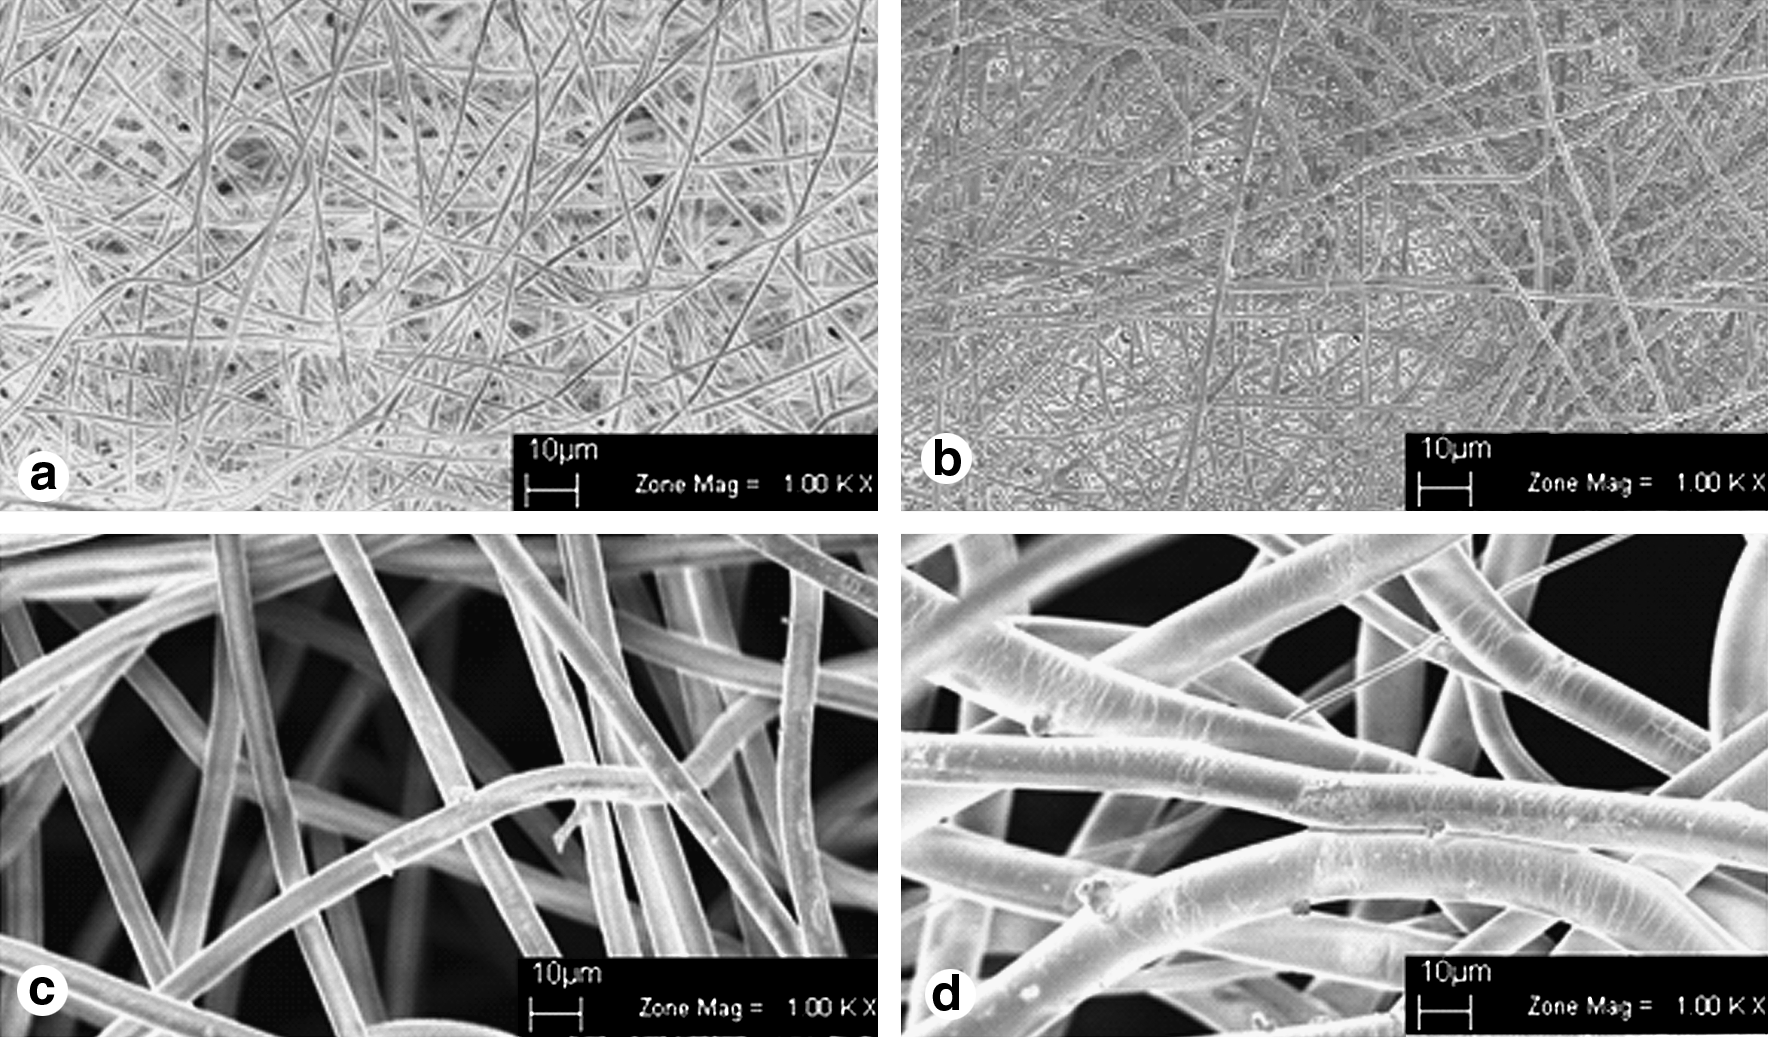
Scanning electron micrographs of
Pore size and porosity
PLLA1 had the lowest porosity compared with all other mats as shown in Table 1. PLLA1 and PLLA2 had the smallest mean pore diameters (Table 1). Mean pore diameters of PLLA3 and PLLA4 were ∼10-fold larger than PLLA1 and PLLA2. However, the pore size for PLLA3 was only statistically greater than PLLA1 (p < 0.05) due to the large variance in pore size range. The pore size for PLLA4 was statistically greater than PLLA1 and PLLA2. (p < 0.05).
Mechanical testing
PLLA3 had the lowest elastic moduli amongst all mats for all angles, as shown in Figure 2. Statistical differences were detected for PLLA1 between angles 0 and 90, PLLA2 for all angles, and PLLA4 between 0 and 90 and between 45 and 90 (p < 0.05). No differences between angles were detected for PLLA3.
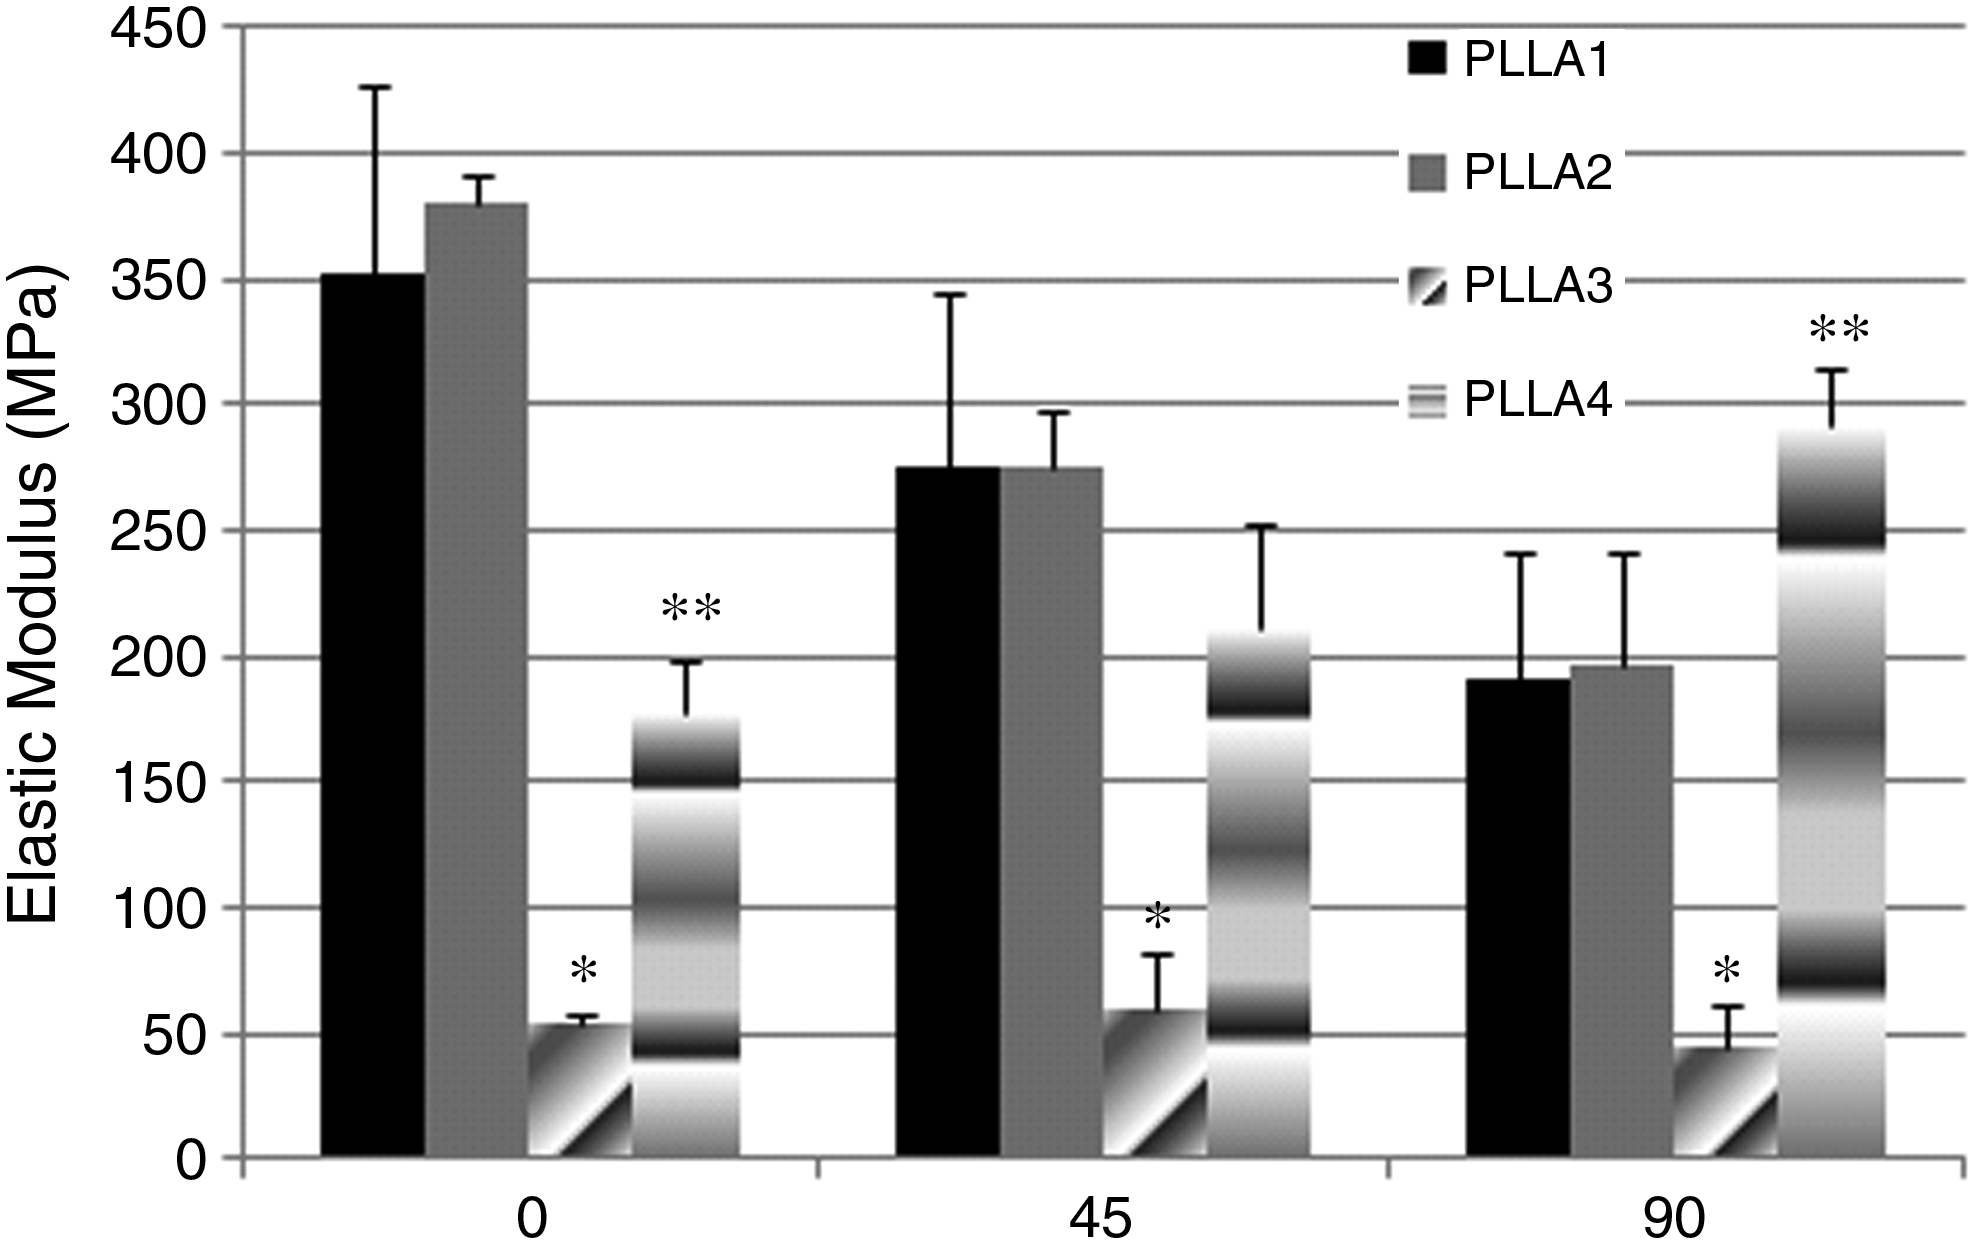
Elastic moduli of PLLA scaffolds tested in tension at different angles. Values are mean ± standard deviation. *p < 0.05, PLLA3 is statistically different from all other groups. **p < 0.05, PLLA4 is statistically different from all other groups.
Cell morphology and immunohistochemistry
MSCs formed aggregates on PLLA3 and PLLA4 in CCM+ media as compared with the spread morphology on PLLA1 and PLLA2 (Figs. 3 and 4). Cells on PLLA1 and PLLA2 scaffolds were able to spread across multiple fibers, whereas cells on PLLA3 and PLLA4 either spread along a single fiber in control and CCM− medium or formed aggregates within the pore space in CCM+ media (Fig. 4). The cells on PLLA3 and PLLA4 in CCM+ also had less discrete actin filament organization as compared with cells on the other scaffolds and in other media conditions. FAK staining was detected for cells on all scaffolds in all media conditions (Fig. 3). FAK clustering was more apparent for cells in CCM+ media where it appeared to be throughout the cell body. Collagen II expression was detected for cells on the scaffolds in CCM+ only (Fig. 4). The staining appeared to be more pronounced for cells on PLLA3 and PLLA4 and negligible for cells on PLLA1 and PLLA2.

Confocal microscopy images of cells seeded onto PLLA1–4 for 28 days in control media, CCM+ or CCM−. Immunofluorescent staining for FAK, actin filaments, and nucleus are shown, 40× magnification, Scale bar: 50 μm. Color images available online at www.liebertonline.com/ten.
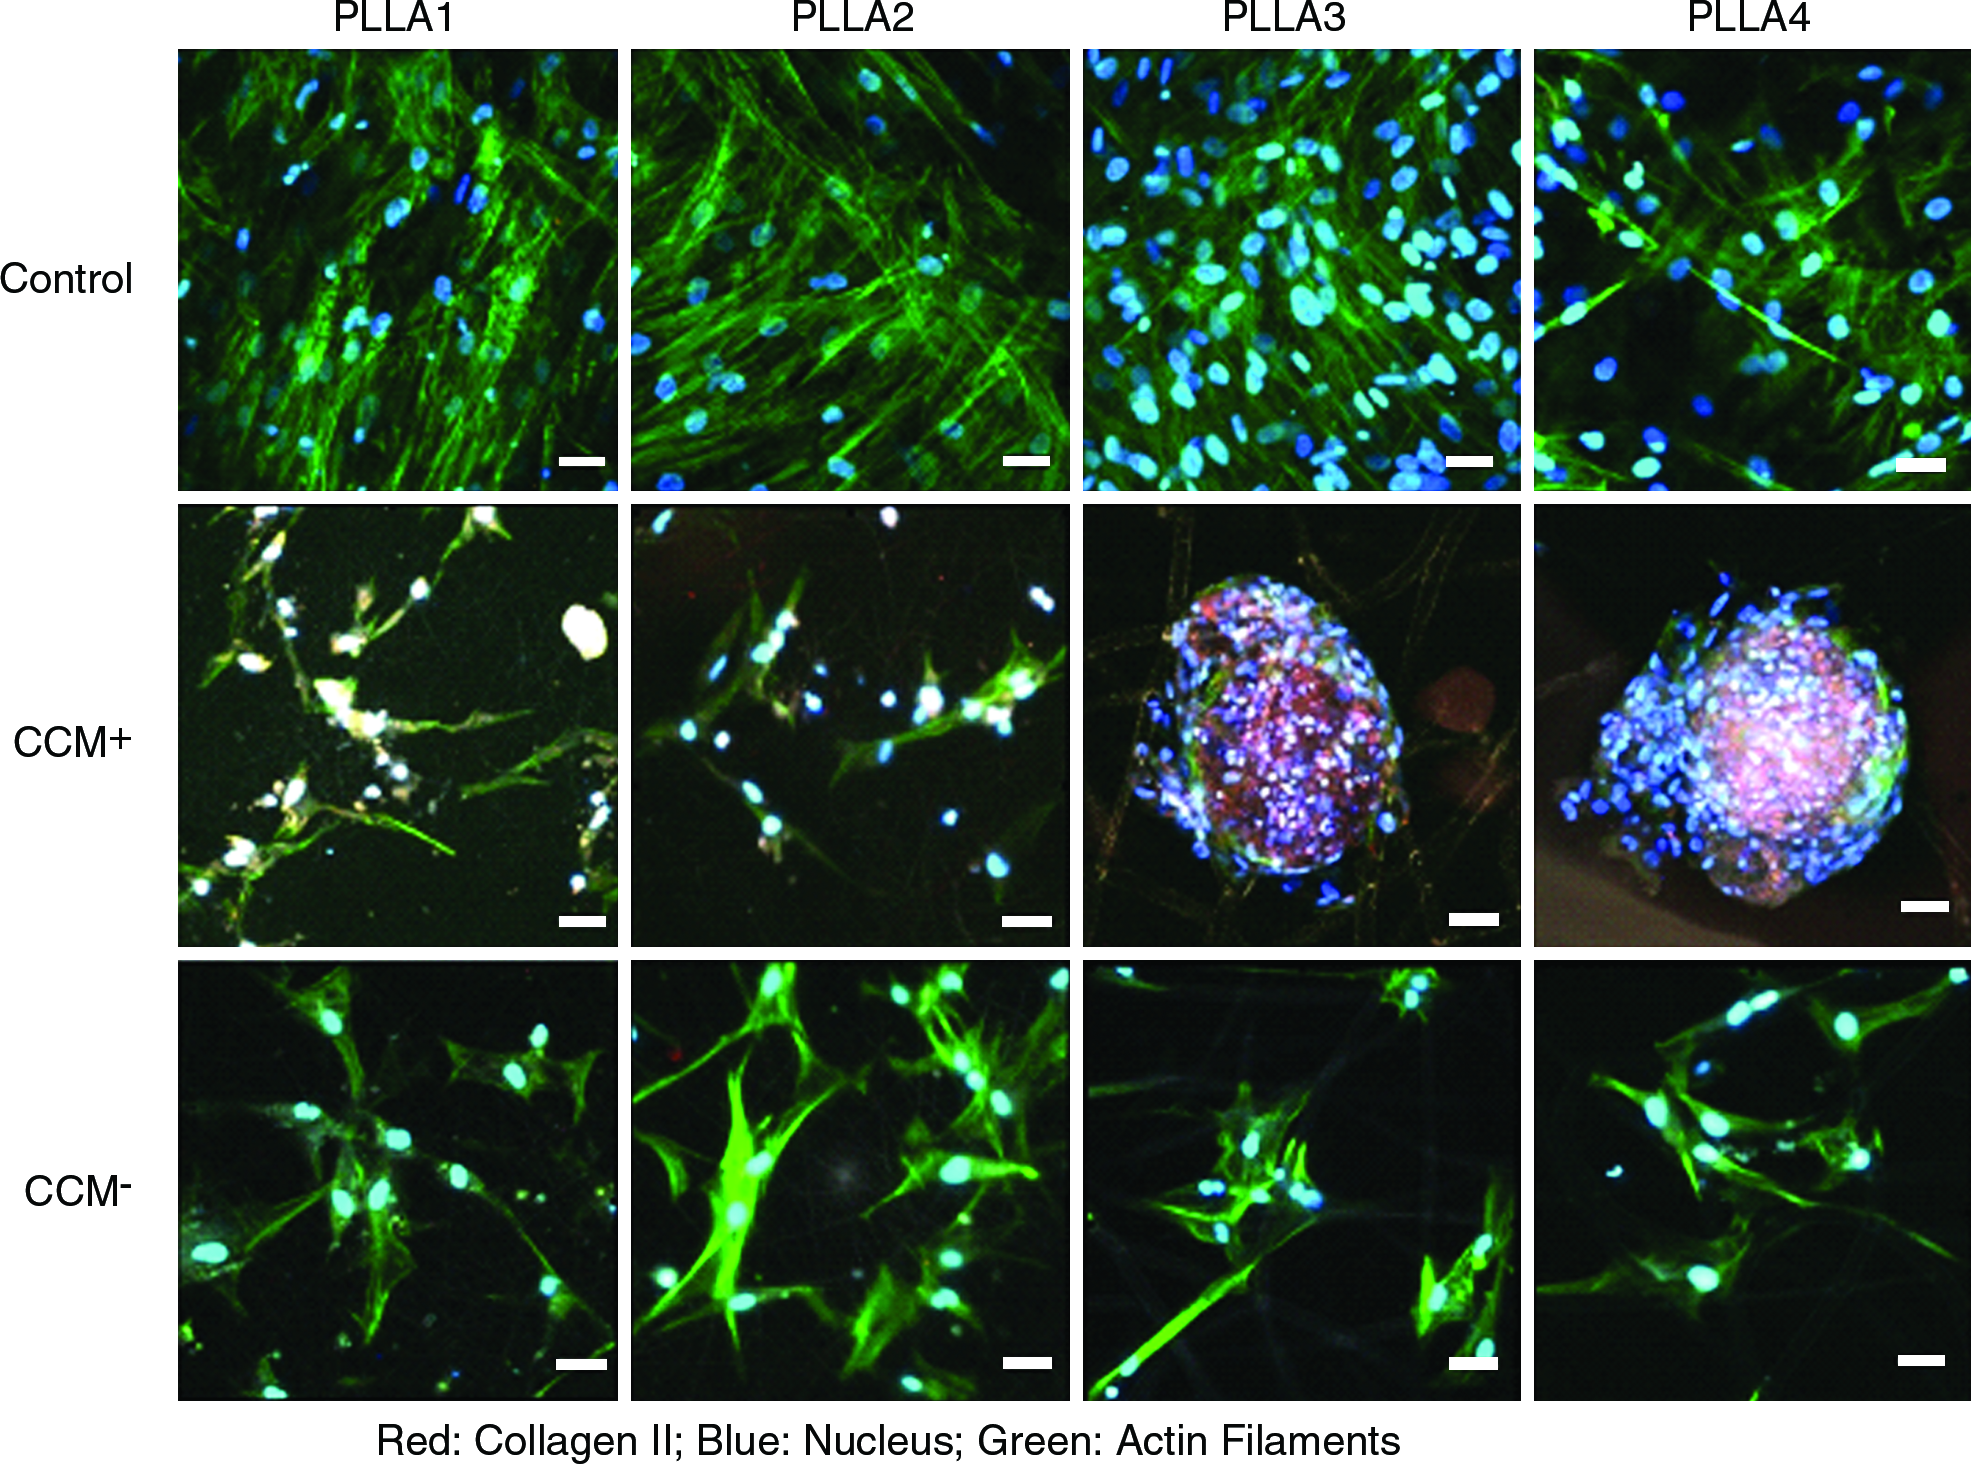
Confocal microscopy images of cells seeded onto PLLA1-4 for 28 days in control media, CCM+ or CCM−. Immunofluorescent staining for Type II collagen, actin filaments, and nucleus are shown. Fibers of the scaffolds appear gray, 40× magnification, Scale bar: 50 μm. Color images available online at www.liebertonline.com/ten.
GAG production
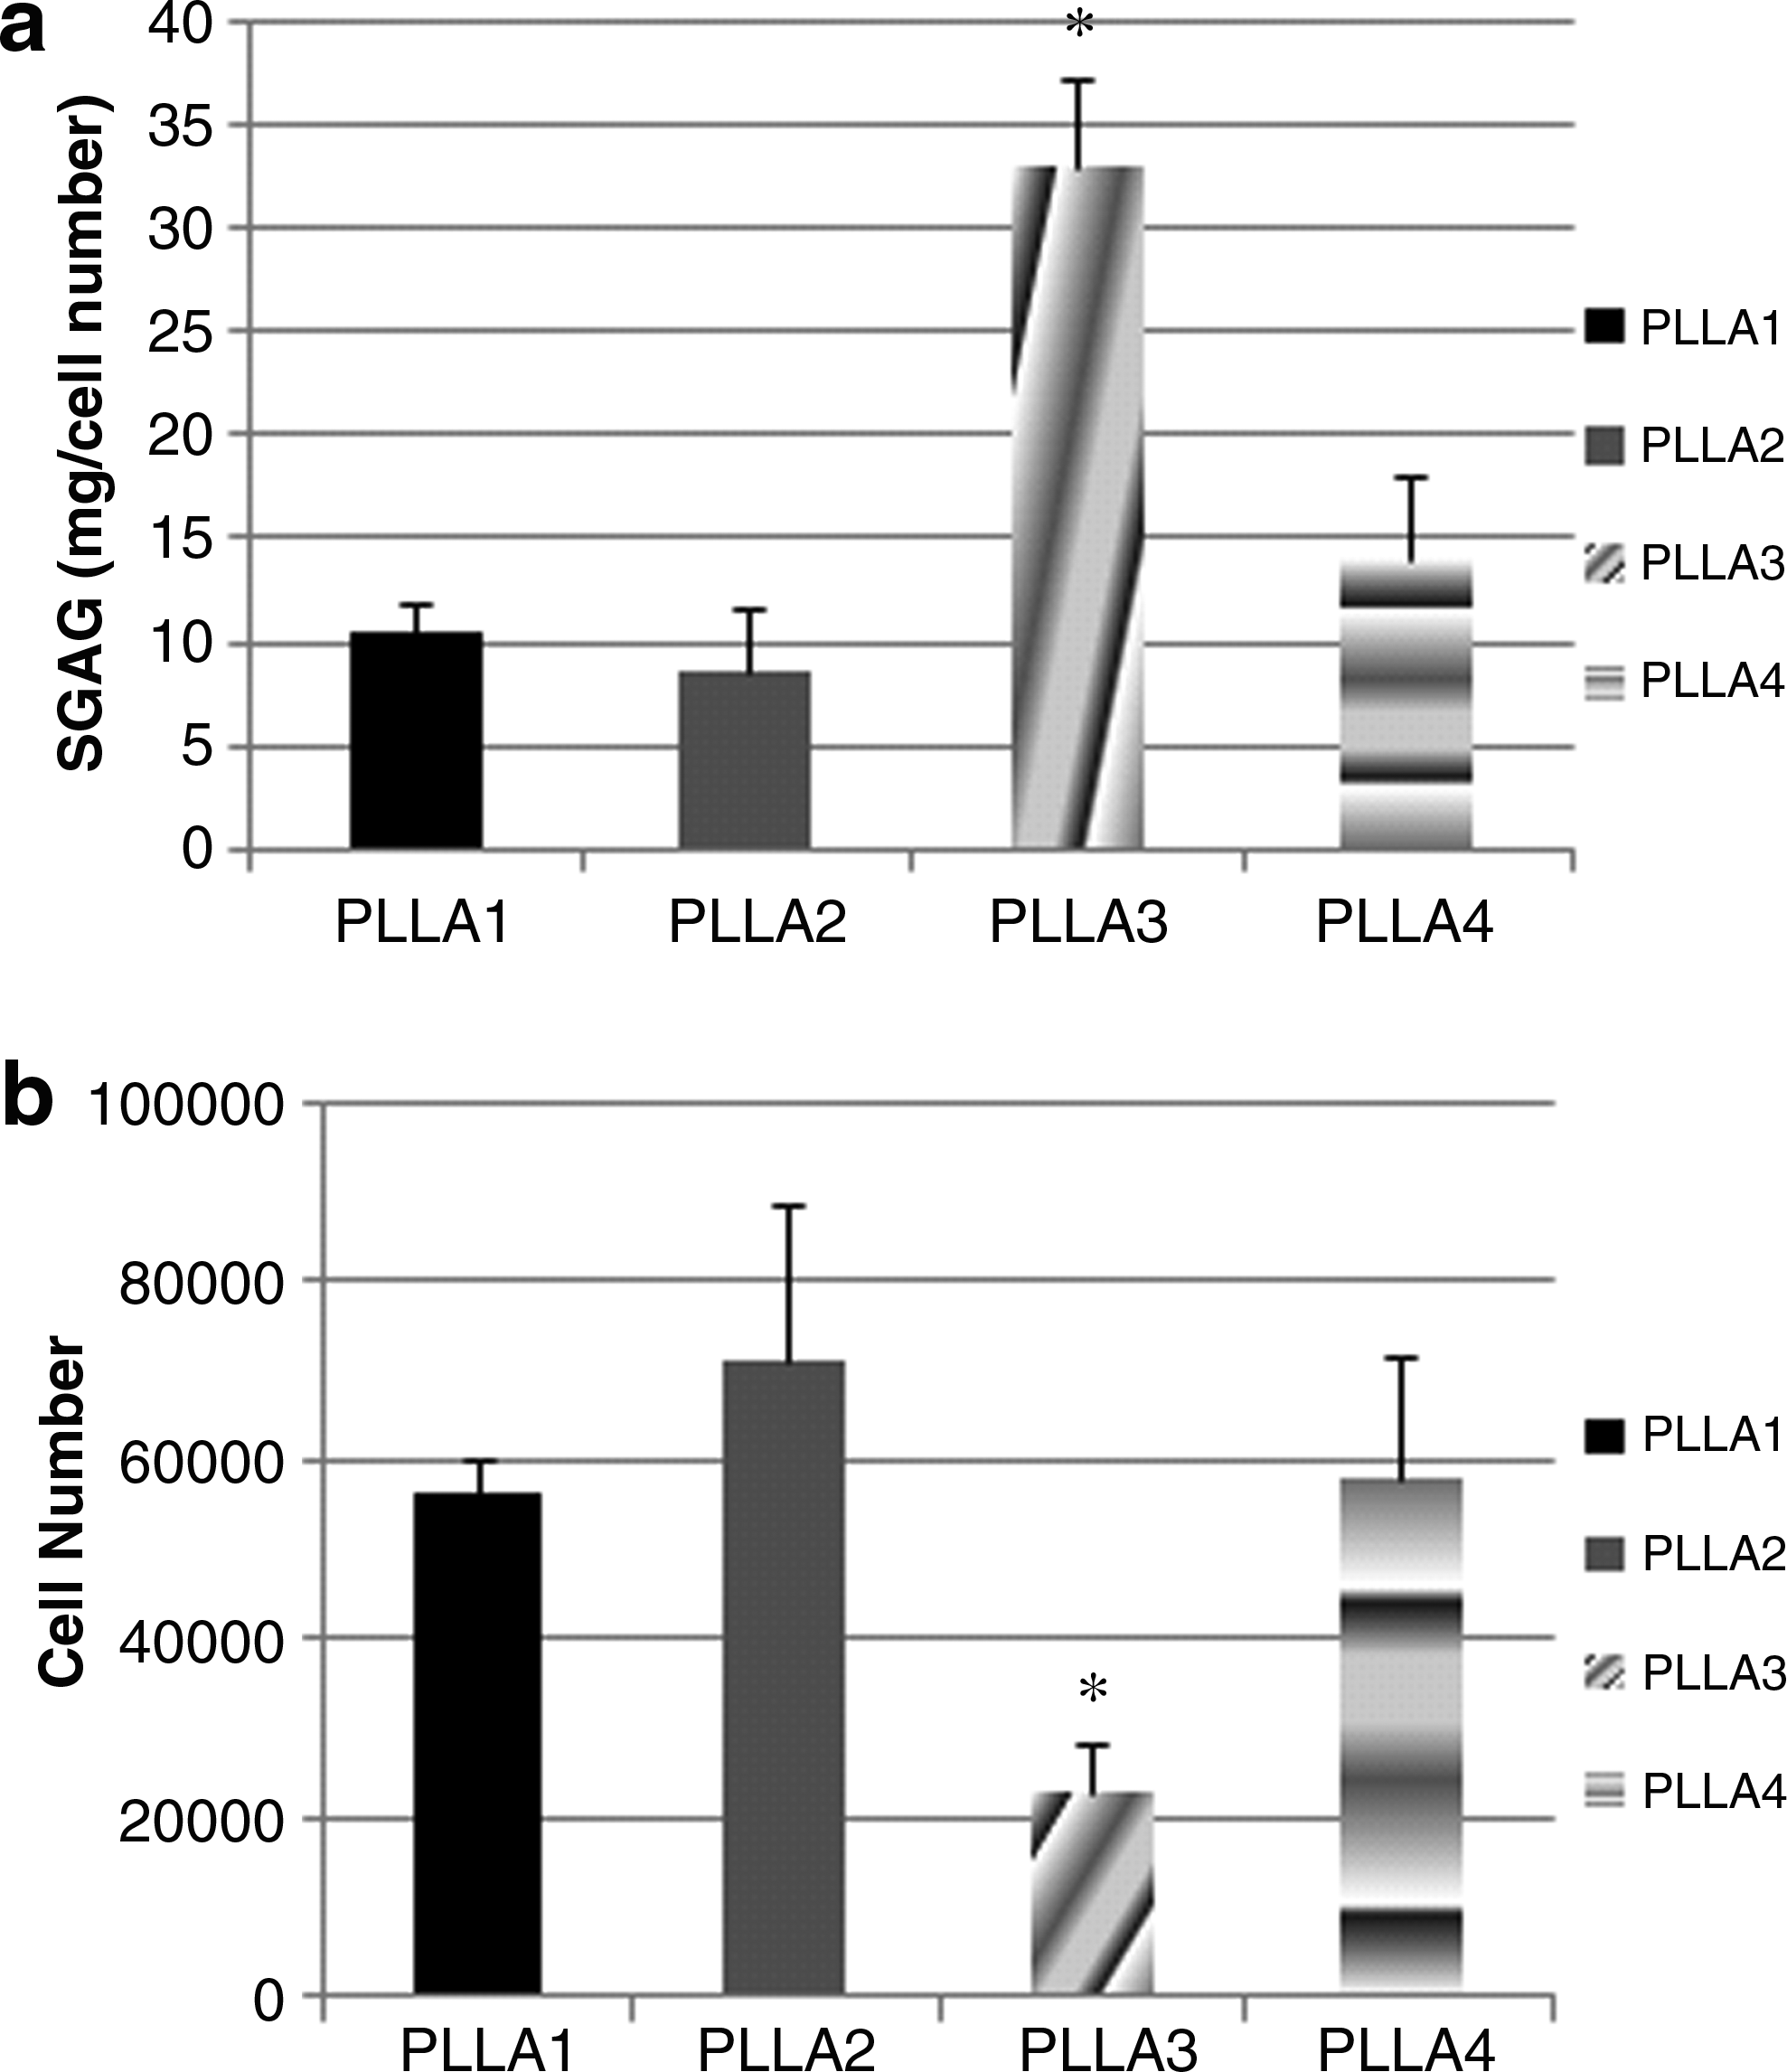
GAG production was the greatest for cells on PLLA3 as compared with all other scaffolds in CCM+ media (Fig. 5a). GAG was detected for cells in other media conditions but was at lower levels in comparison to CCM+ media (data not shown). The corresponding cell number for cells on PLLA3 in CCM+ media was also the least for PLLA3 (Fig. 5b). A similar trend was also detected for cell number in the other media conditions for all scaffolds.
Gene expression
In CCM+ media, chondrogenic markers of aggrecan, Sox9, collagen II, and chondroadherin were expressed at the highest levels on PLLA3 and PLLA4 as compared with cells on the other scaffolds at 14 days of culture (Fig. 6). Cells on PLLA3 and PLLA4 expressed the highest level of aggrecan and chondroadherin at day 14. By day 28, cells on PLLA3 and PLLA4 continued to express the highest level of aggrecan, chondroadherin, and collagen type II as compared with the other scaffolds. However, Sox9 expression was not statistically significant among all scaffolds at day 28. Cells expressed a high level of collagen type I on PLLA3 and PLLA4 at day 14, but this level decreased significantly by day 28. FAK expression was also detected at both days 14 and 28 for all scaffolds. However, at day 28, cells on PLLA1 had the highest level of FAK expression as compared with all other scaffolds. In CCM− and control medium, cells did not express chondrogenic marker genes on all scaffolds for up to 28 days in culture (data not shown). Sox2 gene expression was highest for MSCs at day 0, before cell seeding, but was significantly reduced at days 1, 14, and 28 on all scaffolds in all three media (Fig. 7).
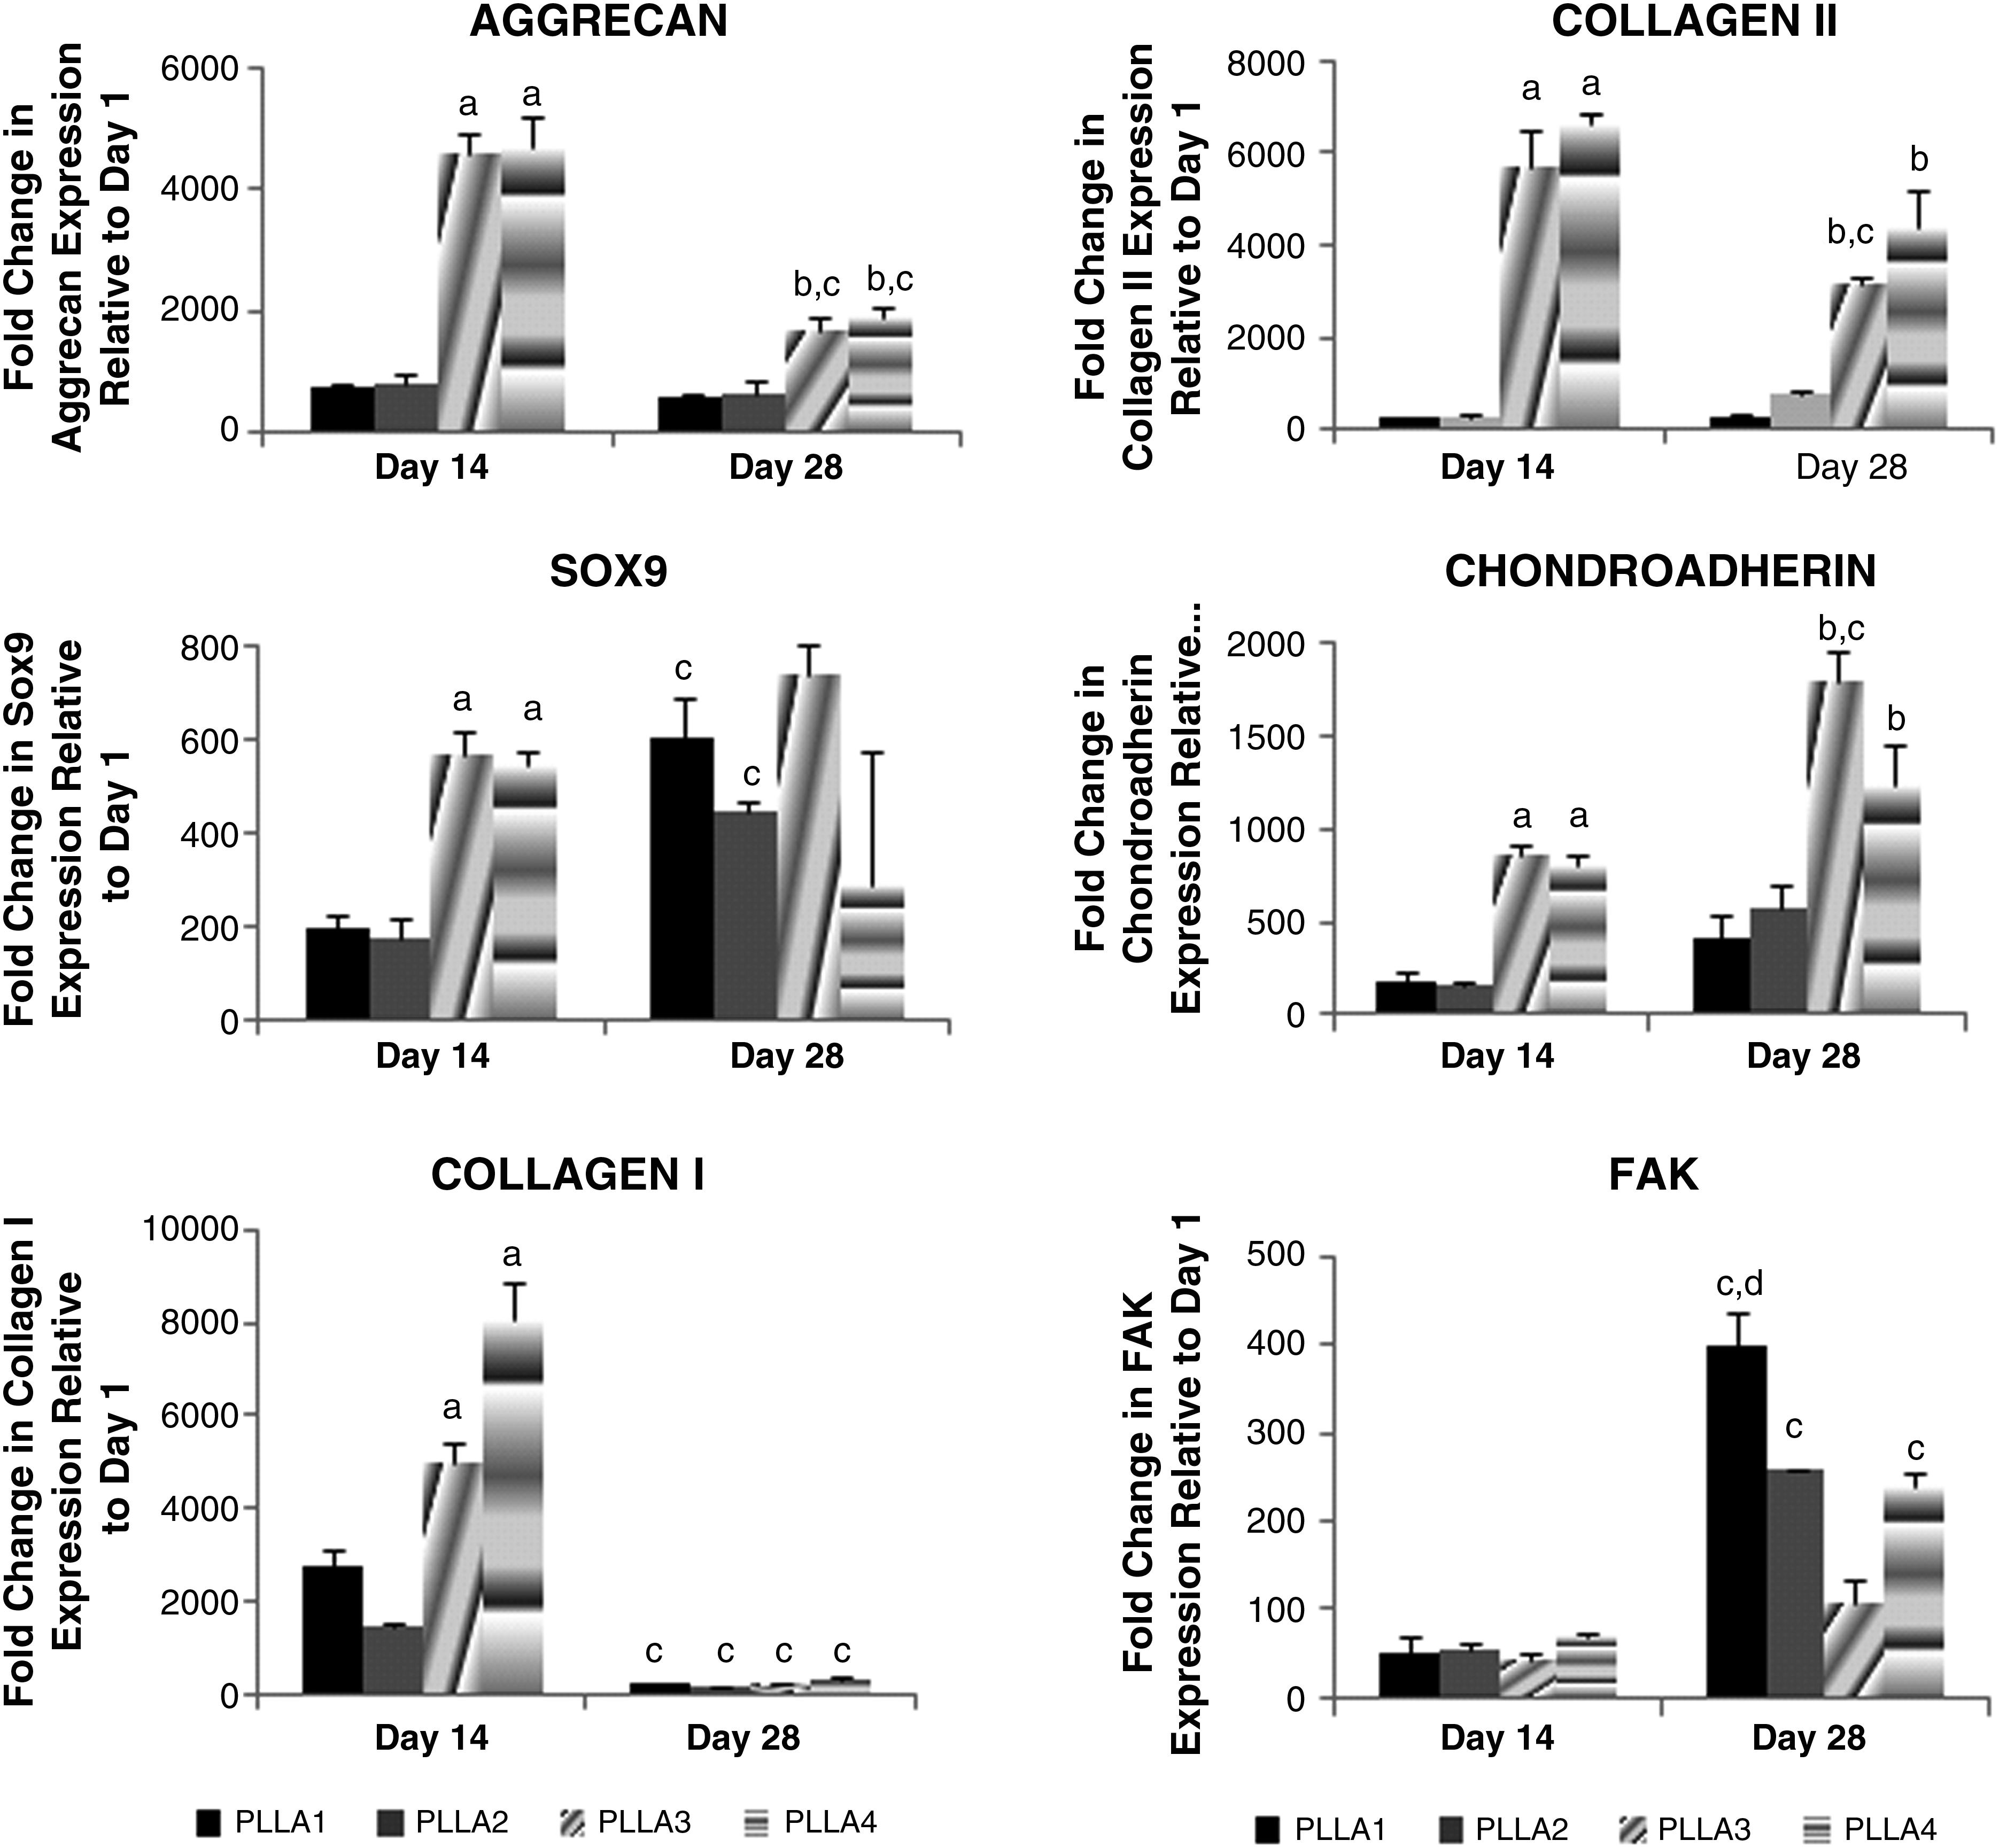
Fold change in chondrogenic gene expression relative to day 1 for cells on PLLA1–4 in CCM+ media. Values are mean ± standard error. ap < 0.05, PLLA3 and PLLA4 are statistically different from PLLA1 and PLLA2 at day 14. bp < 0.05, statistically different from PLLA1 and PLLA2 at day 28. cp < 0.05, statistically different between days 14 and 28, dp < 0.05, statistically different from all other groups at day 28.
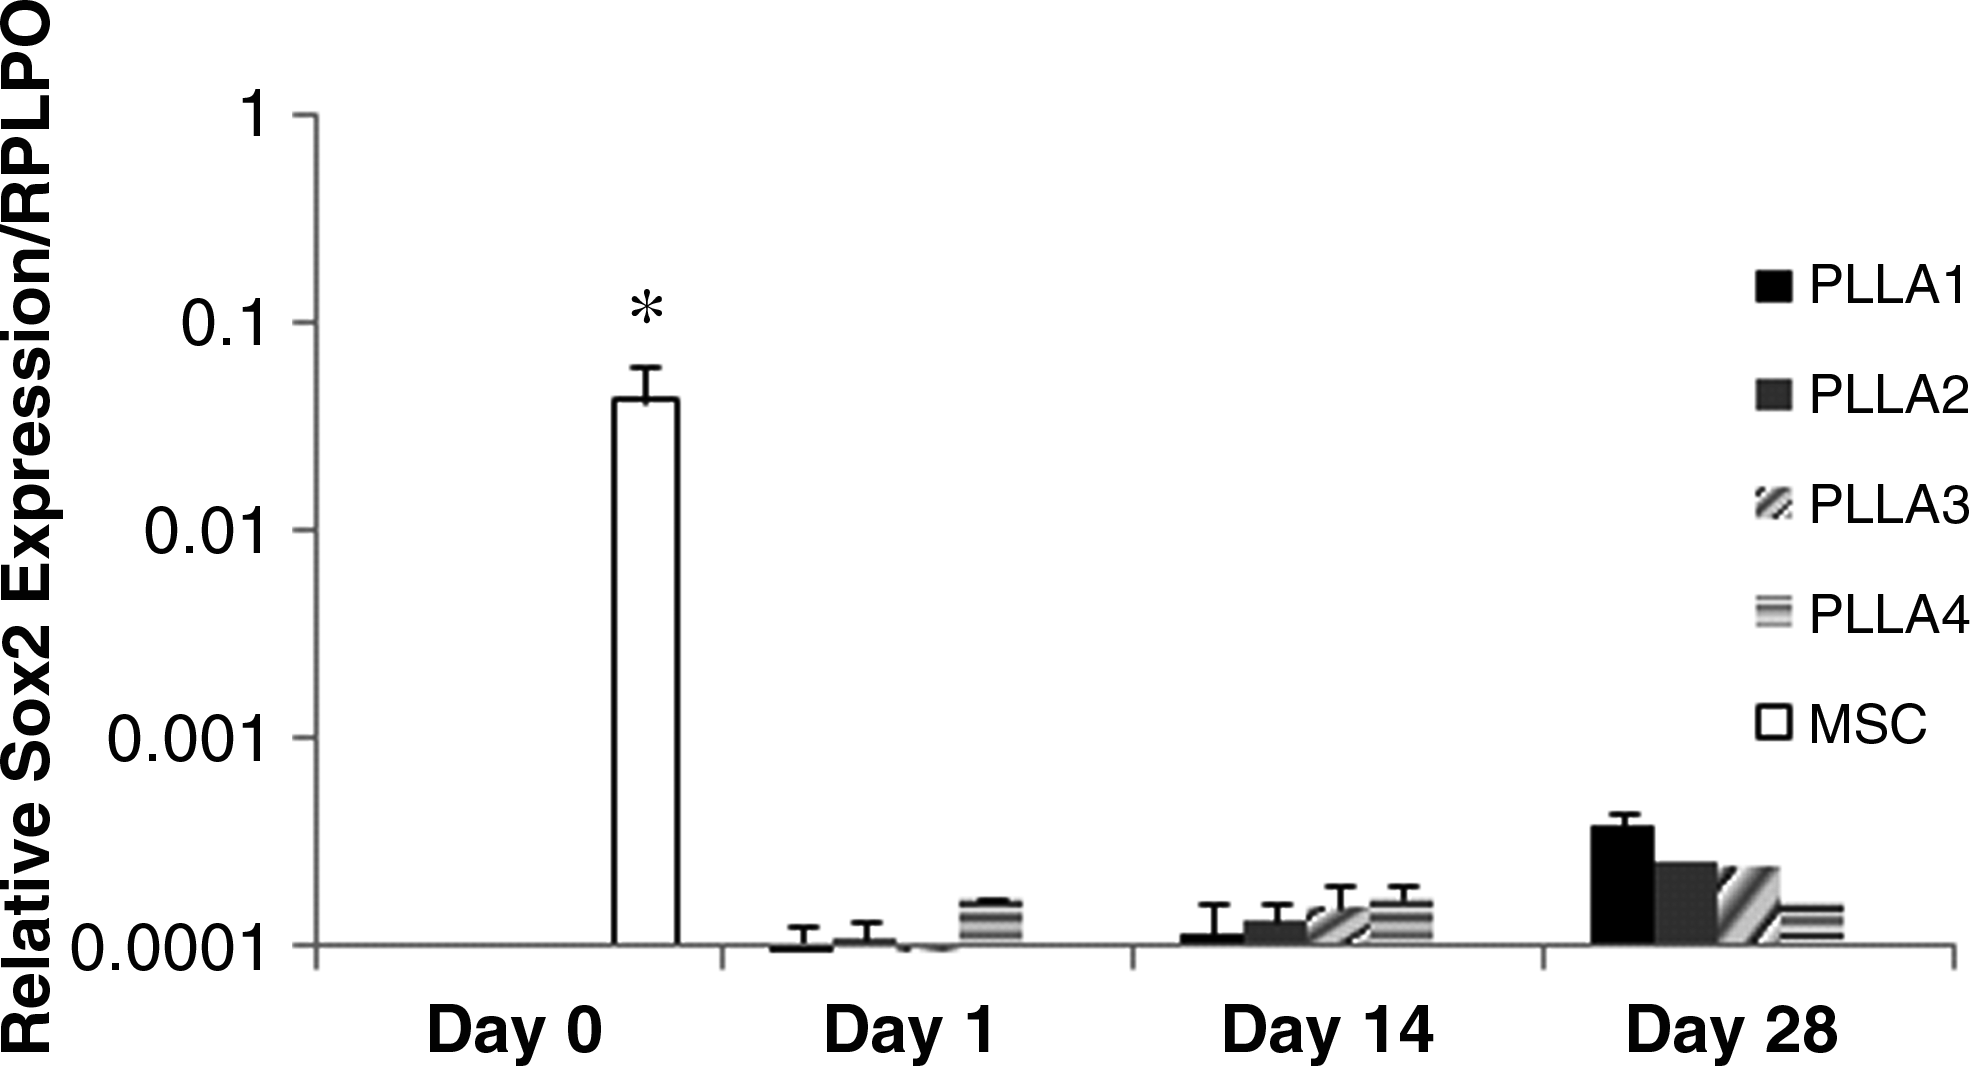
Sox2 gene expression for cells on PLLA1–4 in CCM+. Values are mean ± standard error. *p < 0.05, statistically different from all other groups at days 1, 14, and 28.
Discussion
The results of this study demonstrate that MSC chondrogenesis was more favorable on scaffolds having micron-sized fibers in comparison to nano-sized fibers, as noted by greater gene expression and biochemical analysis for chondrogenic markers. In addition to fiber size, fiber spacing/pore size of scaffolds played a major role in MSC chondrogenesis where scaffolds having large pore sizes were more favorable for differentiation. MSC differentiation appeared to be less sensitive to changes in the mechanical properties, which were determined to be anisotropic for both nano and micron-sized random, fibrous scaffolds.
Our findings contradict studies examining nano- versus micron-sized electrospun scaffolds where MSCs or chondrocytes exhibited enhanced levels of chondrogenic markers on nanofiber scaffolds.12,28 MSCs on oriented, 500 nm fibrous meshes had higher gene expression for aggrecan and collagen type II than 3 μm nanofiber mats. Chondrocytes on 500–900 nm mats exhibited higher expression of both biochemical and gene level chondrocyte markers as compared with 15–20 μm mats. However, these studies, which use conventional electrospinning processes similar to the work described here, do not report or control for pore size. Cells on PLLA1 and PLLA2, which differed in fiber dimension going from nano to a mix of nano- to micron-sized fibers, respectively, and had similar pore sizes, demonstrated no differences in chondrogenesis. In addition, cells on both scaffolds exhibited lower levels of chondrogenic markers in comparison to micron-sized scaffolds. Electrospinning is a versatile process for forming nanoscale fibrous scaffolds of a variety of biocompatible, biodegradable materials and has been widely explored.11,29 However, control over other scaffold architectural characteristics, such as pore size and porosity, is limited due to the packing restrictions of the fibers using conventional techniques. In general, pore size increases with fiber diameter. PLLA3 and PLLA4 scaffolds had not only a significant increase in fiber dimension but also pore size. As observed, the micron-sized fibrous meshes, having a similar large pore size, promoted cell aggregation as opposed to a spread, spindle-shape morphology on the small pore nanofiber structures. Cell attachment may have been more favored on the nanofiber scaffolds, which has been shown in other studies to be due to the highly packed or high-surface-density fiber arrangement in the nanofiber matrices. 30 When the fiber size increased, cells were no longer able to spread across multiple fibers and aggregates formed within the larger inter-fiber distance/pore space. Aggregation and promoting cell–cell contact is necessary for chondrogenesis.31,32 Additional studies are needed to discern the influence of the fiber diameter independent of the pore space in promoting aggregation and, in turn, chondrogenesis by examining a wide range of fiber dimensions where pore sizes are well controlled.
Sox9, which is a transcription factor expressed early in chondrogenesis and regulates both the maintenance of the chondrocyte phenotype and expression of the collagen type II gene, 33 was highly expressed and remained relatively constant for cells on PLLA3 and PLLA4 for up to 28 days and corresponded to high levels of both gene and protein expression of collagen type II. Cells on PLLA1 and PLLA2 had lower levels of Sox9 expression in comparison to the other scaffolds at day 14 which then increased by day 28. Yet, no detectable collagen type II was produced although corresponding gene expression continued to increase by day 28. Others have shown that the gene for collagen type II can be expressed at high levels at early time points in chondrogenic cultures but there is no protein production.34,35 At later time points, very little change in collagen type II gene expression occurs, yet there is significant production of the protein. Although there was an increase in gene expression for collagen type II for cells on PLLA-1 and -2 in this study between days 14 and 28, the highest level of gene expression occurred early for cells on PLLA3 and PLLA4 and began to decrease slightly at later time points when there was significant production of the protein. These findings suggest that the nano and mixed nano to micron fiber substrates do not support a high level of Sox9 expression leading to a delay in the expression of related markers in chondrogenesis.
Chondroadherin, a mature chondrocyte marker, is a cartilage protein with cell binding properties that plays an important role in cell–matrix interactions and in the regulation of chondrocyte growth and proliferation. 36 Chondroadherin expression continued to increase over time with highest levels for cells on PLLA3 and PLLA4. FAK expression also increased between days 14 and 28. During chondrogenesis, FAK is upregulated in early MSC condensation, downregulated in chondrocyte differentiation, and then re-expressed during chondrocyte maturation due to cell interaction with the cartilage matrix.37,38 For cells on PLLA3 and PLLA4 scaffolds at day 28, since collagen type I is expressed at significantly lower levels in comparison to day 14 and there is production of type II collagen within the cell aggregates, the data suggests that these cells are becoming mature chondrocytes. Collagen Type I was expressed at its highest level for cells on all scaffolds at day 14, indicating immature chondrocytes or fibrocartilage-like phenotypes at this time point.39,40 Although the highest level of FAK expression occurred for cells on PLLA1 at day 28, cell morphology remained elongated with a lack of collagen II production and lower levels of expression for chondrogenic markers, suggesting that cells may be binding more readily to the scaffold which in turn may not be as supportive of chondrogenesis. Additional phenotypic markers, FAK-associated integrin molecules, and cytoskeletal proteins are needed to clarify this finding. GAG production may be another indicator that cells on micron-sized fibers are at a later stage of differentiation than cells on nano-sized fibers. GAG production when normalized to cell number was the highest for cells on PLLA3 with the lowest levels occurring for cells on PLLA1 and PLLA2 at day 28. Cell number was also the lowest for cells on PLLA3 as compared with the other scaffolds. Lower cell number may be a result of apoptosis occurring during late-stage differentiation.34,40,41
Sox2 is necessary for the maintenance of the pluripotency state of embryonic and neural stem cells by preventing expression of differentiation genes. 42 Sox2 has been recently identified to be present in MSCs derived from the adult bone marrow. 43 Our studies also demonstrate similar findings where Sox2 is expressed at high levels in MSCs and for the first time demonstrate that during differentiation on scaffolds the Sox2 gene levels decrease to almost negligible levels throughout the induction period. This occurred for all scaffolds, including PLLA1 and PLLA2, which expressed lower chondrogenic markers, and for the other media conditions (data not shown). Others have shown that neuronal- and osteogenic-induced MSCs do not express Sox2.43,44 This finding suggests that the MSC population on scaffolds is in a differentiated state at the time points assessed.
The nonwoven/random electrospun scaffolds of PLLA1, PLLA2, and PLLA4 exhibited anisotropic mechanical properties, which is typically seen in oriented electrospun mats. 45 Although all scaffolds appeared to have random fiber arrangements as observed using SEM, there may be some degree of fiber orientation and/or nonuniform interfiber spacing that may lead to directional changes in properties. The scaffold's level of anisotropy and other mechanical parameters such as stiffness may be determinants for MSC chondrogenesis. Articular cartilage has anisotropic properties, in part due to collagen fibril arrangement. 46 The collagen fibers are oriented in parallel to the articular surface in the superficial zone, random in the middle zone, and perpendicular to the articular surface in the deep zone. 47 This orientation is adapted due to the mechanical loading of the joint. The collagen fibers in articular cartilage also have high stiffnesses, where the young's modulus has been reported to range from 2 to 40 MPa, as compared with the surrounding cartilage matrix. 48 Cells on PLLA3, which had the lowest stiffness but was comparable to collagen, had the highest GAG production by day 28. This scaffold, however, was isotropic. Other work has shown that MSC differentiation along the myogenic, osteogenic, and neuronal lineages can be directed by scaffold stiffness without the use of inductive biochemical factors. 49 However, for chondrogenesis in this study, TGF-β had to be present in the culture media, which suggests that the scaffolds complement the actions of growth factors in regulating the differentiation process.
In conclusion, our results demonstrate that micron-sized fibrous scaffolds having large pore sizes enhance MSC chondrogenesis as compared with nano-sized fibrous scaffolds. The nanofiber has been of interest in the tissue engineering field; however, additional design features of pore size and mechanical properties need to be considered. Cells on a range of nanofiber scaffolds, having the same pore size and mechanical properties, exhibited a delay in chondrogenesis. The pluripotent gene, Sox2, however, was downregulated as a result of the cells being on the scaffolds, suggesting that scaffolds play an important role in differentiation.
Footnotes
Acknowledgments
The authors would like to thank support from NSF PECASE CBET-0238787 and New Jersey Commission on Science and Technology–Stem Cell Grant.
Disclosure Statement
No competing financial interests exist.