
Abstract
Heterotopic ossification (HO) is a serious disorder that occurs when there is aberrant bone morphogenic protein (BMP) signaling in soft tissues. Currently, there are no methods to detect HO before mineralization occurs. Yet once mineralization occurs, there are no effective treatments, short of surgery, to reverse HO. Herein, we used in vivo molecular imaging and confirmatory ex vivo tissue analyses of an established murine animal model of BMP-induced HO to show that matrix metalloproteinase-9 (MMP-9) can be detected as an early-stage biomarker before mineralization. Ex vivo analyses show that active MMP-9 protein is significantly elevated within tissues undergoing HO as early as 48 h after BMP induction, with its expression co-localizing to nerves and vessels. In vivo molecular imaging with a dual-labeled near-infrared fluorescence and micro-positron emission tomography (μPET) agent specific to MMP-2/-9 expression paralleled the ex vivo observations and reflected the site of HO formation as detected from microcomputed tomography 7 days later. The results suggest that the MMP-9 is a biomarker of the early extracellular matrix (ECM) re-organization and could be used as an in vivo diagnostic with confirmatory ex vivo tissue analysis for detecting HO or conversely for monitoring the success of tissue-engineered bone implants that employ ECM biology for engraftment.
Introduction
Previously, we have developed a murine model of BMP-induced HO and have demonstrated that early tissue remodeling stages involve regional stem-progenitor cell recruitment for chondro-osseous differentiation followed by new vessel formation and the rapid remodeling of the vasculature that occurs simultaneously with the generation of brown adipose. 7 These early stages are thought to prepare the microenvironment for progenitor recruitment for cartilage 8 and bone as well as define the location and boundaries of the HO itself.7–9 Once cartilage matrix is produced, it is degraded by matrix metalloproteinase-9 (MMP-9) and MMP-139 for replacement with new osteoid. However, in these studies, we demonstrate early expression of MMP9 within the nerve undergoing remodeling, which appears within 24 h after induction of bone formation. Activated MMP9 continues to be expressed in the tissues through remodeling of cartilage. Thus, this study demonstrates the ability of activated MMP9 to function as a diagnostic target for molecular imaging to detect early HO disease on the basis of early tissue remodeling processes.
From screening of peptide libraries, Koivunen et al. identified a cyclic CTT peptide c(CTTHWGFTLC) with potent inhibitory activity against MMP-2/9 that arises from the HWGF peptide motif. 10 However, the CTT peptide is highly susceptible to nonspecific degradation, thus limiting its potential as an in vivo imaging agent.11,12 Using structure–activity relationship to create an optimized HWGF peptide motif, Wang et al. 13 created the cyclic peptide c(KAHWGFTLD)NH2 to which we added a lysine to the N-terminus for conjugation of a near-infrared (NIR) fluorescent dye to detect early HO from both NIR and micro-positron emission tomography (μPET). NIR fluorescence provides a fast and simple nonradioactive means for imaging (for review see ref. 14 ) but since it is not yet validated for quantitative imaging, we dual labeled for μPET quantification.
Herein, we validate and use molecular imaging in the murine model to report increased active MMP-9 protein expression in vivo immediately after BMP induction of HO, but before mineralization occurs. Complimentary ex vivo data that show that MMP-9 expression is associated with a number of tissue structures undergoing remodeling to support new bone formation. MicroCT (μCT) was used to later observe mineralization at the site of NIR and μPET detection of active MMP-9. The study was designed to determine whether MMP-9 could provide a tentative target for diagnosing extracellular matrix (ECM) changes before mineralization and potentially enable the earliest intervention before bone matrix formation.
Materials and Methods
Animal procedures
Human fibroblasts were used because they can be easily infected with the Ad5BMP2 without resorting to transfection methodology to overcome the lack of adenovirus receptor on most rodent cells. Accordingly, the MRC5 human diploid fibroblast cell line (American Tissue Type Culture Collection, Manasss, VA) was transduced with either Adempty or AdBMP2 (for details see ref.15,16), washed with phosphate-buffered saline (PBS), removed with trypsin, and resuspended at a concentration of 5×10⁶ cells per 100 μL of PBS. An intramuscular injection of 50 μL into each hind limb quadriceps muscle of nonobese diabetic/severely compromised immunodeficient (NOD/SCID) mice was performed. Control-transduced cells were injected into the left limb, and BMP2-transduced cells were delivered into the right limb of each animal. For ex vivo evaluation of RNA, protein expression, and active gelatinase protein content, animals were euthanized at time points of 1, 2, 3, 4, 5, and 6 days postinjection. Hind limbs were harvested and tissues were placed in formalin, or frozen for subsequent analyses (as described below). For in vivo evaluation mice were imaged at day 2, 4, or 6 post-implantation with μPET, μCT, and NIR and 7 days later, μCT imaging was conducted to assess mineralization (as described below) before the animals were euthanized. For all imaging procedures, mice were anesthetized with 1% isofluorane. All animal studies were performed in accordance with the standards of Baylor College of Medicine (Houston, TX), Department of Comparative Medicine, and The University of Texas Health Science Center (Houston, TX), Center for Molecular Imaging after review, and approval of the protocol by their respective Institutional Animal Care and Use Committee or Animal Welfare Committee.
Histology
Mouse hind limbs were formalin fixed, decalcified, and divided in half longitudinally to expose the internal tissues, and then both halves of the tissue were embedded into a single paraffin block or alternatively snap-frozen for sectioning. The tissues were oriented so that the internal areas were exposed to the outside of the paraffin block, allowing for the tissue to be sectioned from the inside out. Serial sections (5 μm) were prepared that encompassed the whole hind limb reactive site (approximately 10–15 sections per tissue specimen depending on the type of transduced cells the tissue received). We then performed hematoxylin and eosin (H&E) staining on every fifth slide to locate the center region containing either our delivery cells or the newly forming endochondral bone.
Serial unstained slides were used for immunohistochemical staining (either single or double-antibody labeling). For double antibody labeling, samples were treated with both primary antibodies simultaneously followed by washing and incubation with respective secondary antibodies, used at 1:500 dilution to which Alexa Fluor 488, 594, or 647 (Invitrogen by Life Technologies, Carlsbad, CA) were conjugated. Briefly, sections were fixed with 4% paraformaldehyde, PBS washed, and treated with 0.25% Triton X-100 in Tris-buffered saline (19.98 mM/L Tris and 136 mM/L NaCl, pH 7.4). The Mouse on Mouse (M.O.M.) kit for detecting mouse primary antibodies on mouse tissue (Vector Laboratories, Burlingame, CA) was applied to the sections according to manufacturer's protocol. A goat anti-mouse MMP-9 antibody (R&D Systems, Minneapolis, MN) was used at a 1:150 dilution, anti-neurofilament mouse monoclonal antibody used at 1:150 dilution (Sigma Chem Co, St. Louis, MO), and anti–von Willibrand Factor (anti-VWF) and rabbit polyclonal antibody was used at 1:300 dilution (Chemicon-Millipore, Billerica, MA). Slides were then covered with mounting medium containing the nuclear stain DAPI (Vector Labs). Stained tissue sections were examined by confocal microscopy (Zeiss Inc, Thornwood, NY; LSM 510 META) using a 20×/0.75NA objective lens.
Ex vivo analysis of protein content
Quantitative real-time polymerase chain reaction
From the harvested muscle tissue surrounding the injection site of either control or BMP2-transduced cells, total RNA was collected using a Trizol reagent (Life Technologies, Carlsbad, CA). RNA integrity was confirmed by agarose gel electrophoresis. cDNA was synthesized from RNA using the RT2 first strand kit (SA Biosciences, Frederick, MD). The cDNA from each sample was analyzed separately, the results were averaged, and standard error of the mean was calculated. The cDNA from muscles with control or BMP2-transduced cells was subjected to quantitative real–time polymerase chain reaction (qRT-PCR) analysis in parallel using a 7900HT PRISM Real-Time PCR machine (Applied Biosystems, Carlsbad, CA). The Ct values were normalized to both internal 18S ribosomal RNA used in multiplexing and to each other to remove changes in gene expression common to both the control and BMP-2 tissues by using the method of ΔΔCt along with SYBR Green probes and qPCR primers (SABiosciences, Frederick, MD). The analyses were conducted in triplicate for eight biological samples at each time point and were reported as the average and standard deviation of the fraction of protein-specific RNA that was attributed to MMP-9. Significance was determined by standard T-test.
Quantification of active MMP-2 and -9 protein
Protein extracts were prepared from the muscle surrounding the site of injection of either BMP2-producing or control cells using the Total Protein Extraction Kit (Millipore, Billerica, MA). Briefly, tissues (n=8 animals) were homogenized separately and protein extracts centrifuged according to kit instructions. The resultant protein concentrations were determined using a Bio-Rad Protein Assay kit® (Bio-Rad, Hercules, CA) and samples were then analyzed for both active protein using MMP-2 and MMP-9 Biotrak Activity Assay System (GE Healthcare, Piscataway, NJ) and total protein using the MMP9 protein standard provided by the manufacturer (R&D Systems) according to manufacturer's protocol. Sample analysis was done in duplicate, and the final values were calculated as the fraction of total active protein within the tissue associated with MMP-9, as the average and standard deviation. Significance was determined by standard T-test.
Synthesis and validation of dual-labeled in vivo imaging agent against MMP-9
While there have been a number of MMP targeting agents developed for nuclear and optical imaging, we sought to specifically image gelatinases separately using μPET and NIR technologies to follow the in vivo changes in active MMP-9 in tissues in the early stages of HO. Therefore, we specifically developed and validated a molecular imaging agent specifically for the study of HO. In the following, we describe the synthesis and validation process for utilizing the imaging agent in trace dosages for early detection of HO on the basis of MMP-9 expression.
Reagents
All reagents were purchased from commercial sources and used without further purification. Chelex-100 resin was purchased from Bio-Rad Laboratories (Richmond, CA) and used with all aqueous buffers to ensure metal-free conditions. 64Cu was obtained from Washington University (St. Louis, MO) in the form of high-specific-activity 64CuCl2 in 0.05 M HCl. The MMP-targeting peptide M1 [Lac(2,10)]DOTA-KKAHWGFTLD was synthesized by New England Peptide (Gardner, MA) according to standard Fmoc-protocols. Analytical high-performance liquid chromatography was performed on a Hitachi LaChrom system equipped with a 2.6 μm Kinetex C-18 column (Phenomenex, Torrance, CA) with a mobile phase of A=0.1% TFA in H2O, B=0.1% TFA in CH3CN; gradient, 0 min=5% B, 45 min=100% B; flow rate, 1 mL/min. Radio-thin-layer chromatography (TLC) was carried out on an AR-2000 scanner (Bioscan, Washington, D.C.) using instant TLC (ITLC) strips and 1:1 methanol/0.1 M ammonium acetate. Molecular weight measurement was carried out electrospray ionization on a Waters ultra performance liquid chromatography system equipped with a Waters photodiode detector and a Waters tandem quadrupole mass spectrometer.
Preparation of imaging agent
Figure 1 shows the synthesis scheme for preparing the dual-conjugated peptide. DOTA was coupled to [Lac (2,10)]KKAHWGFTLD on solid phase peptide synthesis to yield the conjugate M1. M1 (1 mg, 637 nmol) was dissolved in 500 μL 0.1 M sodium phosphate buffer, pH 8.33. IRDye800CW-NHS was added to the peptide conjugate at a 1:1 molar ratio and placed on a rotating mixer at 4°C overnight. The sample was protected from light. The reaction mixture was loaded onto a 2000 MWCO spin column, centrifuged for 45 min at 3000 g, and washed thrice with 500 μL of MilliQ water. The flow through was discarded. The column was then inverted and centrifuged at 3000 g for 5 mins, and the purified product (M2) was collected, dried, and weighed to determine yield. Samples were protected from light and stored at −20°C for further use.

Schema wherein the modified HWGF cyclic peptide is conjugated to DOTA on solid support (i) yielding M1, labeled with IRDye800 in solution phase (ii) to form M2, and radiolabeled (iii).
Radiochemistry
64CuCl2 was received in a small volume of 0.05 M HCl and diluted in 100 μL of 0.1 M sodium acetate to pH 6. For radiolabeling, 1–2 mCi of 64CuCl2 was added to 6–35 nmol of M2 and the samples were incubated at 50°C for 1 h. Radiochemical purity (RCP) was assessed by radio-TLC (Rf free Cu=0; Rf 64Cu-M2=0.9) and confirmed by radio-high-performance liquid chromatography (HPLC). 64Cu-M2 was diluted in PBS and passed through a 0.22 μm syringe filter for in vivo studies.
Stability studies
Since the CTT peptide is highly susceptible to nonspecific degradation in vivo, thus limiting its potential as an imaging agent,11,12 we sought to assess stability of 64Cu-M2 in PBS, with a 500-fold excess diethylene triamine pentaacetic acid (DTPA) solution, and in mouse serum. After radiolabeling, 150 μL of 64Cu-M2 was diluted in equal volumes of PBS or DTPA solution and kept at room temperature. Aliquots were taken at 0, 2, 6, and 24 h postincubation and analyzed by radio-HPLC. To evaluate serum stability, 150 μL of 64Cu-M2 was added to 150 μL of 50% mouse serum and incubated at 37°C. An 80 μL aliquot was taken at each of the above-mentioned time points and added to 160 μL ice-cold acetonitrile. The samples were centrifuged at 14,000 g for 5 min and the supernatant was collected and analyzed by radio-HPLC.
Gelatin zymography
Biological activity of conjugates or inhibition of MMP-9 by M1 and M2 was examined by zymography against inhibitory control peptide CTT. Ten micrograms of CTT, M1, and M2 was incubated with MMP-9 (AnaSpec, Fremont, CA) at room temperature for 2 h and then electrophoresed in 5.0% sodium dodecyl sulfate– polyacrylamide gel electrophoresis (SDS-PAGE) containing 0.01% gelatin (a 5.0% SDS-PAGE without gelatin is used as a stacking gel). The sample was then re-natured in 2.5% Triton X-100 for 2 h at room temperature then incubated at 37° C for 2 h in buffer containing 50 mM Tris (pH 7.4), 150 mM NaCl, and 10 mM CaCl2. The gel was stained using 0.25% Coomassie blue; destaining was performed in a methanol:water:glacial acetic acid (45:45:10) mixture for 20–60 min. Clear bands indicated enzymatic activity, and the percentage of inhibition of M1 and M2 relative to the CTT control peptide was reported as the fraction of Coomassie staining intensity relative to the CTT control peptide.
In vivo molecular imaging
μPET/CT imaging
To observe the in vivo distribution of the radioisotope on the dual-labeled peptide, μPET/CT imaging was performed using a Siemens Inveon μPET/CT scanner (Siemens Medical, Knoxville, TN). The CT imaging parameters were an x-ray voltage of 80 kV with an anode current of 500 μA and an exposure time of 260 ms of each of the 120 rotation steps over the total rotation of 220° at low system magnification. After μCT imaging, μPET emission scans were performed with 5 min acquisition times. μPET and μCT images were reconstructed using two-dimensional filtered back-projection and a Feldkamp cone-beam algorithm with a ramp filter cutoff at the Nyquist frequency, respectively. μPET and μCT image fusion and image analysis were performed using ASIPro and Inveon Research Workplace (Siemens Preclinical Solutions).
The anesthetized mice were injected intravenously with 64Cu-M2 (200 μCi, 6 nmol). μPET/CT images were acquired in the prone position at 6 and 18 h postinjection of 64Cu-M2. To confirm molecular specificity of the agent, blocking studies were performed in which three additional animals from the day 4 Adempty/AdBMP2 postimplantation group were injected with 200-fold excess of M1 24 h before injection of 64Cu-M2, and 7 days later, μCT was performed. In all cases, images were acquired at 6 and 18 h postinjection of 64Cu-M2.
In vivo fluorescence imaging
NIR fluorescence images were acquired using custom-built fluorescence imaging systems 15 18 h after intravenous administration of 64Cu-M2. Briefly, a field of view was illuminated with 785 nm of light from a laser diode, outfitted with a convex lens and diffuser to create a uniform excitation field. The fluorescence was collected through holographic and interference filters placed before a Nikon camera lens. The images were finally captured by an electron-multiplying charge-coupled device camera (PhotonMax 512; Princeton Instruments, Princeton, NJ) with 200 to 400 ms of integration time. For acquisition of white-light images, the optical filters were removed, and a low-power lamp illuminated the subject. Image acquisition was accomplished by V++ software (Aukland, New Zealand).
Data analysis
To obtain the percentage of injected dose per gram (%ID/g) of 64Cu-M2, ROIs were applied to coronal μPET images to determine local tracer concentration and were normalized by body mass (g) and total injected dose. Target-to-background ratios (T/Bs) from the μPET coronal projections were computed using the same numerical area on the contralateral limb to represent the background region. T/Bs were similarly computed from the ventral NIR views.
Results
Histology and immunohistochemical staining
Figure panels 2A, C, and E show H&E images of paraffin-embedded sections of regional tissues 2, 6, and 10 days after AdBMP2 cells; Figure panels 2B, D, and F show the corresponding images for Adempty control cells. In agreement with our prior studies,16,17 immediately after delivery of the transduced cells we observe a substantial cellular infiltration in response to the transduced cells regardless of the BMP2 expression (Fig. 2A, B). The cellular response appears to wane in the control tissue region, whereas the tissues receiving AdBMP2-transduced cells continue to have a large number of replicating cells. By day 6, cartilage appears within the tissues (Fig. 2C), whereas in controls it appears that the cellular reaction is almost completely gone (Fig. 2D). By day 10 there is substantial bone within the tissues receiving the AdBMP2 cells, whereas the tissue of animals receiving the Adempty-transduced (control) cells appear similar to normal muscle (Fig. 2E, F, respectively).

Photomicrographs of tissues stained with H&E after intramuscular injection of AdBMP2 or Adempty cassette-transduced cells into the mouse hindlimb. Soft tissues were isolated, processed, paraffin embedded, and sectioned across the entire limb. Every fifth slide was H&E stained; images representing the reactive area, which immediately surrounds the injected AdBMP2
Figure 3 shows that MMP-9 (red staining) was observed in tissues isolated 24 and 48 h after delivery of AdBMP2 and Adempty-transduced cells. However, no MMP-9-positive cell staining was observed within the tissues 72 h after receiving Adempty (data not shown). MMP-9 expression (red) appeared to be associated with the nerve tissues (green staining) in the sample 1 day after receiving AdBMP2-transduced cells, whereas MMP-9 cell staining appeared to be uniformly dispersed within the control tissues. Examination of limbs injected with BMP2 on day 2 revealed nerve-associated expression similar to day 1, but also localization near VWF-positive vasculature (yellow staining). This pattern was observed through day 4 and before the appearance of cartilage. Presumably, MMP-9 expression is associated with remodeling of the tissues at a point when progenitors are assembling to form the initial cartilage condensation. The timing of MMP-9 expression within the tissue appears to match those predicted by the RNA and protein analysis (as described below).
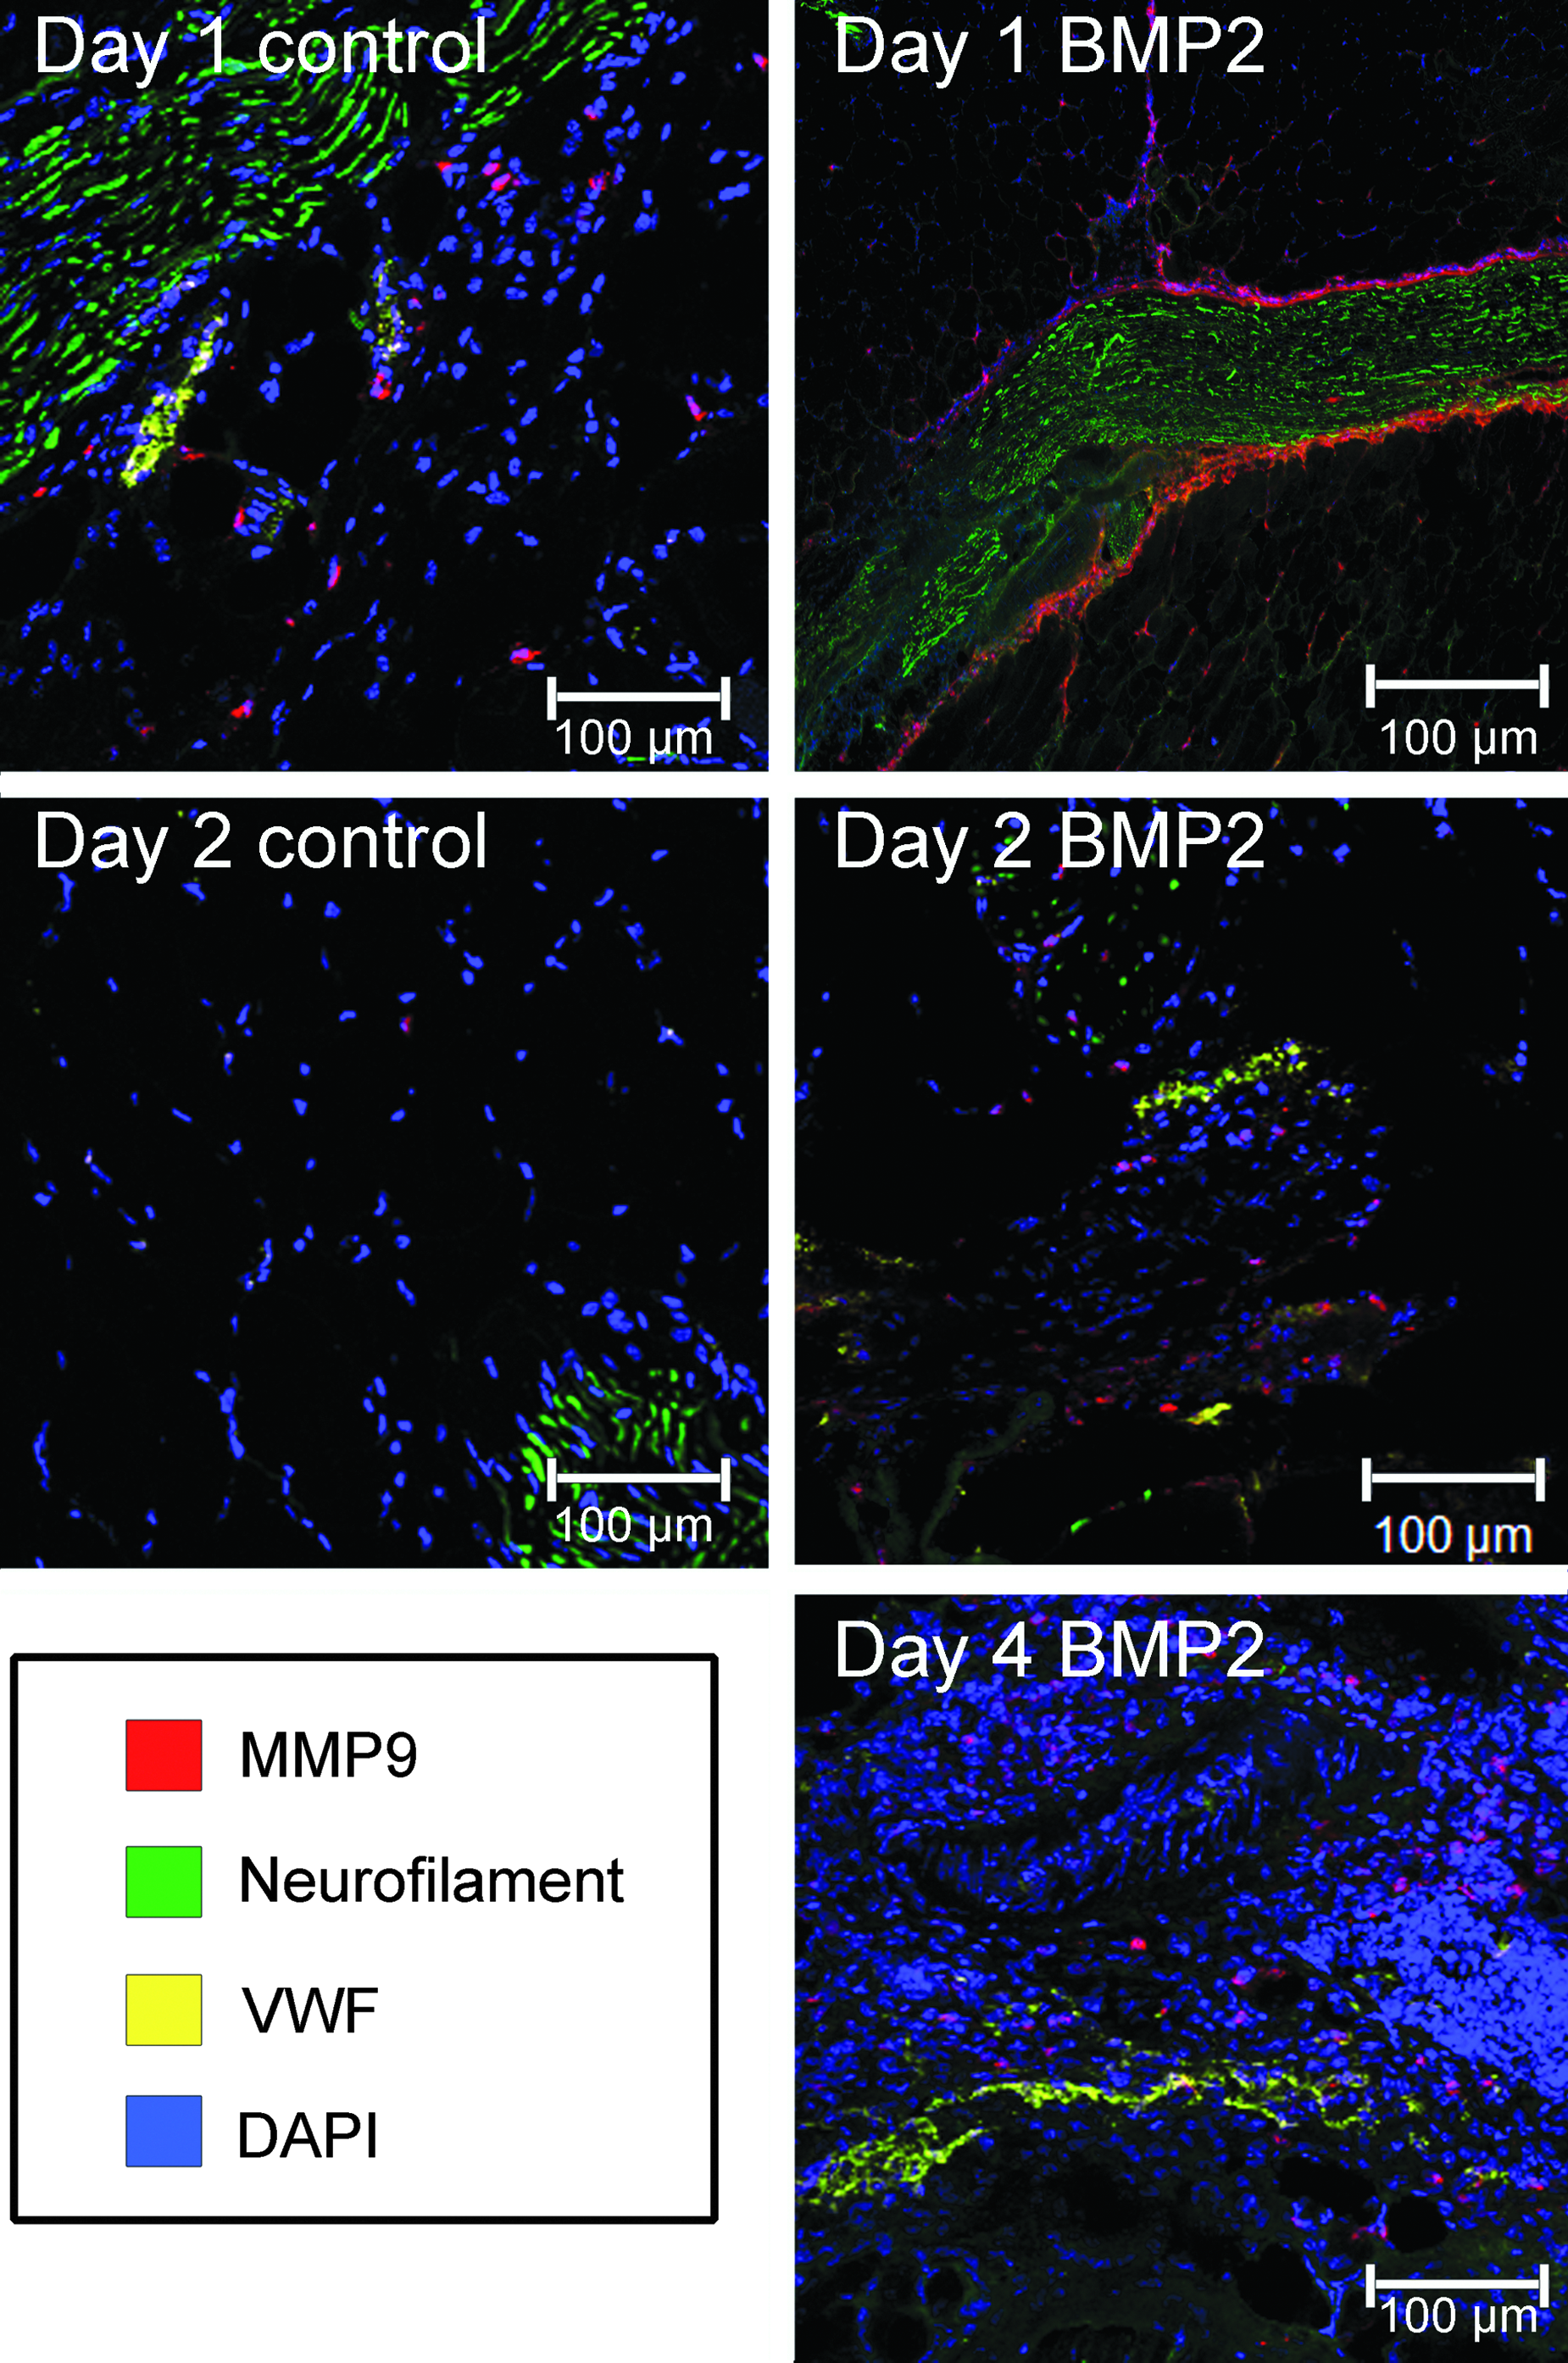
Photomicrographs of immunofluorescence staining for MMP-9 (red) neurofilament (green) and VWF (yellow), in tissues after induction of HO by delivery of AdBMP2 or Adempty cassette-transduced cells. Tissues isolated at daily intervals were serially sectioned, and every fifth slide stained and representative images are shown. The BMP2 tissues reveal MMP-9 expression to be associated with nerve tissues on days 1, 2, and 4, with MMP-9 also localized near vasculature that is identified with positive VWF staining on day 2. MMP-9 is uniformly dispersed within the control tissues for the corresponding days. MMP-9, matrix metalloproteinase-9; VWF, von Willibrand factor; HO, heterotopic ossification.
MMP-9 RNA and protein expression
As illustrated in Figure 4A, MMP-9 RNA in tissues receiving the AdBMP2 cells was significantly elevated starting 4 days after induction and continued to be significantly elevated (p≤0.01) through the first appearance of heterotopic bone. In contrast MMP-2 RNA was not significantly elevated. Additionally, the expression of MMP-2 and −9 RNA within the control tissues suggested that there was low to undetectable levels of RNA in these samples.
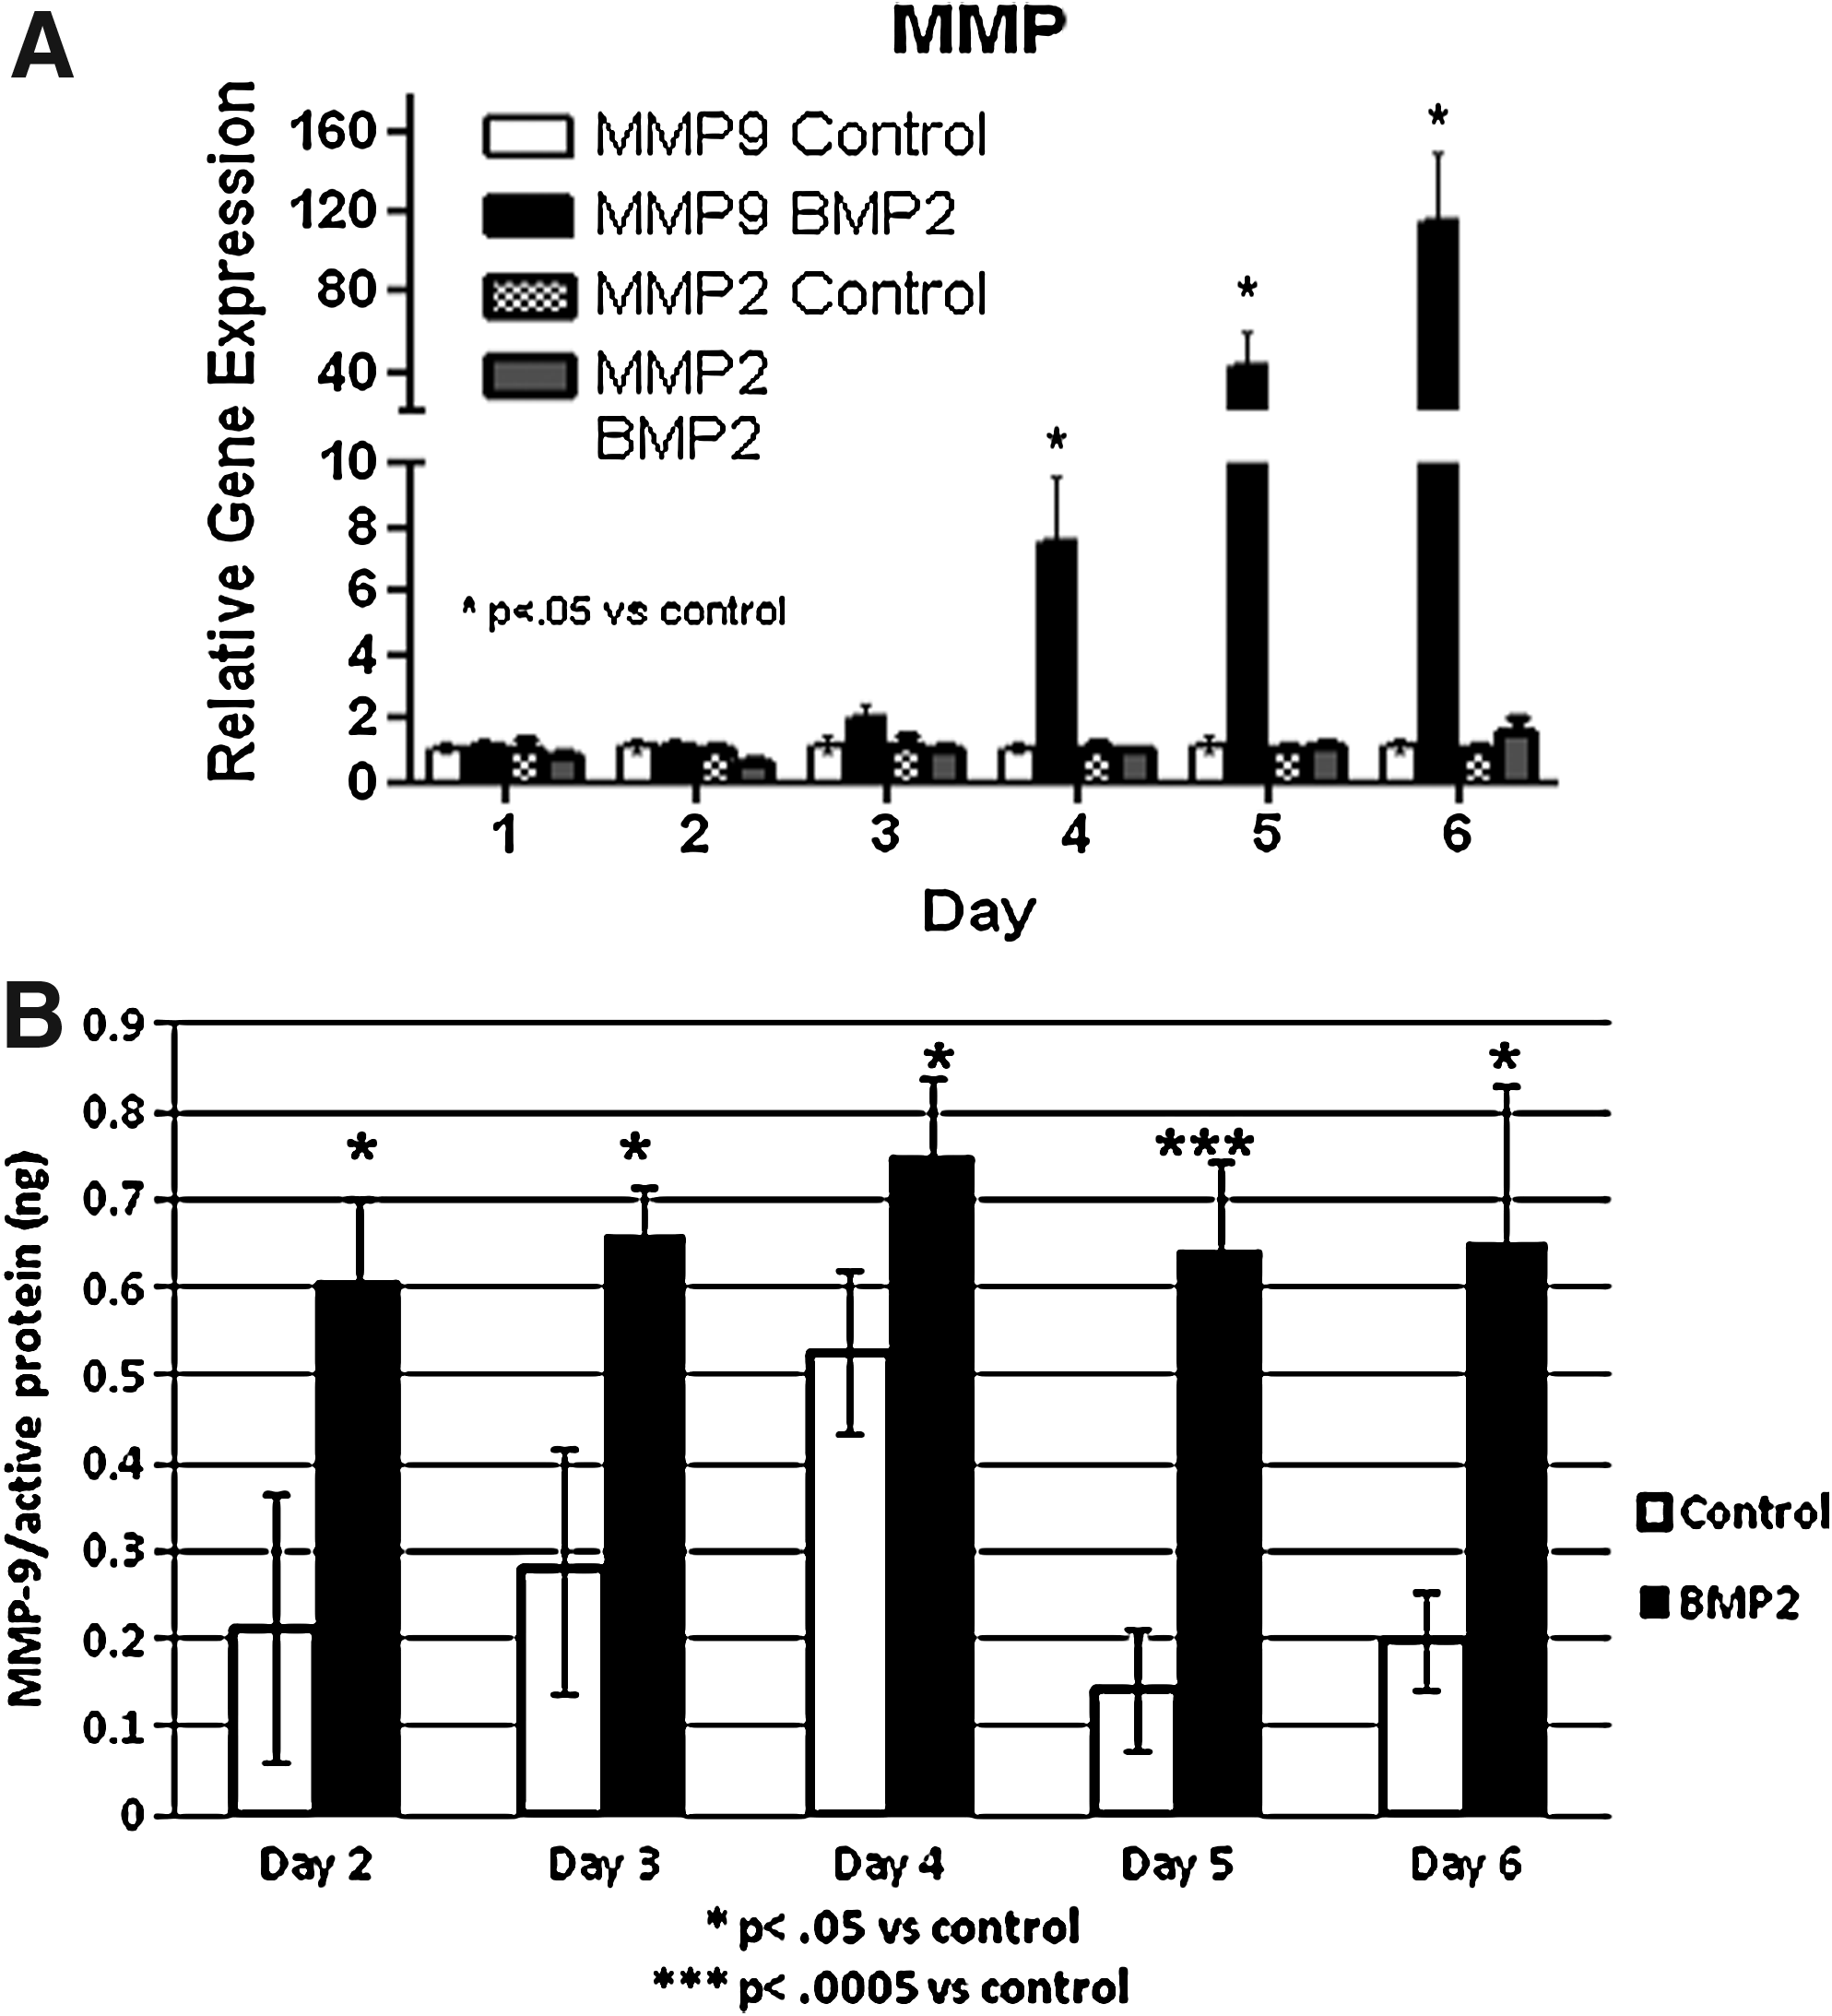
Since our molecular imaging reagent is based upon an inhibitor of active MMP-9 (see below), we chose to measure amounts of MMP-9 using an enzyme-linked immunosorbent assay (ELISA)-based system that detects only active MMP-9. The results shown in Figure 4B suggests that protein extracts isolated from tissues receiving the BMP2-transduced cells have significantly more active MMP-9 protein than those receiving control cells and that these elevated levels remained unchanged across the course of HO. The results collectively suggest that MMP-9 is activated by delivery of the BMP2-producing cells during all stages of endochondral bone formation. Further, this activation may be caused by cleavage and utilization of stored MMP-9 protein, immediately after induction of HO, but is then rapidly replaced by newly synthesized MMP-9. Activated MMP-2 remained below the level of detection (data not shown).
Molecular imaging agent for MMP-9
Synthesis and radiolabeling of 64Cu-M2
Conjugation of IRDye800CW to M1 was performed to yield the dual-conjugate M2. Reaction yields were 35%–40%, and sample purity was >90% as confirmed by analytical HPLC showing a retention time of 6.1 min for M2 compared to 5.9 min for M1 from the 280 nm channel and a single retention peak at 6.1 min for M2 from the 780 nm channel. There was no free dye in the sample as indicated by the lack of a peak at 5.4 min, which corresponds to the retention time of IRDye800CW. Mass spectrometry showed 1278.93 [M+H]2+ and 2555.9 [M]+ and was in excellent agreement with calculated values. Radiolabeling with 64Cu was achieved with high yield and purity as determined by radio-TLC and radio-HPLC. The presence of free copper by ITLC (Rf=0.9) was minor, and confirmation by radio-HPLC routinely showed high sample purity (96.5±1.9%); therefore, the resulting radiotracer was used without further purification for in vivo studies.
Stability studies
The in vitro stability of 64Cu-M2 was evaluated and is summarized in Table 1. Radio-HPLC analysis showed no peptide degradation at early (2 and 6 h) or delayed time points after incubation in PBS, with >98% of the sample still intact at 24 h postmixing. Similarly, the DTPA challenge study did not result in a significant dissociation of copper from the radiolabeled complex as shown by the high RCP of 64Cu-M2 (96.4%±1.1%) at 24 h after incubation. Serum stability studies were performed in mouse serum and the sample showed excellent stability at 2 and 6 h after incubation. However, a significant decrease in the RCP of 64Cu-M2 was observed at 24 h (53.7%±3.7%). No loss or breakdown of the fluorescent peak associated with the peptide was noted in any of the experiments (data not shown).
Data normalized to 100% at t=0 and presented as mean±standard deviation (n=3).
DTPA, diethylene triamine pentaacetic acid.
Zymography
Inhibition of MMP-9 by M1 and M2 was examined by zymography to determine the effect of DOTA and IRDye800CW conjugation. M1 exhibited similar inhibition compared to the previously described CTT inhibitor (data not shown). The presence of the IRDye moiety on M2 resulted in a 10-fold decrease in inhibitory effect compared to M1.
In vivo imaging
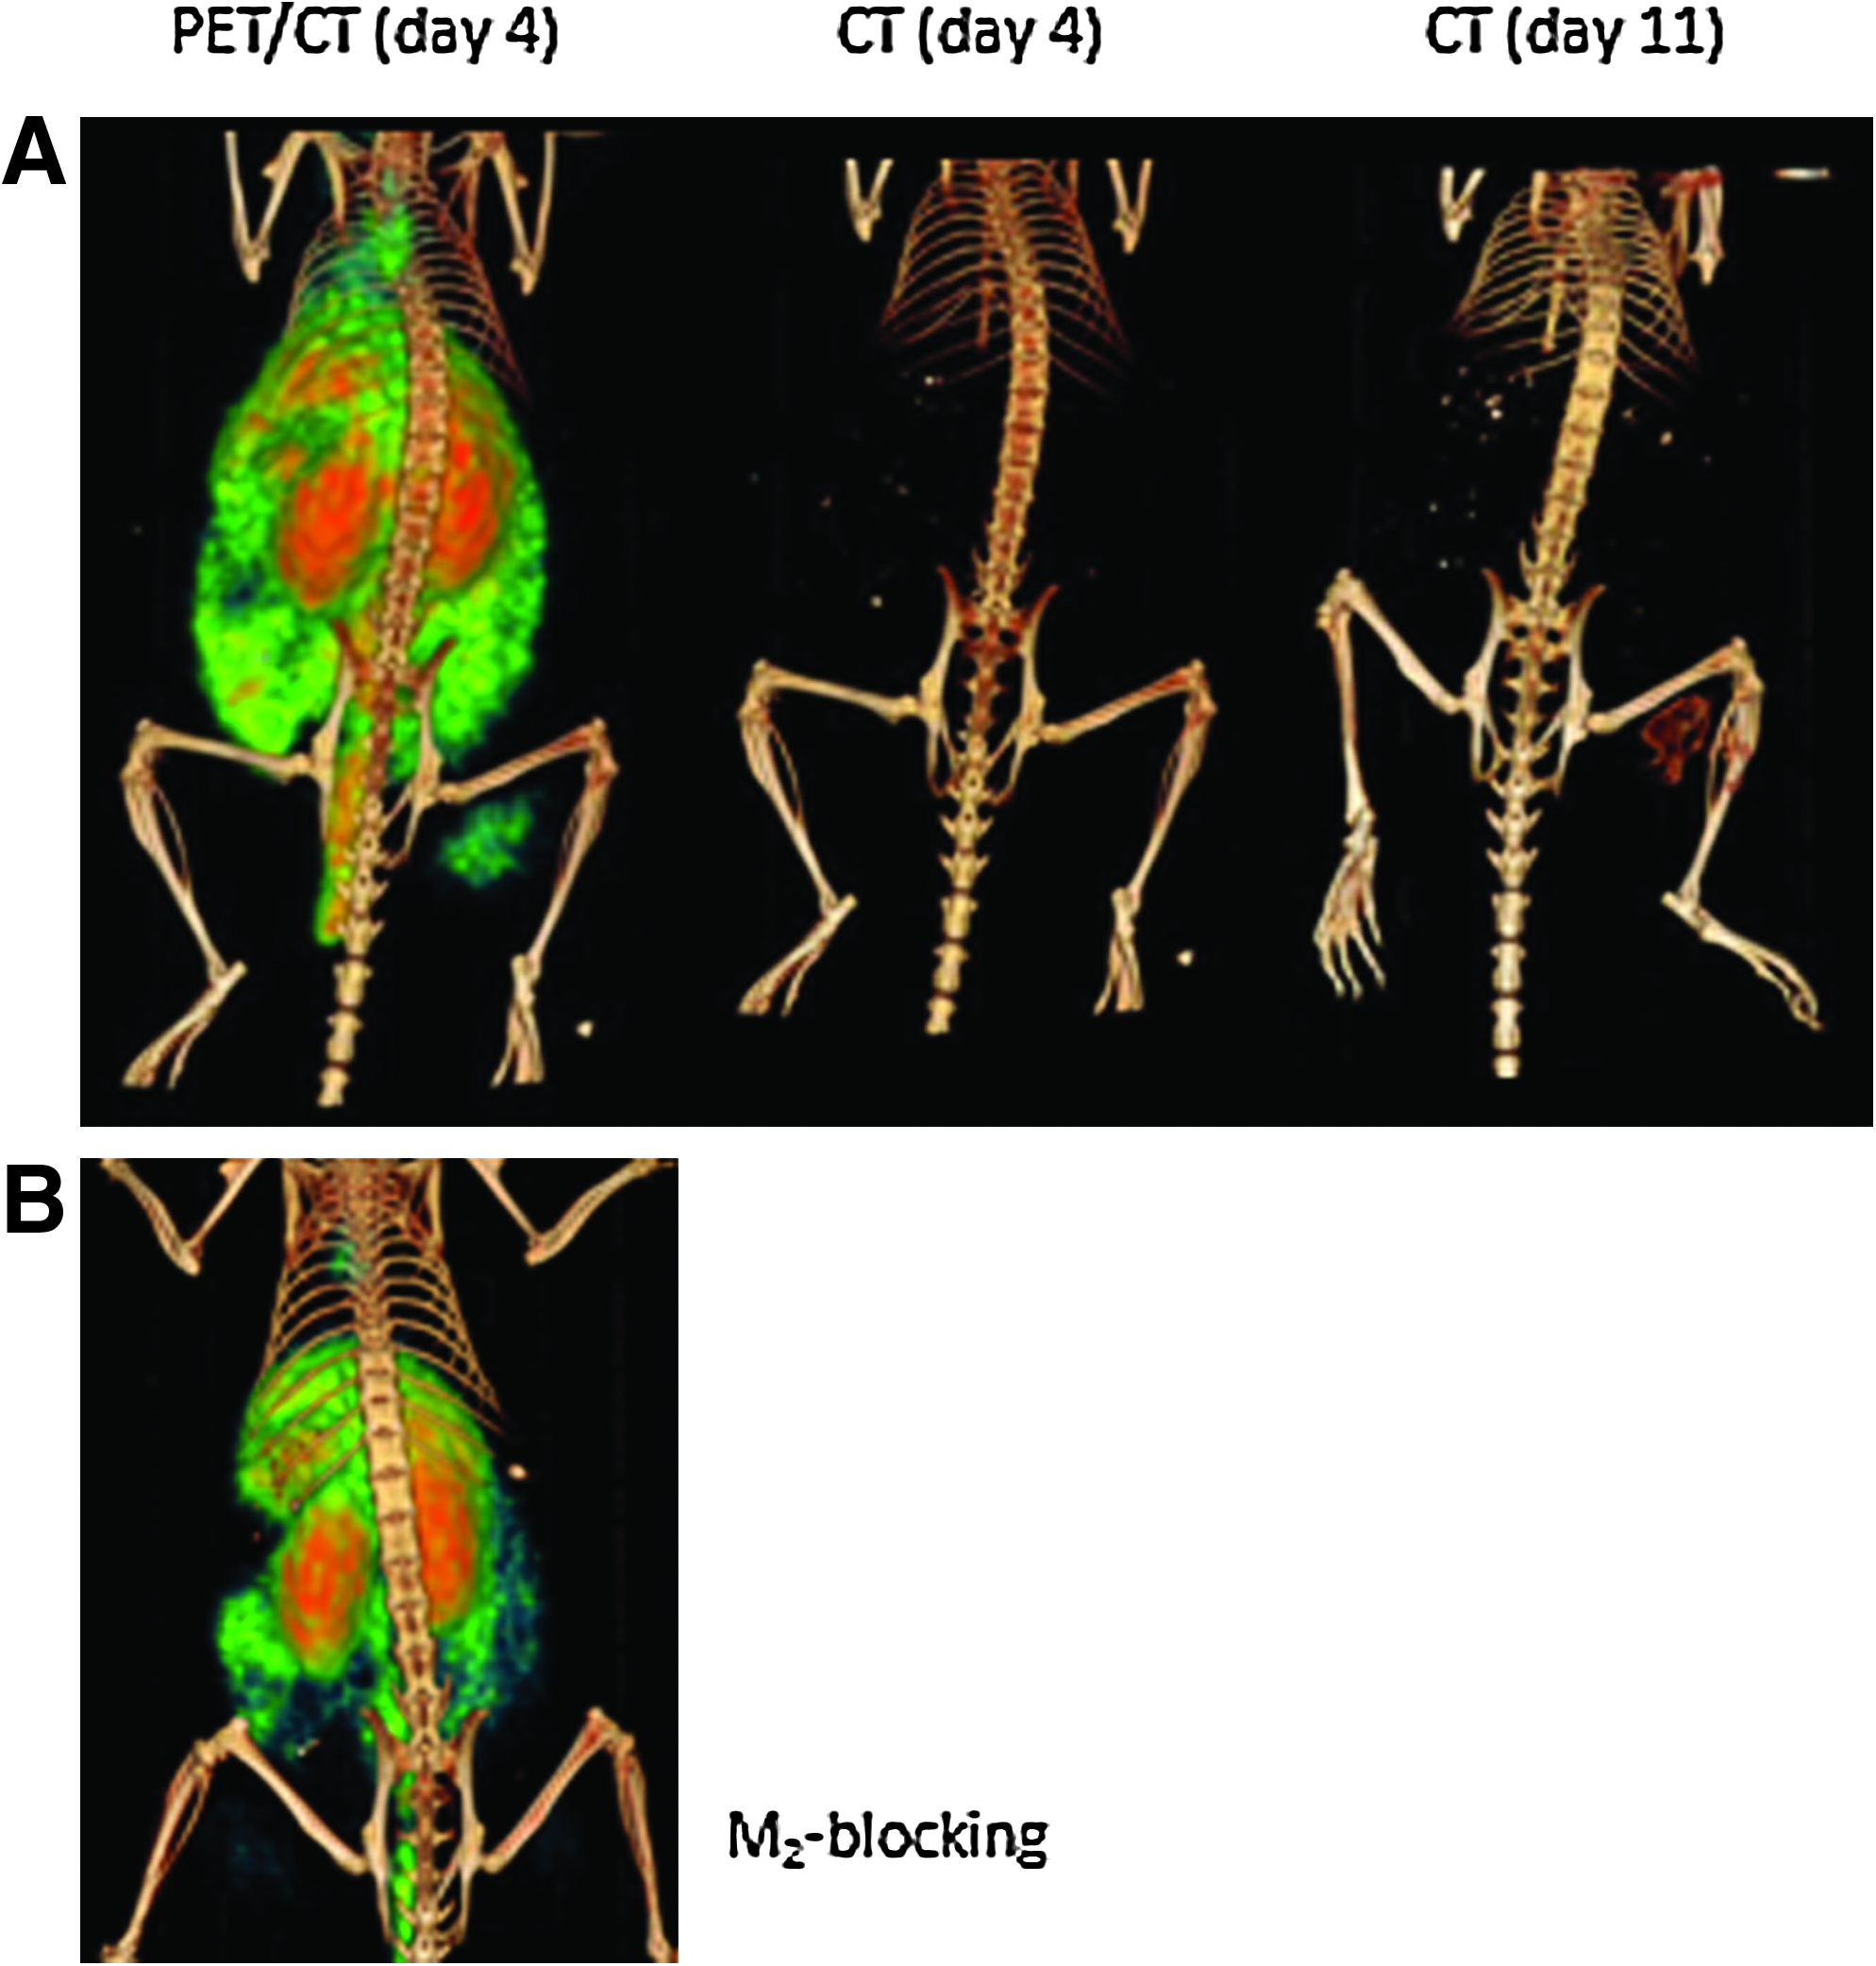
Figure 5 shows coronal slices from the μPET/CT images taken at day 4 postimplantation of the bone putty in comparison with μCT taken at day 11 postimplantation. At day 4, localization of 64Cu-M2 at the sight of AdBMP2-transduced cell implantation is evident by μPET, whereas the corresponding μCT scan does not show any indication of new bone formation. The follow-up μCT taken 7 days later shows the ectopic bone and corresponds to the same region of μPET signal. Table 2 shows that T/B ratio computed from μPET and NIR as well as the % injected dose/gram in the region inoculated with AdBMP2-transduced cells were maximum at day 4 after AdBMP2 cell implantation, although the results were not statistically significant. To confirm the specificity of tracer uptake for MMP-9, a blocking dose of M1 was administered before imaging that successfully inhibited uptake of 64Cu-M2 at the site of tissue remodeling associated with AdBMP2 cell injection. As shown in Table 2, the T/B ratio computed from μPET was reduced from 4.02±1.39 to 1.44±0.66 after the blocking dose, whereas a lesser reduction was noted in NIR fluorescence, due presumably to changing tissue optical properties of the unvalidated approach. The quantification of % injected dose/gram showed statistically significant reduction in 64Cu-M2 uptake after 200× excess M1. Bone formation was detected in these animals by μCT after another 7 days, confirming that the trace dosage of 64Cu-M2 (and perhaps 200-fold greater dose of M1) would not impact HO formation if MMP-9 activity were required for HO. The whole-body distribution of 64Cu-M2 showed slow clearance from circulation along with uptake in the liver and kidneys.
μPET/CT imaging of new bone formation with 64Cu-M2. (
Statistical significance from 4 h blocking study (p<0.05).
μPET, micro-positron emission tomography; CT, computed tomography; NR, near-infrared.
Figure 6 shows typical NIR fluorescence images of the dorsal view mice with right hind limb injected with AdBMP2 cells indicated by arrows and the left hind limb injected with Adempty cells. At 2 days after injection, there is minimal expression of MMP-9 in both control and BMP2 sides; however, maximal expression was observed in the tissue region with BMP-2 producing cells after 4 days. Expression diminishes at 6 days, indicating the transient expression of activated MMP-9. Also, NIR fluorescence could be detected in the contralateral region where a minor inflammatory response to the implantation was present at days 2 and 4.

Multimodality imaging of new bone formation with 64Cu-M2. Near-infrared fluorescence
Two days after injection of cells, the PET/CT scans (Fig. 6B) show moderate tracer accumulation with a T/B ratio of 3.29±0.9, reflective of uptake in the region of the control cell implantation and presumably due to inflammation. The T/B ratios at days 4 and 6 after inoculation of cells were 4.02±1.39 and 3.41±0.51, respectively, and were not significantly different. 64Cu-M2 uptake observed by PET was confirmed by 7-day follow-up CT images acquired on days 9, 11, and 13 postimplantation, respectively (Fig. 6C). The bone mass observed on the CT shows excellent correlation with the corresponding μPET/CT scan in terms of anatomical position, shape, and size. The data collectively suggest that detection of MMP9 can identify HO formation before radiological detection.
Discussion
In these studies we have used a relevant model of HO, importantly responsive to BMP2 level, to study ways to image the early events in HO. Since the level of BMP2 delivered in our model is approximately 10-fold higher than physiological levels and 100-fold lower than recombinant BMP2 models, 18 we believe that this model is the state of the art for HO induced by traumatic injury as seen in the military population. This is the first report to use the combination of in vitro and in vivo assays to find a diagnostic and potential therapeutic target of early HO before the appearance of cartilage and/or osteoid matrix. This technology is based on noninvasive μPET and NIR fluorescence imaging of the soft tissues to detect expression of MMP-9. Other imaging studies of tissue regeneration have used different labeled gelatinase inhibitors and activatable fluorescent agents to evaluate (i) the macrophage involvement in atherosclerotic plaques,19–21 and their response to experimental therapeutics,22,23 (ii) the presence and expansion of abdominal 24 and intracranial aneurysms, 25 (iii) the remodeling of cardiac tissues after myocardial infarct, 26 and (iv) cancer detection. 12 Indeed, MMPs contribute to all types of tissue remodeling, including the vasculature, and are often found associated with angiogenesis, including that found during tumor formation.
MMPs are also involved in regulating the inflammatory response, through regulation of transforming growth factor β. 27 MMPs are a family of proteases, which are formed as proproteins, and can be stored in an inactive form until further processed upon activation. This activation requires additional proteases, and often leads to additional regulation of their function. Inflammatory neutrophils 28 have been shown to produce pro-MMP-9, which is then activated by chymase from mast cells.29,30
The tissues staining positive for MMP-9 were taken immediately after induction (24 h) and appeared to be associated with the nerve. MMP-9 expression may be reflective of the nerve remodeling, whereas control tissues were not nerve-associated but had a more generalized localization. One may speculate that the control tissues lacking BMP2 were not capable of undergoing the neuro-inflammatory response known to be induced by BMP2 (Salisbury et al., unpublished) and alternatively launched a different inflammatory response, which would not lead to bone and cartilage formation. An example of neuro-inflammation is the dysregulation of the neural stem cell pathways by neurologic inflammation in autoimmune encephalomyelitis and in multiple sclerosis. 31 Our immunohistochemical staining suggests neuro-inflammation as part of the early HO process. For example, the level of MMP-9 expression greatly dropped in the control tissues, with only a small nidus of MMP-9-positive cells clustered into a specific structure that were possibly involved in the removal of the Adempty-transduced cells. However, in the tissues receiving AdBMP2 cells, the MMP-9-positive cell staining appeared first at the nerve and subsequently throughout the region of new bone and cartilage. MMP-9 appears to be expressed by cells throughout the tissues by days 5–7 after induction, which is the time when cartilage matrix is present within the tissues. These results are consistent with the known role of MMP-9 and MMP-13 in endochondral bone formation through the degradation of cartilage matrix, for replacement with osteoid (reviewed in ref. 9 ).
In this study the molecular imaging agent detects the activated form of both MMP-9 and MMP-2 as demonstrated by Koivunen et al., 10 Sprague et al., 12 and Wang et al. 13 (as well as confirmed from gelatin zymography) and does not employ a cleavable peptide sequence for reporting. 26 However, analysis of the tissues for both MMP-2 and MMP-9 activity suggested that the agent was probably detecting only MMP-9 since MMP-2 RNA and protein were undetectable. The fact that new bone formation was observed in all animals after AdBMP2 cell inoculation with corresponding 64 Cu-M2 uptake suggests that at the trace doses administered, the inhibition of MMP-9 by the peptide was not sufficient to disrupt the process of HO. Indeed, animals receiving a 200-fold excess of M1 in the blocking studies showed an expected decrease in 64Cu-M2 uptake, but still exhibited bone formation after 7 days as determined from μCT. While we did not assess the volume of bone formed to evaluate whether a reduction in HO occurred with dose of excess peptide inhibitor, a dose escalation study would be needed to assess the dose for therapeutic inhibition.
The positive μPET and NIR imaging signal within the tissues was detected as early as 2 days after induction and continued throughout the entire process of endochondral bone formation. These findings correlate with the ex vivo data showing active MMP-9 within the tissues, which was also found to be significantly elevated on all days. Interestingly, multiple animals from the day 2 group had notable tracer accumulation in the control region, which then disappeared by day 4. The positive expression was not supported by our ex vivo quantification; however, we did observe elevated levels of MMP-9 protein within control tissues on day 1, which subsequently dropped. The result suggests that perhaps an initial, generalized inflammatory response was caused by the delivery of the adenovirus-transduced cells, inducing transient MMP-9 expression within the control that could not be sustained in the absence of the BMP2 stimulus. The data suggest that the μPET analysis was even more sensitive at detecting MMP-9 expression within the tissues than either the ELISA or activity assays that were used for quantification. Since protein extracts were isolated from the entire tissue, considerable dilution may occur from inclusion of regions of the muscle not involved with the HO. Analysis of the tissues histologically shows a significant cellular response to the foreign cells, further supporting the imaging findings.
Although MMP-9 RNA expression is significantly elevated at the time of cartilage remodeling, just before bone matrix deposition, it is interesting that the μPET and NIR signal also appears to detect the expression observed at earlier times in this assay. As seen in Figure 6, the μPET signal appears to be associated with a small region within the tissues, which co-localizes to the region of the injected cells. Further, tracking of the expression until the appearance of bone radiologically suggests that the region of MMP-9 expression within the tissues maps to the new bone. This is not surprising since the bone matrix has been known to be formed at the site of cartilage remodeling. What is intriguing is that the earlier nerve and vascular remodeling possibly detected by μPET is also mapping to the approximately same shape and size as the resultant bone formed during HO. The data suggest that HO is a localized event, and that intervention would perhaps be most selective if one were able to target the specific location. Furthermore, the results suggest that observation of MMP-9 activity by μPET or NIR can provide an early indication of HO formation at the molecular level, and if a treatment were available, provide early diagnostics on its efficacy. Although we observed an initial positive signal in the control region due to the inflammatory response launched by delivery of the adenovirus-transduced cells, the inflammation and corresponding tracer uptake were transient. Tracer uptake related to HO, on the other hand, was evident within the tissues throughout the HO process.
The application of molecular imaging techniques to detect regions of soft tissues undergoing early HO in humans could represent a major advancement enabling early intervention. With the ability to better identify these regions, strategies that specifically target key molecules could be implemented and lead to the development of effective therapies and conversely to stimulate bone regeneration in a controlled manner that involves the ECM.
Footnotes
Acknowledgments
Grant support: Defense Advanced Research Projects Agency (W911NF-09–1–0040) and Department of Defense (W81XWH-07–0281 and W81XWH-07–1–025). We thank Rita Nistal for performing the histology and Holly Robinson for assisting with the animal imaging.
Disclosure Statement
No competing financial interests exist.