
Abstract
Differentiation of embryoid bodies (EBs) into particular cell lineages has been extensively studied. There is an increasing interest in the effect of soft hydrogel scaffolds on the behavior of EBs, such as the initial adhesion, dynamic morphology change, and differentiation. In this study, without adding any other bioactive factors in the serum-containing medium, dynamic behaviors of mouse EBs loaded on the surface of hydrogels with different surface charge and chemical structures are investigated. EBs adhered quickly to negatively charged poly(sodium p-styrene sulfonate) (PNaSS) hydrogels, which facilitates EBs spreading, migration, and differentiation into three germ layers with high efficiency of cardiomyocytes differentiation, similar to that on gelatin coated polystyrene (PS) culture plate. While on neutral poly(acrylamide) (PAAm) hydrogels, EBs maintained the initial spherical morphology with high expression of pluripotency-related markers in the short culture periods, and then showed the significantly greater levels of selected endoderm markers after long-time culture. EBs cultured on negatively charged poly(2-acrylamido-2-methyl-propane sulfonic acid sodium salt) (PNaAMPS) gels demonstrated the analogous behaviors with that of neutral PAAm gels at early differentiation phase (day 4+1). Then, their adhesion, spreading and differentiation were quite similar to that on negatively charged PNaSS gels. The correlation between surface properties of hydrogels and EBs differentiation was discussed.
Introduction
As effective scaffolds, hydrogels are useful for promoting stem cell growth and differentiation toward the formation of tissues due to their structural similarity to macromolecular-based extracellular matrix (ECM) in biological tissue.13,14 Many types of hydrogels have been used as scaffold materials for embryonic stem (ES) cell differentiation, such as poly(ethylene glycol), poly(vinyl alcohol), poly(hydroxyl ethyl methacrylate), and poly(acrylamide) (PAAm) hydrogels.1,15 While these hydrogels are nontoxic and do not activate a chronic immune response, they also do not readily promote cellular adhesion and function, because most cells do not have receptors to hydrogel forming polymers. 16 Further, because of the hydrophilic nature of hydrogels, ECM proteins such as fibronectin (FN), laminin (LM) and vitronectin typically do not absorb to the gel surface. 17 Therefore, various cell-interacting components, such as ECM molecules, small peptide, and glycoproteins need to be incorporated to these culture systems.18,19 Combining with appropriate mechanical properties, chemical composition and biological signals, synthetic hydrogels have been modified and designed in a variety of ways to create suitable microenvironment for controlling ES cells differentiation toward preferential specific lineage.20–22
On biomaterial surfaces, cell behaviors are considered to be determined by the balance of the cell–cell adhesion and cell–substrate adhesion. 23 Relatively weaker cell–cell adhesion and higher cell–substrate adhesion enhance the spreading of multicellular aggregates into a monolayered morphology on substrates. 24 Conversely, weaker cell–substrate adhesion favors the formation of spheroidal micro tissues from dispersed cells on the surface of biomaterials.25,26 During cell–substrate interplay, the formation and evolution of focal adhesion (FAs) were ongoing, which not only provides physical links between ECM and intracellular cytoskeleton via membrane-bound receptors but also involves in a lot of signal transduction mechanisms through plaque proteins, such as vinculin, talin and paxillin. 27 The cooperation between signaling pathways triggered by soluble factors, such as growth and differentiation factors, and ECM proteins have been shown to determine cell proliferation and differentiation.28,29
Our previous studies have shown that the amount of negative charges of hydrogels has a substantial influence on the behaviors of cells.30–33 It has been found that negatively charged hydrogels, such as poly(2-acrylamido-2-methyl-propane sulfonic acid sodium salt) (PNaAMPS) and poly(sodium p-styrene sulfonate) (PNaSS), are suitable scaffolds for endothelial cell culture. When the gel was negatively charged with an absolute Zeta potential value higher than 20 mV, endothelial cells can adhere, spread, proliferate, and finally reach confluence on the gel surface, without any modification of cell adhesive protein.30–33 On the other hand, the dedifferentiated chondrocytes can spontaneously be re-differentiated to chondrocytes cells on neutral and low-charge-density hydrogels. 34 Moreover, negatively charged gels can induce chondrogenic differentiation even in the insulin-free maintenance medium, while the neutral gels showed better performance for chondrogenic aggregation and differentiation when the inducible factors were added in the culture system. 35 Based on these previous studies, we assume that the EBs behavior may be substantially affected by the surface properties of hydrogels. However, there is little study about the effect of negatively charged hydrogels on ES cells differentiation, not to mention on EBs behavior.
In this study, we investigate the behaviors of EBs on three kinds of synthetic hydrogel scaffolds with different chemical structures: two negatively charged hydrogels with sulfonic acid moieties, PNaAMPS, and PNaSS hydrogels, and one neutral hydrogels, PAAm. The PNaSS hydrogel is selected for its high hydrophobicity while PNaAMPS is very hydrophilic, although both contain the negative charge. EBs were loaded on these three hydrogels and on a gelatin-coated polystyrene (PS) and incubated in chemically defined ES culture medium without adding of Leukemia inhibitory factor (LIF), an inhibitor against differentiation, and any other bioactive factors. As a result, it was discovered that the EB behaviors strongly depend on the surface charge and chemical structures of hydrogels. On the negatively charged PNaSS gels, EBs immediately adhered, spread, and spontaneously differentiated into three germ layers, especially with high efficiency of cardiomyocytes differentiation. On the neutral PAAm gels, the spherical shape and size of EBs were well maintained with high expression of pluripotency at the short culture time (<3 days) and then the EBs differentiated into endoderm cells for the long culture period. EBs on PNaAMPS gels showed behaviors similar to that on PAAm gels at a short period while their long-standing behaviors were more similar to that on PNaSS gels. These results have an implication in promoting tissue-engineered constructs through making use of hydrogel scaffolds with different surface charge and chemical structures.
Materials and Methods
Materials
2-Acrylamido-2-methyl-propane sulfonic acid sodium salt (NaAMPS) as a monomer, was obtained by neutralization of 2-Acrylamido-2-methyl-propane sulfonic acid (AMPS; kindly provided by Toagosei) with sodium hydroxide in ethanol, and purified by recrystallization from acetone. Sodium p-styrene sulfonate (NaSS; Tokyo Kasei Kogyo), as a monomer, was purified by recrystallization from ethanol, dried at 25°C in a vacuum. Acrylamide (AAm; Junsei Chemicals) was purified by recrystallization from chloroform. N, N′- methylenebis-(acrylamide) (MBAA; Tokyo Kasei Kogyo), as a cross-linker, was purified by recrystallization from ethanol. 2-Oxoglutaric acid (Wako Pure Chemicals), sodium chloride (Wako Pure Chemicals), and sodium hydrogen carboxyl (Junsei Chemicals) were used as purchased.
Hydrogel preparation
Sheet-shaped homopolymer hydrogels, PNaAMPS, PNaSS, and PAAm gels were synthesized by radical polymerization. The chemical structures of PNaSS, PNaAMPS, and PAAm are shown in Figure 1. An aqueous solution of 1 M monomer, the prescribed amount of MBAA (as a cross-linker) and 0.1 mol% 2-oxoglutaric acid (as an initiator) were purged with argon to eliminate the inhibition effect of oxygen for polymerization. The amount of cross-linker, relative to the amount of monomer, varied for hydrogels. Specifically, 4 mol% MBAA was used for synthesis of PNaAMPS and PAAm gels, and 10 mol% MBAA for PNaSS gels. The precursor solution was poured into a reaction cell consisting of a pair of glass plates, separated by a silicone spacer of 1.0 mm thickness. The solution was irradiated with UV light (wavelength, 365 nm) to facilitate polymerization at room temperature for 6 h. 30
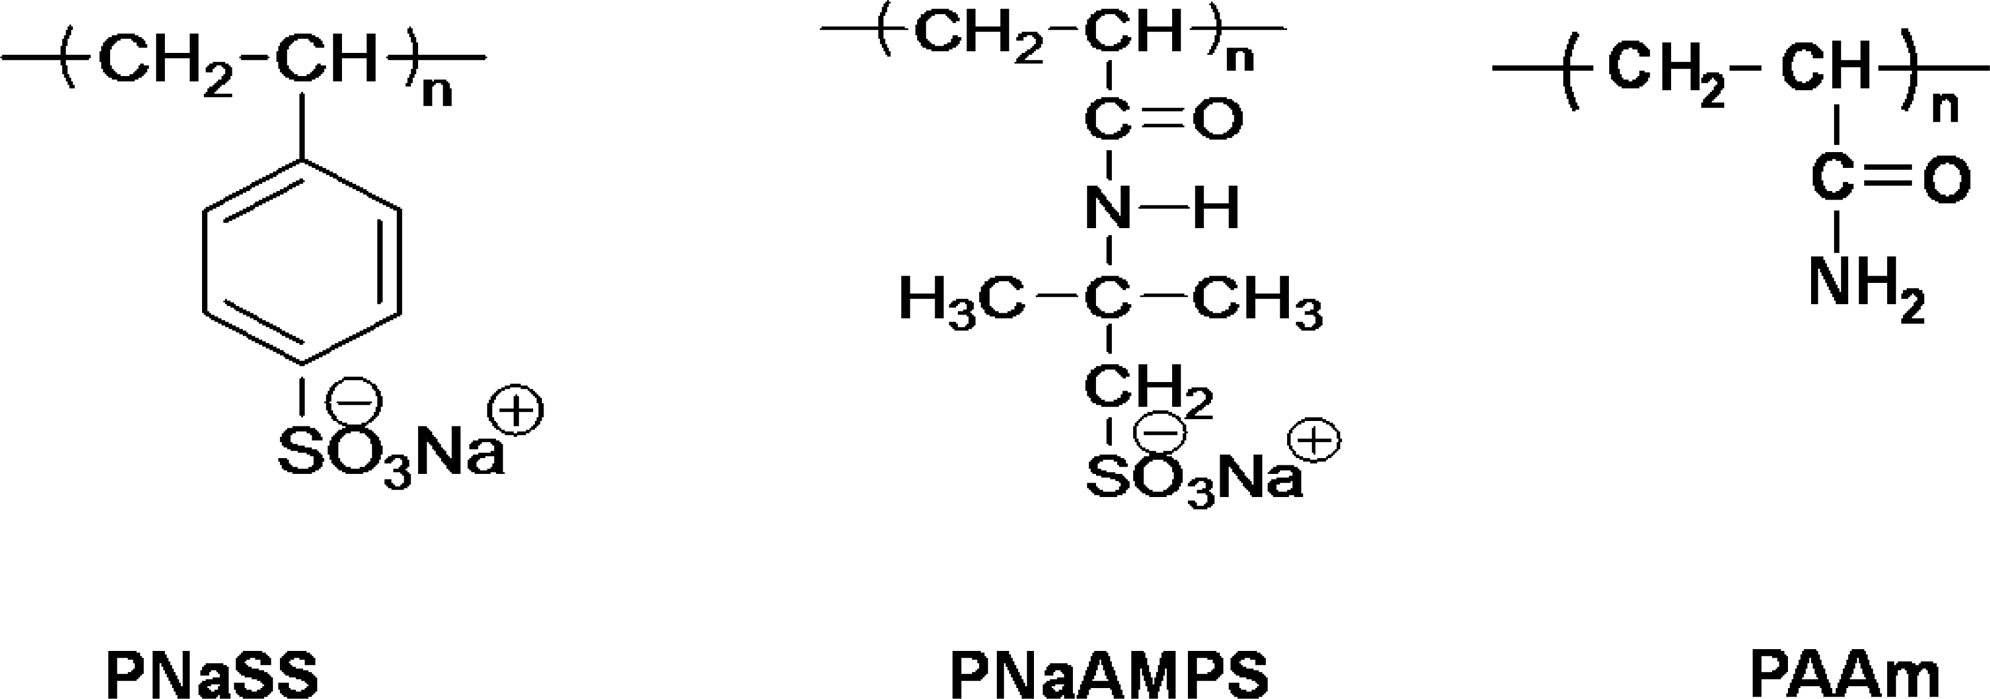
Chemical structures of polymers used in this study.
After gelation, the gels were separated from the glass plates and immersed in a large amount of normal saline for 1 week and the solution was changed two times twice daily to remove un-reacted residual chemicals. The gels were then immersed in HEPES (Sigma-Aldrich) buffer solution (HEPES, 5×10⁻³ M; NaHCO3, 1.55×10⁻² M, NaCl, 0.14 M, pH 7.4). Phenol red (0.4% v/v) (Sigma-Aldrich) was used to visualize the pH of gels. After reaching equilibrium, the pH and ionic strength of the solution containing in the gels were adjusted to pH 7.4 and ∼0.15 M, respectively. Gel disks were punched out by a hole-punch with a radius of 7.5 mm. After being sterilized by autoclaving (120°C, 20 min), the gel disks equilibrated in HEPES solution were placed in a 24-well PS tissue culture dish (Iwaki & Co., Ltd.) for cell culture.
Mechanical evaluation of hydrogels
The elastic modulus of these hydrogels was evaluated by compression test with a tensile compressive tester (Tensilon RTC-1310A; Orientec, Co). The gel discs (15 mm diameter; 0.5–2.0 mm thickness) was set on the lower plate and compressed by the upper plate of the attachment, which was connected to a load cell, at a strain of 10% thickness/min. The elastic modulus was then determined by the average slope of the stress-strain curve over the strain range of 0–0.1. 36
The degree of swelling q was measured as the weight ratio of the gel in its equilibrated state in HEPES buffer solution to that in its dried state. Each value was averaged over at least three parallel measurements. Table 1 is the elastic modulus E and the degree of swelling q of hydrogels in HEPES buffer solution. Each value was averaged over at least three parallel measurements.
PAAm, poly(acrylamide); PNaAMPS; poly(2-acrylamido-2-methyl-propane sulfonic acid sodium salt); PNaSS, poly(sodium p-styrene sulfonate).
Detection of ECM proteins adsorbed onto the surfaces of hydrogels
The amount of proteins that adsorbed on the surface of different hydrogels from the cell culture medium was characterized. The HEPES buffer-balanced gel disks with a diameter of 15 mm, thickness of ∼2 mm were exposed to 1 mL mouse ES cell culture medium for 6 h at 37°C in a humidified atmosphere with 5% CO2. Total protein adsorptions were detected using Nano Drop 1000A Spectrophotometer (Thermo Fisher Scientific) at A280. The adsorption of Dulbecco's modified Eagle's medium (without HEPES) was used as background, and that of mouse ES cell culture medium as prepared was regarded as an initial value. The amount of adsorbed protein was determined by the difference before and after contact with the hydrogels. Then the percentages of total protein adsorption on each hydrogels were calculated and compared.
The amount of ECM proteins, such as FN, collagen I (Col I), and LM adsorbed on the surface of different substrates were quantitatively characterized via immune-fluorescence. After being exposed to the culture medium and washed with phosphate-buffered saline (PBS; Gibco), the gel disks and geltatin-coated PS were fixed with 4% paraformaldehyde for 20 min at room temperature, rinsed twice with PBS buffer and blocked with 0.5% (w/w) bovine serum albumin (BSA). The primary antibodies, rabbit anti-FN (Chemicon), rabbit anti-Col I (Chemicon) and rabbit anti-LM (Sigma), diluted in PBS-BSA (0.5%), were incubated for 2 h at 37°C. Samples were then rinsed three times with PBS-BSA 0.5% and incubated with secondary fluoresceine-isothiocyanate (FITC)-conjugated goat anti-rabbit-IgG antibody (Chemicon). Finally, samples were rinsed with PBS and observed by fluorescence confocal laser scanning microscope (Eclipse TE2000-E; Nikon) equipped with a 20×objective. The fluorescence intensity differences between the gels incubated in a culture medium, corresponding to the amounts of absorbed FN, Col I, and LM on gel surfaces were measured. 37
Routine culture of mouse ES cells
MGZ 5 ES cells, as derivatives of MG1.19 cells were maintained and cultured as previously described.38–40 The ES cells were maintained in Dulbecco's modified Eagle's medium (without HEPES; IBL Co., Ltd), supplemented with 20% fetal bovine serum (Gibco), 1×nonessential amino acid, 1×nucleosides mix (Chemicon), 5×10⁻⁵ M β-mercaptoethanol (Chemicon), and 1000 unit/mL LIF (Chemicon). The culture dishes (Iwaki & Co., Ltd.) were prepared prior to cell seeding by coating with a solution of 0.1% porcine gelatin (Sigma-Aldrich) in PBS (Gibco-BRL). All cultures were performed at 37°C in a humidified atmosphere of 5% CO2. After 2–3 days, ES cells were routinely passaged. The culture medium was changed every day. All mouse ES cells were used between passages 15–25.
Culture of EBs on different substrates
EBs were formed by hanging drop culture and suspension culture methods.41,42 First, hanging drop cultures were prepared to use 30 μL droplets, each containing the number of ES cells desired to indicate the EB (∼1000). ES cells were allowed to aggregate in hanging drop for 2 days before transfer to liquid suspension cultures. Two days cultured EBs were removed from the droplets and cultured as suspension in 10 cm bacterial dishes (Iwaki & Co., Ltd.) for 2 days. In this 4-day culture process, LIF was removed from the medium. After 4-day culture, the average cell number per EB was 62,700, with the diameter of about 600 μm. The viability characterization of EB was performed before seeding onto the gel surfaces. These EBs were used for the next experiment.
The gel disks were placed in a 24-well PS tissue culture dish and balanced in the mouse ES cell medium (without LIF) for at least 12 h. After changing the culture medium, each EB was seeded onto the center of hydrogel surfaces and then cultured in the same medium with EB formation. EBs on neutral PAAm hydrogels were chosen as the comparison with EBs on negatively charged PNaAMPS and PNaSS hydrogels. Besides, EBs seeded onto a gelatin (0.1%)-coated 24-well (PS) culture plate was considered as a control for comparison with EBs on hydrogels. At least 20 EBs were loaded on each of substrates. All of EBs were cultured until about 1 month in the same maintenance medium (without LIF) at 37°C in a humidified atmosphere with 5% CO2. The following experiments on each substrate were repeated at least three times. To study the effects of hydrogels on EBs behavior, no other bioactive factors were added to the culture medium.
Cell viability assay
Before seeding onto the gel surfaces, the majority of cells within EB were viable while some dead cells sparsely distributed throughout the EBs, which indicated the relatively homogenous properties of initial EBs. After EBs were cultured on different substrates, the percentage of live cells within EBs at different times was quantitatively assessed by using the same method previously used to assay CNS stem and neural progenitor cell viability when cultured inside of collagen scaffolds. 43
Cell viability of EBs was assessed before seeding on the substrates, using Calcein AM/EthD-1 Live/Dead Viability/Cytotoxicity Kit (Molecular Probes). Calcein AM limitedly stains live cells via their intracellular esterase activity, producing an intense uniform green fluorescence (ex/em ∼495 nm/∼515 nm). EthD-1 specifically stains dead cells with damaged membranes, producing a bright red fluorescence (ex/em ∼495 nm/∼635 nm). Reagents were diluted according to the protocol and incubated 30 min in the serum-free medium. Images were recorded by a fluorescent microscope (Olympus).
Dynamic image analysis
Mouse ES cells and EBs were observed and recorded at varied culture time by a phase contrast microscope (Olympus) equipped with a digital camera (Olympus) using 20×, 10×, or 4×objective lens. In this study, the initially formed spherical EB that adhered on the gel surfaces was judged by shaking the tissue culture dish after loading on different substrates. After shaking, EBs that remained on the gel surface with unchanged location were considered as adhered on the gel surface. Otherwise, EBs were considered as suspension culture. EBs monitoring was first performed at 6 h, and then monitored every day for 2 weeks. The scattered cell area (A) and perimeter (P) of EBs on different scaffolds were measured by image-pro plus 6.0 software.
The beating rates and area in spontaneous cardiomyocytes were measured through the video taken by the phase-contrast microscope (Olympus, IX71), using the image-pro plus 6.0 software. Each data point represents the mean±standard error of the mean (SEM). The methods have been previously introduced by other researchers.44,45
Detections of alkaline phosphatase
Alkaline phosphatase (AP) Detection Kit (Sigma-Aldrich, 86R-1KT) was used as a specific and sensitive tool for the phenotypic assessment of ES cell differentiation by the determination of AP activity. 46 The mouse ES cells cultivated in the medium with LIF, the initially formed EBs, and EBs cultured on the surface of hydrogels in the medium without LIF were fixed and stained following the procedures provided by the kit.
EBs cultured on different substrates were collected at different times, and digested with trypsin-EDTA. AP of EBs was quantitatively assessed by Quantitative Alkaline Phosphatase ES Characterization Kit (Milipore, SCR066). Under alkaline conditions (pH>10), AP can catalyze the hydrolysis of p-nitrophenylphosphate into phosphate and p-nitrophenol, a yellow colored by-product of the catalytic reaction. The amount of AP can thus be reliably quantified by reading the amount of p-nitrophenol amassed after the catalytic reaction at 405 nm on a spectrophotometer. For each time point, approximately, 20,000 cells were assayed in triplicate as per protocol instructions.
Reverse transcription–polymerase chain reaction and real-time polymerase chain reaction
The gene expression level of a group of candidate pluripotency-related genes, named as Nanog homeobox (Nanog), Oct-4, SRY-box containing gene 2 (Sox2), developmental pluripotency associated 5A (Dppa5a) 47 were analyzed as the followed process. The cells of EBs were brushed off from each substrate and total RNAs were extracted using TRIzol (RiboPure kit, Ambion, AM1924) following the manufacturer's instruction. One microgram of total RNA per 20 μL of reaction volume was reverse transcribed into cDNA using the PrimeScript RT reagent Kit (Takara, RR037A). Real-time polymerase chain reactions (PCRs) were performed and monitored using the SYBR Green PCR Mastermix and PCR apparatus (Takara, TP800). cDNA samples (2 μL for total volume of 25 μL per reaction) were analyzed for gene of interest and for the reference gene glyceraldehyde-3-phosphatedehydrogenase (GAPDH). The level of expression of each target gene was then calculated as previously described. 37 The results were normalized to those of subcultured pluripotent mouse ES cells. Each sample was repeated at least three times for each gene of interest. Reverse transcription–PCR was performed at 95°C for 2 min followed by 34 cycles of 30 s denaturation at 95°C, 30 s annealing at the primer specific temperature, and 1 min elongation at 72°C. The PCR primers were provided by Takara Corporation.
To clearly confirm the differentiation profiles on different scaffolds, the ectoderm-, mesoderm-, and endoderm-related expressions were evaluated. The expressions of ectoderm relative markers were analyzed, including nestin (Nes), Sex determing region Y-box 1(Sox1), orthodenticle homolog 1(Otx1), and neurogenic differentiation 1 (NeuroD). The selected endoderm expressions were analyzed, such as alpha-fetoprotein (AFP), transthyretin (Ttr) and Albumin (Alb) genes. Moreover, the four mesoderm lineage markers were selected, including MyoD family inhibitor domain containing (mdfic), E-cadherin, Brachyury T (Bry T), and Dickkopf homolog 1 (Dkk-1), which will play important roles in mesoderm development. The cardiomyocyte-related markers were also analyzed, including early cardiac markers of Gata-4, Nkx2.5, and late cardiac markers of α-actin(c), and cardiac troponin T(c-TnT). The information about primers was shown in Table 2.
Fwd, forward; Rev, reverse.
Immunofluorescence staining
For the staining of cytoskeleton and FAs as well as cardiomyocyte-related markers, EBs cultured on different substrates (day 4+10) were transferred to gelatin coated cover-glass and grown for another 2 days, and then the specimens were rinsed with 1 mL chilled PBS for 10 min. 44 For fixation, the specimens were immersed in 200 mL 3.7% paraformaldehyde in PBS for 10 min, followed by permeabilization with 200 mL 0.2% Triton X-100 in PBS for 10 min, and then rinsed with 1 mL PBS buffer for 5 min. The specimens then were blocked with 5% Goat serum in PBS solution (1 mL) for 30 min. For actin fiber staining, the specimens were stained with 200 mL rhodamine-conjugated phalloidin (5 U/mL; Molecular Probes) for 1 h at 37°C in a humidified atmosphere of 5% CO2. For the immunostaining of sarcomeric α-actinin and FAs, the specimens were incubated with a primary antibody against sarcomeric α-actinin (1:300; Abcam), vinculin (1:600; Sigma) overnight at 4°C. Then FITC-conjugated Goat-anti-rabbit IgG secondary antibody (1:500; Chemicon) were added for 1 h at 37°C in a humidified atmosphere of 5% CO2, then washed three times with 1 mL PBS for 5 min. To stain the cell nuclei, the cells were incubated in 2 μg/mL Hoechst 33258, followed by rinsing with PBS. The images were recorded with a fluorescence microscope (Eclipse TE2000-E; Nikon).
Statistical analysis
Data are expressed as mean±the standard error of the mean (SEM) over n≥3 samples. Statistical significance was determined by analysis of variance (ANOVA single factor) with p<0.05.
Results
Protein–surface interactions
It has now been widely accepted that protein adsorption behavior was correlated with the bioactivity of a biomaterial surface. 48 Surface bioactivity is provided by the proteins that adsorb to the biomaterial surface following exposure of the surface to biological fluids, 49 Because the surfaces of synthetic biomaterials are generally not bioactive themselves. It is well known that cell adhesion to most surfaces of tissue engineering scaffolds involves a two-step process. First, ECM proteins containing in serum medium adsorb onto surface of scaffolds, then cells adhere to these substrates mediated by the adsorbed proteins. 50 The type and the amount of proteins adsorbed to the substrates determine the cell–substrate adhesion and the orientation of bioactive sites for cellular responses. 51
To clarify the hydrogel effects on EB behavior, we first identified the surface properties of protein adsorption. The amount of protein contained in the ES culture medium that adsorbed to the surface of PNaSS, PNaAMPS, and PAAm gels, as well as on gelatin-coated PS was quantitatively characterized. As shown in Figure 2A, PAAm gels adsorbed the lowest amount of protein (8%), which indicated that the proteins within serum are difficult to absorb to the neutral gel surface with a hydrophilic nature. While, the proteins were easier to adsorb to PNaSS gels that has a hydrophobic benzene ring (42%) than that to other gel surfaces and gelatin-coated PS plate (25%) (p<0.05). However, on another negatively charged PNaAMPS gel, the protein adsorption was only a little higher than that on neutral PAAm gels (11%), and quite lower than that on PNaSS gels.

The amount of proteins contained in the embryonic stem (ES) culture medium that adsorbed on the surface of poly(sodium p-styrene sulfonate) (PNaSS), poly(2-acrylamido-2-methyl-propane sulfonic acid sodium salt) (PNaAMPS), and poly(acrylamide) (PAAm) gels, as well as on gelatin-coated polystyrene (PS) was quantitatively characterized.
To confirm the adsorption of ECM proteins present in serum-containing culture medium to these surfaces, we further assessed the deposition of ECM proteins, such as FN, Col I, and LM. Immunofluorescent methods revealed the presence of FN, Col I, and LM on the surface of PNaSS, PNaAMPS, and PAAm gels as well as on gelatin-coated PS, after 6 h incubation in the presence of the serum-containing culture medium (Fig. 2B). Overall, the fluorescence intensity of adsorbed FN, Col I, and LM are in the similar tendency with that of total protein adsorption. Specifically, negatively charged PNaSS gels adsorbed the significant levels of FN, Col I, and LM proteins. In the case of another negatively charged PNaAMPS gel, low levels of adsorbed ECM proteins were found just like that on neutral PAAm gel.
Prior reports have shown that the hydrophilic hydrogel surfaces tend to interact with the charged and polar functional groups of the proteins, and thus influence adsorbed protein orientation. 52 The higher adsorption on PNaSS gel suggested that hydrophobic benzene ring substantially enhances the protein adsorption. This result indicated that the adsorption of proteins is not only dependent on the charge but also on the hydrophobic moiety of the gels. In other words, these three gels can be classified into neutral gels with lower protein adsorption, negatively charged hydrophilic gels with low protein adsorption, and negatively charged hydrophobic gels with high protein adsorption as the ability of substrates to adsorb such proteins from serum containing culture medium determines their ability to support cell adhesion and spreading.53,54 Hence EBs behaviors may be differed from each other because of the variance of protein adsorptions onto these surfaces in this study.
Time evolution of EB morphologies on different substrates
To quantify EBs behaviors, we divided time dependent cell–substrate behaviors into three distinct developmental stages, an early differentiation phase (day 4+1), an intermediate phase (day 4+3), and a terminal differentiation phase (day 4+10). This classification is similar with the methods previously used for spontaneous beating cardiomyocytes studies. 55
After loading the initially formed EBs (4 days aged, day 4) on different substrates, we investigated the effects of chemical structure and surface charge of gels on the EB adhesion, spreading, and migration. Figure 3 shows the phase-contrast microscopy images of EBs cultured on different substrates at an initial stage as well as a long-time period. At initial stage (6 h), EBs on negatively charged PNaSS gel and gelatin-coated PS were in adhesion to the surface, with the obvious scattered edge. Whereas, on another negatively charged PNaAMPS gel, the spherical EBs was not adhered to the surface until 1 day, similar to that on the neutral PAAm gel. The results showed that at initial stage, chemical structure of gels has an influence on EBs adhesion.
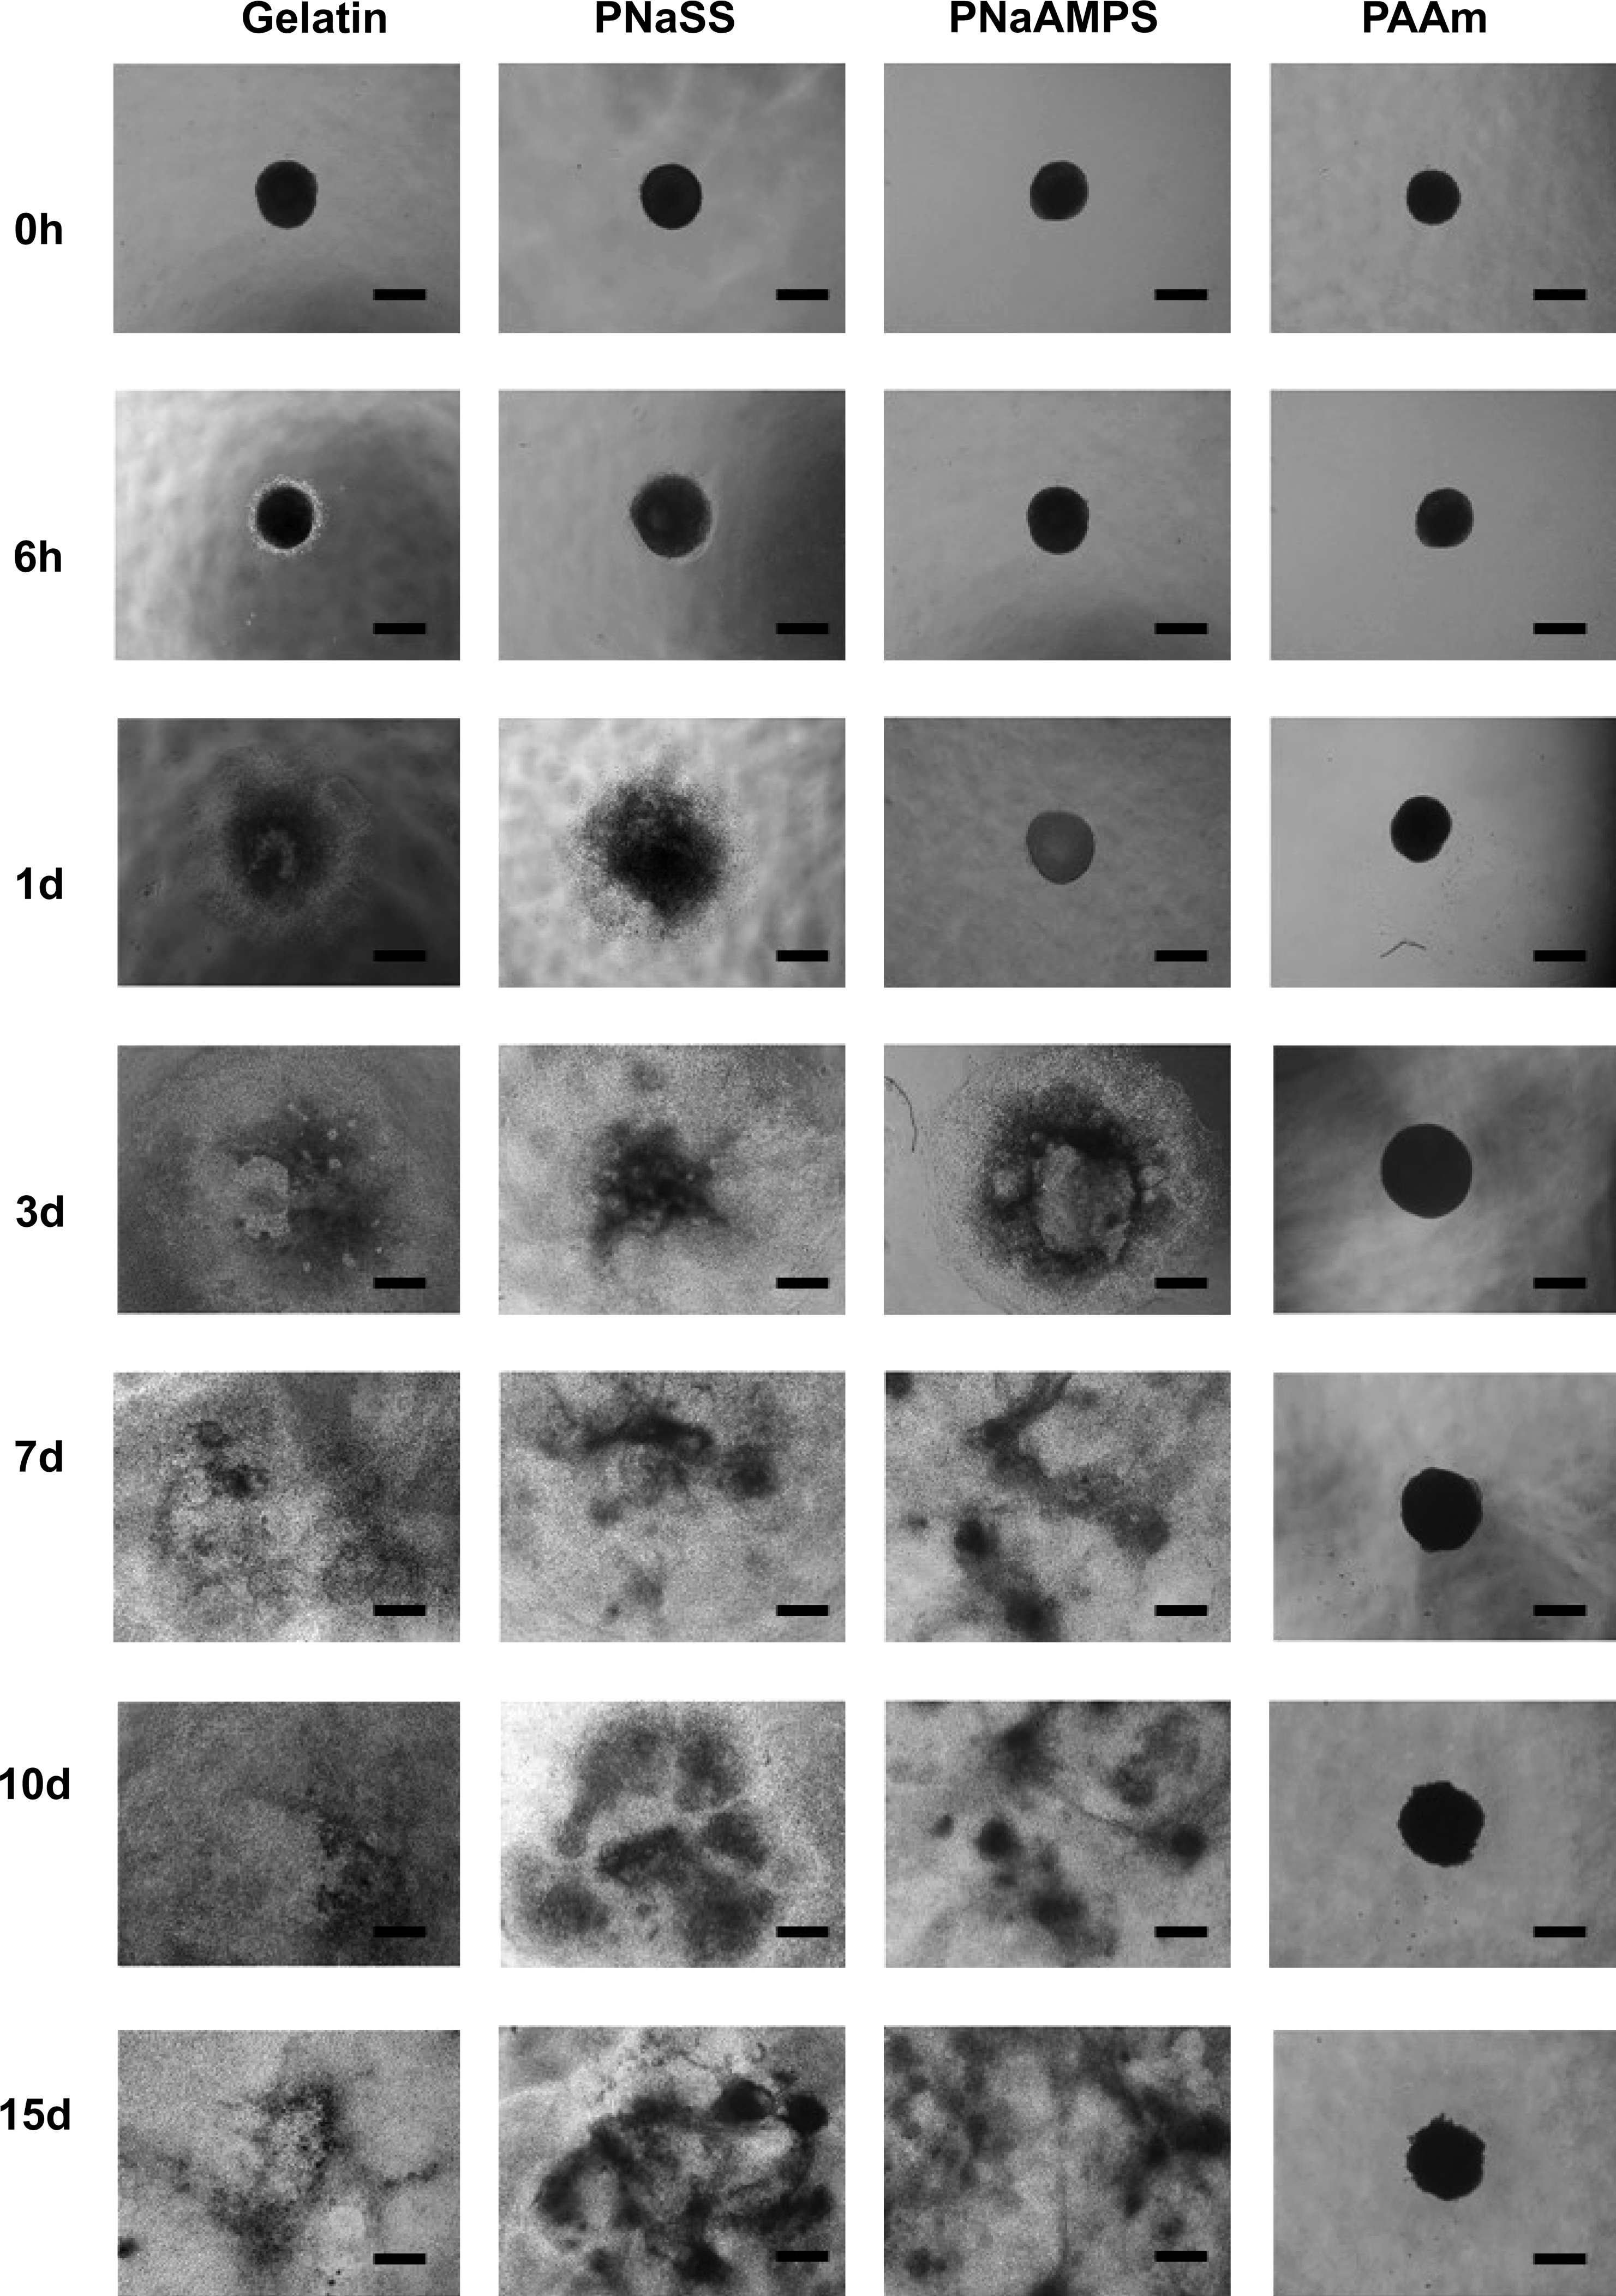
Time evolution of embryoid bodies (EBs) morphologies on PNaSS, PNaAMPS, and PAAm gels as well as on the gelatin-coated PS culture plate. Culture time was relocated when EBs were seeded on the gel surfaces. Scale bar: 600 μm.
After 3-days cultures, adhered EBs scattered more extensively and migrated in the collective way onto the gelatin-coated PS plate, and PNaSS gels. The front edges of EBs expanded on the surface mainly in monolayer. In the subsequent culture time, the collective migrations continued and the three dimensional structures of EBs partly disappeared on these two substrates. On another negatively charged PNaAMPS hydrogel, EBs adhere obviously at 3 days and exhibited similar scattered morphology to that on gelatin-coated PS plate and PNaSS gels. Overall, on gelatin-coated PS, PNaSS, and PNaAMPS gels, EBs area (A) were shown as alike increasing tendency (Fig. 4), which was clearly different from that on neutral PAAm gel. On the latter, EBs did not adhere tightly to the surface of scaffold even after 3 days, grown in the suspension-like state, maintaining spherical shape during the whole culture period. Moreover, the size of EBs did not increase obviously, with slight change in area and perimeter with time evolution. These results indicated that cells within EB spread little on nonionic PAAm gel. However, cells within EB spread and migrated evidently on strong polyelectrolyte gels with negatively charged sulfonate functional groups.
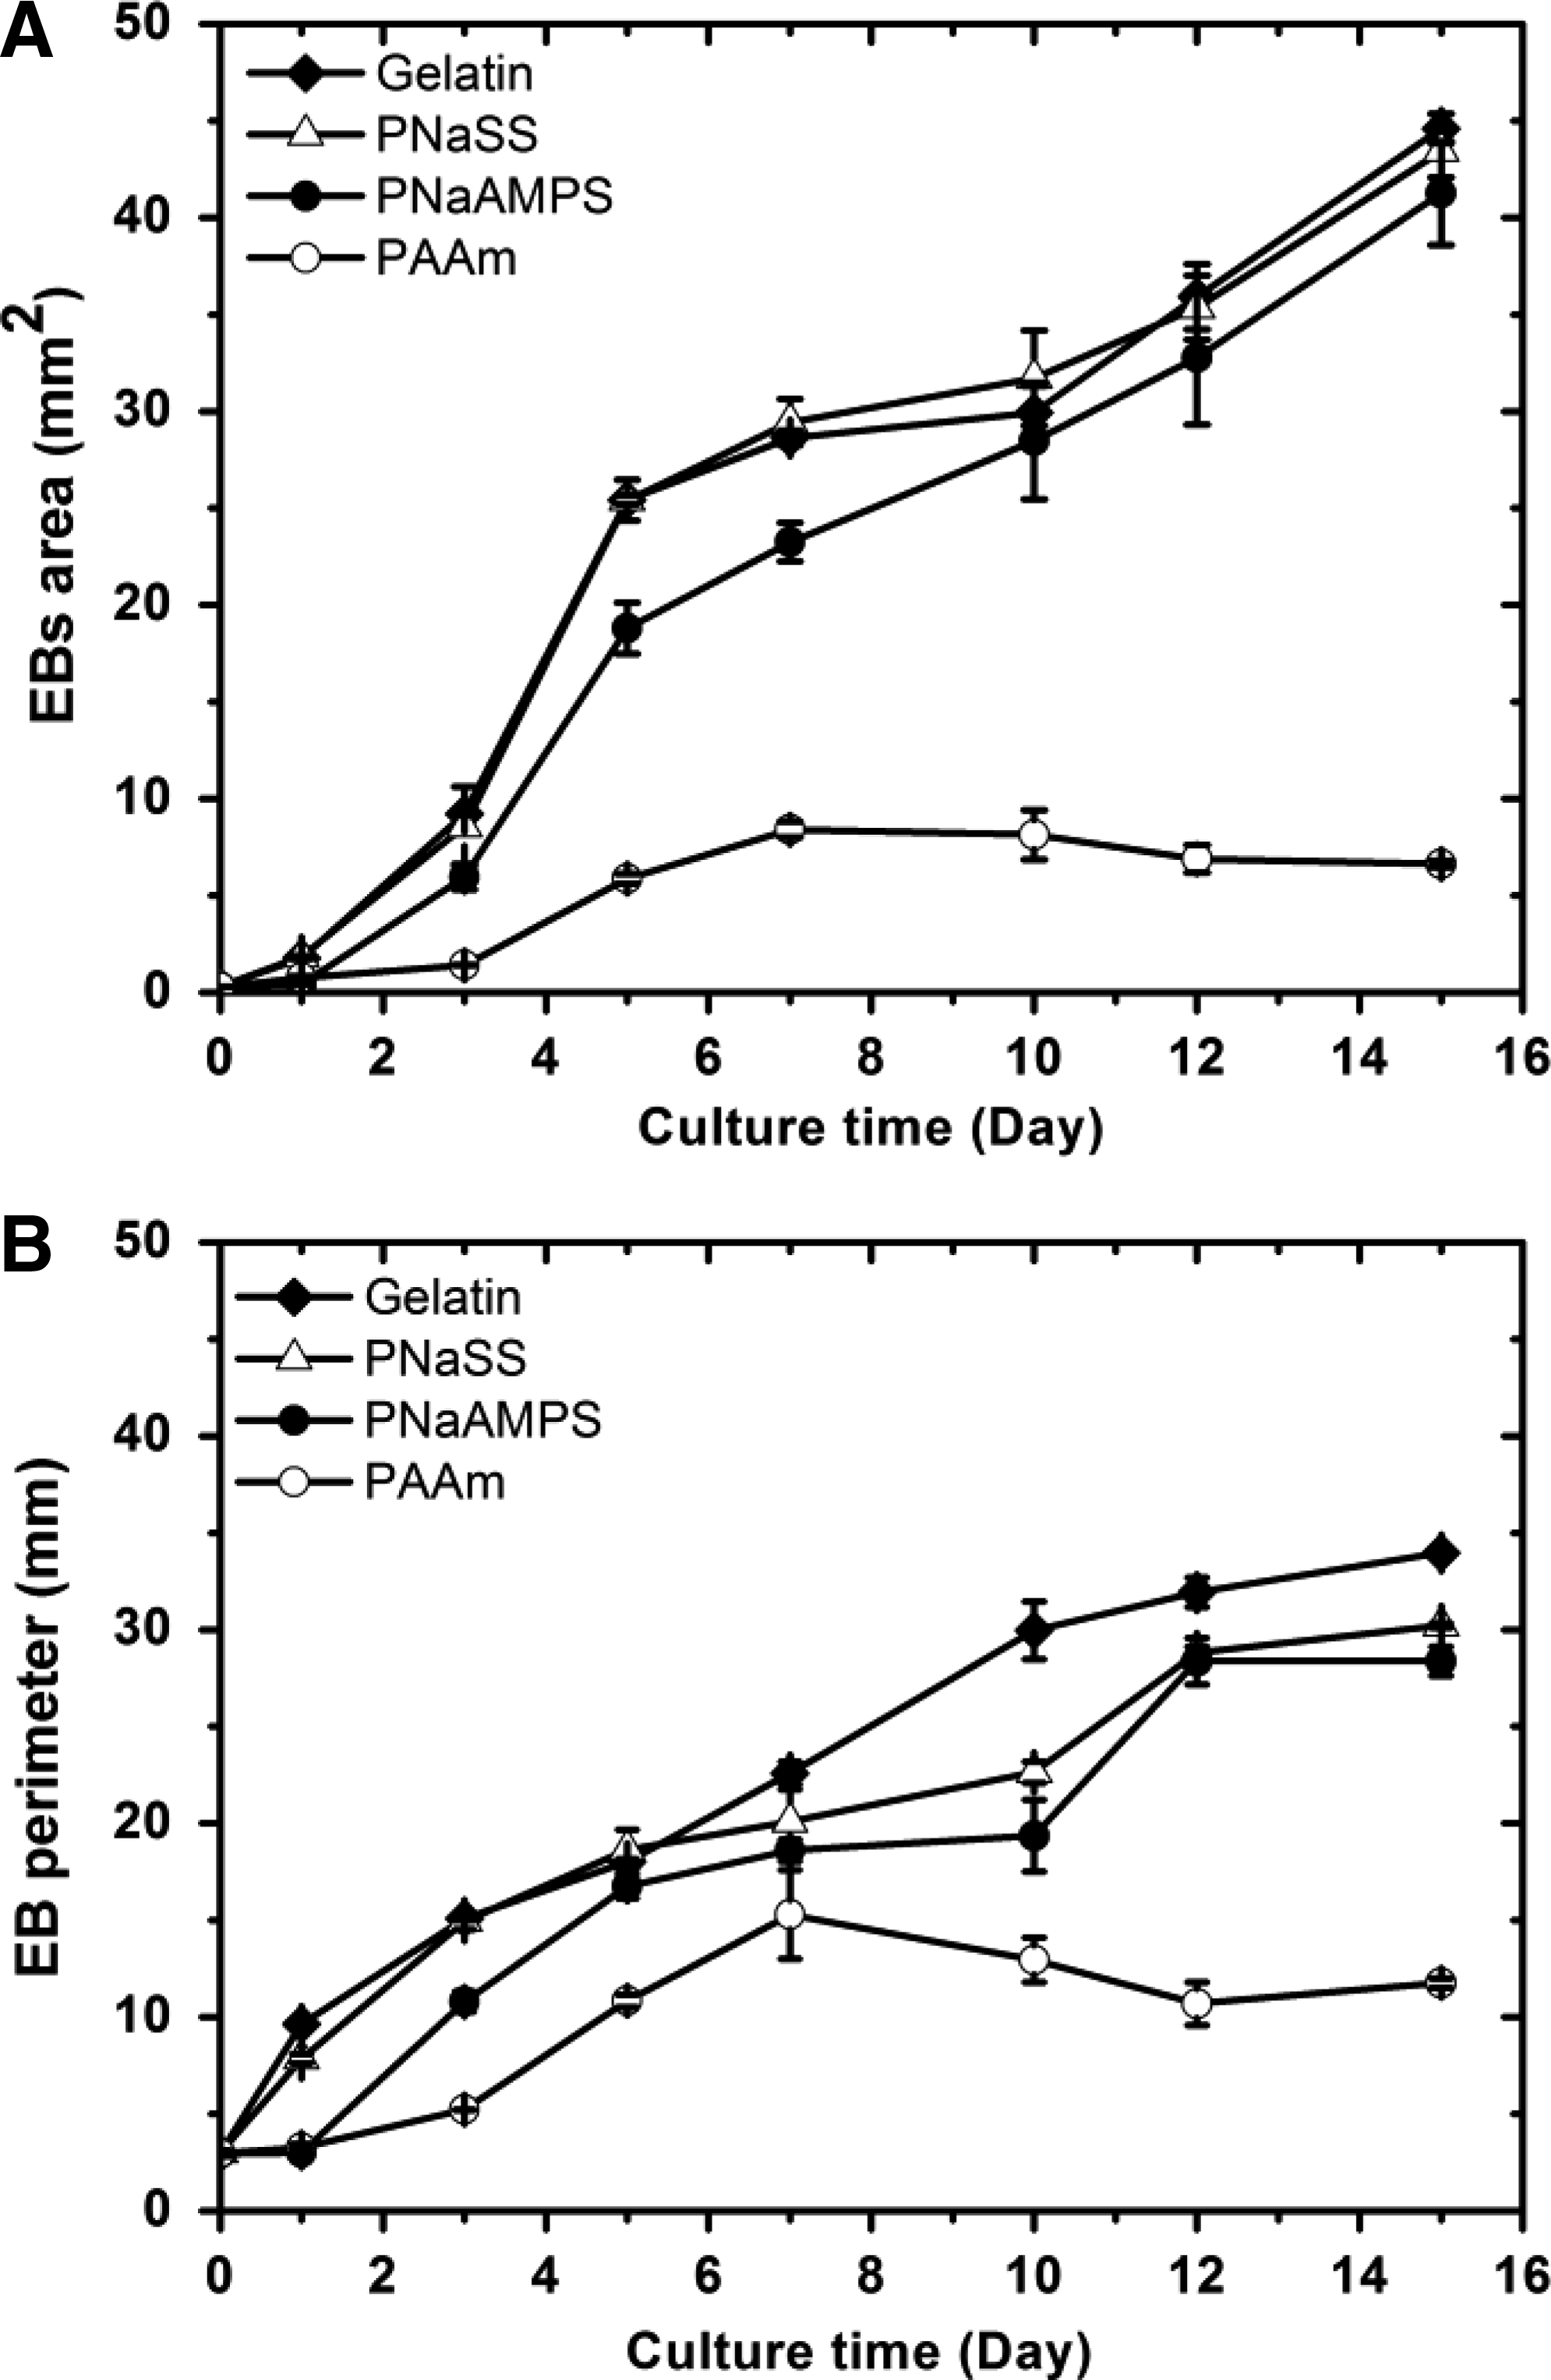
EB area A
We then schematically summarize EBs dynamic behaviors on different substrates in Figure 5. Due to higher ECM protein adsorption comparing to unmodified PS and most hydrogel surfaces, gelatin-coated PS could facilitate and increase ES cell adhesion. Cells within EBs migrated outward and originated outgrowths. After 14-days cultures, EBs on this surface underwent a ten-fold increase of their original size (Fig. 4), in sharp contrast with that on neutral PAAm gels.
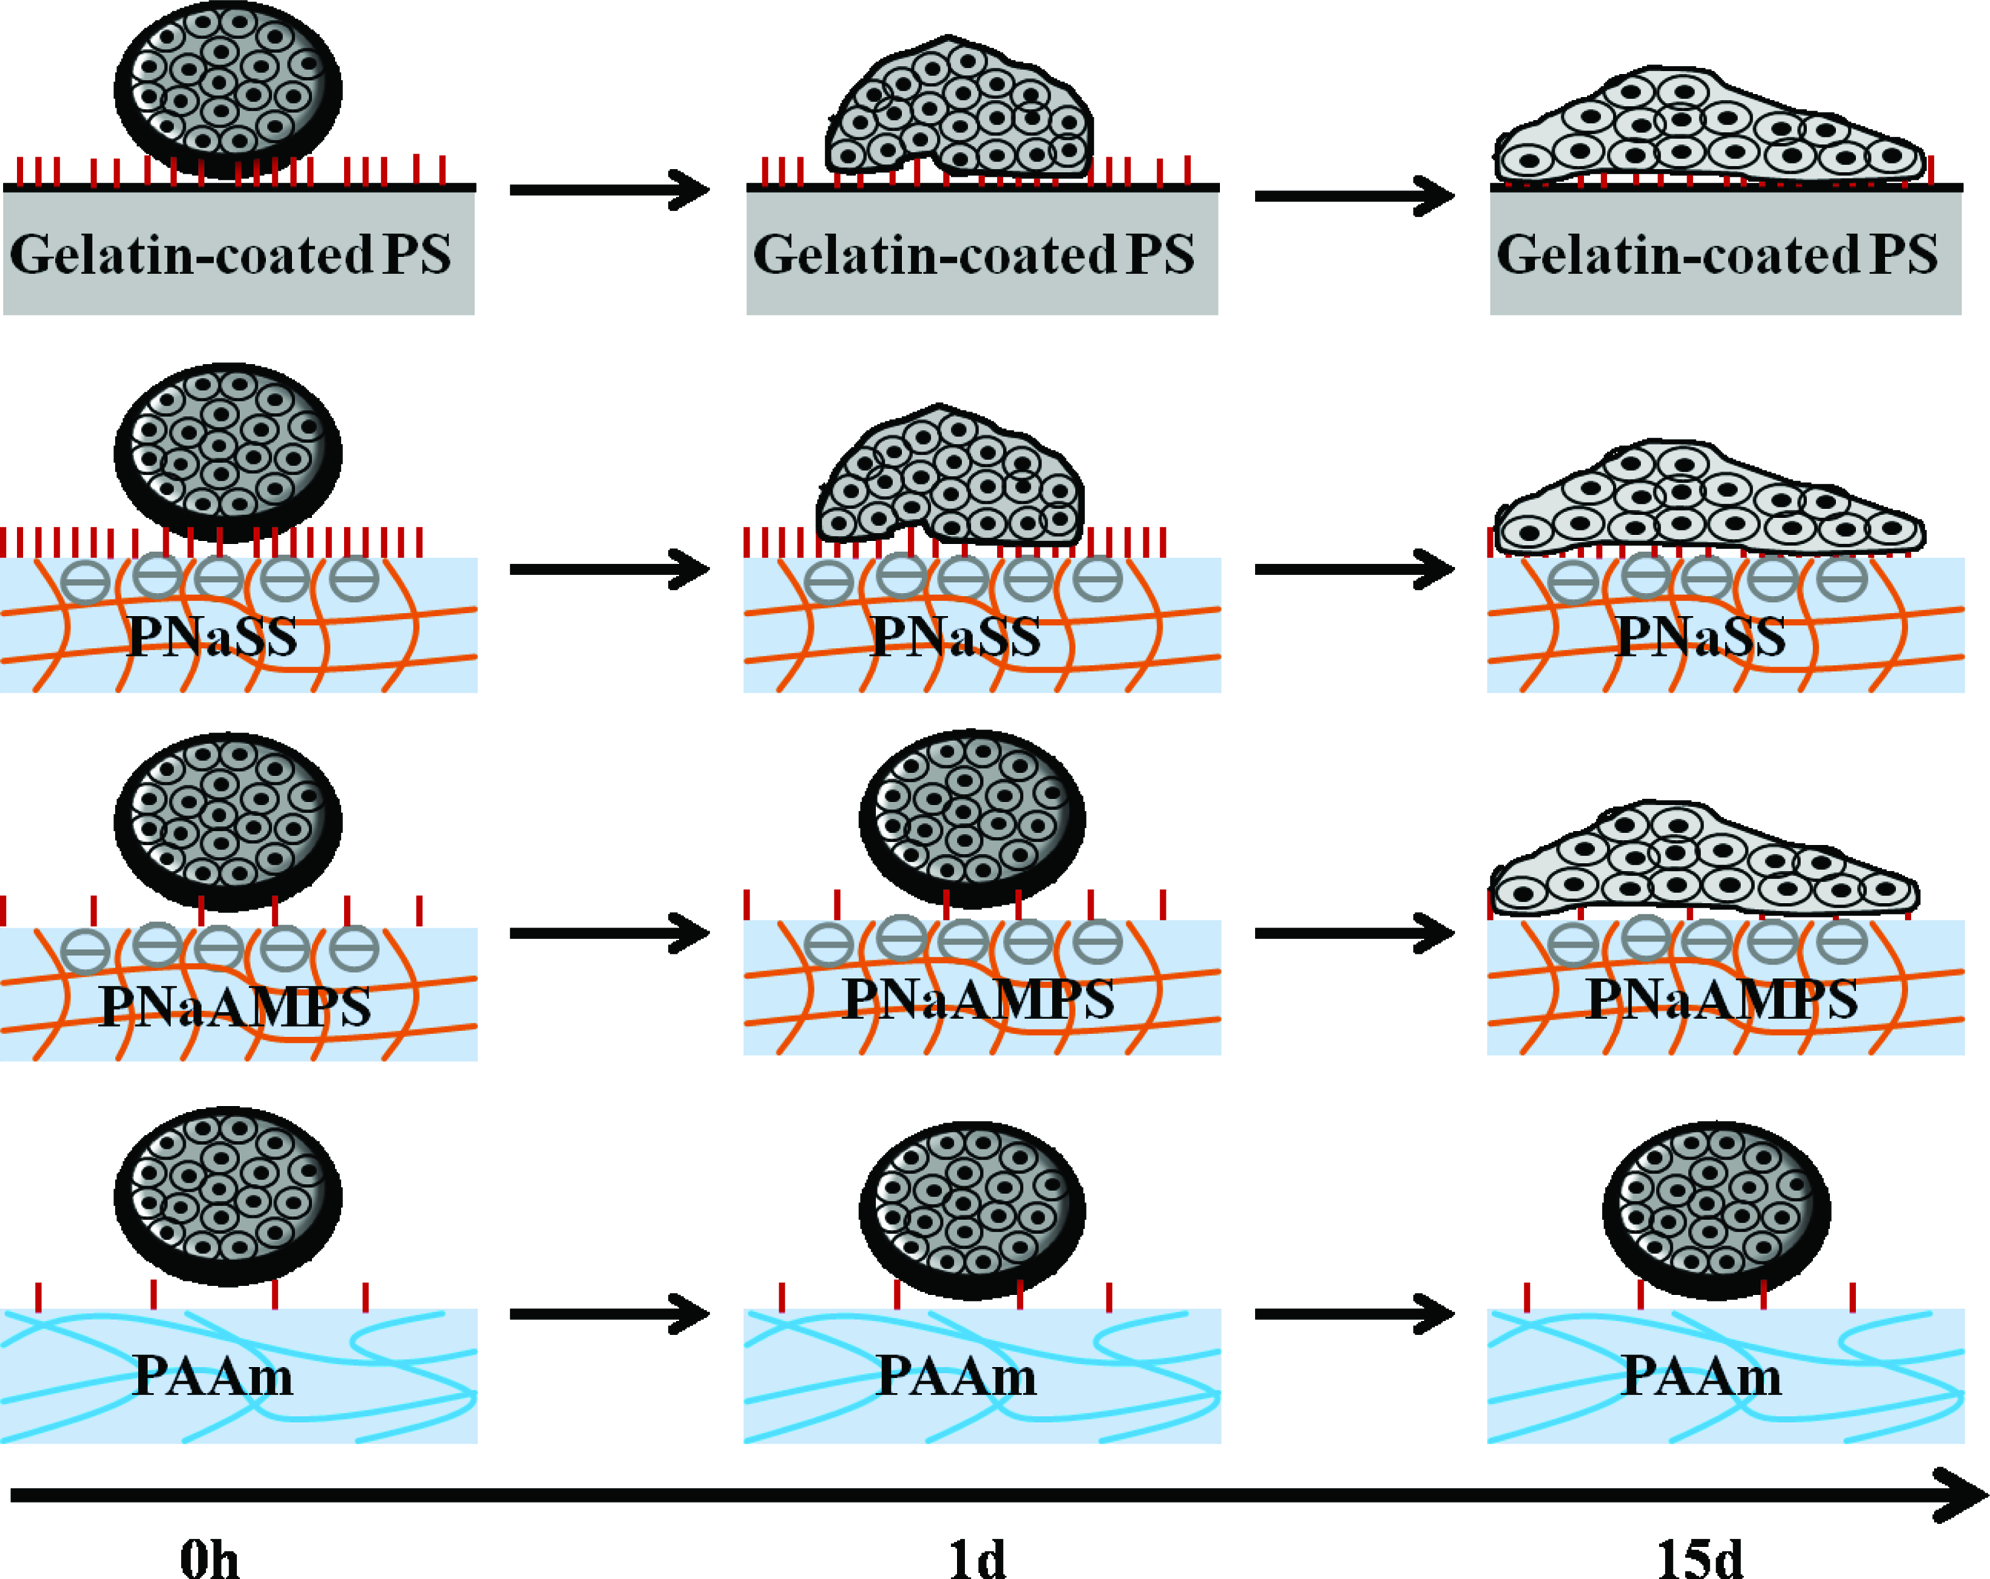
Side view illustration of EBs dynamic behaviors on various substrates. Protein adsorbed onto substrates was shown in red vertical line, and the amount of these lines means the difference of adsorbed proteins on various substrates before EBs loading. Color images available online at www.liebertonline.com/tea
EBs behavior on PNaSS hydrogels can be illustrated by protein-surface interaction too. Due to better performance of ECM protein adsorption than other substrates, cells with EBs quickly adhered onto the surface, and the cell-PNaSS gel adhesion was stronger than cell–cell interaction. As a result, the 3D spherical structures were inclined to form the monolayer on the substrate and migrate in the collective way. EBs development was followed by adhesion, spreading and migration on this surface.
EBs on negatively charged PNaAMPS gels showed a combined behavior of that on neutral PAAm gel and on PNaSS gels. At early differentiation phase (day 4+1), EB did not adhere to the substrates due to weak ECM protein adsorption. However, at a longer culture time (>3 days), EBs showed similar behavior to that on PNaSS gel probably because of the electrostatic interaction between cells from EBs and substrate.
Determination of pluripotency of EBs on different substrates
The pluripotency of the mouse ES cells were associated with the expression of expression of AP, Oct 4 transcription factor (Oct4), and Nanog homeobox (Nanog). 47 To determine whether the differences observed by the optical microscope were reflected in the pattern of gene or protein expression, we analyzed AP expressions as well as the gene profiles of a group of candidate pluripotency-related genes, including DPPA5, OCT4 (POU5F1), NANOG, and SOX2.
As shown in Figure 6A, the AP-positive cell clusters were well found on the subcultured pluripotent mouse ES cells and initial EBs. After 3-days cultures on various substrates, AP-positive cells within EB exhibited a significant diversity. Specifically, AP was greatly expressed in the aggregated cells cultured on neutral PAAm gels. On the other hand, AP was rarely found on PNaAMPS gels, PNaSS gels, and on gelatin-coated PS plate.
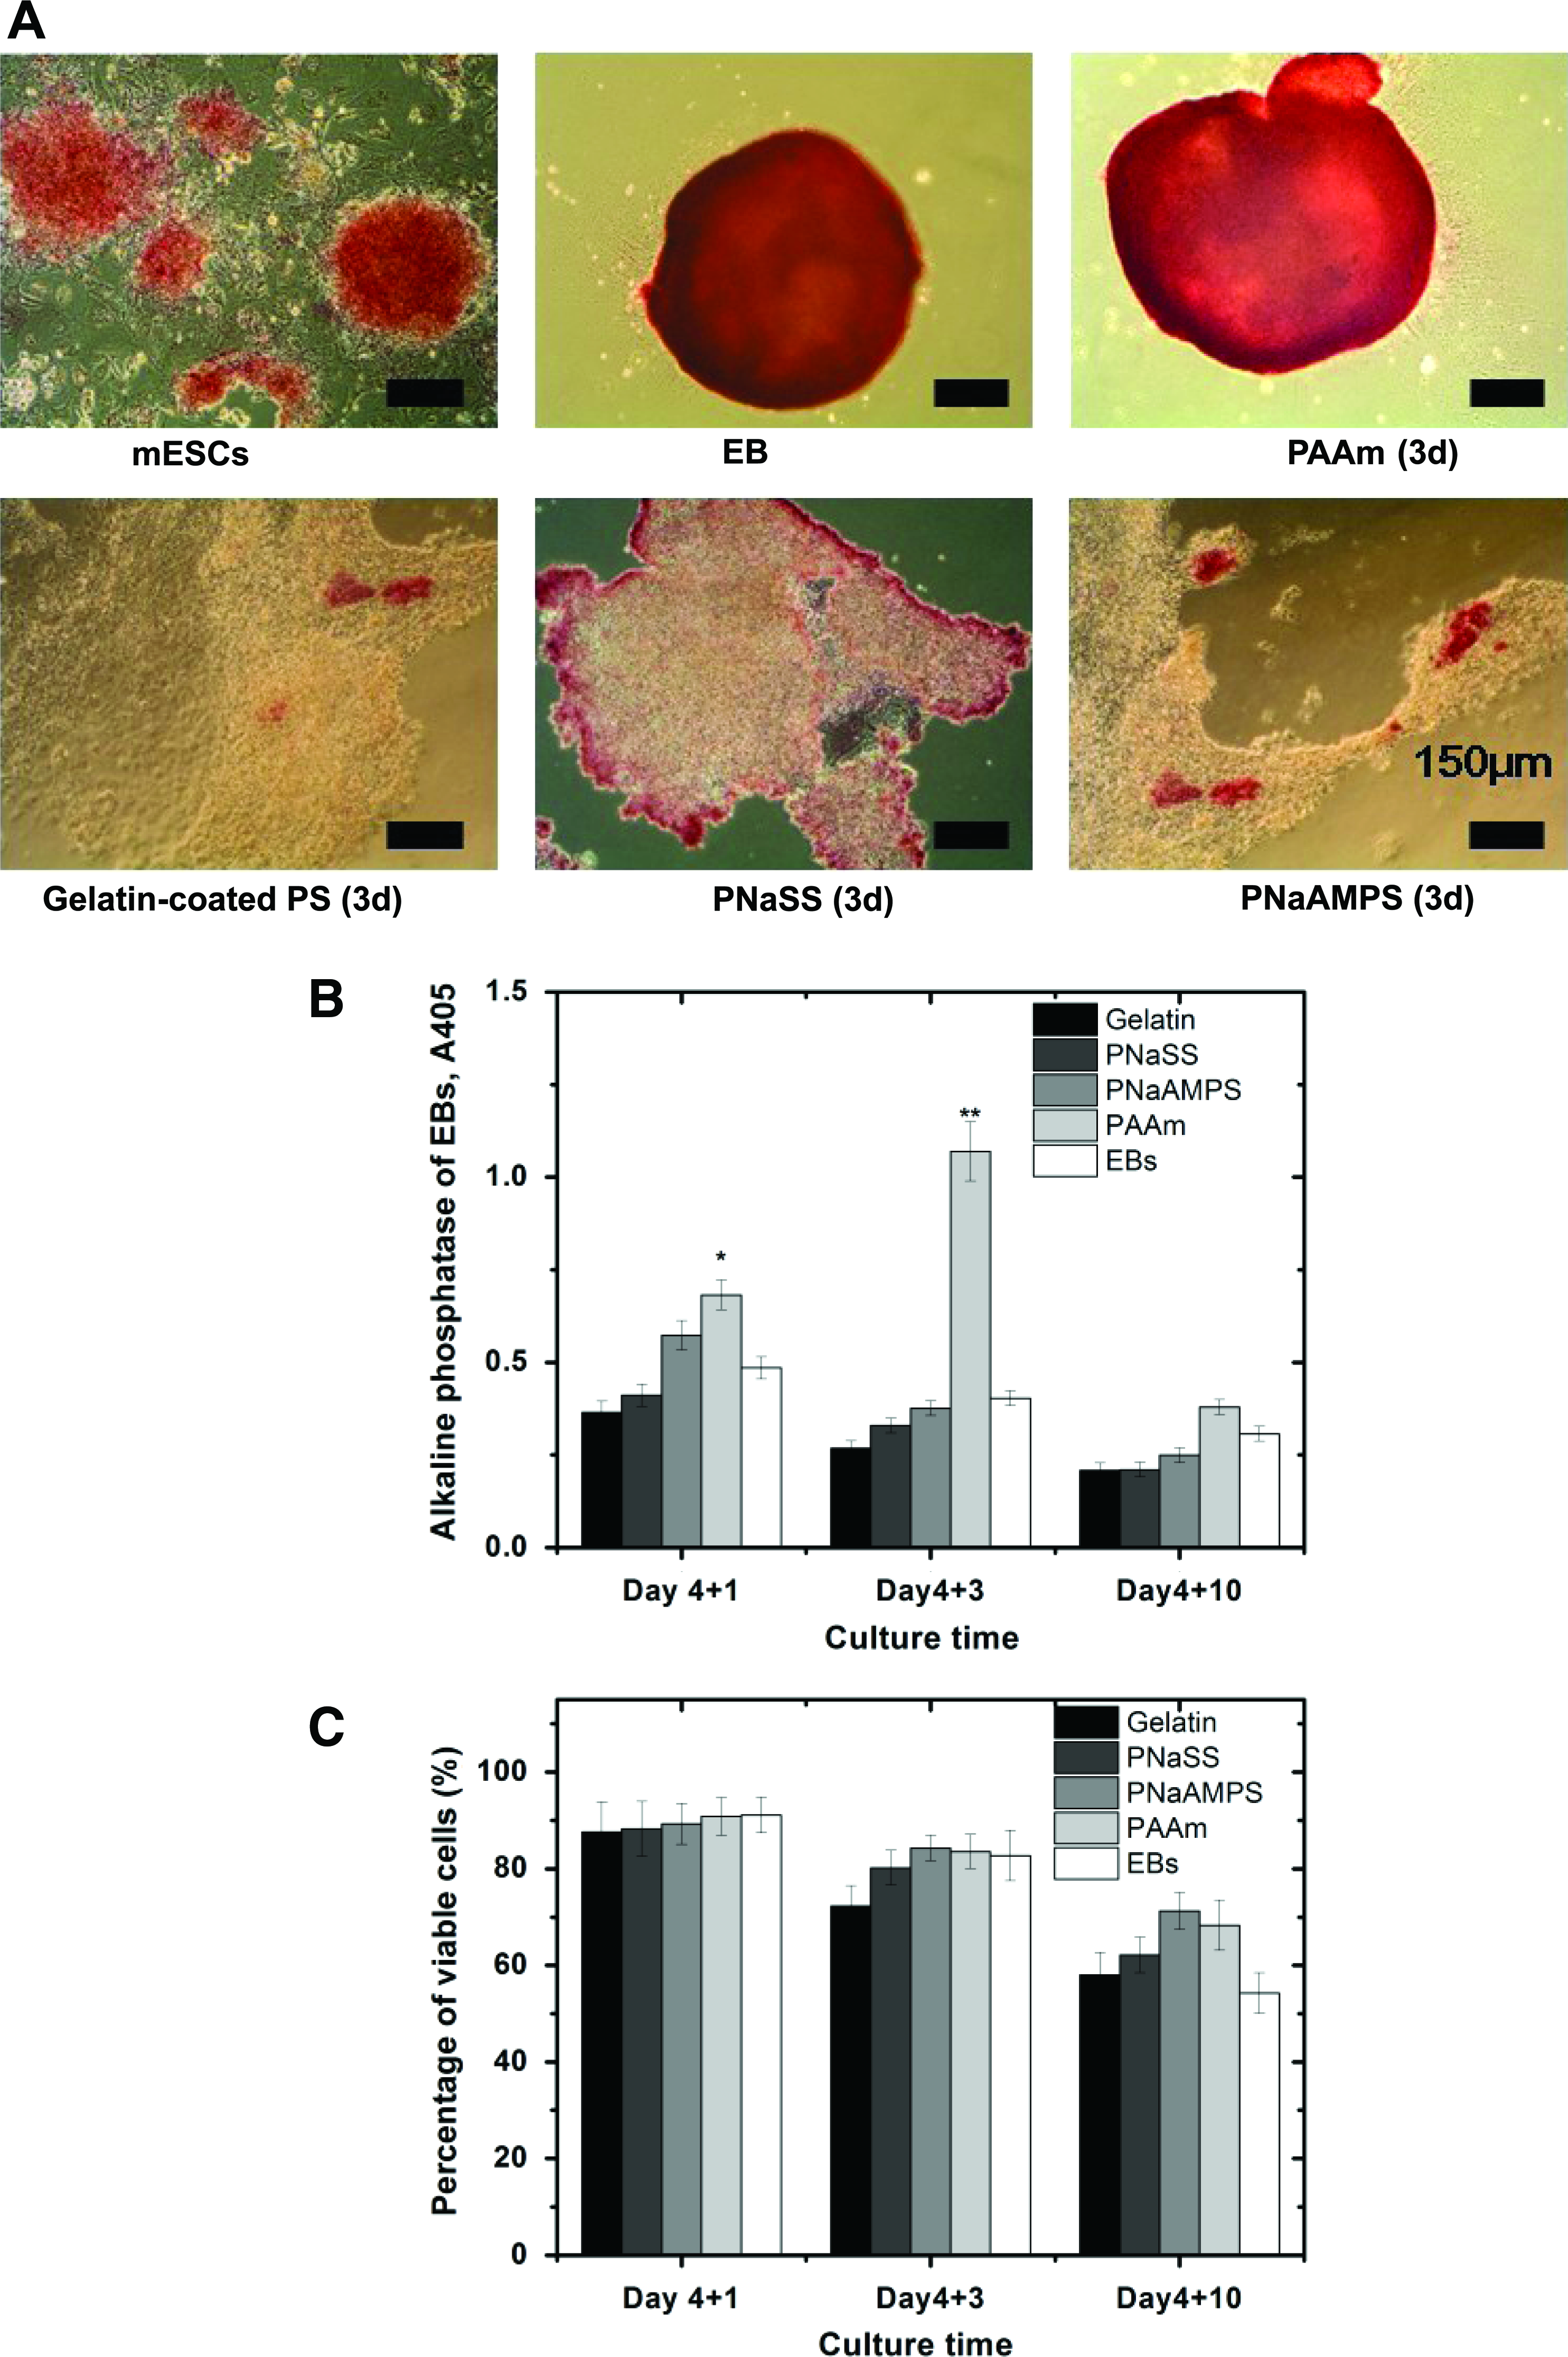
Alkaline phosphatase (AP) and cell viabilities expressed in EBs cultured on various substrates.
To clarify the dynamic changes of AP expressed in EBs cultured on different substrates, we quantitatively analyzed the amounts of AP by comparing the optical density at 405 nm as shown in Figure 6B. AP expressions demonstrated in a decreased tendency along with the culture time on all substrates. At early differentiation phase (day 4+1), the expression of AP on PNaAMPS gels and PAAm gels were higher than that on gelatin-coated PS, PNaSS gels and initial formed EBs. However, at an intermediate phase (day 4+3), distinct high expression of AP was only possessed on EBs on neutral PAAm gels. Then at terminal differentiation phase (day 4+10), the amounts of AP were decreased and reached the equivalent level among all substrates. Besides, the spherical structures of EBs on PNaAMPS gels were well correlated with its high expression of AP after day 1. The results indicated that at initial stage, cells within EBs on PNaAMPS gels sustained the relatively higher undifferentiated state than that on another negatively charged PNaSS gels.
Then we evaluated the cell viabilities of EBs as the function of the effects of substrates through the use of Live/Dead staining. As shown in Figure 6C, the undifferentiated mouse ES cells and initially formed EBs showed high levels of viability (98.2±0.8%, and 95.2±0.2% respectively). With the increase in the culture time, the percentages of viable cells within EBs on all of substrates were decreased. After 2 weeks of culture, the cell viabilities within EBs were decreased to 58.04%±4.6% on gelatin-coated PS plate, 62.17%±3.7% on PNaSS gels, 71.28%±3.8% on PNaAMPS gels, and 68.32%±5.2% on PAAm gels. All of these values were higher than that of EBs in suspension culture after day 4+10 (54.28%±4.2%). Moreover, at all of three time points, cell viabilities of EBs on PNaAMPS gels were higher than that of EBs on other substrates, which was consistent with AP characterization results.
Real-time PCR results supported the effects of substrates on the pluripotency of mouse ES cells. As shown in Figure 7A, at early differentiation phase (day 4+1), the gene expressions of DPPA5, OCT4 (POU5F1), NANOG, and SOX2 were largely reduced on gelatin-coated PS plate. At the same time, these expressions in EBs on PNaAMPS gels and PAAm gels were well observed in the higher level better than that of initial formed EBs and EBs in suspension (day 5).

Real-time polymerase chain reaction analysis of DPPA5, Nanog, Otc4, and Sox2 gene expressions of EBs after 1 day
Figure 7B shows the varied expressions of these 4 genes in cells within EBs at an intermediate phase (day 4+3). The similar low levels of pluripotent gene expressions were found on negatively charged substrates (PNaSS, PNaAMPS, and gelatin-coated PS), demonstrating about 0.1-fold relative to the subpassage undifferentiated mouse ES cells. On neutral PAAm hydrogels, the expressions of DPPA5, NANOG, and SOX2 genes were even higher than that of initially formed EB and EBs (day 7) in suspension culture. At terminal differentiation phase (day 4+10), all of 4 genes expressions in EBs grown on PAAm gels were decreased and significantly lower than that of cells at earlier culture periods and EBs (day 14) in suspension culture (Fig. 7C). These results suggested that cells within EBs on PAAm gels had clearly differentiated after long-time period of culture, although they kept the original spherical shape (Fig. 3).
Differentiation profiles of EBs on different substrates
In the case of the mouse embryonic development, endoderm, together with mesoderm and ectoderm, is formed from the ectoderm of the epiblast through the process of gastrulation beginning at approximately 6.5 of gestation. 41 When EBs was seeded on various surfaces, the differentiation of cells within EBs was continued and affected by the substrate. We further evaluated the differentiated ectoderm, mesoderm, and endoderm-related expressions by semiquantitative analysis of specific genes expressions at terminal differentiation phase (day 4+10). Owing to the relatively homogeneous source of EBs, the initial three germ-layered expressions of EBs were considered no difference and used as normalization in the next part.
We firstly investigated the expressions of ectoderm markers, which is located in the outmost layer of three germ-layered animal embryos and will develop into the skin and nervous tissue. As shown in Figure 8A, nestin, a common marker for the early ectoderm, was in slightly higher upregulation in negatively charged gels than that on neutral PAAm gels and gelatin-coated PS plate. There is no statistical difference versus the initial formed EBs. In short, the distinct upregulations of Nestin, Sox1, Otx1, and NeuroD were not found on all of substrates.
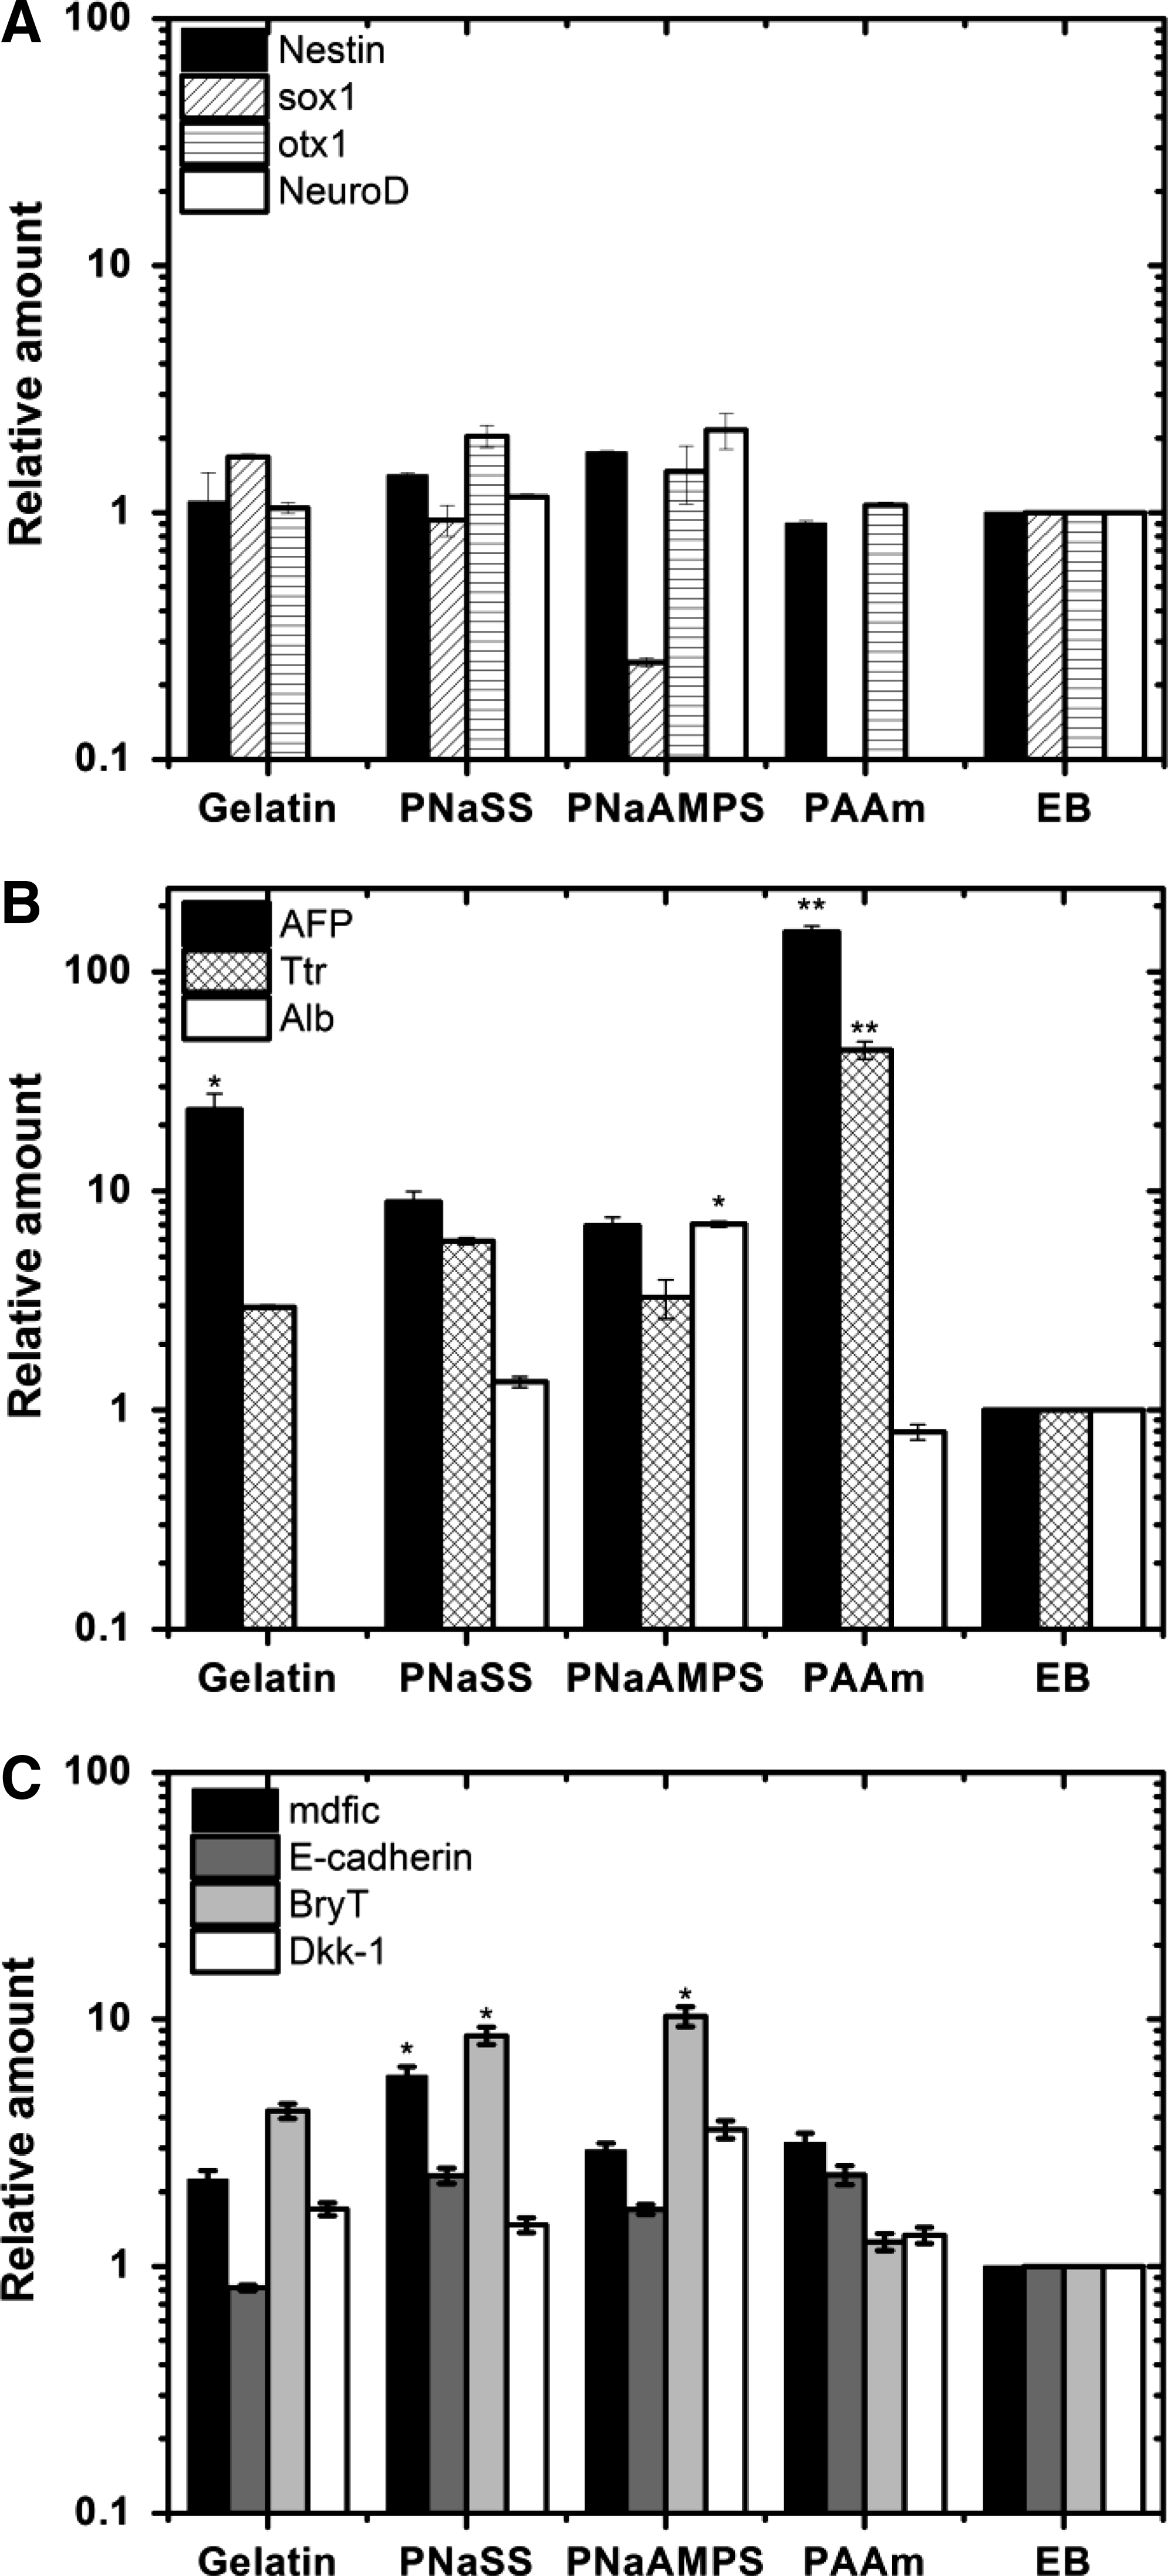
The relative RNA levels of ectoderm-related markers
Figure 8B shows the selected endoderm expressions involving AFP, Ttr, and Alb genes in EBs on different surfaces after 10 days culture. Ttr expression is an indicator of the development of visceral endoderm, and Alb gene expression is enriched by endoderm cells development. 41 Expression of AFP, a commonly used endoderm marker, was upregulated in EBs on all different surfaces. Especially, the distinctly higher expressions of AFP and Ttr on PAAm gels were found than that on negatively charged gels with 100-folds relative to initially formed EBs.
Figure 8C shows the expressions of mdfic, E-cadherin, Bry T and Dkk-1, which will play important roles in mesoderm development. 56 Almost all of these four genes expressions increased when EBs were cultured on different substrates than on initially formed EBs. Greater levels of Bry T were found on negatively charged PNaAMPS and PNaSS gels, which indicated that these two gels favor differentiation of posterior mesoderm to some extent. Besides, the relatively high expressions of mdfic genes on PNaSS gels were found.
In brief, as for EBs cultured on hydrogels with different chemical structure and charge, upregulation of endoderm and mesoderm-related expressions were well observed. The close developmental association between mesoderm and endoderm, possibly through a common progenitor, suggests that the same mechanisms regulating the early induction events lead to the establishment of these linegage. These results were the same with previous report. 56
Differentiation of EBs into cardiomyocytes
At different culture days postplating on various substrates, we observed the spontaneous cardiomyocyte differentiation by recognizing the periodical beating of EBs outgrowth. Figures 9A and B show the time profile of beating rates and beating area of EBs on various substrates, respectively. All the culture time was denoted as the seeding time of EBs on different surfaces. In general, contracting cells within EBs were identified at 1–7 days after seeding on different surfaces. At a later time, the profiles of contraction rate and beating areas of EBs outgrowth were differed from each substrates and at day 30, almost no beating cells was observed.
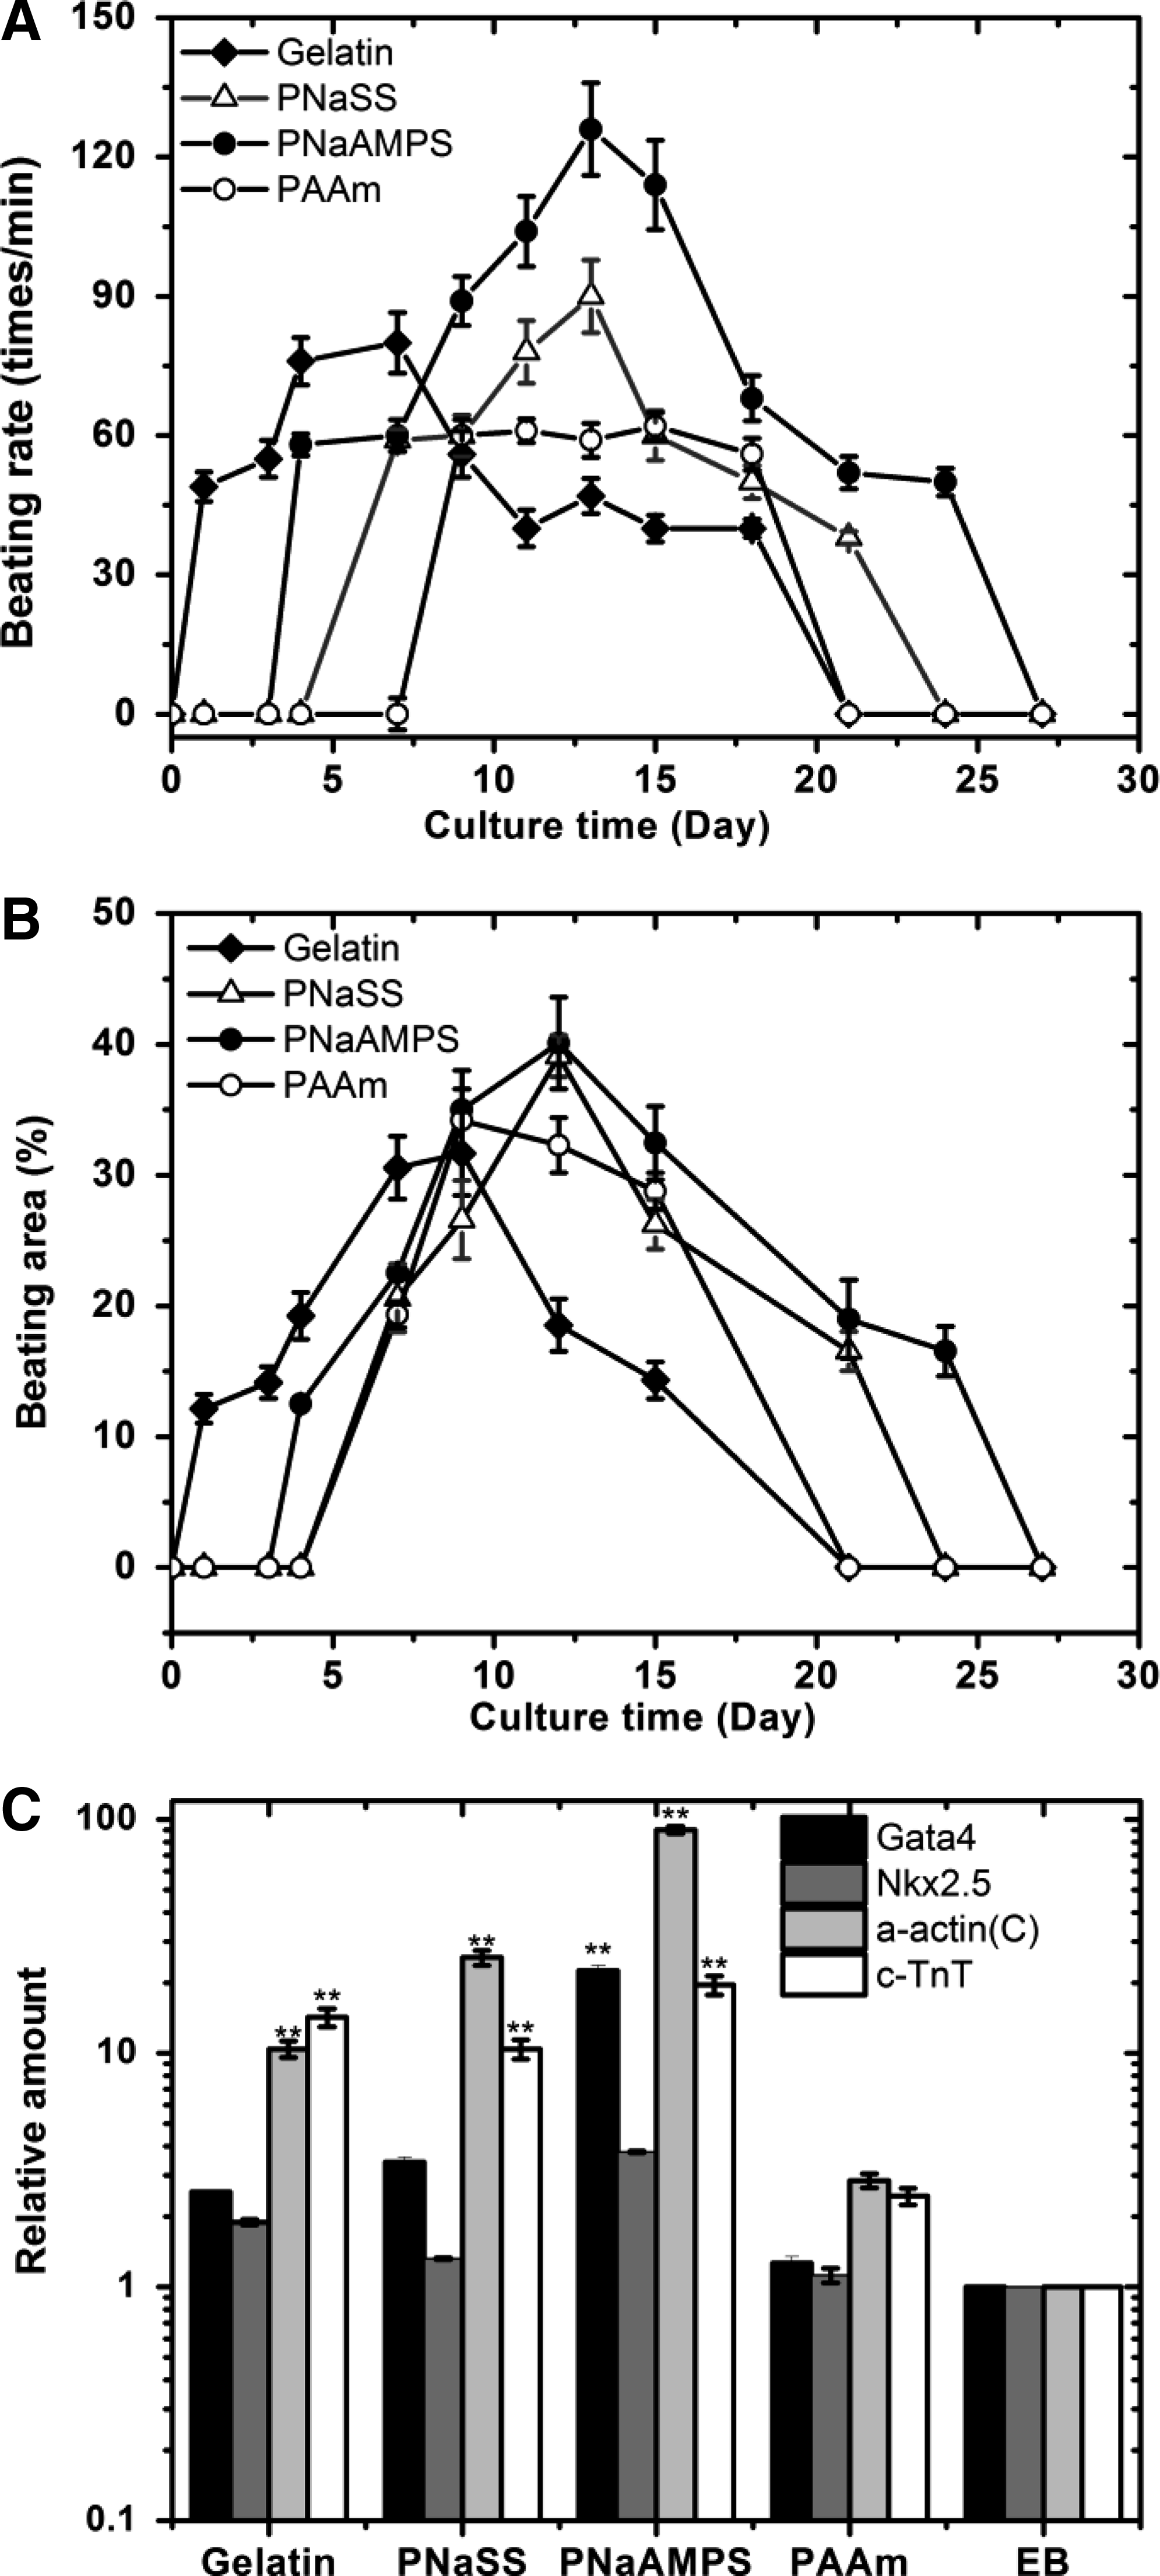
The existence of mouse ES cell derived cardiomyocytes on various substrates. The time profiles of beating rates
The heterogeneity in cardiomyocytes differentiation on different substrates was observed along with the time evolution. As shown in Figures 9A and B, the beating rates and areas change dynamically over a period of about 1 month. On gelatin-coated PS culture plate, beating cells were first observed at day 1 with the beating area of ∼10%. The beating area increased with time (day 1 to 10), and reached ∼30% of total EBs outgrowth at day 10. After day 10, the beating rate and area did not increase further (day 10–18) and disappeared after day 21.
On other substrates, beating cells were firstly observed at different time points; day 4 (on PNaAMPS gels), and day 7 (on PNaSS and PAAm gels). Both PNaAMPS and PNaSS gel enhanced the beating rates and areas from day 7 to 14, followed by a decrease. At day 14, ∼40% of the total EB outgrowth was beating on these two negatively charged gel surfaces. The disappearance time of beating cells on PNaSS and PNaAMPS gels was 21 and 24 days, respectively. On PNaAMPS gels, the first contracting cells appeared earlier than on PNaSS gels with higher beating rates. In the case of PAAm gels, the beating rates were kept constant during the culture periods of days 7–18, while the beating areas increased at first 14 culture days followed by a decrease and disappearance (at day 21).
Real-time PCR analysis of EBs on different substrates (day 4+10) have demonstrated that cells within beating EBs showed the expressions of cardiac transcription factors, including Gata-4 and Nkx2.5, and of cardiac-restricted genes, including α-actin(c), and c-TnT 57 as shown in Figure 9C. EBs cultured on negatively charged PNaAMPS gels showed distinct increases of Gata-4, Nkx2.5, α-actin(c), and c-TnT expressions with higher levels than that on other substrates. Moreover, upregulation of c-TnT expression was only not found on PAAm gels. However, these expressions on neutral PAAm gels did not increase obviously comparing to initially formed EBs.
Combining with Figures 9A and B, the expressions of cardiomyocyte differentiations were in the order from higher level to lower level as follows: PNaAMPS gels, PNaSS gels, gelatin-coated PS, and neutral PAAm gels. These results were also confirmed by the immunostaining results (Fig. 10), which indicated that cardiomyoctes differentiation was affected by the surface charge of hydrogel substrates.

Immunofluorescence staining images of α-actinin (green), F-actin (red), and vinculin (green) in cells within EBs cultured for 10 days on PNaSS, PNaAMPS, and PAAm gels as well as on the gelatin-coated PS culture plate. Nuclei were stained with blue color. Scale bar: 100 μm. Color images available online at www.liebertonline.com/tea
Discussion
Effects of the surface properties of hydrogels on the differentiation of EBs
EBs morphologies, EBs adhesions to the substrates, cells spreading and differentiations are time dependent. These dynamic behaviors of EBs are determined by the balance between the cell–cell interaction and cell–substrate interaction. The protein-mediated interaction between substrates and cells could be influenced not only by van der Waals interaction that is strongly dependent on the hydrophilic/hydrophobic property of scaffolds, but also by electrostatic interaction between charged moieties that is dependent on the surface charges of the scaffolds. 34 FAs are also involved in this process.
At early differentiation phase (day 4+1), the low protein adsorption on PAAm and PNaAMPS gels (Fig. 2) was not in favor of cell–substrate adhesion, as a result, cell–cell adhesion within EBs was dominant and 3D spherical morphologies were observed (Fig. 3). At the same time, the undifferentiation-related expressions were in high level in this case (Figs. 6 and 7). However, high protein adsorption on PNaSS hydrogels (Fig. 2) was in favor of cell–substrate adhesion, hence cells within EBs were adhered quickly (Fig. 3) and the undifferentiation-related markers decreased at the same time (Figs. 6 and 7).
At an intermediate phase (day 4+3), the EBs behaviors on negatively charged gels were distinctly different from that on neutral PAAm gels. The adhesive interaction between the cell and the gel is weak in the case of the neutral polymer gel via the van der Waals interaction, while the interaction is greatly enhanced by the negative charges of the gel via the electrostatic interaction. As a result, on neutral PAAm gels, inhibition of spreading of ES cells on this substrate is in favor of cell aggregation, resulting in enhancement of growth factors originated from pluripotent ES cells within EBs. While on negatively charged gels, because the similar charge properties with close Zeta potential (near −20 mv),30,31 the cell–substrate adhesion is upregulated by the negative charge and the undifferentiation-related expressions are at a lower level than on neutral PAAm gels.
At terminal differentiation phase (day 4+10), the upregulation of mesoderm and endoderm-related expressions were found on all of hydrogels with diverse levels of spontaneous cardiomyocytes differentiation. Nonspreading EBs on neutral PAAm gels upregulate the cell–cell interactions in the EBs structures and stimulate the expressions of mesendoderm and early cardiac cell-lineage, which can provide cardiomyogenic-inducing factors. However, the capacity of diffusive transport was inhibited by the three dimensional structure that affected cardiomyocytes differentiation to some extent. Consequently, the spontaneous cardiomyocyte differentiation on neutral PAAm gels was not higher than that on negatively charged gels (Fig. 9).
As to EBs cultured on negatively charged hydrogels, the establishments of FAs were well observed at a higher level on PNaAMPS and PNaSS hydrogels than that on neutral PAAm gels (Fig. 10). Cells within EBs adhered onto the negatively charged hydrogel surface and were differentiated. Meanwhile, the PNaAMPS and PNaSS hydrogels have similarities with proteoglycans in its negative charge and sulfonic acid group, which may directly function as a signal molecular to interact with receptors for signal pathways in cardiomyocyte differentiation. Hence, EBs can differentiate on these negatively charged hydrogels with high efficiency of cardiomyocytes differentiation. Besides, PNaAMPS gel with lower ECM protein adsorption was more favorable to EBs spontaneous cardiomyocytes differentiation than that on PNaSS gels. The difference may result from the chemical structure by influencing signal pathways in development of EBs. The mechanism is not unclear now and needs to be studied in the future.
Conclusions
In this study, the dynamic behaviors of EBs cultured on different substrates in the absence of surface modification and inducible bioactive factors were investigated. Negatively charged PNaAMPS and PNaSS gels were first used for EBs 2D culture. The results showed that EBs differentiations were affected by the balance between the cell–cell interaction and cell–substrate adhesion at different time points.
High protein adsorption on negatively charged PNaSS hydrogels favored cell–substrate adhesion, hence cells within EBs were adhered quickly and the undifferentiation-related markers decreased at early differentiation phase (day 4+1). This hydrogel can promote EB adhesion to the substrate and then facilitate cell spreading and migration in the later period, just like that on gelatin-coated PS culture plate. The van der Waals attraction, electrostatic repulsion and FAs were all involved in this process. Hence, EBs can differentiate on this negatively charged gel along with upregulation of mesoderm- and endoderm-related expressions and high efficiency of spontaneous cardiomyocyte differentiation.
Low protein adsorption on negatively charged PNaAMPS hydrogels was not in favor of cells-substrate adhesion at early differentiation phase (day 4+1), and similar morphology and gene profiles with neutral PAAm gels were found in this case. However, after 3-days cultures, because of the similar charge properties with PNaSS gels, the cell–substrate adhesion was upregulated by the negative charge and EBs adhesion and differentiation were similar to that of PNaSS gels. It is necessary to note that PNaAMPS gel with lower ECM protein adsorption is more favorable to EBs spontaneous cardiomyocytes differentiation than that on PNaSS gels.
While low protein adsorption on neutral PAAm hydrogels was not in favor of cells-substrate adhesion, cell–cell adhesion within EBs was dominant. EBs maintained the initial cells aggregated morphology with high expression of pluripotency-related markers in the short culture periods, and then possessed significantly greater levels of selected endoderm markers after long-time culture. Cell–cell interactions in the EBs structures stimulate the expression of markers for mesendoderm and cardiac cell-lineage at the same time.
Footnotes
Acknowledgments
This study was supported by a Grant-in-Aid for Specially Promoted Research (No. 18002002) from the Ministry of Education, Science, Sports and Culture of Japan.
Disclosure Statement
No competing financial interests exist.