
Abstract
Most contemporary biomaterial designs for osteochondral regeneration utilize monolithic, biphasic, or even multiphasic constructs. We have introduced a microsphere-based approach to create a continuous gradient in both material composition and encapsulated growth factors. The gradients were fabricated by filling a cylindrical mold with opposing gradients of two different types of poly(D,L-lactic-co-glycolic acid) microspheres. The chondrogenic microspheres were loaded with transforming growth factor-β1, whereas the osteogenic microspheres contained bone morphogenetic protein-2 with or without nanophase hydroxyapatite. The gradient scaffolds (material gradient only, signal gradient only, or material/signal gradient combination) or blank control scaffolds were implanted in 3.5 mm-diameter defects in rabbit knees for 6 or 12 weeks. This is the first in vivo evaluation of these novel gradient scaffolds in the knee. The gross morphology, MRI, and histology indicated that the greatest extent of regeneration was achieved when both signal and material gradients were included together. This combination resulted in complete bone ingrowth, with an overlying cartilage layer with high glycosaminoglycan content, appropriate thickness, and integration with the surrounding cartilage and underlying bone. The results suggest that osteochondral regeneration may benefit from biomaterials that integrate a continuous gradient in both material composition and encapsulated growth factors.
Introduction
Scaffolds with gradients in properties may overcome the limitations of abrupt, distinct layers and enable a smooth transition of properties, which may be better suited for addressing the regeneration of interfaces between tissues. Systems with continuous gradients in material composition, bioactive signals, or substrate modulus have been widely explored for different applications such as protein delivery systems, to direct neuronal growth, to investigate cell–microenvironment interactions, to enhance cell proliferation and for interfacial tissue engineering.14–17
The emphasis of the current study was the in vivo examination of a three-dimensional (3D) scaffold with simultaneous gradients of both bioactive signals (growth factors) and material composition for osteochondral regeneration. The osteochondral scaffold was designed with opposing gradients of chondrogenic microspheres (encapsulating transforming growth factor [TGF]-β1) and osteogenic microspheres (encapsulating bone morphogenetic protein [BMP]-2) with or without hydroxyapatite (HAp) nanoparticles. For osteoconduction and faster bone maturation, BMP-2 and HAp were coencapsulated in the osteogenic microspheres, resulting in a gradient of both signal and material composition. The current study focused on developing a single osteochondral scaffold to deliver signals to defects in rabbit knees to promote maturation of the regenerated tissue.
Materials and Methods
Materials
Poly(D,L-lactic-co-glycolic acid) (PLGA) (50:50 lactic acid: glycolic acid, acid end group, MW ∼42,000–44,000 Da) of intrinsic viscosity 0.34–0.36 dL/g was obtained from Lakeshore Biomaterials. TGF-β1 and BMP-2 were obtained from Peprotech, Inc., and nanophase HAp was obtained from Sigma. All reagents and organic solvents utilized were of cell culture or ACS grade.
Fabrication of microspheres
Five different sets of microspheres were fabricated for the whole study: PLGA microspheres, chondrogenic microspheres (PLGA-TGF-β1), osteogenic microspheres (PLGA-BMP-2), HAp microspheres (PLGA-HAp), and osteogenic-HAp microspheres (PLGA-BMP-2-HAp). For preparation of the growth factor-loaded microspheres, TGF-β1 was reconstituted in a buffer of 10 mM citric acid diluted in 0.1% bovine serum albumin (BSA), and BMP-2 was reconstituted in 0.1% BSA. The reconstituted protein solutions were individually mixed with PLGA dissolved in dichloromethane (DCM) (20% w/v) at a loading ratio of 30 ng TGF-β1 or 60 ng BMP-2 per 1.0 mg of PLGA. The final mixture was then sonicated over ice (50% amplitude, 20 s). The HAp microspheres were fabricated by adding 4% w/v HAp to 16% w/v PLGA in DCM. The osteogenic-HAp microspheres contained 4% w/v HAp, 16% w/v PLGA and BMP-2 at a concentration of 60 ng/mg PLGA. A total of 0.75 μg of TGF-β1 and 1.5 μg of BMP-2 were encapsulated per scaffold.
Using PLGA-protein/HAp emulsions, uniform microspheres were prepared following technology that we previously reported.18–20 Briefly, using acoustic excitation produced by an ultrasonic transducer, regular jet instabilities were created in the polymer stream that produced uniform polymer droplets. An annular carrier nonsolvent stream (0.5% w/v polyvinyl alcohol [PVA] in DI H2O) surrounding the droplets was produced using a nozzle coaxial to the needle. The polymer/carrier streams flowed into a beaker containing the nonsolvent. The polymer droplets were stirred for 3–4 h to allow solvent evaporation, which were then filtered and rinsed with distilled water to remove residual PVA, and stored at −20°C. Blank control microspheres were prepared in a similar manner, where the protein solution was replaced with an equivalent volume of BSA solution (0.1%) and the particles were further lyophilized for 48 h.
Fabrication and characterization of gradient scaffolds
Gradient scaffolds were prepared using a technology reported previously.18–21 Briefly, lyophilized microspheres (∼25 mg) of two different types (TGF-β1, BMP-2, or BMP-2/HAp) were dispersed in distilled water, and separately loaded into two syringes. The suspensions were pumped at opposing flow rates into a cylindrical glass mold (diameter=3.8 mm) in a controlled manner using programmable syringe pumps (PHD 22/2000; Harvard Apparatus, Inc.). Using a filter at the bottom of the mold, distilled water was filtered, whereas the microparticles stacked in the mold until a height of 3 mm were reached. The scaffolds were 3.5 mm in diameter and 3 mm in height. The profile for gradient constructs was linear, where the top one-fourth of the total height was chondrogenic microspheres only (0.75 mm), the next one-fourth (0.75 mm) was a linear transition from one microsphere type to another, and the bottom half (1.5 mm) contained only osteogenic microspheres (Fig. 1). The stacked microspheres were then sintered using ethanol–acetone (95:5 v/v) for 45 min. The blank scaffolds were made in a similar manner with plain PLGA microspheres. The scaffolds were further lyophilized at −20°C for 48 h and ethylene oxide sterilized before implantation.

A representation of microsphere-based gradient scaffolds. Four different types of scaffolds were used for the study. The blank scaffolds (poly(D,L-lactic-co-glycolic acid) [PLGA] microspheres), bioactive gradient (transforming growth factor [TGF]-β1-loaded and bone morphogenetic protein (BMP)-2-loaded PLGA microspheres), hydroxyapatite (HAp) gradient (PLGA and HAp-loaded PLGA microspheres), and bioactive-HAp gradient (TGF-β1-loaded and BMP-2-HAp-loaded PLGA microspheres). The gradients were obtained by pumping these microspheres at different flow rates, packing them in cylindrical moulds and melding with ethanol-acetone (95:5) for 45 min. Color images available online at www.liebertonline.com/tea
The dispersion of HAp in PLGA microspheres was analyzed using LEO 1550 field emission scanning electron microscopy (SEM) with an energy dispersive system (EDS) using a SiLi detector at a 20 kV accelerating voltage. Pixel maps were generated using an EDS genesis software package. The dispersion was also confirmed by Fourier transform infrared (FTIR) spectroscopy imaging (results provided in the Supplementary Figs. S1–S3, available online at www.liebertonline.com/tea).
Implantation of gradient scaffolds in rabbit femoral condyles
Animal experiments were approved by the Institutional Animal Care and Use Committee of the University of Kansas (protocol #175-05). 18 male New Zealand White rabbits of age 6 months were used for the study. There were five different groups, with the following number of implants per group for each time point: Sham (n=2), blank (n=6), bioactive gradient (n=5), HAp gradient (n=2), and bioactive-HAp gradient (n=3). The rationale for a limited scale rabbit study was to both demonstrate feasibility of a novel scaffold design, and to prescreen groups to gain a better understanding of which formulations may be more promising for more in-depth evaluation in larger animal studies. The experimental design is represented in Figure 2. Different gradient groups were implanted in the same rabbits, in opposing knees so that single types of gradient implants were not isolated to one animal. This helped in mitigating the effects of animal variation, as we could score within the same animal (between knees), as well as between animals.
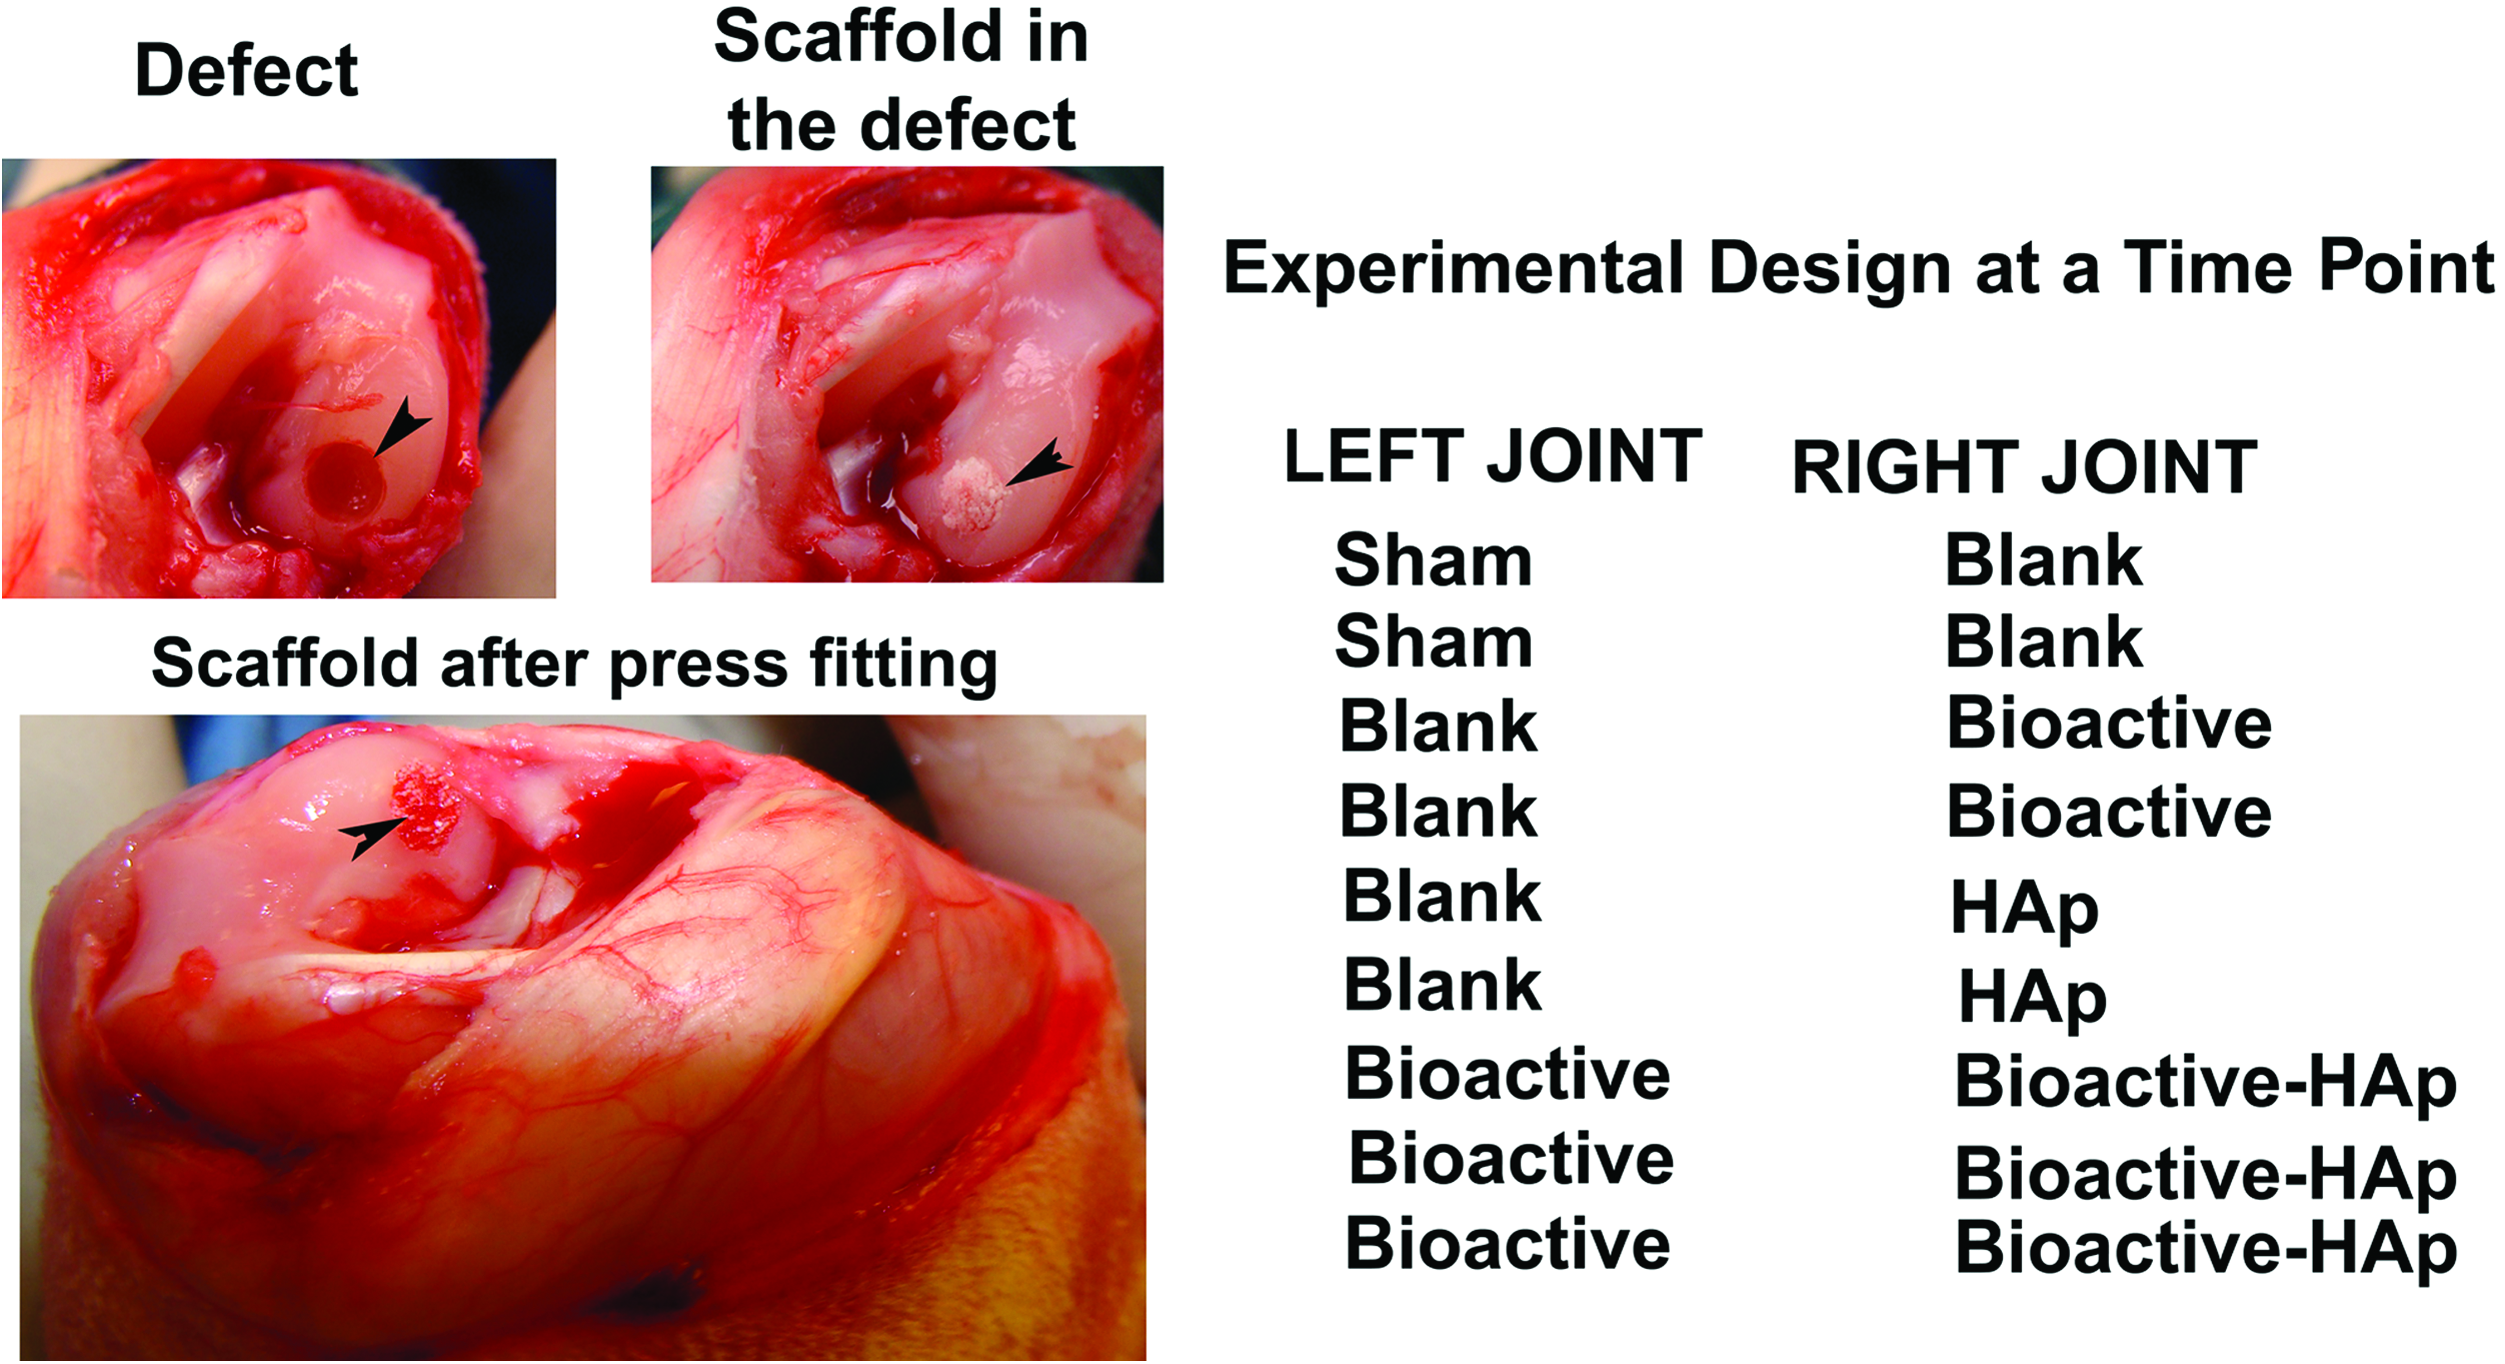
The medial femoral condyle showing the empty defect, gradient scaffolds placed in the defect, press-fitted implants that were flush to the surface, and the experimental design at each time point. Color images available online at www.liebertonline.com/tea
Routine antibiotics and analgesics were prescribed preoperatively to prevent infection and reduce pain during and after the operation, and general anesthesia was induced with a combination of ketamine (40 mg/kg) and xylazine (5 mg/kg) and 2%–4% isoflurane by inhalation during the surgery. The implantation was carried out using sterile techniques. A medial parapatellar incision was made at the outer skin and the muscle, the joint capsule was opened, the joint was flexed, and the medial condyle was exposed. The cartilage at the medial femoral condyle was scored to mark the defect site and a drill bit (3.5 mm) was used to make the defect that extended to the subchondral bone to a depth of 3 mm. Each defect site was continuously flushed with saline to remove the bone debris. The sterile gradient plugs were inserted into the defect site by press fitting until flush with the surface. The sham had a defect without any plugs inserted. Figure 2 represents images of a medial femoral condyle showing the empty defect, gradient scaffold placed in the defect, and a press fitted implant that was flush to the surface. The patella and femur were relocated, and the articular capsule and bursae were closed with an absorbable suture and skin bound with a nonabsorbable suture. The animals were given a subcutaneous injection of analgesics twice daily for 5 days postsurgery and were allowed unrestricted movement. The rabbits were euthanized by a high dose of intravenous barbiturate (200 mg/kg) at 6 and 12 weeks. The joint capsule and the implant sites were examined for any signs of inflammation (swelling or reddening) or infection at the joint. The whole joints were retrieved, photographed, scored for morphological analysis, and processed for MRI and histology.
Morphological analysis of the retrieved implants
A scoring was carried out for macroscopic observations based on the different parameters such as the presence of repair tissue, edge integration at the boundaries of newly regenerated tissue and the native cartilage, smoothness of the repair surface, degree of filling at the cartilage surface, color of the regenerated cartilage, and the percent of repair tissue relative to the total area. The scoring details are represented in Table 1.
Magnetic resonance imaging of the retrieved implants
The high-resolution MRI was performed using a 9.4 T Varian system equipped with a 12 cm gradient coil (40 G/cm, 250 μs) (Varian, Inc). The retrieved joints were embedded in a 2% agarose solution to reduce bone–air susceptibility artifacts. The samples were imaged using a 5 cm volume transmit radiofrequency (RF) coil and a 7 mm surface receive RF coil. T2-weighted MRI was performed using a spin echo sequence with multiple echo times (TE). MRI parameters were TR/TE=1200/13, 23, and 33 ms, FOV=1.5×1.5 cm, matrix=256×256, slice thickness=0.3 mm, number of averages=4, and scan time per echo time=21 min. The T2 relaxation time for cartilage was generated by fitting MR signal intensities to a monoexponential function using a Simplex algorithm in ImageJ software (NIH) in a pixel-by-pixel basis.
Histological analysis
The samples were fixed in neutral buffered formalin, dehydrated in ethanol, infiltrated with methylmethacrylate solution, and embedded in poly(methyl-methacrylate). Ten micron sections from the center of the defect site were taken using a hard tissue microtome (Thermo Scientific; Microm HM 355S), deplasticized in 2-methoxy-ethyl acetate, and rehydrated. The sections were stained using Safranin O for glycosaminoglycans (GAGs), and Alizarin red and von Kossa for bone mineralization. The histology sections were scored using a scoring system consisting of parameters as listed in Table 2. The Safranin O staining was compared to the staining of native cartilage adjacent to the defect site on the same section. They were assigned scores to represent normal staining that corresponded to uniform staining of cartilage at an intensity similar to the surrounding native cartilage, moderate staining when the staining intensity was uneven and localized at specific area on the regenerated cartilage, poor staining that represented negligible staining of GAGs, and no staining when it was completely absent. The regenerated cartilage was also scored for cartilage thickness at the center and at the edges of the defect site and compared to the adjacent native cartilage present in the same section. They were assigned scores to represent similar (0.2–0.5 mm thickness) to native cartilage with the bone tissue underneath the cartilage layer, a depressed surface without the bone underneath or an overgrown layer of cartilage with/without the bone underneath. The percentage filling of new bone and edge integration was also scored. The complete data set was represented by a stack column plot. The sections were also stained with Sudan black to identify the presence of degraded polymer at the defect site.
GAG, glycosaminoglycan.
Statistical analysis
Statistical analyses were performed using a single-factor analysis of variance in Origin 6.0 software for quantitative analysis of T2 relaxation time for MRI. All values were expressed as the average±standard deviation.
Results
Dispersion of HAp on PLGA microspheres
Figure 3 represents the SEM images and elemental distribution (C, Ca, and P) of the PLGA and PLGA-HAp microspheres. The SEM results showed that the microspheres encapsulating HAp nanoparticles had a rough porous surface when compared to blank (unloaded) PLGA microspheres. The EDS results indicated that calcium was distributed throughout the microspheres. The distributions of carbon, calcium, and phosphorous are displayed in red, purple, and blue, respectively. The peaks corresponding to Ca and P in the EDS spectrum of PLGA-HAp microspheres (Supplementary Fig. S1) also confirmed the presence of HAp.
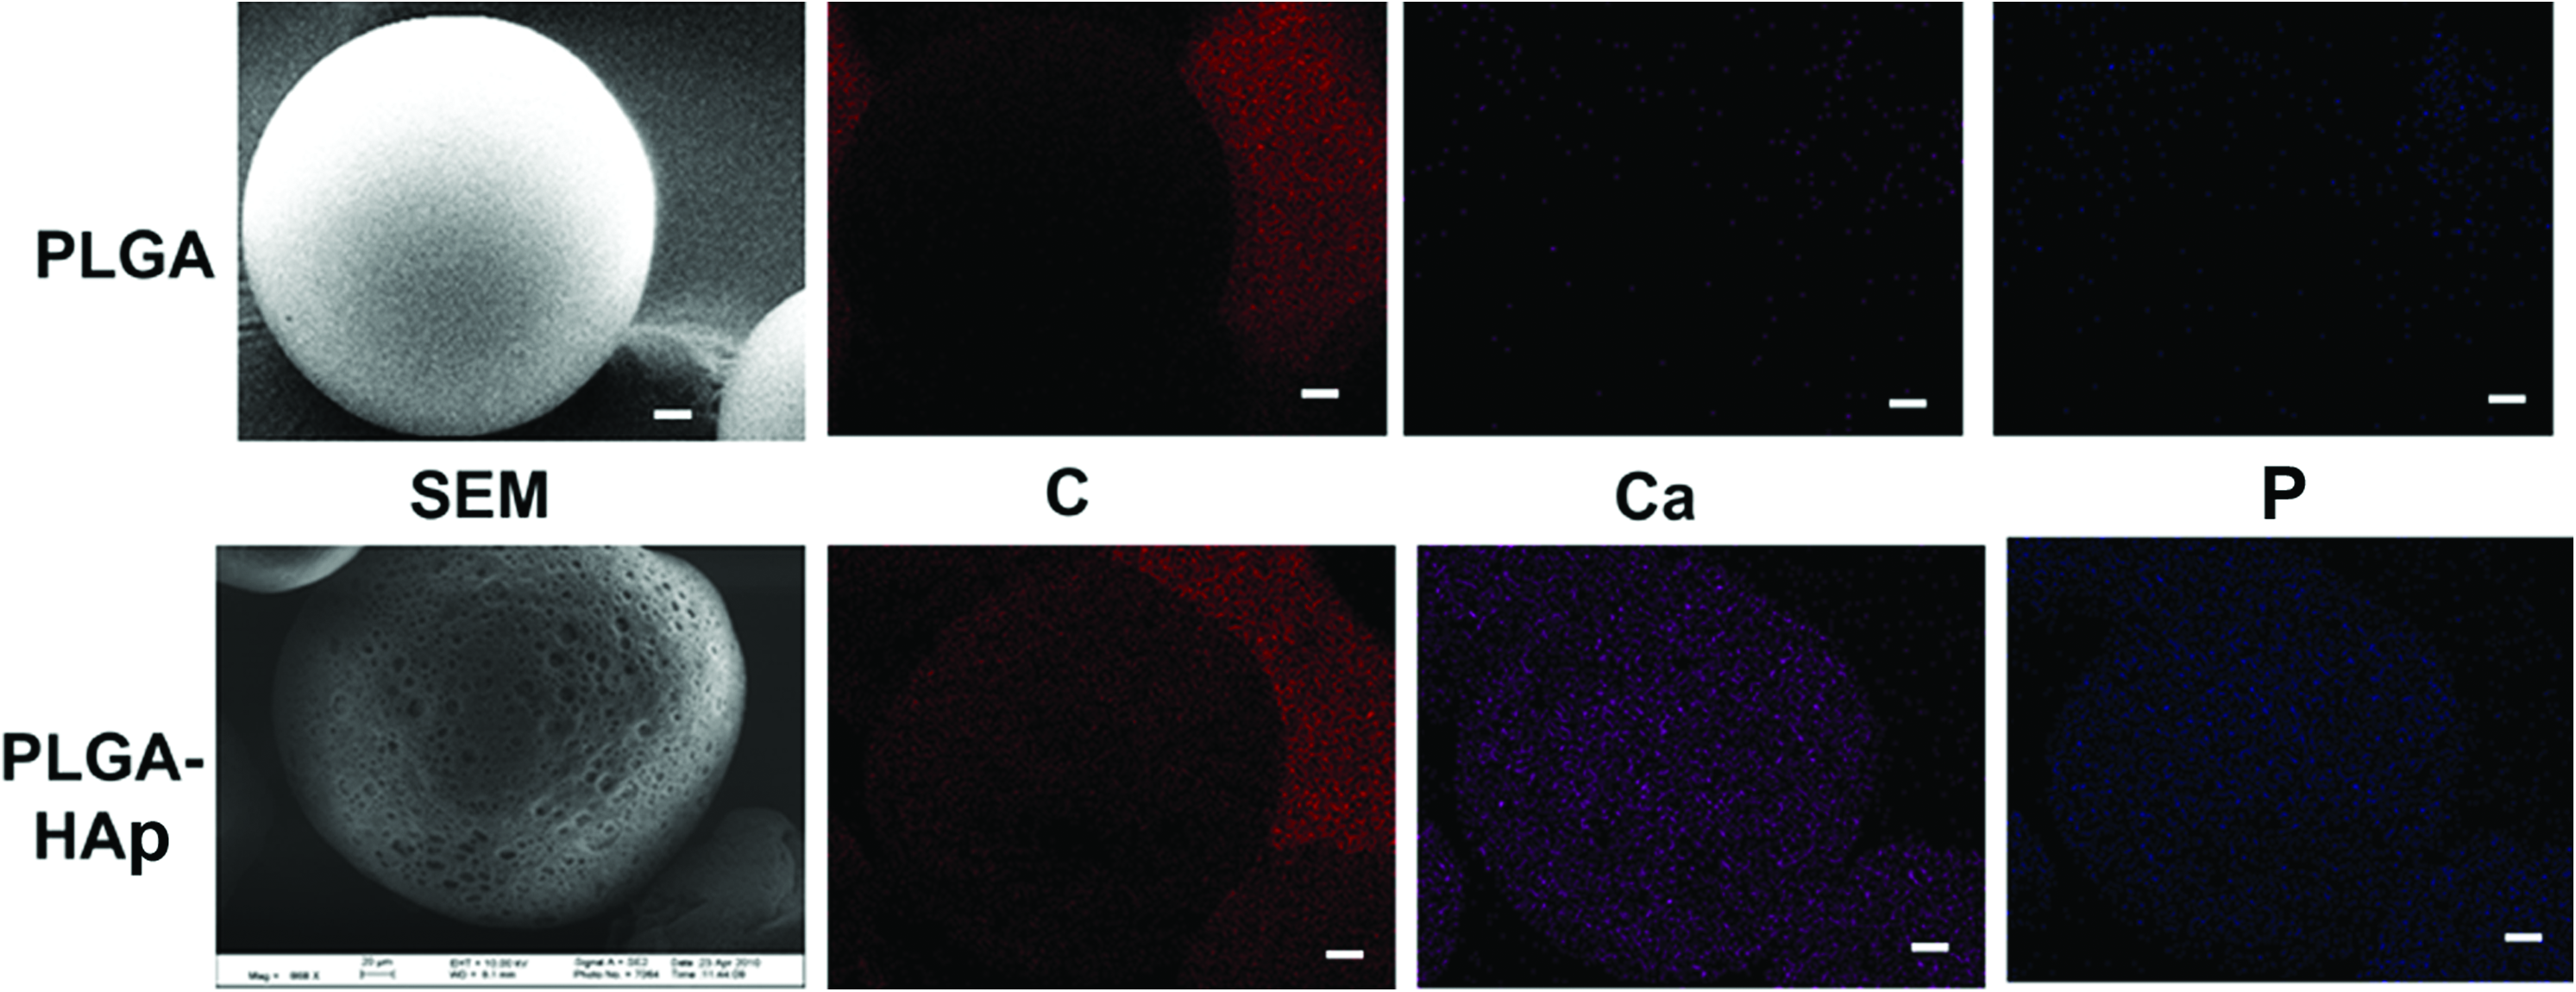
Scanning electron microscopy (SEM) images and elemental distribution (carbon [C], calcium [Ca], and phosphorus [P]) of PLGA and PLGA-HAp microspheres obtained using energy dispersive system. The top panel corresponds to PLGA and the bottom panel represents PLGA-HAp (80:20). Scale bar: 20 μm. Color images available online at www.liebertonline.com/tea
Macroscopic observations and MRI
All animals continued to exhibit normal movement during the 6- and 12-week periods. Gross signs of inflammation (swelling or reddening of the joint) or infection were not evident upon visual inspection of the joint surface at the time of tissue retrieval. The synovial fluid had a normal color. Figures 4 and 5 show representative gross morphology and T2-weighted MRI images of implants retrieved at 6 and 12 weeks, respectively. The percent area occupied by the regenerated cartilage with respect to the total defect area was determined macroscopically for each sample at 6 weeks. The values fell within the range of 80%–90% for all of the samples in the sham and blank groups and 80%–95% in the bioactive group (except one sample in this group where the repair tissue covered only 50% of the total defect area). The HAp and bioactive-HAp gradient groups had a repair cartilage that covered >90% of the defect area in all of the samples. The repair tissue was opaque, almost flush with the scaffold surface, and had smooth or intermediate texture with bioactive-HAp gradient samples, whereas all of the other groups had an opaque, slightly depressed/overgrown surface, with either rough or intermediate texture at 6 weeks.
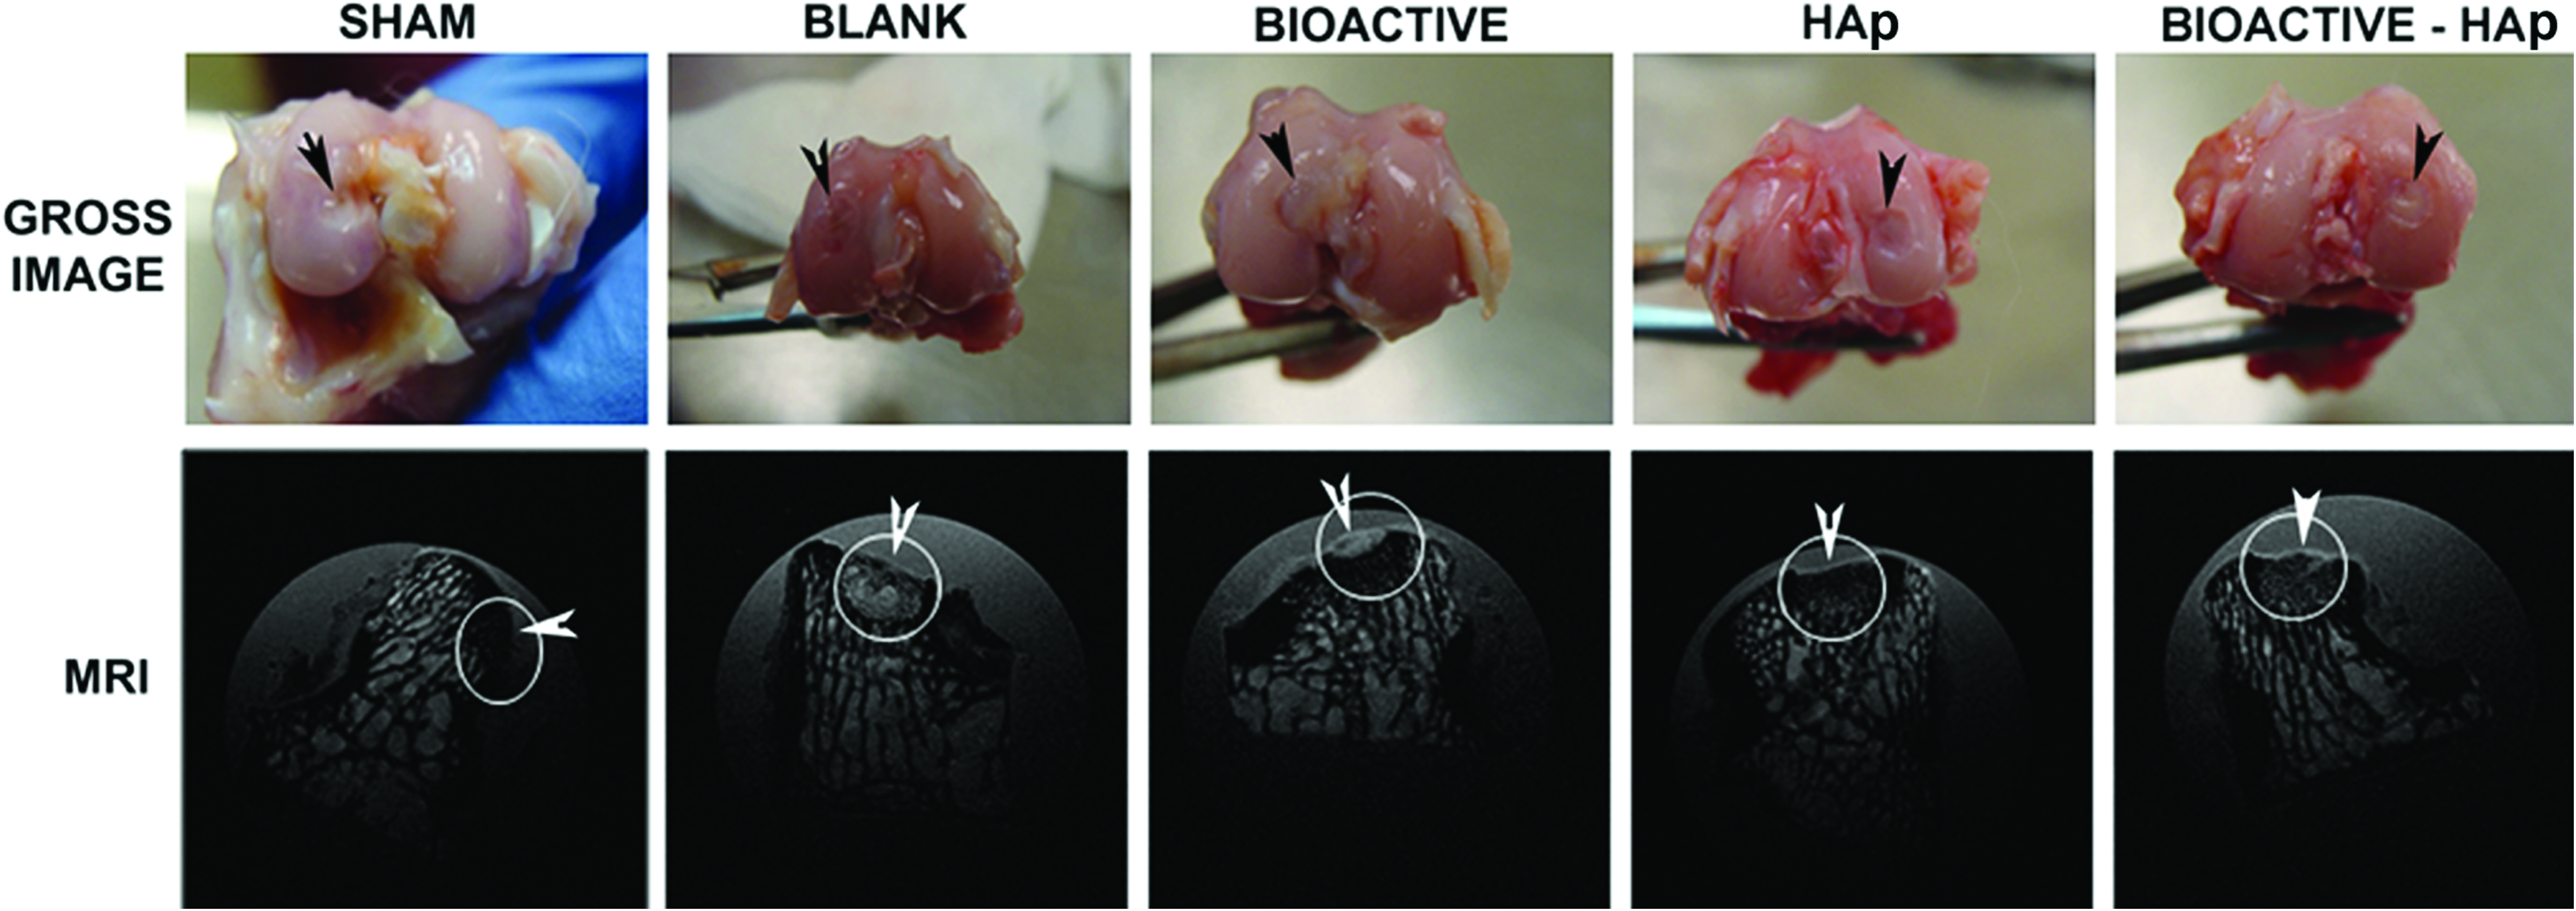
The gross morphology and the T2-weighted MRI of representative samples, 6 weeks postimplantation. The repair tissue was opaque, almost flush to surface, and had smooth or intermediate texture in bioactive-HAp gradient, whereas all the other groups had opaque, slightly depressed/overgrown surface, with either rough or intermediate texture at 6 weeks. The high-field-strength 9.4-Tesla MRI showed initiation of bone regeneration in sham, blank, and bioactive covering <50% of defect area and higher in HAp and bioactive-HAp gradient samples. (Black arrowhead points to the defect area on the medial femoral condyle on the retrieved joints, the circle denotes the defect area on the T2 MRI slice, and the white arrowhead points to the regenerated cartilage.) Color images available online at www.liebertonline.com/tea
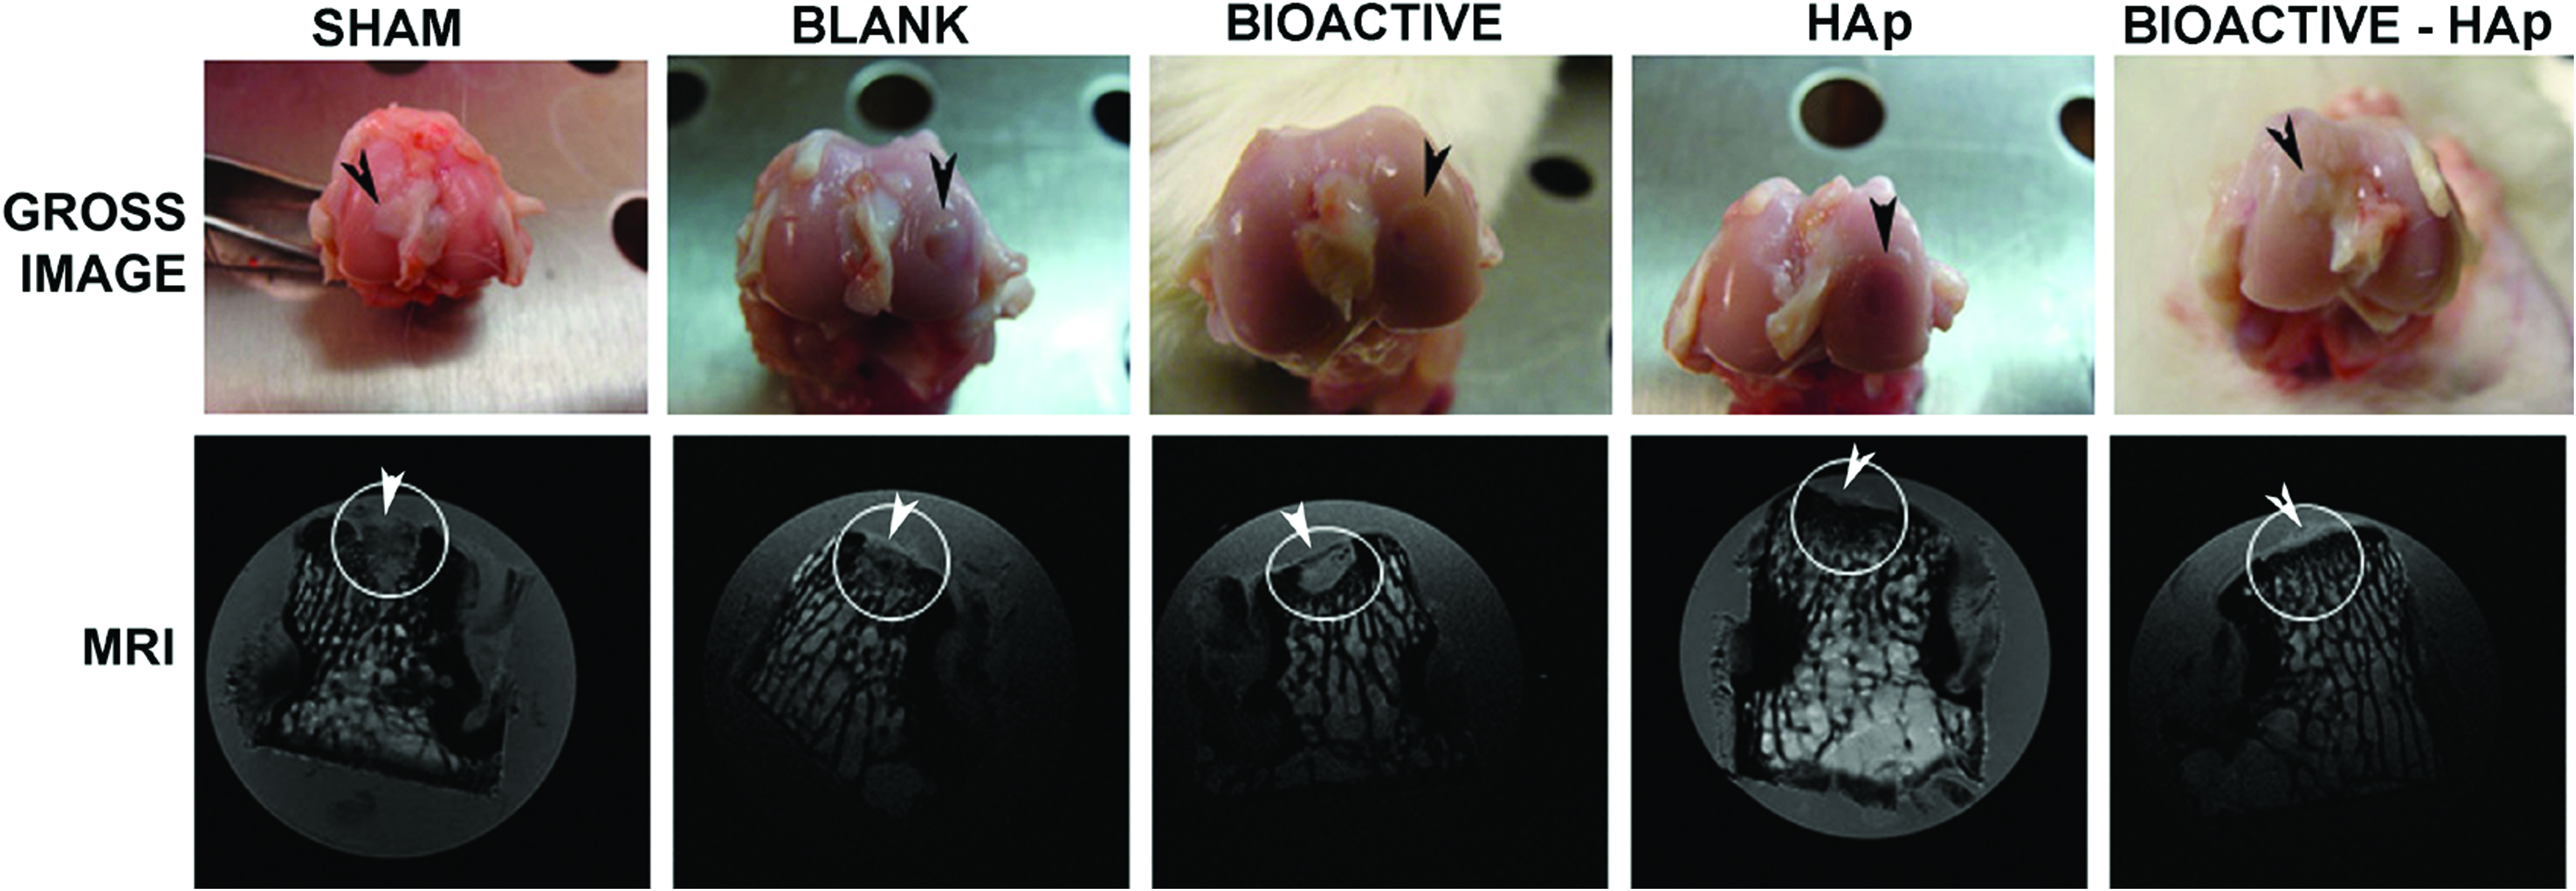
The gross morphology and the T2-weighted MRI images of representative samples, 12 weeks postimplantation. The repair tissue covered the entire defect area in all of the samples. The regenerated cartilage was flush to the surface in the bioactive, HAp, and the bioactive-HAp gradient groups. The high-field-strength 9.4-Tesla MRI showed complete bone regeneration for the HAp and bioactive-HAp gradient groups, with the latter having a micro-architecture similar to the native tissue. The regenerated cartilage had the same thickness as the native tissue and was completely integrated with the surrounding cartilage. (Black arrowhead points to the defect area on the medial femoral condyle on the retrieved joints, the circle denotes the defect area on the T2 MRI slice, and the white arrowhead points to the regenerated cartilage.) Color images available online at www.liebertonline.com/tea
At 12 weeks, the sham, bioactive, and HAp gradient implants had regenerated tissue with a smooth appearance that was flush to the scaffold surface and the regenerated cartilage covered >95% of the total defect area in all the samples. With the blank implants, the regenerated cartilage covered 80%–90% of the defect area in all of the samples with slightly depressed or overgrown tissue exhibiting an intermediate texture. The samples in the bioactive-HAp gradient group had a repair cartilage that covered >99% of the total defect area. We observed a negligible depression at the boundary of one sample in this group, which was also taken into account in the analysis, and the results were thus represented as >99% instead of 100%. The cartilage was completely flush to the surface, was smooth, and had a color similar to the surrounding native tissue in this group.
The T2-weighted images gave excellent contrast between the subchondral bone and the articular cartilage. The morphology of the cartilage at the defect area (flush, depressed, or proud) with respect to the native cartilage and extent of bone regeneration could be clearly observed in the T2 images. These observations correlated well with the histology data. The overall T2 relaxation time was calculated for regenerated cartilage at the upper part of the defect area, corresponding to the thickness of the surrounding native tissue. T2 values of HAp gradient and bioactive-HAp gradient showed a significant difference (p=0.01411) when compared to the blank and bioactive groups at 6 weeks. We did not, however, find statistically significant differences in T2 relaxation times among the groups at 12 weeks (Fig. 6).

Overall T2 relaxation time for newly regenerated cartilage (region of interest [ROI] was selected corresponding to the thickness of adjacent native cartilage) at 6 and 12 weeks postimplantation. All values were expressed as the average±standard deviation. T2 values of HAp gradient and bioactive-HAp gradient showed significant difference when compared to the blank and bioactive groups (p=0.01411) at 6 weeks. However, there were no significant differences among the samples at 12 weeks.
Histological observations
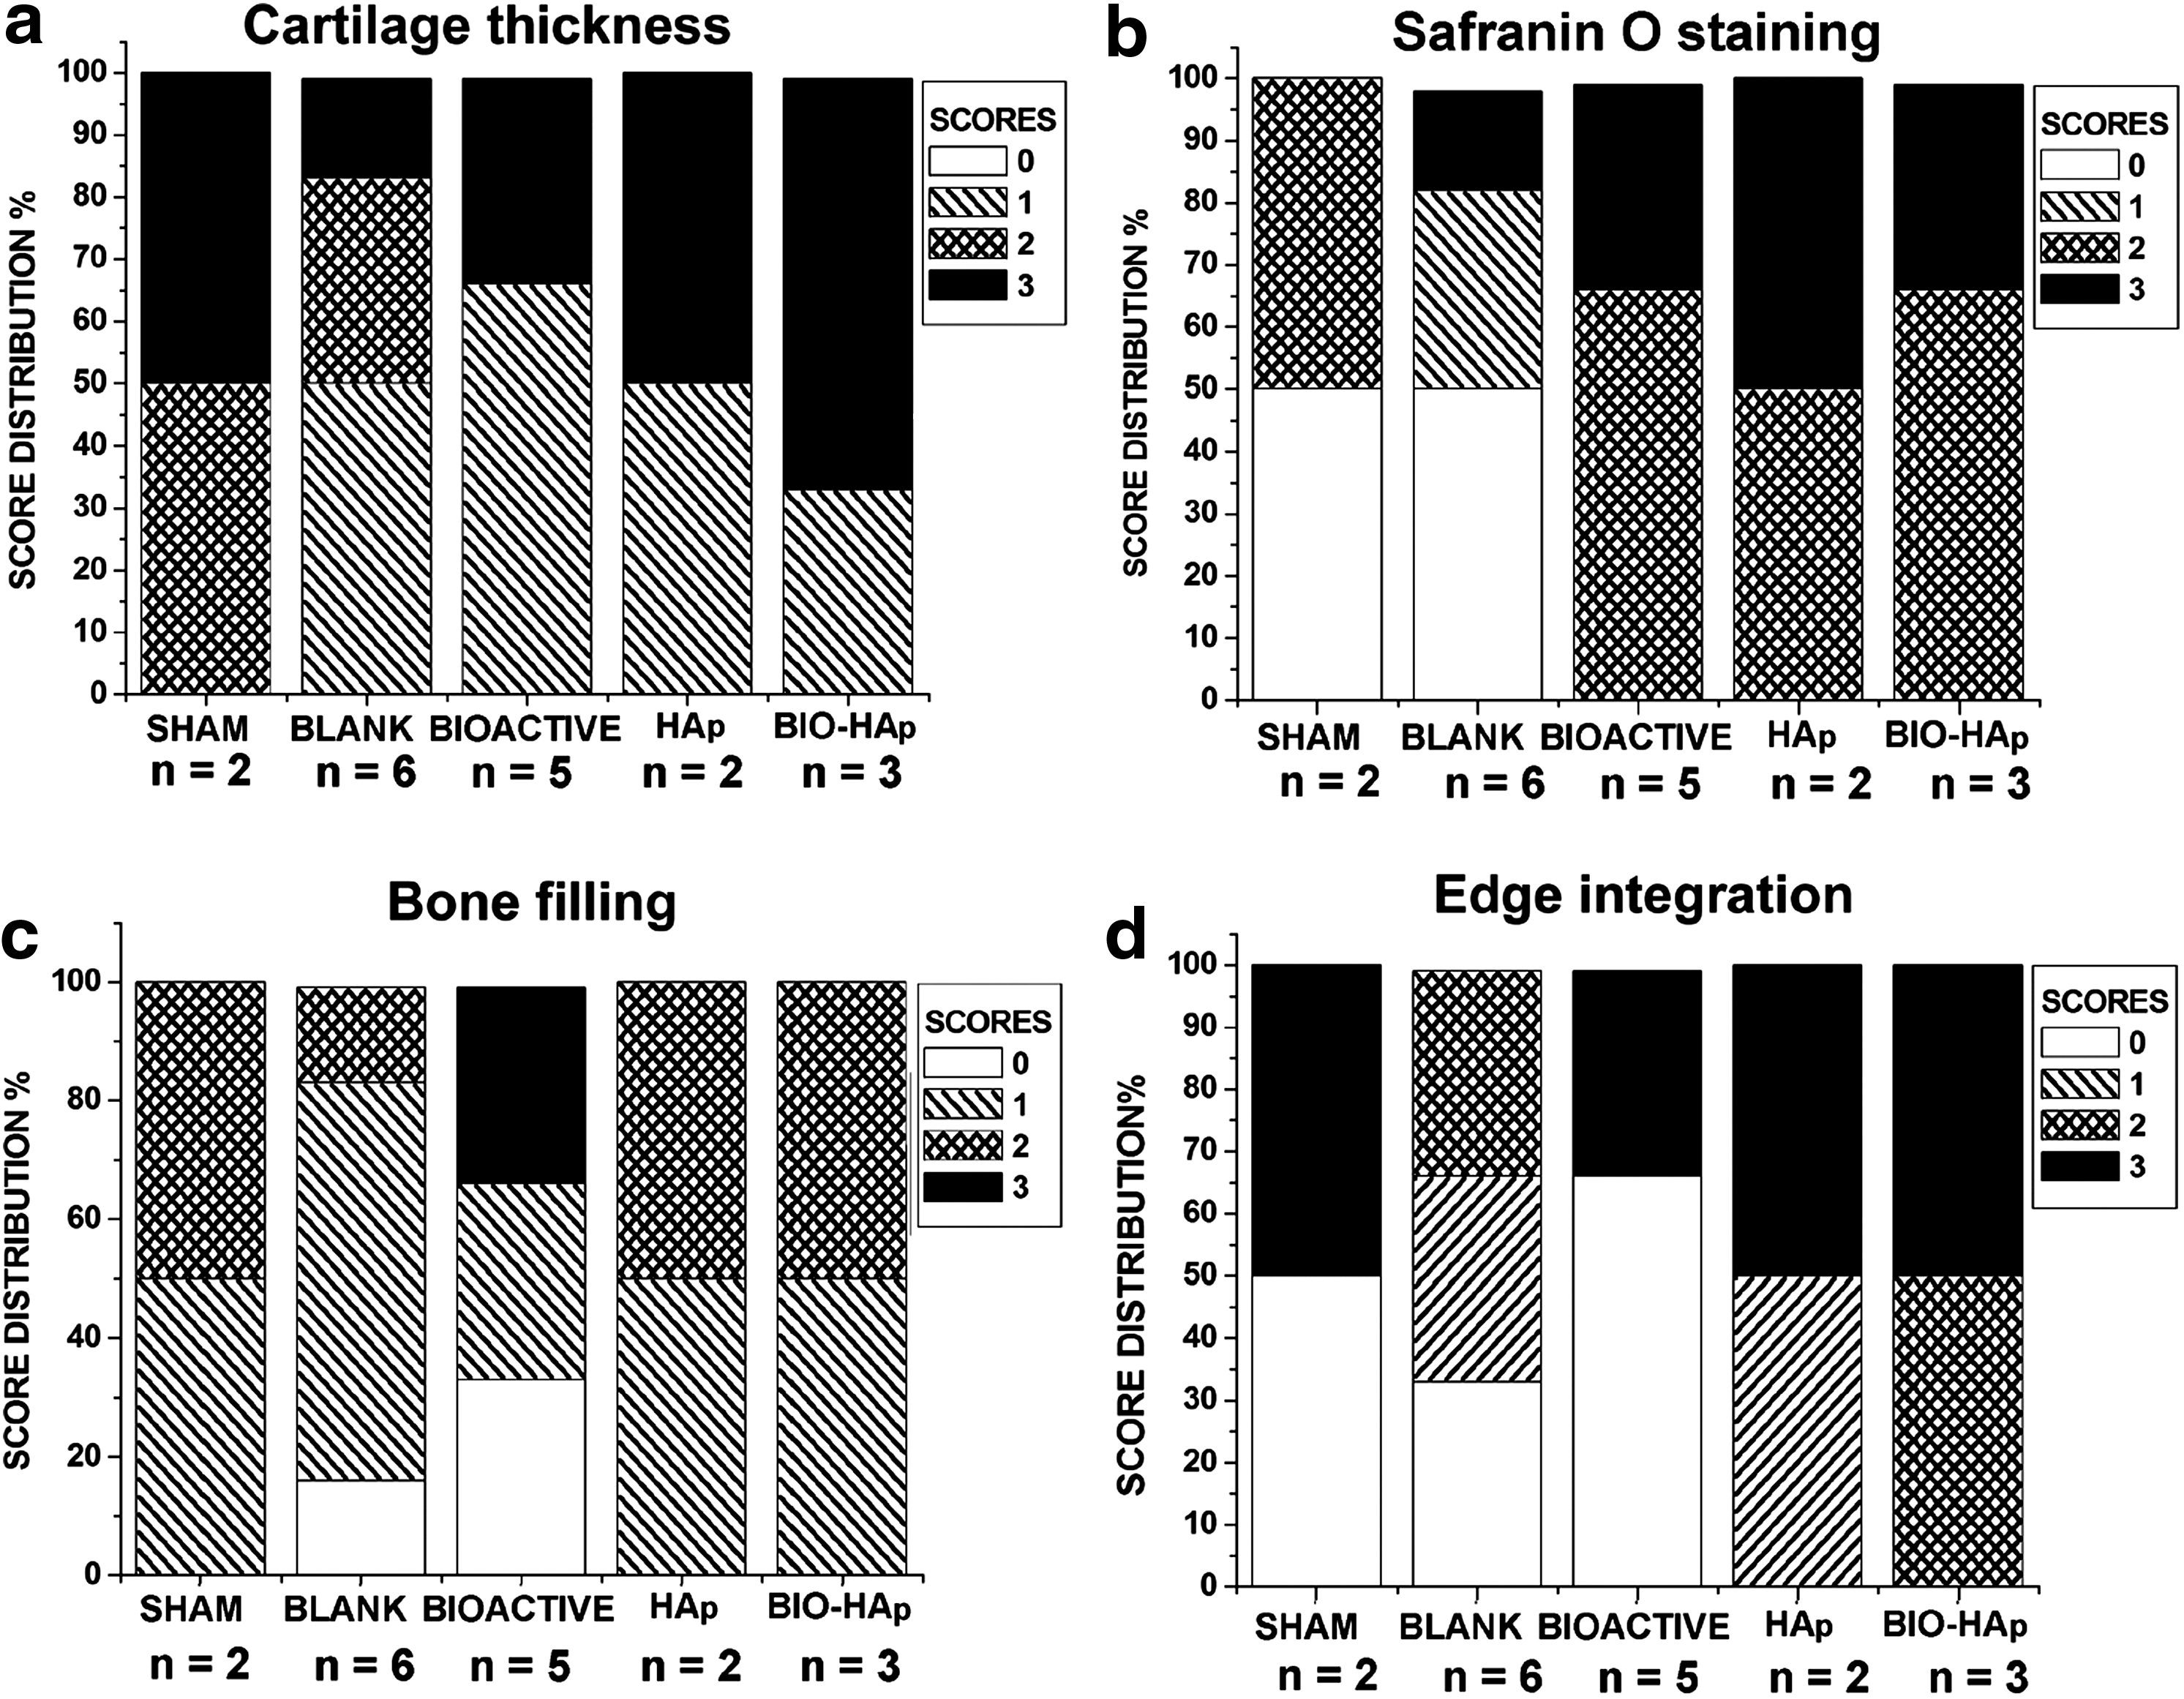
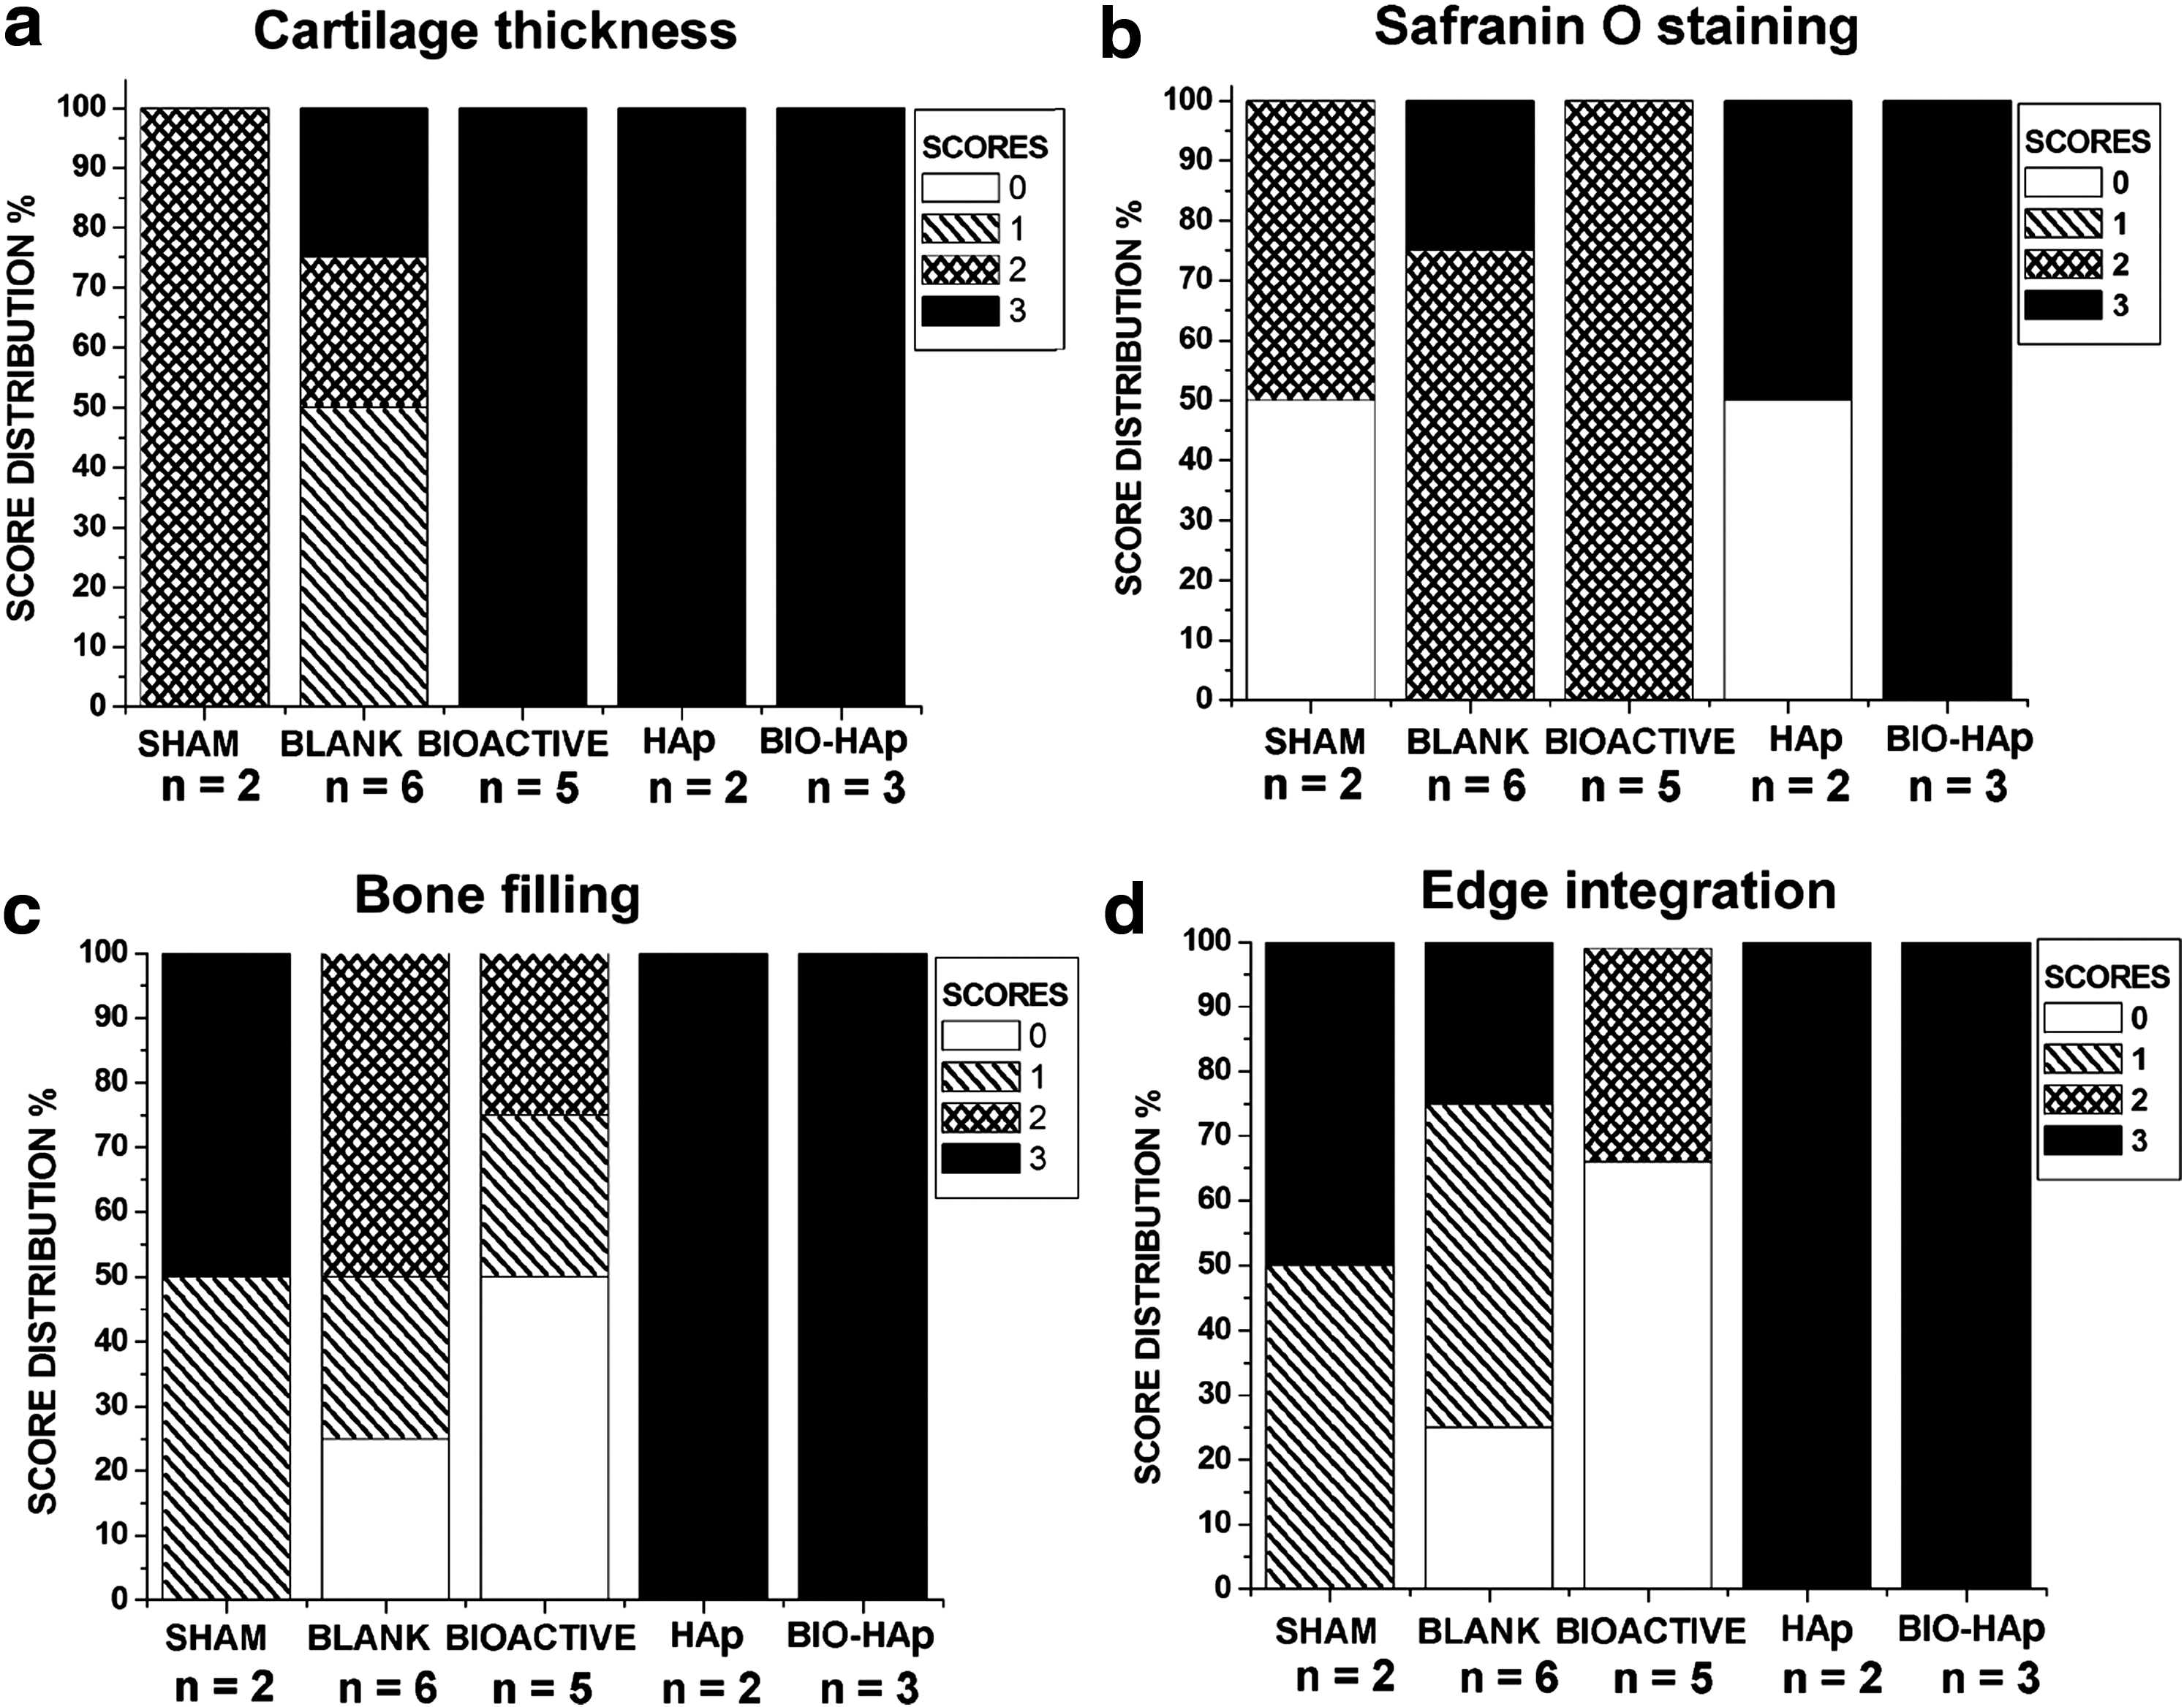
Discrete sections taken at 10 micron intervals were used for the staining of GAG deposition and bone mineralization. Figures 7 and 8 are representative sections stained with Safranin O for GAGs, Alizarin red for calcium deposition, and von Kossa for the presence of phosphates at 6 and 12 weeks, respectively. At 6 weeks, one of the sham samples did not show any Safranin O staining, and the different samples in blank group had uneven distributions of GAGs. The staining pattern and intensity varied in the gradient groups at 6 and 12 weeks. Alizarin red and von Kossa staining indicated the presence of mineralized bone at the defect area. The HAp and the bioactive-HAp samples showed higher amounts of mineralized bone at the defect area at both 6 and 12 weeks. Figures 9 and 10 represent the complete set of data showing the histological score distribution for (a) cartilage thickness, (b) Safranin O staining, (c) bone filling, and (d) edge integration for the newly regenerated tissue at the defect area for 6- and 12-week samples.
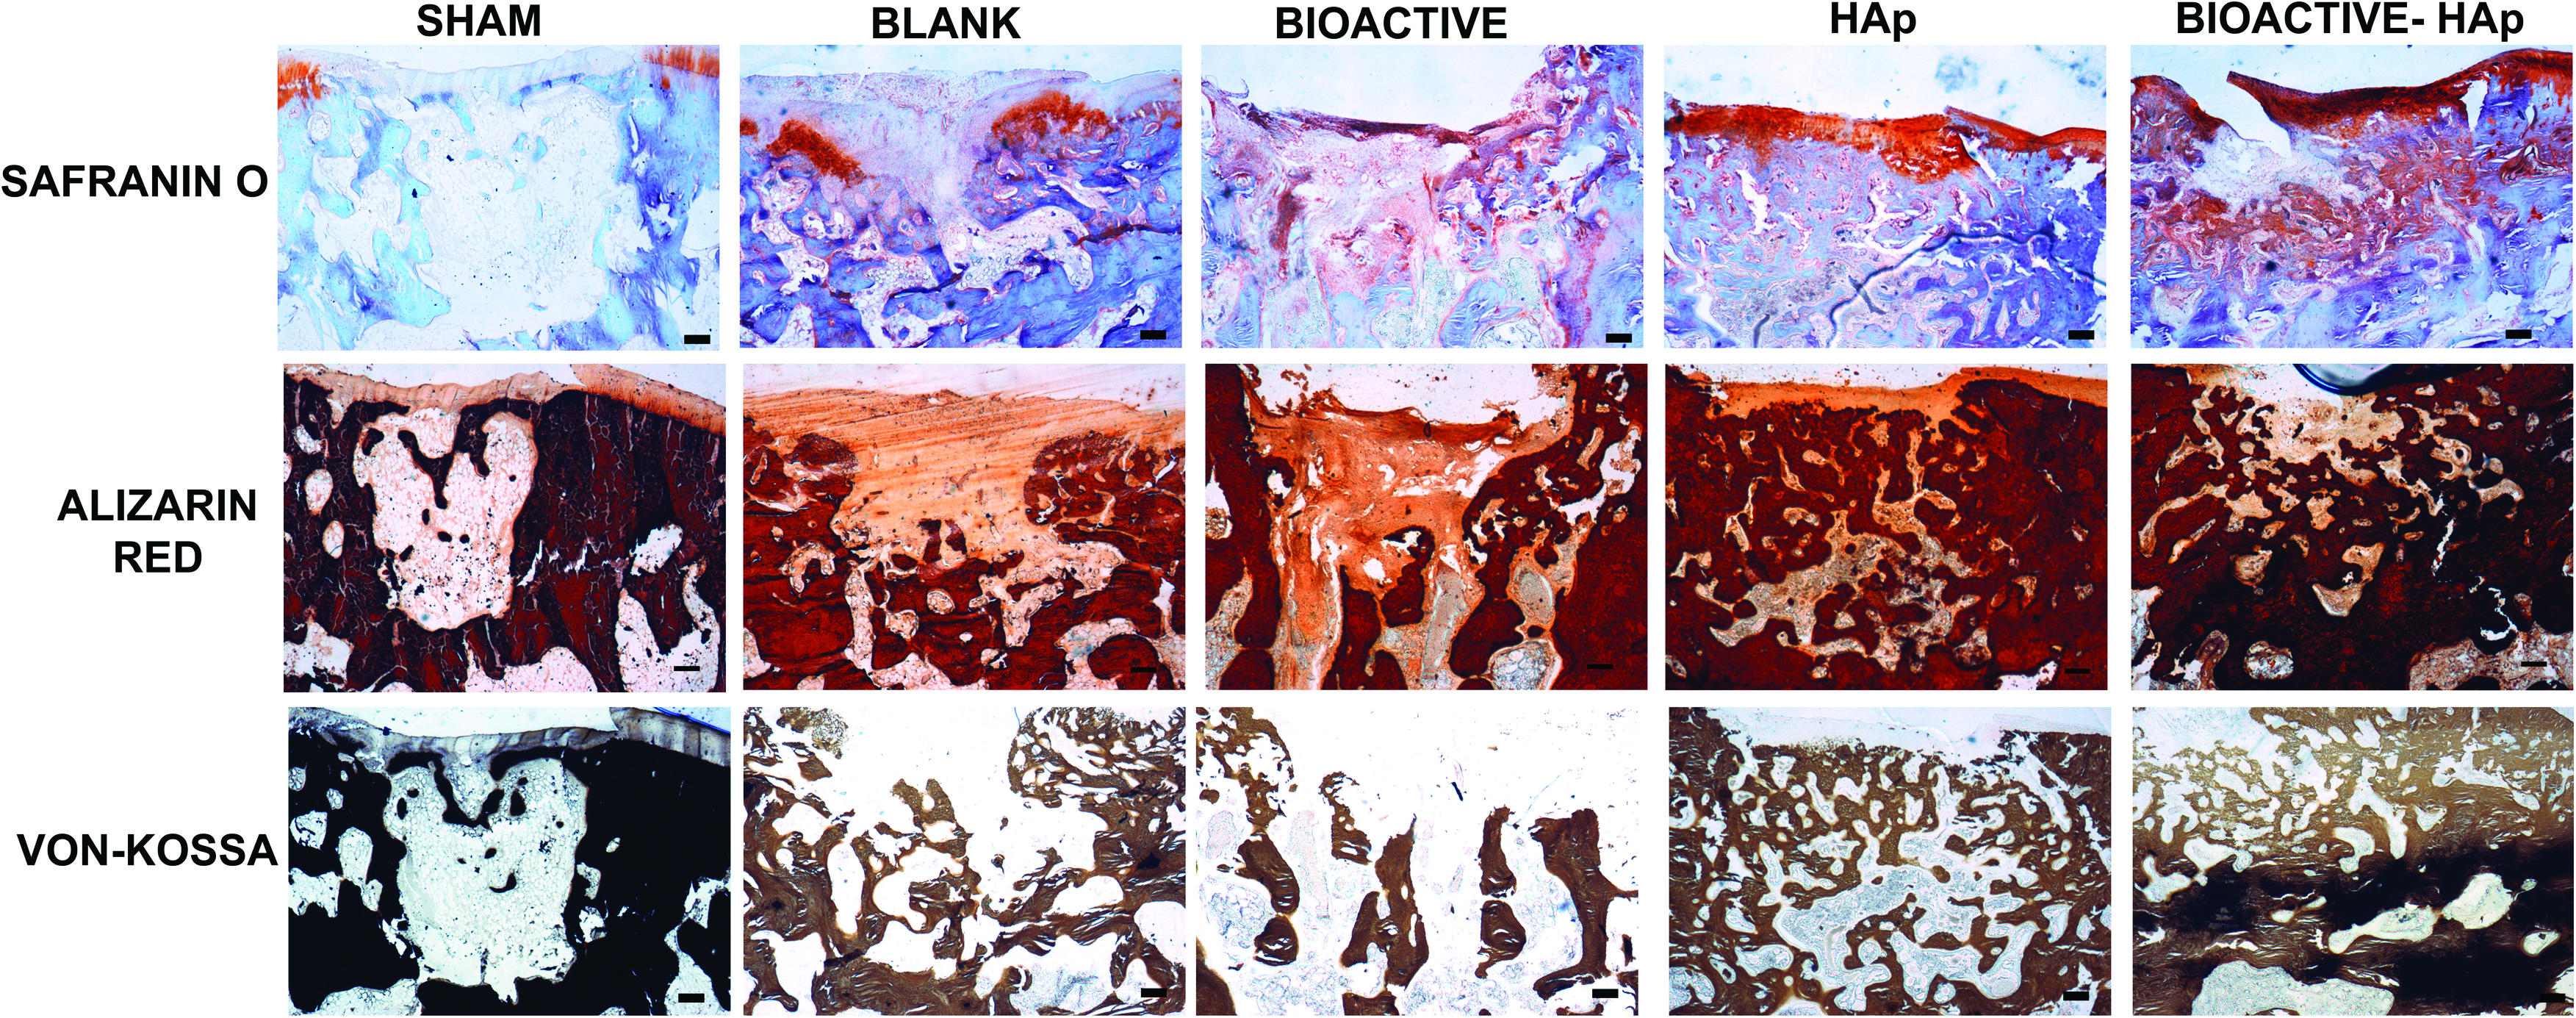
Representative images for histological analysis of osteochondral repair at the rabbit femoral medial condyle, 6 weeks postimplantation. The sham group showed negligible glycosaminoglycan (GAG) deposition and mineralization. The intensity of Safranin O staining was higher in the blank and bioactive gradient groups, with initiation of bone mineralization. The bone ingrowth covered 75% of the defect area in the HAp and bioactive-HAp gradient groups, with a more intense staining for GAGs on the cartilage surface. Scale bar: −200 μm. Color images available online at www.liebertonline.com/tea

Representative images for histological analysis of osteochondral repair at the rabbit femoral medial condyle, 12 weeks postimplantation. The sham group showed a fibrous outgrowth at the defect site. Bone ingrowth and mineralization was observed from both sides of the defect area in the blank group with an unstable cartilage on top. There was GAG deposition in the bioactive gradient group with minimal bone ingrowth. Both the HAp and bioactive-HAp gradient groups showed a complete bone regeneration and mineralization. A stable cartilage, with a thickness similar to native tissue, having proper integration on the edges and high GAG deposition, was observed in the bioactive-HAp gradient group. Scale bar: 200 μm. Color images available online at www.liebertonline.com/tea
Stacked column plot showing the histological score distribution for
Stacked column plot showing the histological score distribution for
At this time point, only 50% of the samples in the HAp gradient group and less than half of the samples in the bioactive-HAp gradient group stained for GAGs similar to the surrounding native cartilage. The thicknesses of the cartilage at the center and the edges of the defect site were compared to the adjacent native cartilage present in the same section. The thickness of the regenerated cartilage at the defect site was similar to surrounding native tissue in 66% of the bioactive-HAp group, 50% of the HAp group, and 33% of the bioactive gradient group, with the remaining samples having a slight depression. Negligible staining was observed in 50% of the samples in the sham and blank groups, whereas the staining intensity was moderate in the other 50% of the sham samples. The sham group had an equal proportion of samples with a thickness greater than or similar to native tissue. Staining varied from moderate (with a score value of 2, when the staining intensity was uneven and localized to a specific area on the regenerated cartilage) to normal (with a score value 3 that represented uniform staining of cartilage at an intensity similar to the surrounding native cartilage) for the other 50% of the blank group samples. In the blank group, the variation was higher between the samples. The cartilage in the defect area was totally absent, depressed, or overgrown from the surface when compared to the surrounding native tissue.
Calcium and phosphate deposition were observed in the regenerated bone in all of the samples as indicated by the Alizarin red and von Kossa staining. Fifty percent of sham and HAp gradient samples had bone occupying more than half of the defect area and showed complete integration with the surrounding bone at the edges of the scaffold. The rest of the samples had bone regeneration that obtained a score value of 1 (occupied <50% of defect area) with partial or no continuity at the edges. In the bioactive-HAp group, two of the three samples obtained a score value of 2 (bone regeneration that occupied >50% of defect area) with complete integration at the edges of the scaffold, whereas the remaining one sample had a score value of 1. More than half of the samples in the bioactive group had isolated bone regeneration without any continuity with the surrounding tissue.
At 12 weeks, 100% of the samples in the bioactive and bioactive-HAp groups, and 50% of the samples in the HAp gradient group, had Safranin O stains similar to the surrounding native tissue. The rest of the samples in the HAp gradient group showed negligible staining for GAGs. The sham group showed moderate staining, and the staining intensity in the blank group varied between mild, moderate, and normal. All of the animals that received bioactive-HAp implants and 50% of the animals with HAp gradient implants had a cartilage thickness comparable to native cartilage. The bone regeneration was almost complete with significant edge integration in animals that received both the bioactive-HAp and HAp gradient samples. Similar bone regeneration was also observed in 50% of the sham group knees, whereas the response varied in animals that received both blank and bioactive gradient implants. The cartilage–bone interface was continuous and integrated at the osteochondral zone in HAp and bioactive-HAp groups, whereas such integration was not observed in other groups. The Sudan black staining showed traces of polymer in almost all of the groups at 6 weeks. By 12 weeks, there were negligible traces of polymer except for one sample in the bioactive group, where we observed spherical impressions of microspheres in the regenerated tissue at the defect site, suggesting that these impressions might have traces of degraded polymer (Supplementary Fig. S4).
Discussion
This current study evaluated the regeneration of both bone and cartilage at the osteochondral interface by delivery of tissue-specific stimuli using a gradient technology. Singh et al. 21 presented the first report of a technique for formulating a continuous, macroporous 3D gradient in bioactive factors using microspheres. Later, this technology was used to encapsulate titanium dioxide (TiO2) or calcium carbonate (CaCO3) to formulate a gradient in stiffness. 18 In addition, our previous in vitro analysis with growth factor gradients showed that the gradient technology was better than a biphasic approach in early tissue synthesis for osteochondral tissue engineering. 20 The primary objective of the current study was to evaluate the potential of this 3D microsphere-based gradient approach, where gradients in material composition and growth factor release were combined for the first time for osteochondral regeneration of critical-sized defects in rabbit knee joints. The rationale for the limited scale rabbit study was to prescreen groups to gain a better understanding of which formulations may be more promising for more in-depth evaluation in larger animal studies. Different gradient groups were implanted in the same rabbits, in opposing knees so that single types of gradient implants were not isolated to one animal. This helped in mitigating the effects of animal variation, as we could score within the same animal (between knees), as well as between animals. We observed that the implant became soaked with the bone marrow within 1–2 min after press fitting to the defect site. We expect the mesenchymal stem cells in the bone marrow to fill in the void spaces between the microspheres in the porous scaffold and initiate the regeneration process as observed in the process of cartilage repair during subchondral drilling. The chondrocytes that migrated into the defect area from the surrounding cartilage might have also participated in the regeneration of cartilage at the defect site, although likely to a much lesser extent.
The scaffolds in the current study were made with a formulation to tailor the degradation time to be approximately 3–4 weeks, so that the loaded growth factors were released into the defect site within the study period. This release was designed to trigger early differentiation of infiltrated progenitor cells to chondrogenic and osteogenic lineages. In our previous reports, we evaluated the in vitro release profile of TGF-β1 and BMP-2 from this PLGA over 3 weeks and demonstrated that biologically active growth factors were released, which were capable of differentiating human umbilical cord mesenchymal stromal cells along chondrogenic and osteogenic lineages. 20 HAp is an osteoconductive material and has been widely used for bone regeneration.22–24 HAp was included to potentially elicit desirable cellular responses and as a raw material to be incorporated into the regenerated tissue. In addition, the basic resorption products of HAp may help to buffer the acidic degradation byproducts of PLGA. By 12 weeks, the scaffolds were almost completely degraded, except for one sample in the bioactive group that showed some staining for Sudan black, suggesting the presence of some remaining polymer. Several studies have shown that the residence time of a scaffold in a defect has a clear impact in both the timing of the sequence of events leading to the repair and the final outcome of the repair.25,26
The results of MRI, Alizarin red, and the von Kossa staining indicated that the bone regeneration and mineralization was higher in the HAp and bioactive-HAp gradient groups at 6 weeks. The results indicated that the HAp incorporated in the gradient scaffolds led to faster mineralization of bone at the defect site. A network of extracellular matrix was observed in the sham group with negligible mineralization. Isolated bone regeneration was seen in the bioactive gradient, where longer time points may have demonstrated bone formation by endochondral ossification. At the end points studied, the bone in the bioactive gradient groups was less organized than in the groups with HAp, and the microarchitecture of cancellous bone was not observed.
In the bioactive-HAp gradient group, the superior bone regeneration may have been due to the synergistic combination of the signaling of infiltrating host mesenchymal stem cells by BMP-2, along with HAp as a raw material that may direct the nucleation and mineralization of bone. A similar rate of bone regeneration was also observed in HAp gradient group, indicating that the presence of osteoconductive HAp may be sufficient to initiate and mineralize bone at the defect site. However, the Safranin O staining clearly indicated that GAG content was lacking in the HAp group relative to the bioactive-HAp group at 12 weeks, indicating an important role for the growth factors in cartilage regeneration. Nevertheless, at 6 weeks, the gross morphological analysis and the MRI data showed that the bioactive-HAp gradient implant yielded superior surface filling and thickness of the regenerated cartilage than the other groups. This result was exemplified by the higher GAG content and integration with the surrounding cartilage.
The T2 relaxation time from MRI has been widely explored to aid in evaluating the quality of cartilage, particularly its dependence on the hydration of collagen and concentration of GAGs.27–29 The T2 values are sensitive to the macromolecular composition and architecture of the extracellular matrix. The overall relaxation time calculated for newly regenerated cartilage did not, however, reveal any significant differences between the groups at 12 weeks. The results suggested that a stable bone ingrowth at the bottom (bone side) of the implant may provide appropriate mechanical support for the developing overlying cartilage. This underlying bone ingrowth, together with a proper chondrogenic signaling, seemed to be sufficient to stabilize and direct the maturation of the overlying cartilage. Previous reports have also shown that healthy subchondral bone was important to articular cartilage repair.30,31
By 12 weeks, the T2 images showed that the defect area was completely filled with regenerated tissue in all of the groups. The bioactive group had the defect filled with regenerated tissue, with inadequate integration with the adjacent native cartilage and with minimal bone regeneration. The delayed bone formation may have resulted in a lack of appropriate mechanical support for the developing overlying cartilage, which might be responsible for the lack of structural integrity of the superficial layer of the regenerated cartilage. Alternatively, acidic byproducts from PLGA degradation may have somewhat impeded regeneration. Complete bone regeneration with a microarchitecture of the cancellous bone similar to the native tissue was observed in the bioactive-HAp gradient group. This group had the highest histological score for GAG content, cartilage thickness, bone filling, and edge integration. In both of the groups with HAp, the cartilage layer had the same thickness as that of surrounding cartilage and had integrated with the surrounding tissue. An even distribution of GAG content was observed in all bioactive-HAp samples and only in 50% of HAp gradient samples. These data demonstrated that bone regeneration and maturation can be improved by inclusion of HAp in the gradient scaffolds, and cartilage regeneration may be enhanced by release of TGF-β1. Most of the joints that received the HAp and bioactive-HAp implants had higher scores for overall cartilage and bone regeneration when compared to the other joints in the same animal that received a different implant. This clearly indicates that the HAp and bioactive-HAp implants that were investigated in this study were able to promote better osteochondral regeneration than the other groups presented in the study, although an expanded number of rabbits would be required to draw more global conclusions with confidence.
Bone and cartilage are highly integrated tissues and the proper regeneration of bone may significantly improve the regeneration of cartilage. Colocalization of osteoinductive BMP-2 and osteoconductive HAp appears to have resulted in faster stabilization of bone. Other studies support the inference that the rapid development of bone at the base of defects with faster degrading scaffolds provides a normal or quasinormal mechanical environment for the noncalcified surface layer, which results in better integration with the surrounding cartilage and integrity of the cartilaginous component of the repair tissue. 32 In the current study, with colocalization of both osteogenic signals, the bone regeneration was adequate and confined to the osteal region with a proper interface at the cartilage–bone junction. The gradient pattern of growth factor and HAp distribution might have contributed to the formation of a proper interface. Moreover, simultaneous growth of cartilage and bone in a single construct, with a mineralized interface having a stiffness transition between the two tissues, might protect the articular cartilage from damage due to physical loading.
Conclusions
The key to cartilage regeneration is osteochondral regeneration, providing an anchoring site for the implant, along with a source of mesenchymal stem cells, with simultaneous regeneration and integration of bone and cartilage. Osteochondral scaffolds thus should bear tissue-specific signals and possibly even raw materials to promote this type of regeneration. The spatial patterning of these signals and raw materials is a critical design element in the coengineering of the two tissues and their interface. In the current study, the use of microsphere-based scaffolds provided a 3D spatial distribution of bioactive signals, and the continuous opposing gradients enabled integration of the regenerated tissue. Our results indicated that the bioactive-HAp group had the highest scoring for morphological analysis and a histology score that was very close to native cartilage for GAG content and cartilage thickness. This group had a higher bone filling and better edge integration with surrounding bone. The results of the current in vivo study thus showed the proof of concept that scaffolds with gradients in both bioactive signals and material composition (bioactive-HAp gradient) may lead to faster osteochondral regeneration, based on the highest degree of bone regeneration and mineralization, which resulted in restoration of the overlying cartilage with quality integration between the cartilage and bone. This is the first in vivo study conducted to evaluate the response of microsphere-based gradient implants for osteochondral regeneration in knee joints. However, future rabbit studies will require a long-term systematic evaluation of HAp and bioactive-HAp gradient implants with more samples per group. More importantly, future studies in larger animals will provide more clinically relevant information, and will benefit from a molecular and cellular analysis of the inflammatory response and functional analysis beyond gross morphological observation and histology.
The continuous gradient technology presented here is, in general, not limited to osteochondral applications, as it may have a significant potential impact in any application where a gradient or integrated interface is desired, such as nerve regeneration and the ligament/bone interface. Thus, scaffolds with continuous gradients in both tissue-specific signals and material composition may be a beneficial approach in the future of musculoskeletal tissue engineering.
Footnotes
Acknowledgments
The authors acknowledge funding from Institute for Advancing Medical Innovation (IAMI) at the University of Kansas. We also would like to recognize Dr. Phil Lee and Dr. Jieun Kim at the Hoglund Brain Imaging Center at the KU Medical Center for their assistance with MRI.
Disclosure Statement
No competing financial interests exist.
References
Supplementary Material
Please find the following supplemental material available below.
For Open Access articles published under a Creative Commons License, all supplemental material carries the same license as the article it is associated with.
For non-Open Access articles published, all supplemental material carries a non-exclusive license, and permission requests for re-use of supplemental material or any part of supplemental material shall be sent directly to the copyright owner as specified in the copyright notice associated with the article.