
Abstract
Various forms of mechanical stimulation have been shown to enhance chondrogenesis of mesenchymal stem cells (MSCs). However, the response of MSCs undergoing chondrogenesis to such signals has been shown to depend on the temporal application of loading. The objective of this study was to determine the effect of dynamic compression on cartilage-matrix-specific gene expression and to relate this response to the local biochemical environment and cell phenotype at the time of loading. At 0, 7, 14, and 21 days extracellular matrix (ECM) deposition within MSC-seeded agarose hydrogels due to transforming growth factor-β3 stimulation was determined biochemically and histologically, and then reverse transcription-polymerase chain reaction was used to examine the effects of dynamic compression on cartilage-matrix-specific gene expression. The results of these experiments show that the local environment in the core of the constructs is more favorable for chondrogenesis in comparison to the annulus, as evident from both ECM synthesis and gene expression. Additionally, we found that the response of the cells to mechanical stimulus varied with both the spatial region within the constructs and the temporal application of loading. Dynamic compression applied at day 21 was found to enhance levels of cartilage matrix gene expression following a peak in expression levels at day 14 in free swelling constructs, suggesting that mechanical signals play a key role in the maintenance of a chondrogenic phenotype. The application of mechanical stimulus to enhance cartilage ECM synthesis may be an important tool in regenerative medicine-based cartilage repair. The results of this study suggest that a chondrogenic phenotype and/or a well-developed pericellular matrix must first be established before dynamic compression can have a positive effect on cartilage-matrix-specific gene expression.
Introduction
Investigating the response of MSCs to extrinsically generated force, even in well-characterized bioreactor systems, is complicated by the fact that chondrogenic differentiation and extracellular matrix (ECM) accumulation vary both temporally and spatially within cell-seeded constructs. Previous studies in our laboratory have shown that sulfated glycosaminoglycan (sGAG) content is higher in the core of agarose constructs than in the annular region.16,21–23 These differences have been hypothesized to be a result of higher levels of matrix synthesis in response to the lower oxygen tension in the core of the constructs.16,23–25 These differences in ECM accumulation will alter the spatial patterns of mechanical signals during loading and may also be indicative of spatial differences in chondrogenic differentiation. Both of these factors would be expected to have an affect on the response of MSCs to mechanical stimulus. These factors may explain the observation that dynamic compression can negatively affect cartilage-matrix synthesis when applied at the onset of chondrogenic differentiation, whereas a more positive response was observed when the application of mechanical stimulus was delayed.5,16,26 For example, Mouw et al. 26 observed that dynamic compression did not produce increases in gene expression or matrix synthesis unless the application of loading was delayed until day 16. Taken together, the results of these studies suggest that mechanical signals may play a role not only in the initiation of chondrogenesis, but perhaps also in the maintenance of this phenotype.
To properly address such questions involves investigating the relationship between the response of MSCs to mechanical signals and the temporal and spatial changes in MSC phenotype and biochemical composition of the local ECM. Therefore, the goal of this study was to determine the effect of dynamic compression on cartilage-matrix-specific gene expression and to relate this response to the local biochemical environment and cell phenotype at the time of loading. The specific objectives of this study were to (1) investigate temporal changes in gene expression and matrix accumulation as MSCs undergo transforming growth factor (TGF)-β3-induced differentiation in agarose hydrogels and (2) quantify changes in gene expression due to the application of dynamic compression at discrete times during this process.
Materials and Methods
Cell isolation and preparation of agarose gel constructs
MSCs were isolated from bone marrow harvested from porcine femora (3 donors, 4 months old, ∼50 kg). A protocol adapted from a method developed for human tissue was used to isolate MSCs from the bone marrow. 27 Once isolated, the MSCs were plated on T-175 flasks (Sarstedt) at a density of 5×10³ cells/cm2 in high-glucose Dulbecco's modified Eagle's medium GlutaMAX™ (hgDMEM) supplemented with 10% fetal bovine serum and 100 U/mL penicillin/streptomycin (all GIBCO, Biosciences). MSCs were subcultured at a ratio of 1:3 following colony formation and expanded to passage 3 in a humidified atmosphere at 37°C and 5% CO2. After isolation and expansion to P3, MSCs from the three donors were pooled, then suspended in hgDMEM and mixed with 4% agarose (Type VII; Sigma-Aldrich) in phosphate-buffered saline at a 1:1 ratio. This produced a 2% agarose gel containing 15×106 cells/mL. The gel was cast in a stainless steel mold to produce a 3-mm-thick agarose sheet, from which cylindrical constructs (Ø5×3 mm, 8.75×10⁵ cells) were created using a biopsy punch. Agarose gel constructs were maintained in chemically defined basal media (CDM), which consisted of hgDMEM supplemented with 100 U/mL penicillin/streptomycin, 100 μg/mL sodium pyruvate, 40 μg/mL L-proline, 1.5 mg/mL bovine serum albumin, 4.7 μg/mL linoleic acid, 1×insulin-transferrin-selenium, 50 μg/mL L-ascorbic acid-2-phosphate, 100 nM dexamethasone (all Sigma-Aldrich), and 10 ng/mL of TGF-β3 (ProSpec-Tany TechnoGene Ltd). The medium was changed every 3–4 days. Agarose gel constructs were cultured for 60 h in TGF-β3-supplemented CDM before the start of the experiment (defined as day 0).
Dynamic loading protocol
To investigate the effects of loading at different time points, samples were subjected to dynamic loading at day 0, 7, 14, or 21. Loaded samples were subjected to 10% strain at a frequency of 1 Hz for 1 h only in a dynamic compression bioreactor and harvested for reverse transcription-polymerase chain reaction (RT-PCR) analysis directly after loading.16,22 No further loading was applied to these constructs. A preload of 0.01 N was applied to prevent lift-off during the loading session due to viscoelastic creep. The control group was incubated in a free swelling (FS) environment.
Quantitative biochemical analysis
FS samples were assessed at days 0, 7, 14, and 21. Sample cores (Ø3 mm) and annuli were separated using a biopsy punch, weighed, and frozen (−85°C) for analysis at a later date. Samples were digested with 125 μg/mL papain in 0.1 M sodium acetate, 5 mM L-cystine HC1, and 0.05 M EDTA (all Sigma-Aldrich), pH 6.0, at 60°C under constant rotation for 18 h. Cell number was evaluated using the Hoechst 33258 DNA assay, which fluorescently labels double-stranded DNA (Sigma-Aldrich), according to a previously published protocol and using calf thymus DNA (Sigma-Aldrich) as a standard. 28 sGAG content was measured using the dimethylmethylene blue dye-binding assay (Blyscan; Biocolor Ltd.) using shark-derived chondroitin sulfate (Sigma-Aldrich) as a standard. Collagen content was determined through measuring the hydroxyproline content. Samples were hydrolyzed at 110°C for 18 h in 38% HCL and assayed using a chloromine-T assay 29 and assuming a hydroxyproline:collagen ratio of 1:7.69. 30 All assays were carried out with a minimum of three samples analyzed in triplicate for each group at every time point, and all the biochemical data were normalized to the wet weight of the constructs.
RNA isolation and real-time PCR
RT-PCR was used to determine the relative expression of aggrecan, collagen type I, and collagen type II, with GAPDH as the house-keeping reference gene. Loaded groups were harvested directly after the application of loading, with the FS control samples harvested at the same time point. As described previously, samples were separated into core and annular regions using a biopsy punch and frozen (−85°C) for analysis at a later date. RNA was extracted from the agarose constructs by homogenizing samples in 1 mL of QIAZOL reagent (Qiagen), followed by chloroform extraction. After chloroform extraction the RNA was precipitated in isopropanol with 5 μL glycogen (Ambion). The samples were centrifuged and the supernatant removed before re-suspending the RNA pellets in 40 μL RNase-free water. RNA yield and purity were assessed using a nanodrop spectrophotometer (ND-1000; Thermo Scientific), with 260/280 ratios of >1.8 for all samples. RT-PCR was carried out using a one-step Quantitect SYBR Green RT-PCR kit (Qiagen) and an Applied Biosystems 7500 real-time PCR machine (Applied Biosystems). Primers for type I collagen, type II collagen, aggrecan, and GAPDH are shown in Table 1.31,32 RT-PCR data were analyzed using the 2−ΔΔCT method as described previously, with the FS core samples at day 0 used as the calibrator. 33
Histology
As with the biochemical analysis, samples were assessed at days 0, 7, 14, and 21. At each time point, two samples per group were fixed in 4% paraformaldehyde, dehydrated, and embedded in paraffin using an automatic tissue processor (ASP300; Leica). All samples were sectioned perpendicular to the disc face at a thickness of 5 μm throughout the depth of the sample using a rotary microtome (Leica microtome; Leica). Samples were stained histologically with 1% alcian blue 8GX solution (Sigma-Aldrich) for sGAG, and picro-sirius red for collagen. Types I and II collagen were identified through immunohistochemistry. 21 Negative and positive controls of porcine ligament and cartilage were included.
Statistical analysis
Results are expressed as mean±standard deviation. Two-way analysis of variance (ANOVA), with time and location as the independent factors, followed by pairwise multiple comparison procedures (Holm-Sidak test) were used to evaluate the results from the quantitative biochemical assays. Three-way ANOVA, with time, location, and loading as the independent factors, followed by pairwise multiple comparison procedures (Holm-Sidak test) were used to evaluate the differences in gene expression within the constructs following the application of dynamic compression. Statistical significance was declared at p≤0.05.
Results
DNA content and biochemical composition in FS conditions
In general, DNA content within the agarose constructs was stable over the 21-day culture period; however, a significant reduction in cell number was observed between days 14 and 21 (Fig. 1A, p<0.05). As expected, both sGAG and collagen content were found to increase with time in FS conditions (Fig. 1B–E). Significant increases in sGAG content were observed in both core and annular regions between days 7–14 and 14–21 (Fig. 1B and C, p<0.05). Additionally, sGAG content in the core was significantly higher than the annular region, with 1.8- and 2-fold differences at days 14 and 21, respectively (Fig. 1B, p<0.05). Similar temporal increases in collagen content were observed, with significant increases in collagen content between days 0–7 and 7–14 (Fig. 1D and E). Counter to the trends observed in the spatial distribution of sGAGs, collagen content was found to be greater in the annular region of the agarose constructs (Fig. 1D, p<0.05). However, while this difference was significant at days 7 and 14, no significant difference in collagen content was observed at day 21 (Fig. 1D). Significant interactions between time and location were reported in the two-way ANOVA for sGAG content but not collagen content.
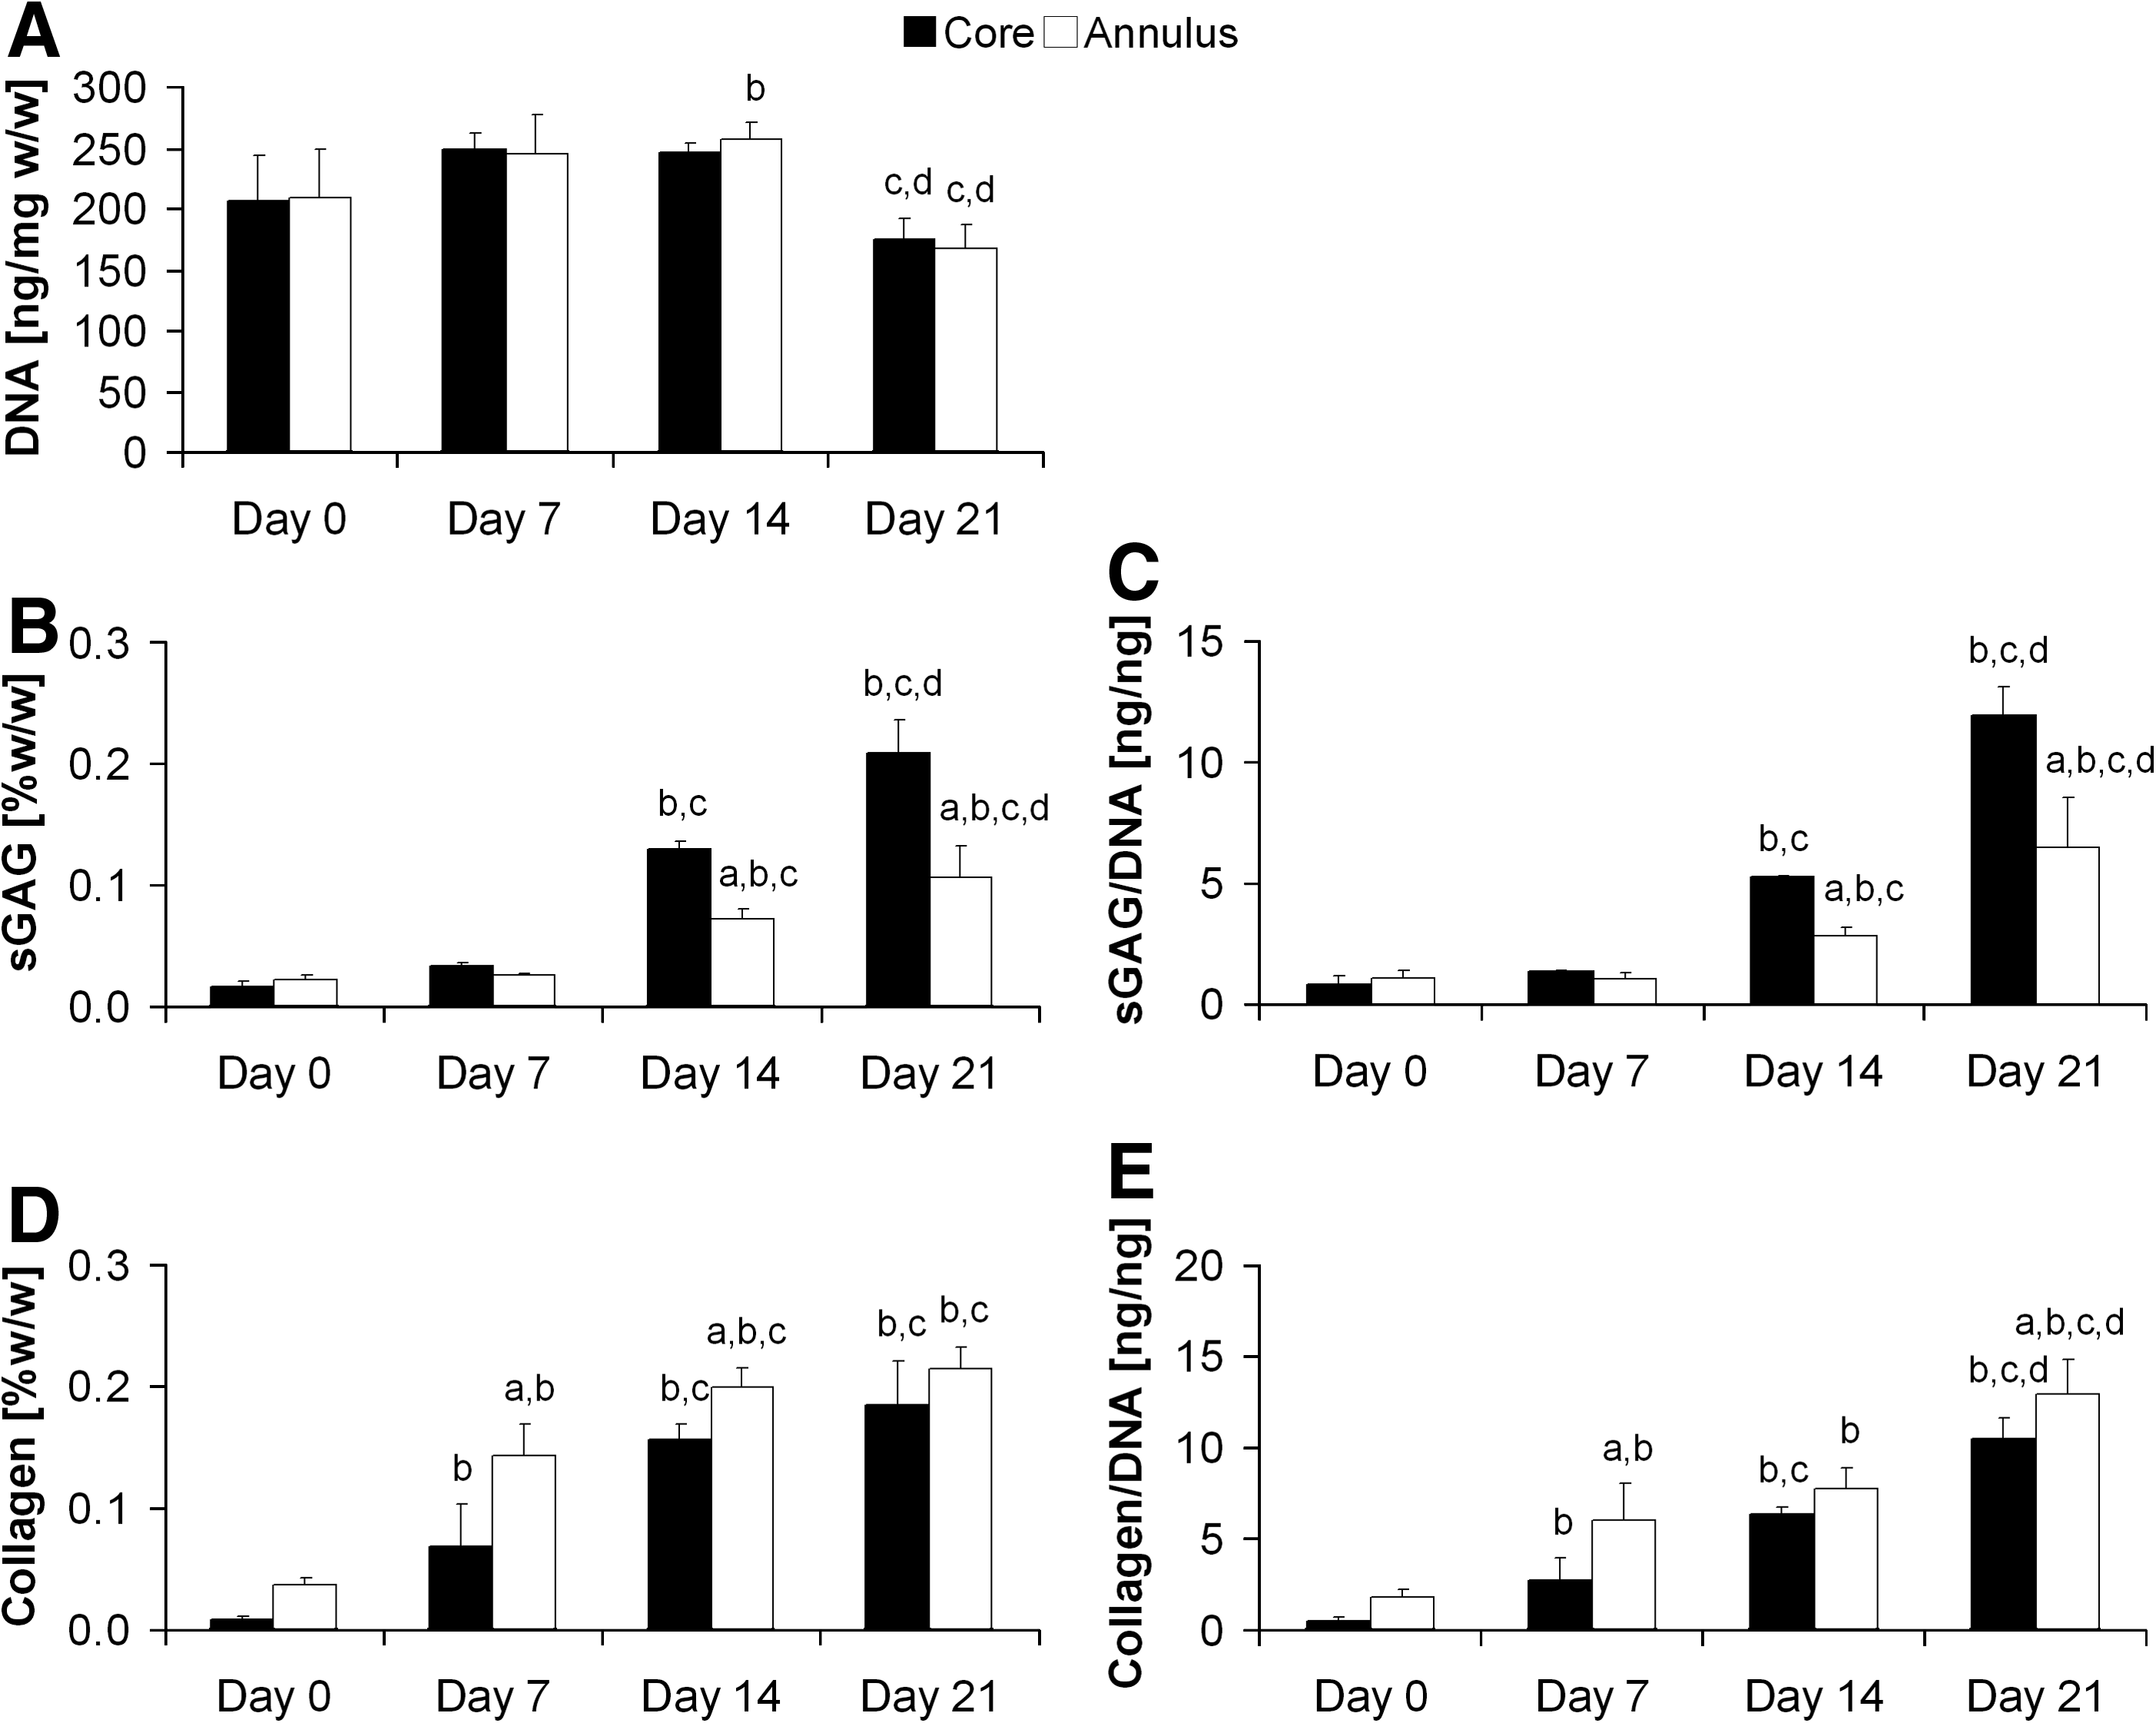
DNA content and biochemical composition of agarose constructs cultured in free swelling conditions over 21 days. Day 0 is defined as 60 h postagarose gel encapsulation.
Histological analysis of ECM deposition and distribution
Histological analysis of ECM deposition was found to agree with the biochemical data (Fig. 2). Staining for both sGAG and collagen can be seen to increase in strength from 0 to 21 days. The spatial differences in ECM deposition can also be observed in the 10×images, where sGAG staining can be seen to be stronger in the core of the samples, whereas collagen stains stronger in the annular region. The development of a pericellular matrix (PCM) was also evident. Strong staining for a sGAG PCM can be seen at day 14 and becomes more evenly distributed by day 21, whereas a collagen PCM is evident as early as day 7. At day 21, collagen I staining appeared more intense in the annular region of the construct, whereas greater staining for type II collagen was observed in the extracellular space within the core of the constructs (Fig. 3).
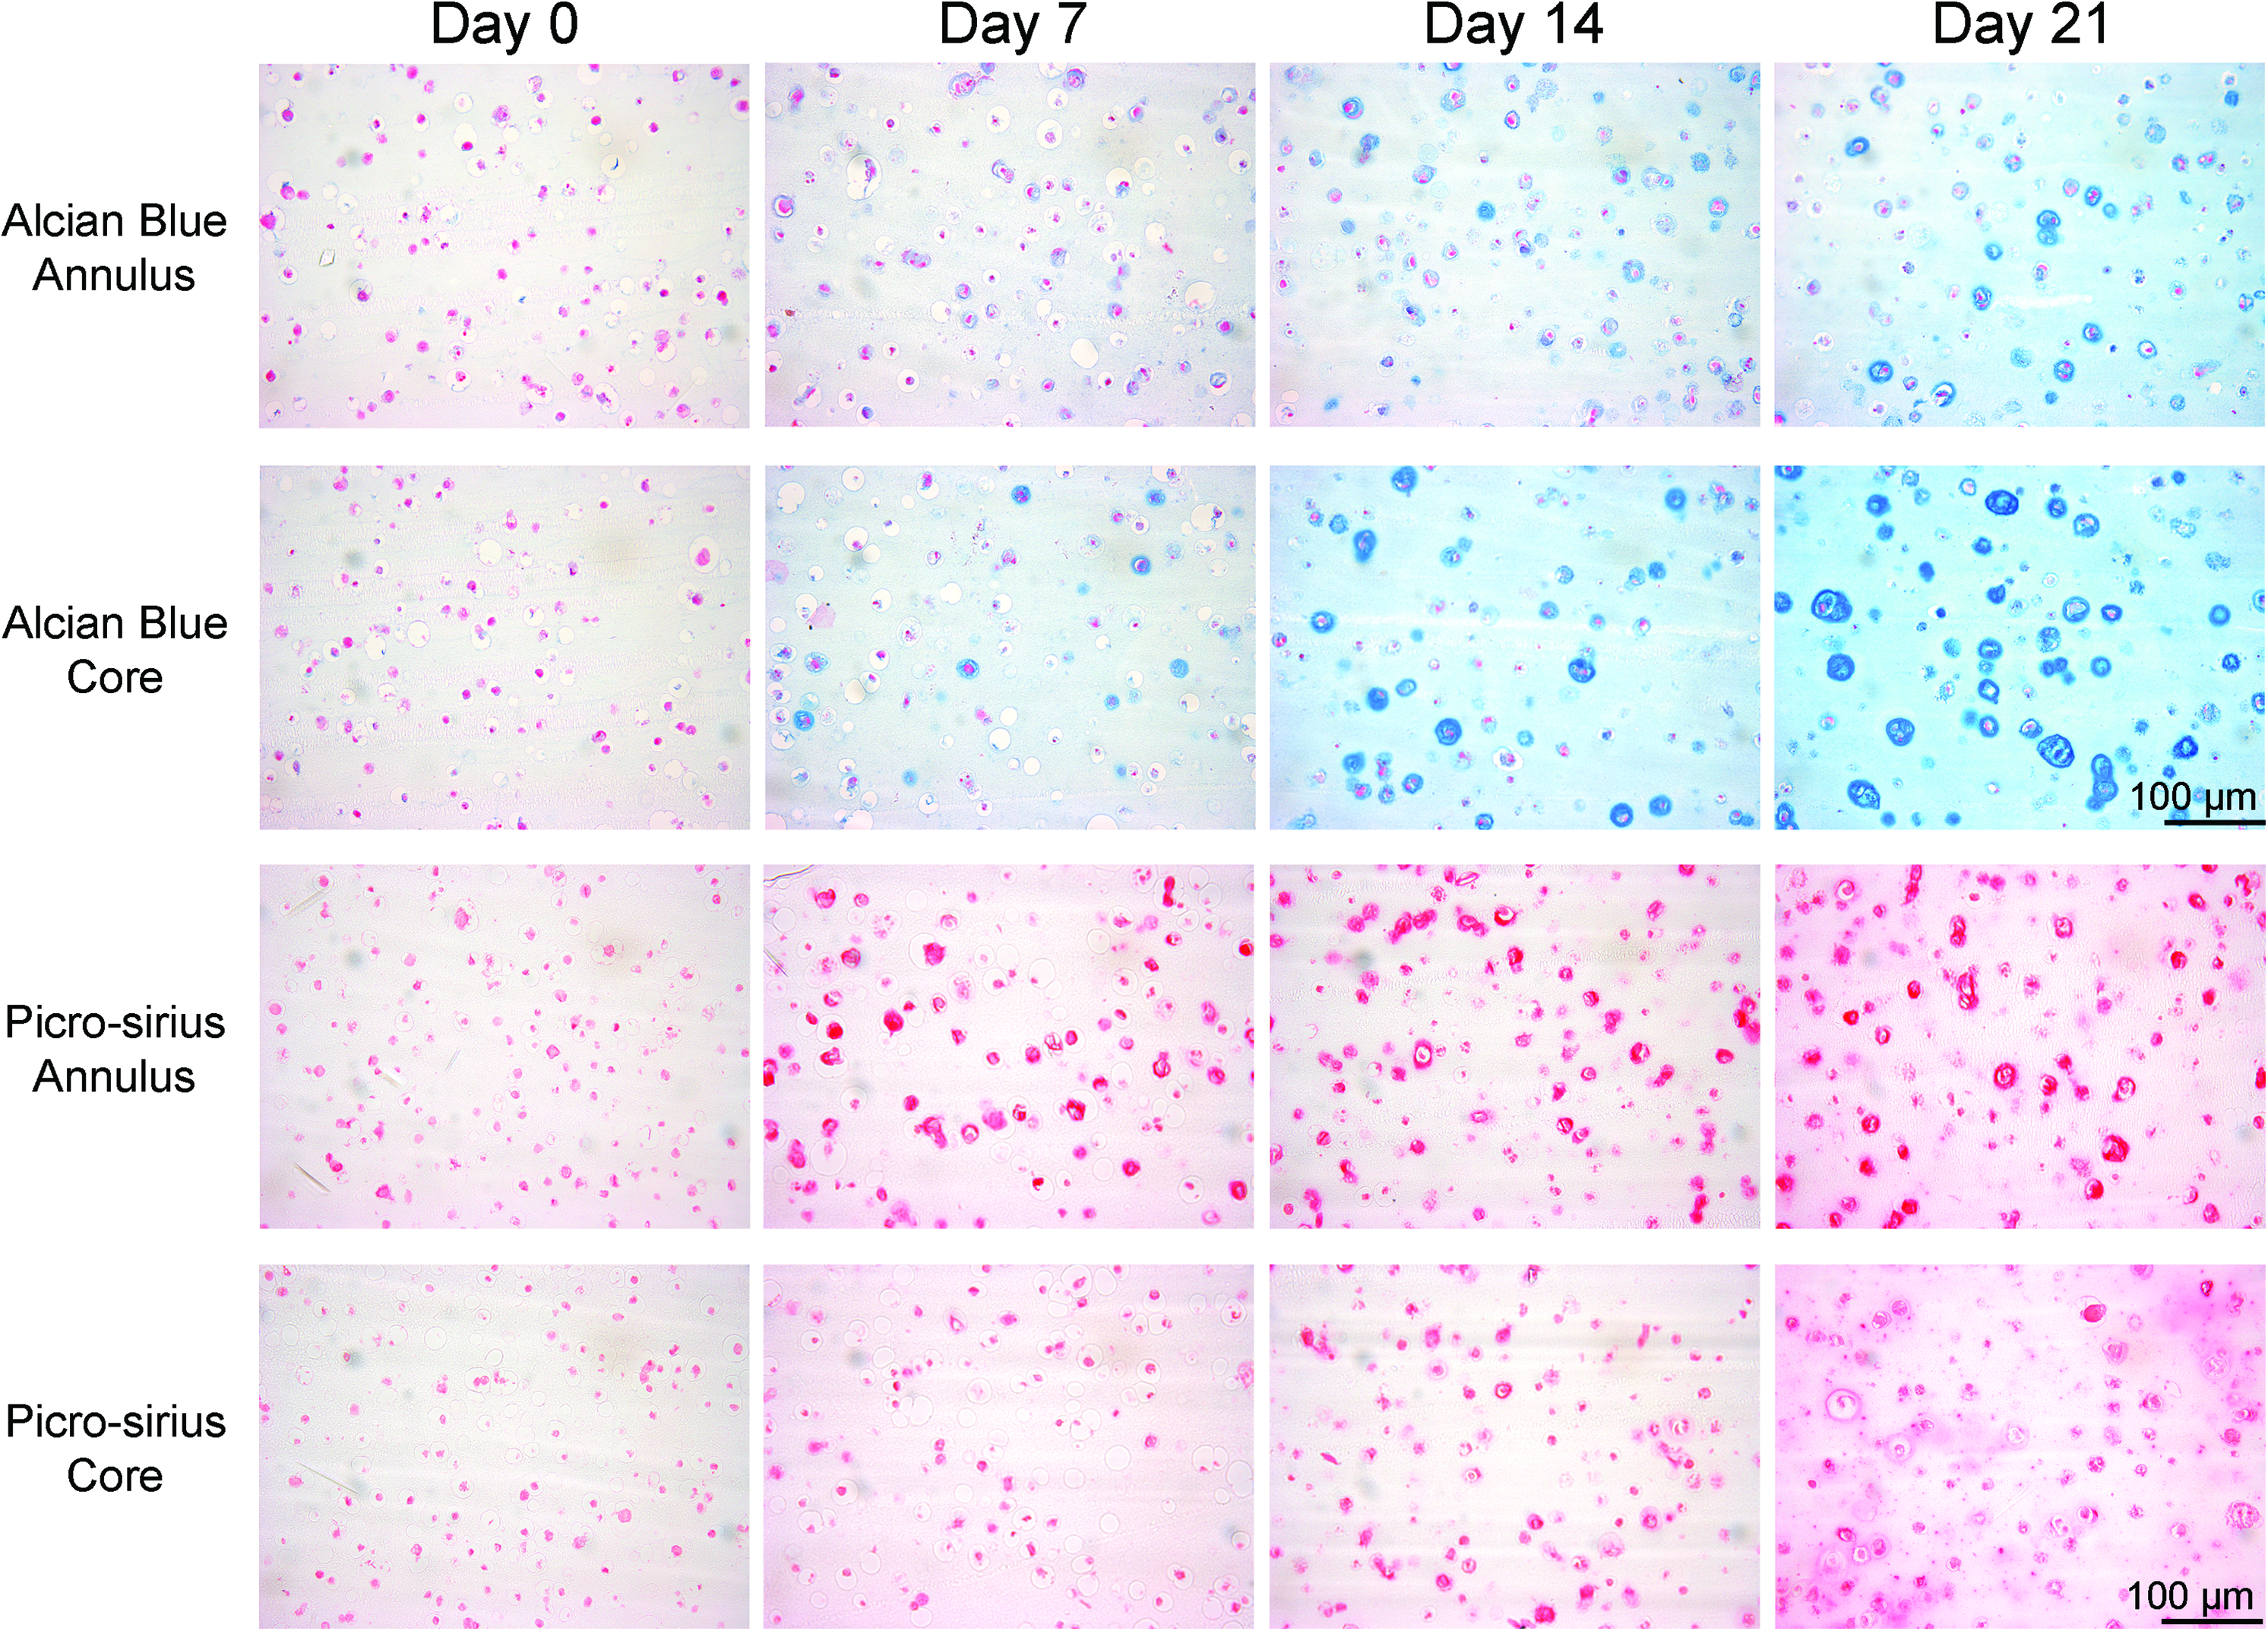
Histological analysis of free swelling agarose constructs showing the deposition and distribution of extracellular matrix at days 0, 7, 14, and 21. Day 0 is defined as 60 h postagarose gel encapsulation. Alcian blue stains for sulfated proteoglycans and picro-sirius red stains for collagen. 10×images were taken of appropriate zones with the aim of emphasizing pericellular matrix development. Color images available online at www.liebertonline.com/tea
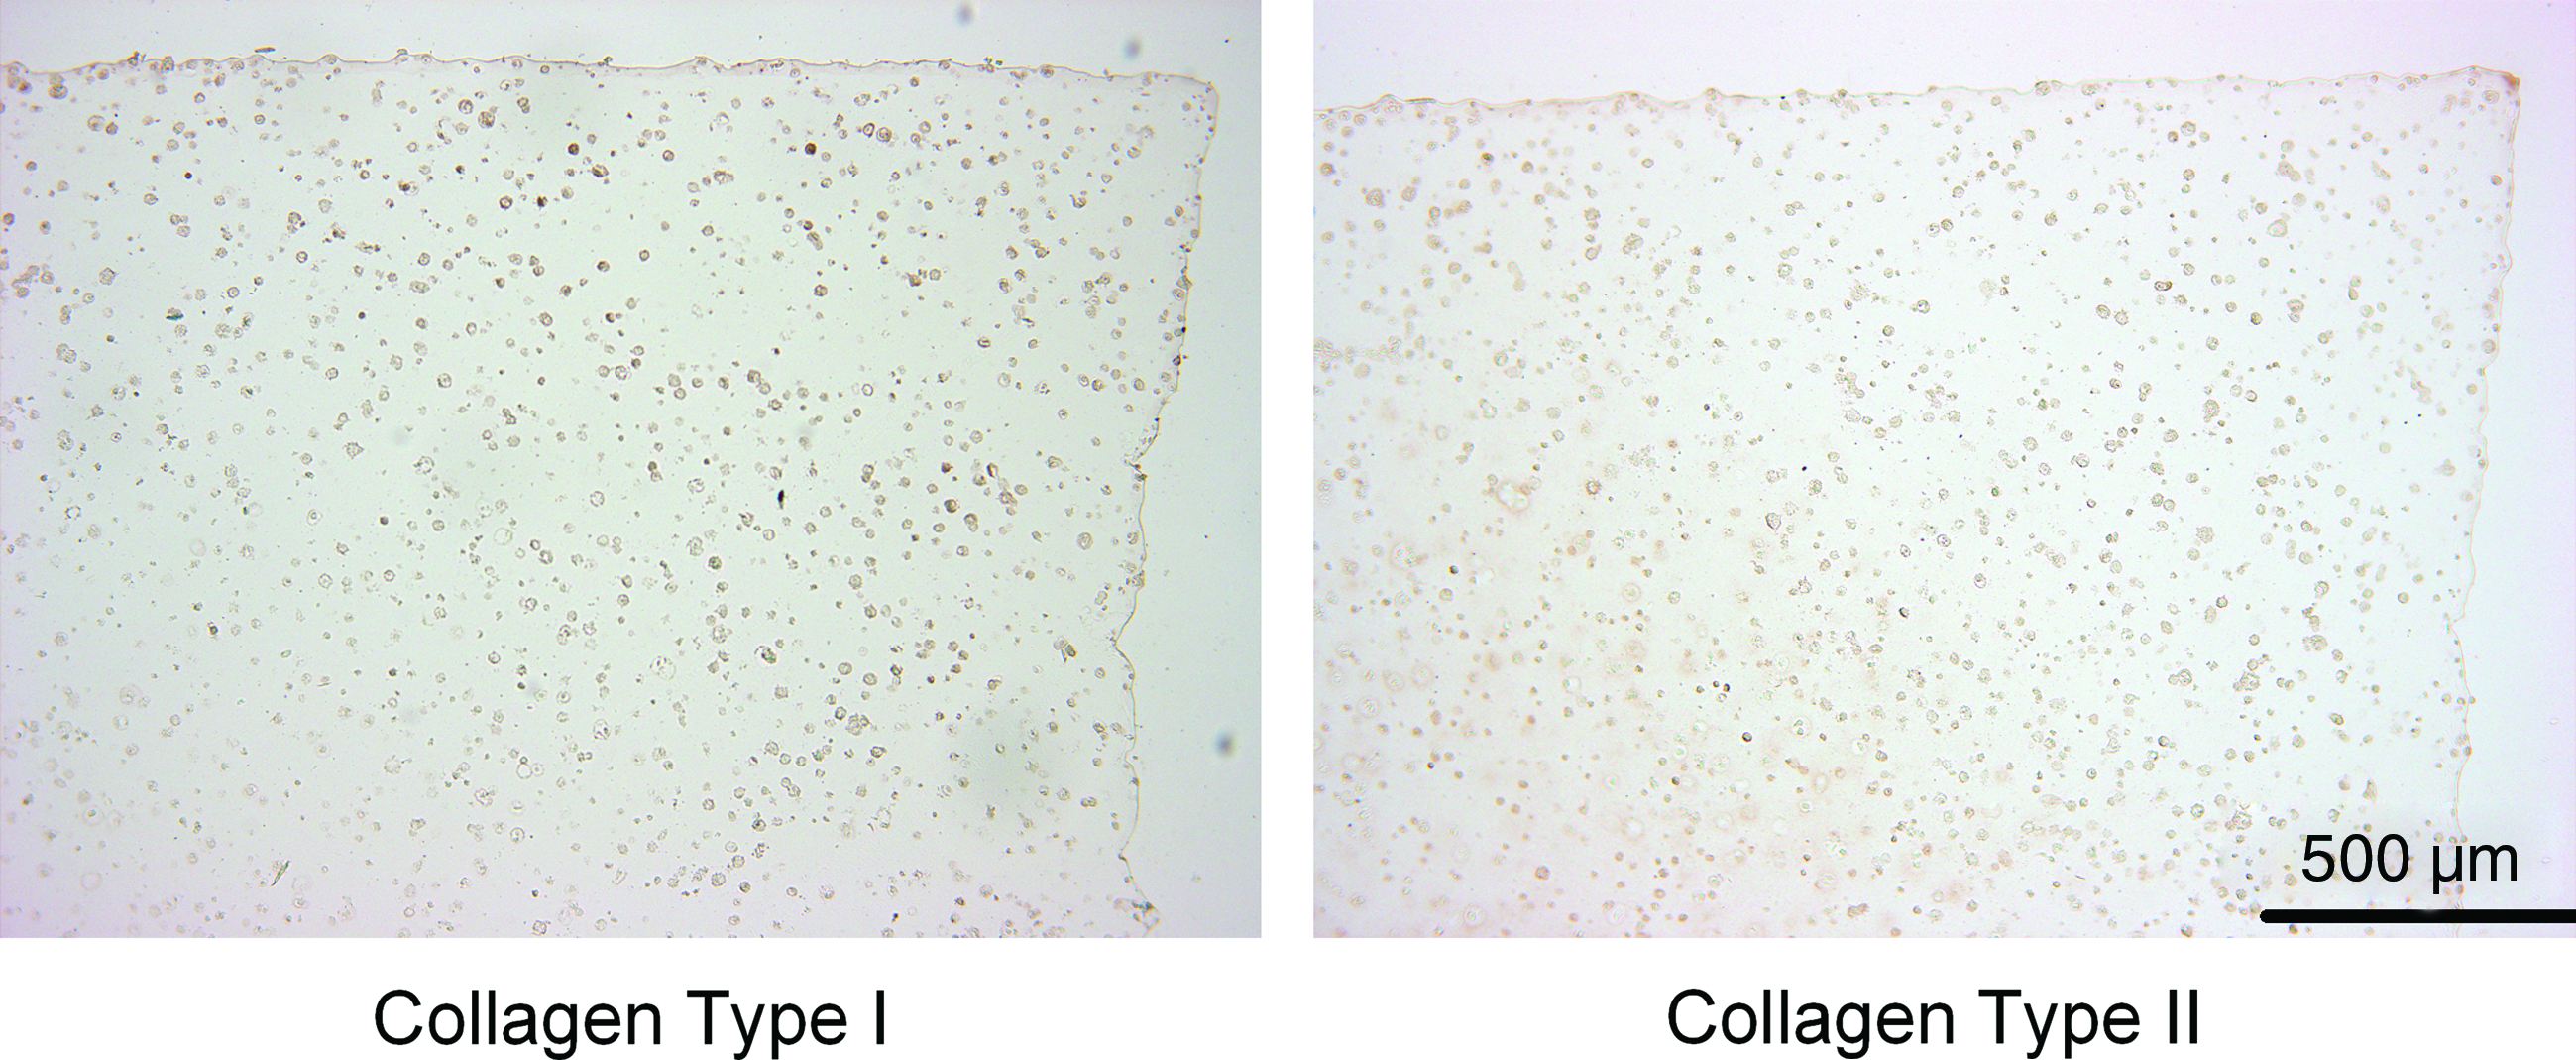
Immunohistological analysis of free swelling agarose constructs showing the deposition and distribution of collagen type I and II at day 21. Color images available online at www.liebertonline.com/tea
Chondrogenic gene expression in FS conditions
Aggrecan and collagen type II expression can be seen to change over time with peak expression for both genes at day 14 (Fig. 4A, B). Aggrecan expression was found to peak at day 14 with a 31-fold increase in expression relative to day 0; this peak was only observed in the core of the samples and was significantly different from expression in the annulus (Fig. 4A). Collagen type II expression followed a similar trend with an earlier 12-fold increase in expression at day 7, followed by a 444-fold increase in expression at day 14, both of these increases in expression occurred exclusively in the core of the samples (Fig. 4B). No significant changes in collagen type I expression were observed from day 0 levels (Fig. 4C). Significant interactions between time and location were reported in the two-way ANOVA for aggrecan and collagen type II expression but not collagen type I expression.
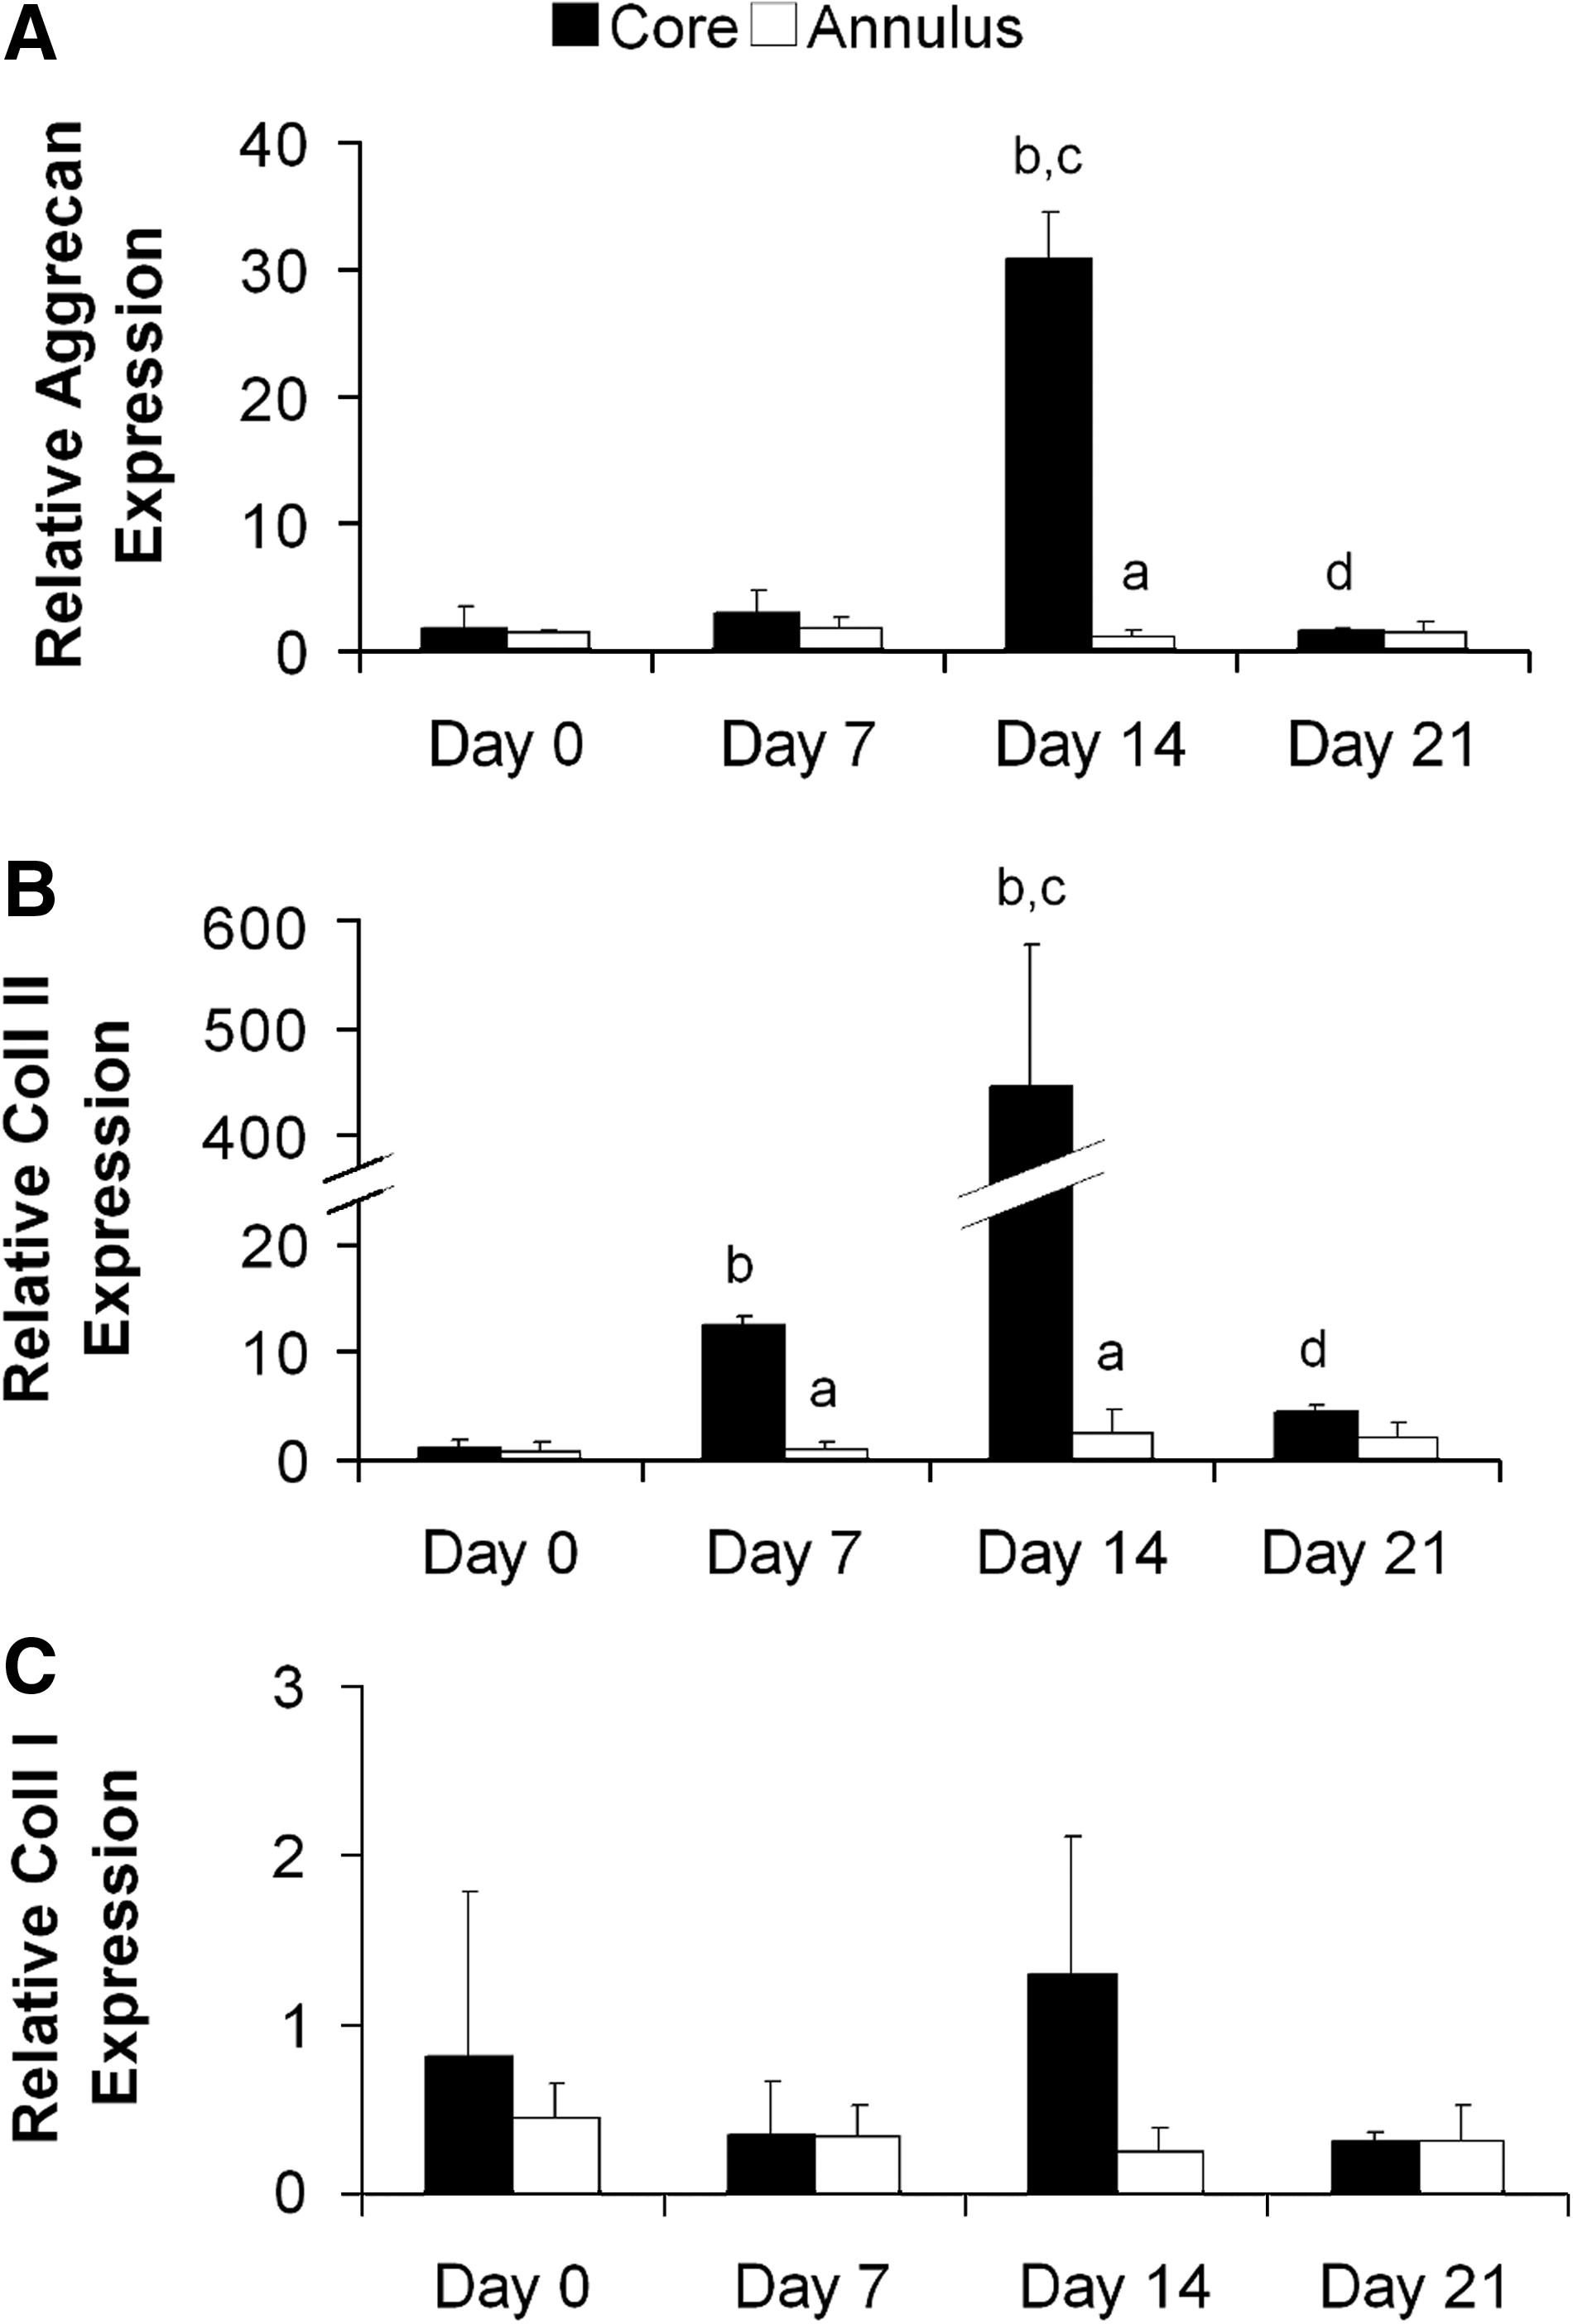
Cartilage-matrix-specific gene expression within agarose constructs cultured in free swelling conditions over 21 days. Expression is normalized relative to core expression at day 0. Day 0 is defined as 60 h after agarose gel encapsulation.
Chondrogenic gene expression in response to dynamic compression
Dynamic compression was found to have a significant effect on aggrecan and collagen type II expression, which was dependant on the time frame of the application of loading and the spatial region within the agarose constructs (Figs. 5 and 6). Aggrecan expression in the core of the constructs was found to significantly increase in comparison to nonloaded controls following the application of loading at days 7 and 21, whereas a decrease in expression was observed at day 14. In the annular region a significant increase in expression was observed following the application of loading at days 14 and 21. Similarly, collagen type II expression in the core of the constructs was found to increase following loading at days 7 and 21, whereas a reduction in expression was observed at day 14. In the annular region, collagen type II expression increased in response to loading at days 14 and 21. Dynamic compression was found to have little effect on the expression of collagen type I (Figs. 5 and 6). Significant interactions between all factors (time, location, and loading) were reported in the three-way ANOVA for aggrecan and collagen type II expression but not collagen type I expression.
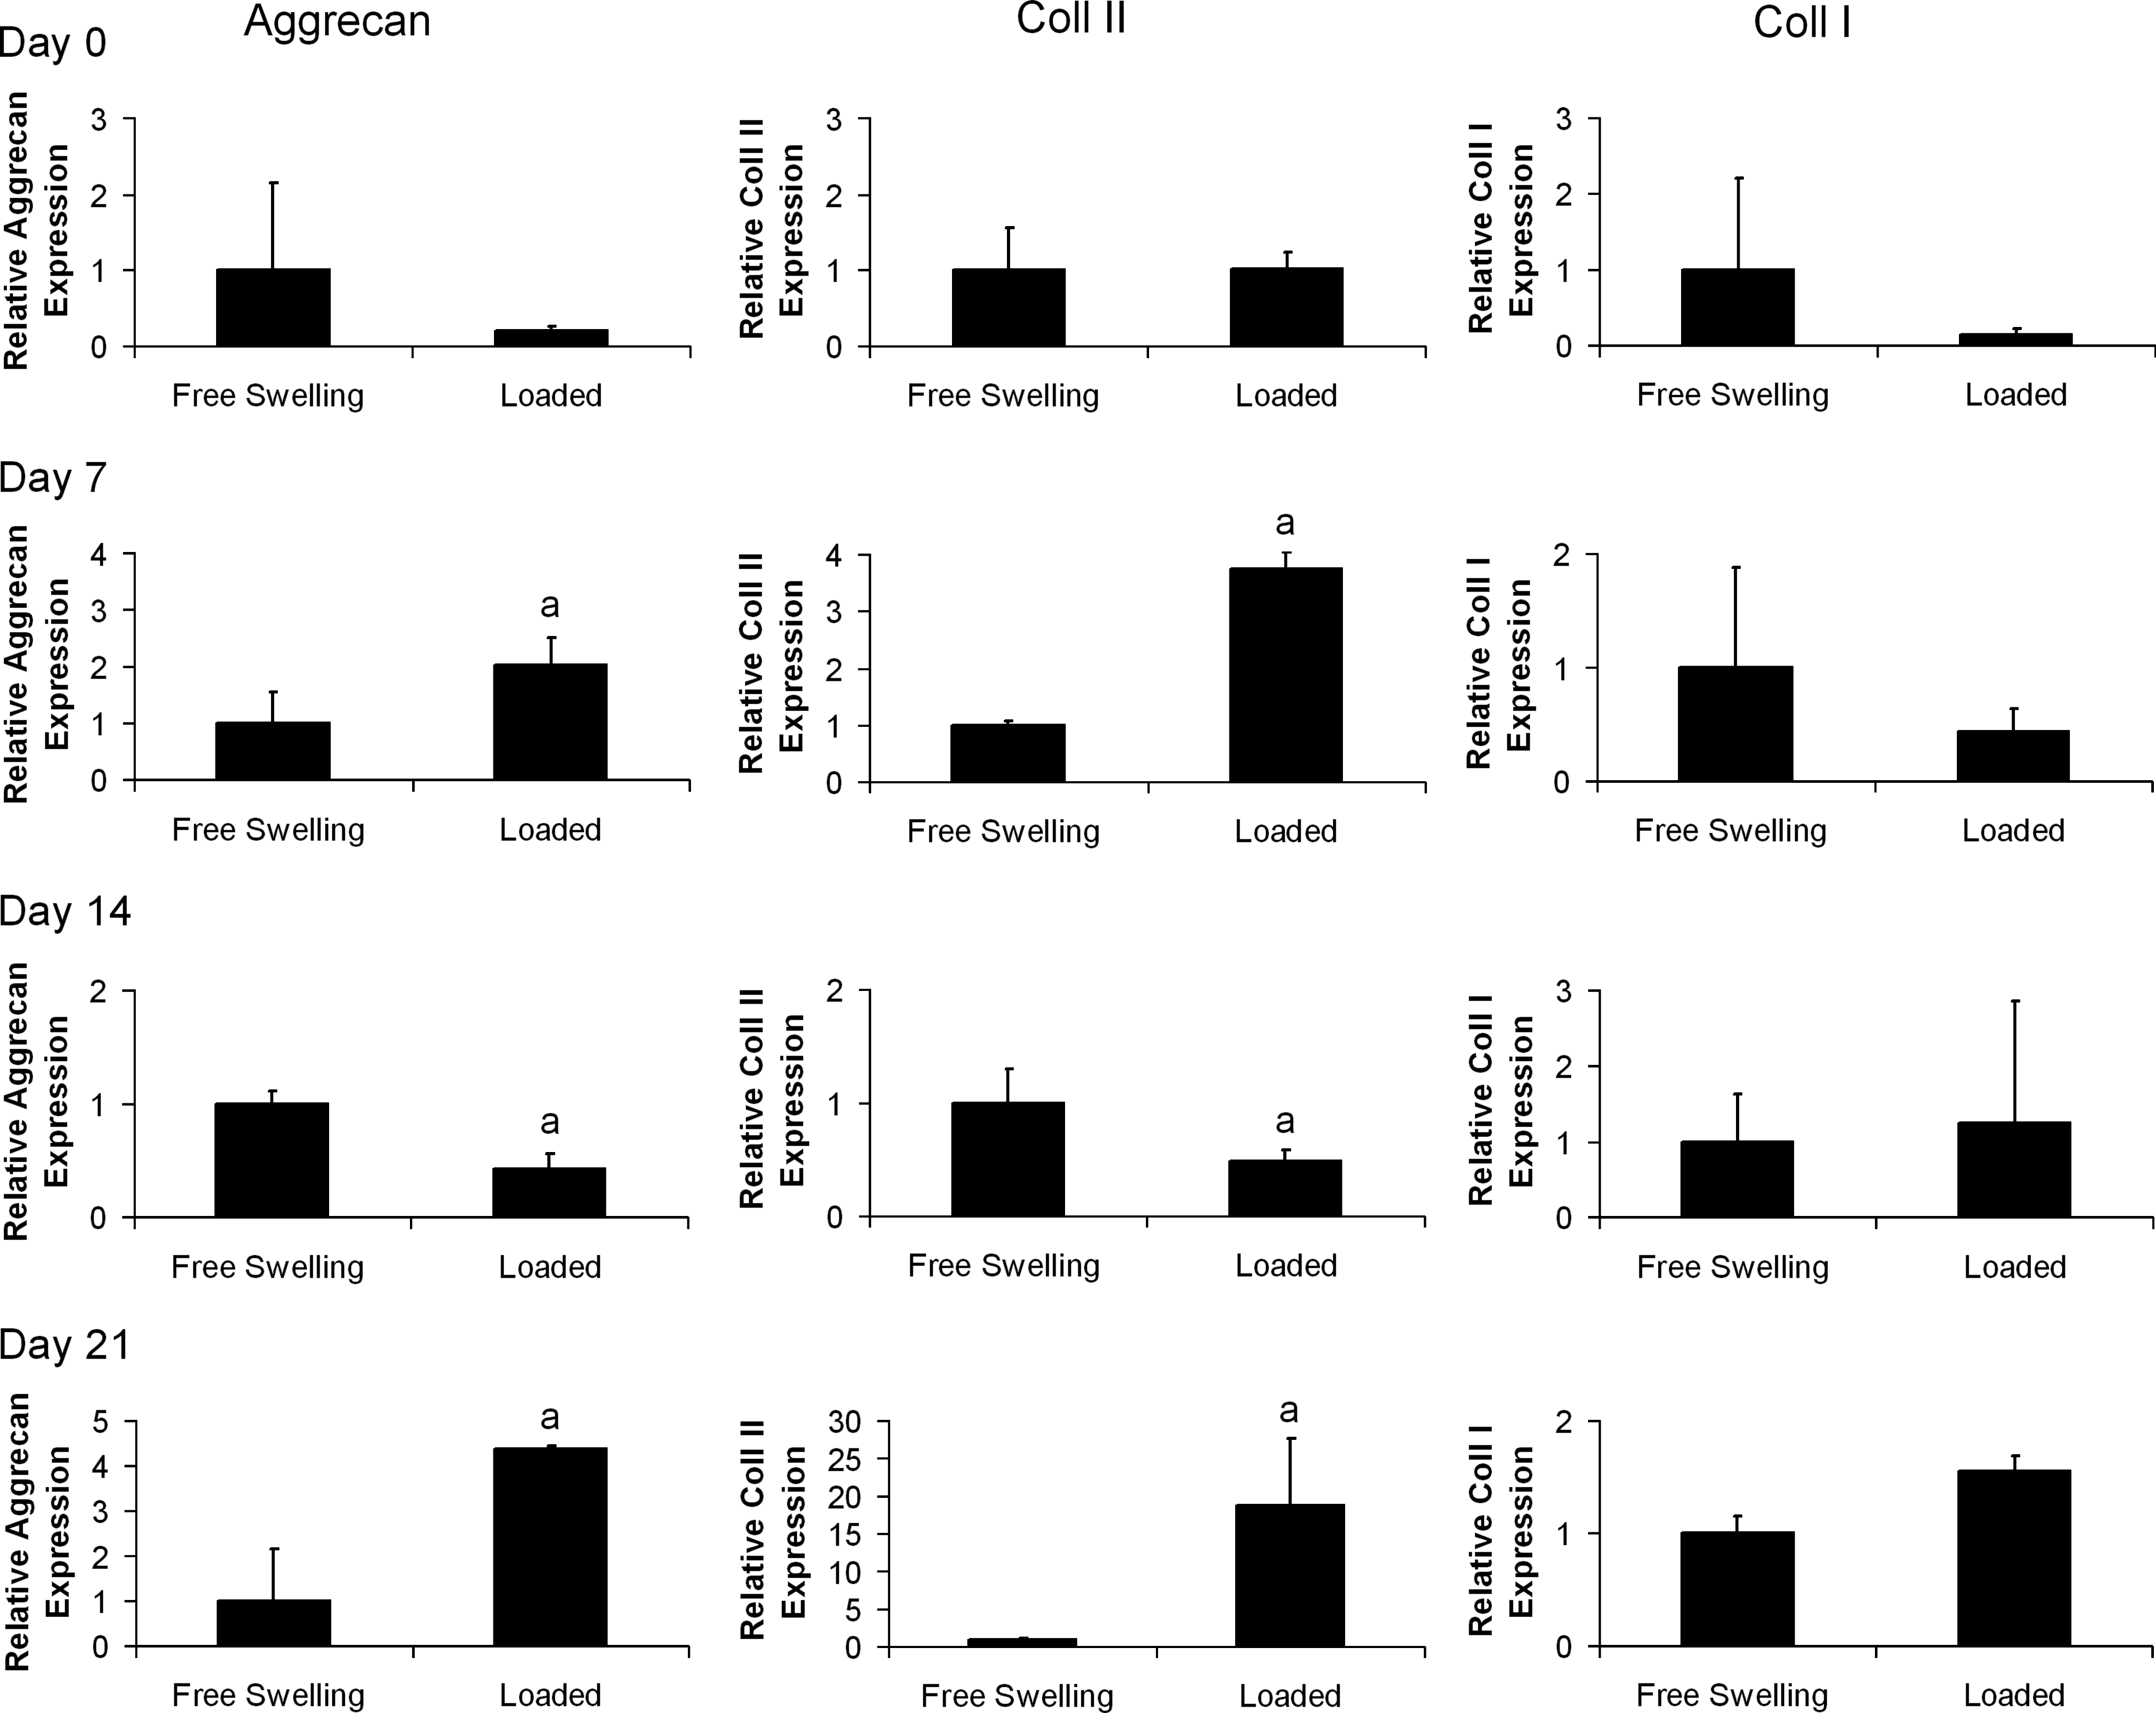
The changes in core cartilage-matrix-specific gene expression in response to dynamic compression at days 0, 7, 14, and 21. Day 0 is defined as 60 h postagarose gel encapsulation. Relative gene expression is normalized to expression in free swelling core samples at each time point. n=3 samples per group per timepoint, ap<0.05 versus free swelling core group.
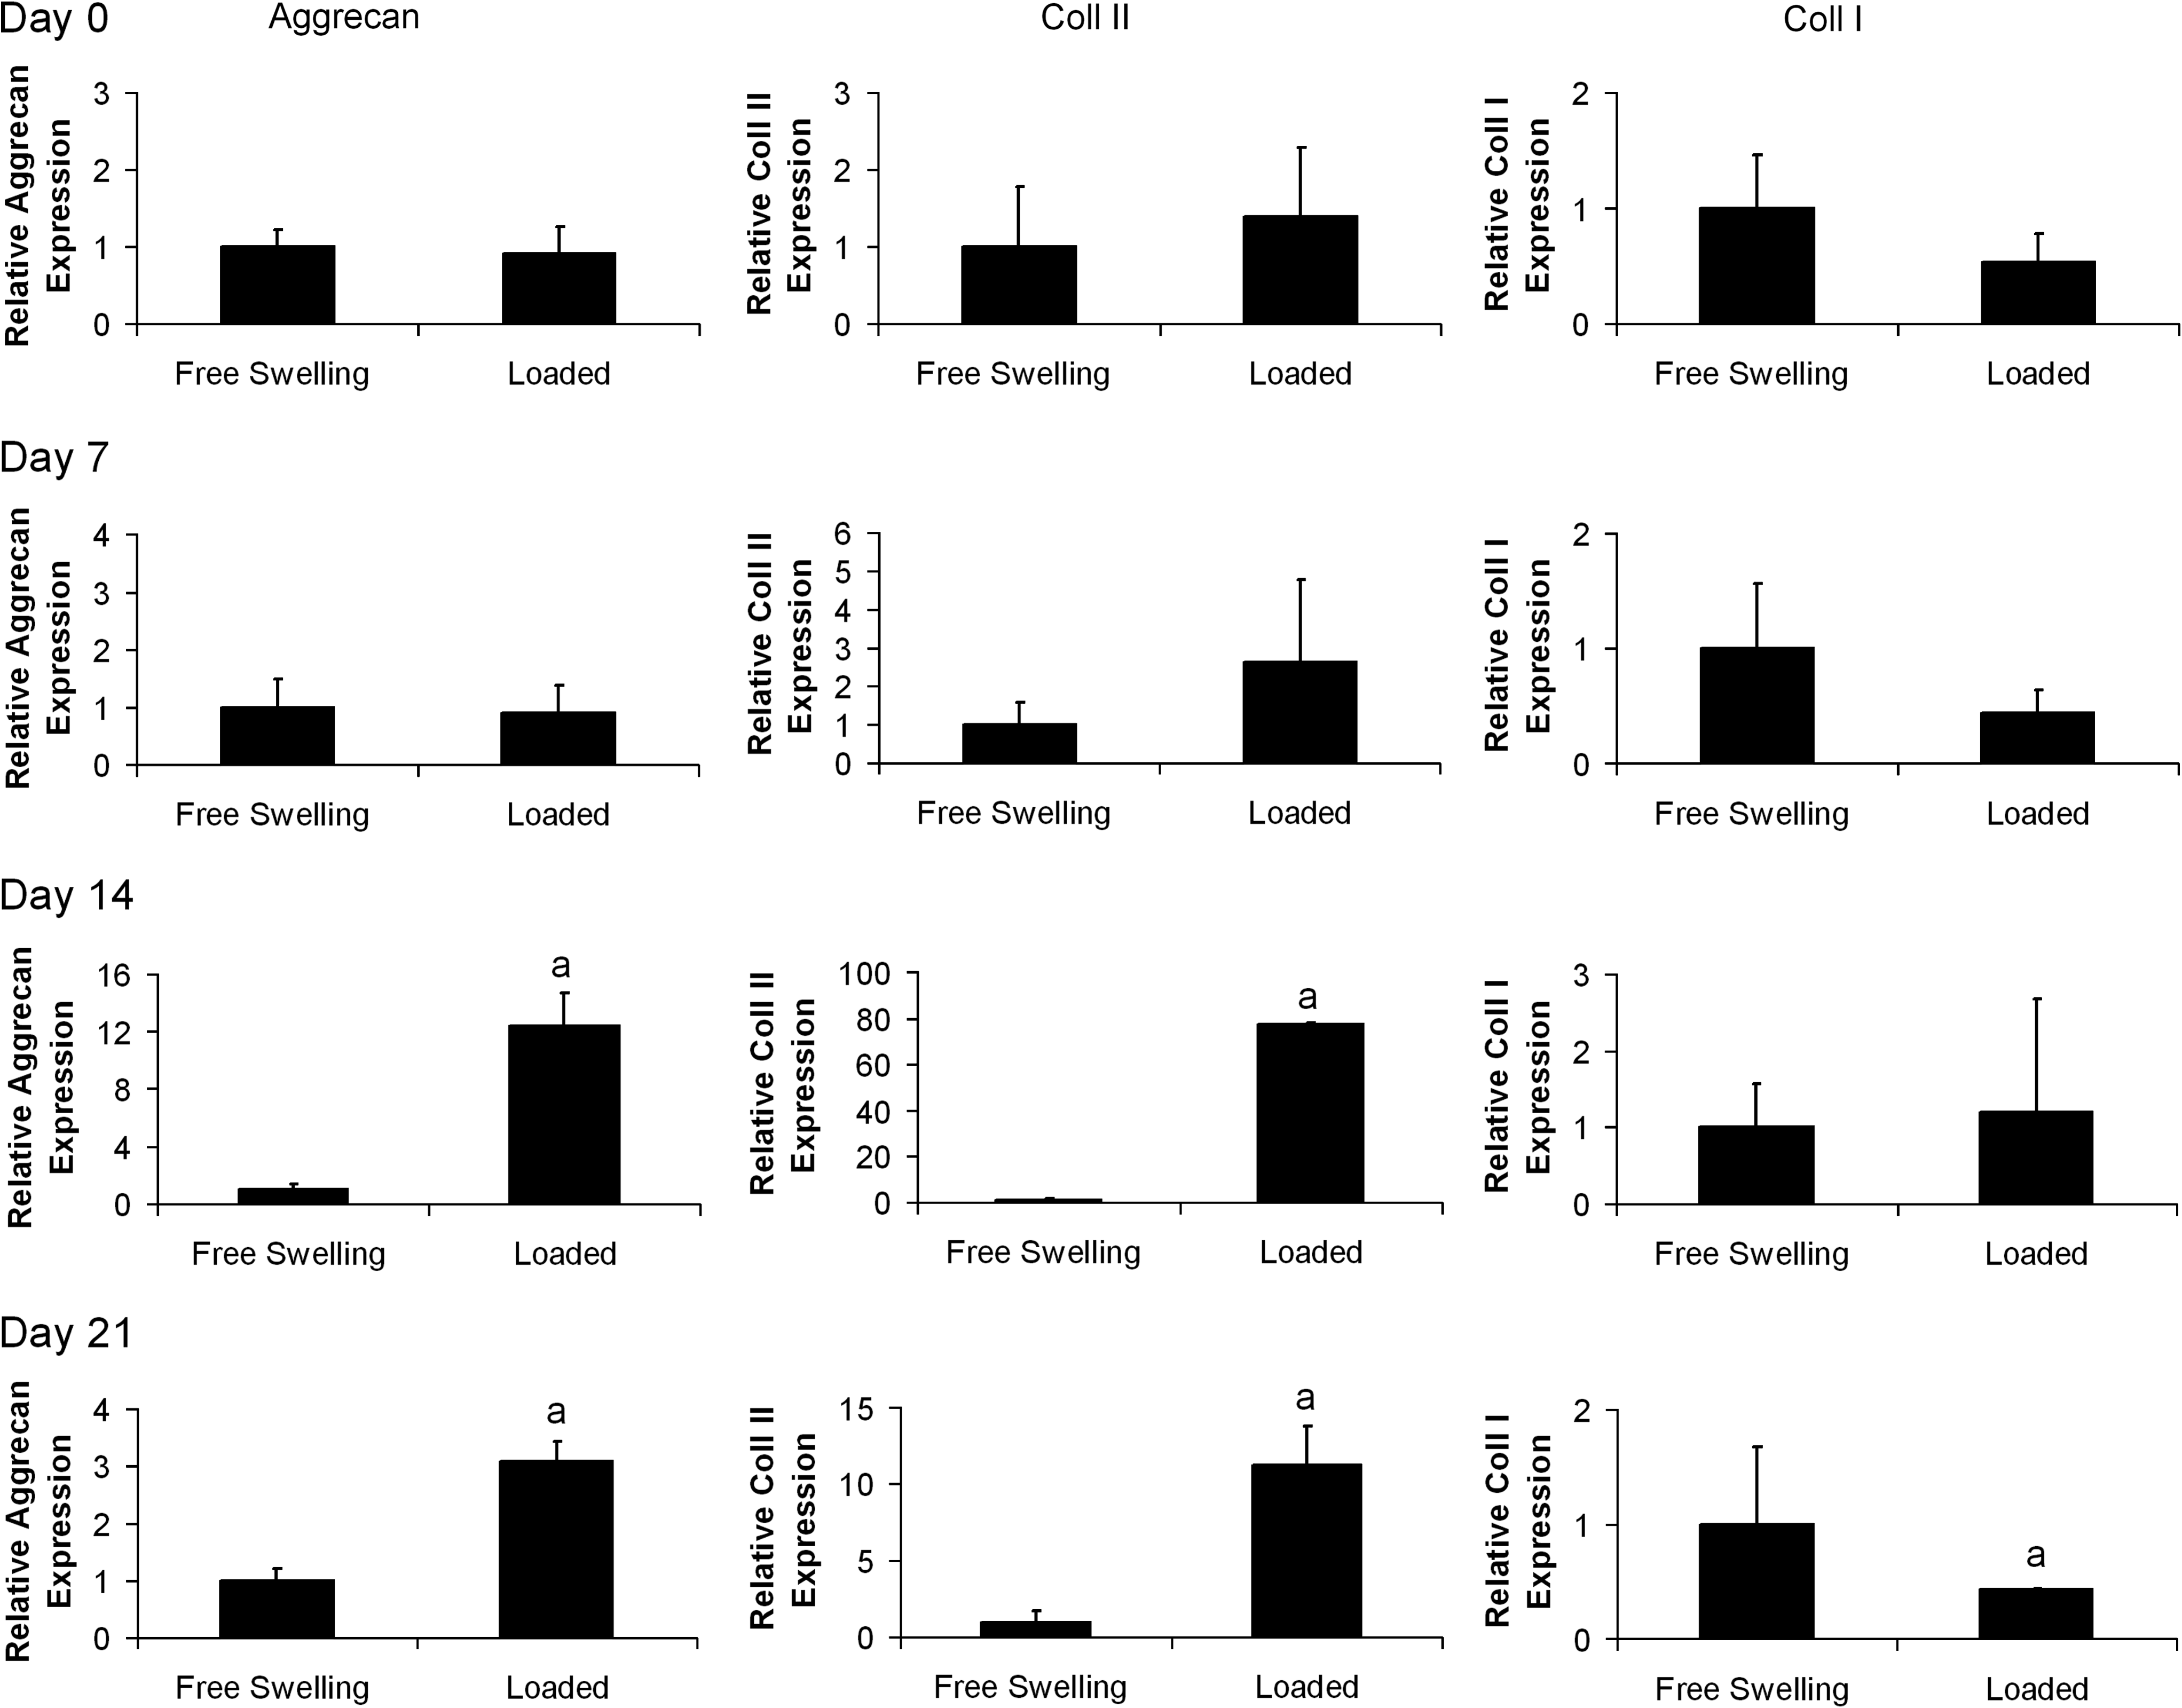
The changes in annular cartilage-matrix-specific gene expression in response to dynamic compression at days 0, 7, 14, and 21. Day 0 is defined as 60 h postagarose gel encapsulation. Relative gene expression is normalized to expression in free swelling core samples at each time point. n=3 samples per group per timepoint, ap<0.05 versus free swelling group.
Discussion
Dynamic compression has been previously shown to regulate chondrogenesis of MSCs within agarose constructs.1,10,16,20,22,26 However, the response of MSCs to such a mechanical stimulus has been shown to vary with the time frame of application.16,26 With this in mind, we sought to determine the effect of dynamic compression on cartilage-matrix-specific gene expression and to relate this response to the local biochemical environment and cell phenotype at the time of loading. At 0, 7, 14, and 21 days, ECM deposition within the constructs was determined biochemically and histologically and RT-PCR was used to examine the effects of dynamic compression on cartilage-matrix-specific gene expression. The results of these experiments show that the local environment in the core of the constructs is more favorable for chondrogenesis in comparison to the annulus, as evident from both ECM synthesis and gene expression. Additionally, we found that the response of the cells to mechanical stimulus varied with both the spatial region within the constructs and the temporal application of loading. That is not to say that the specific time of loading itself is critical, but rather spatial differences in phenotype and/or PCM accumulation with time are responsible for changes in cartilage-matrix-specific gene expression in response to loading. This may explain the different response to loading in the core and annulus of the constructs observed at earlier time points. The altered mechanical environment within the annular region of dynamically compressed agarose hydrogels, which consists of higher levels of fluid flow, may also be partially determining these spatial findings.
The authors chose to pool MSCs from multiple donors rather than investigate the response of MSCs isolated from individual donors to dynamic compression. This approach provides information on the mean response of a sample of a given population to a stimulus, in this case mechanical loading. The advantage of this approach is that other sources of experimental variability that would have to be considered when analyzing cells from multiple donors separately are inherently minimized as the constructs generated from pooled MSCs are maintained in identical conditions. The disadvantage of this approach is that it provides no information on donor variability in the response to loading. Therefore, it is possible, for example, that only a subset of the donors utilized in this study are responsive to dynamic compression. The results of studies that adopt this approach must be interpreted in this light.
Biochemical analysis of the samples shows a steady increase in sGAGs and collagen accumulation in the constructs over the 21-day incubation period (Figs. 1–3). The rate of sGAG and collagen synthesis increases between day 7 and 21, which correlates with the peaks found in the analysis of gene expression (Fig. 4). Previous studies have also investigated temporal changes in cartilage-matrix-specific gene expression of MSCs encapsulated in hydrogels.26,34 Campbell et al. 34 found that both aggrecan and collagen type II expression within alginate constructs increased from day 0 to 10, which was the last time point investigated in that study. Mouw et al. 26 observed that within agarose constructs aggrecan expression increased from day 0 to 16, whereas collagen type II expression peaked at day 8 and maintained similar levels of expression until day 16. We found that aggrecan and collagen type II expression increases from day 0 to a peak at day 14 followed by a reduction in expression at day 21 (Fig. 4). The differences in the time points used in each study and the discrete temporal nature of gene expression make comparisons difficult, but the general trend of peaks in cartilage-matrix-specific gene expression at day 8–14 is in agreement. Additionally, as distinct spatial areas of the constructs were analyzed in our study, we were able to detect changes in the smaller core region that may have been obscured in an analysis of a homogenized sample. The levels of expression of aggrecan and collagen type II, particularly in the annular region, appear to be lower than what would be expected following culture in TGF-β3-supplemented media (Fig. 4). However, the RT-PCR data are normalized to day 0 of the experiment, which in this study is defined as 60 h postagarose encapsulation and TGF-β3 supplementation. As a result, the gene expression data are normalized to a time point when expression of cartilage-matrix-specific genes would be expected to be elevated relative to pre-TGF-β3 supplementation values, explaining why the levels of gene expression at days 7, 14, and 21 may appear to be lower than expected. Normalization to gene expression in MSCs before TGF-β3 supplementation may have led to higher relative expression values, but this limitation does not affect our analysis of the changes in expression due to loading nor the temporal changes in FS conditions.
As observed in earlier studies,16,23 we found significant differences in the accumulation of sGAG within the core and annular regions of MSC-seeded hydrogels. It has been previously hypothesized that this is due to chondrogenic stimulus provided by lower oxygen tension in the core of the constructs.23–25,35,36 Additionally, Thorpe et al. 16 demonstrated that sGAGs are secreted from the constructs, further complicating the analysis of spatial sGAG accumulation by raising the possibility that lower levels of accumulation in the annular regions are simply due to greater diffusion of matrix components into the surrounding media. However in this study, spatial analysis of gene expression shows that aggrecan expression is significantly higher in the core of the constructs (Fig. 4A), suggesting that the local microenvironment is providing a stimulus that is responsible for enhanced cartilage-matrix-specific gene expression within the core, resulting in increased sGAG accumulation. Conversely, it was observed that in spite of collagen type II expression following the same trends as aggrecan expression, collagen accumulation was initially higher in the annulus of the constructs before being similar in both regions by day 21 (Fig. 1D, E). However, immunohistochemistry shows that a significant portion of the collagen accumulated in the annular region is type I collagen (Fig. 3).
The constructs used in this study were analyzed directly after one loading session; therefore, any differences in matrix synthesis relative to the FS samples at the same time point would be too small to measure using the biochemical assays or histological techniques implemented in this study. The effects of several loading parameters need to be determined before an optimal loading regime can be designed to enhance MSC cartilage matrix synthesis. This study therefore aimed to use RT-PCR, as a more sensitive measure, to identify how dynamic compression influences cartilage-matrix-specific gene expression both spatially and temporally. The data gained from such analysis may be useful in designing further studies seeking to optimize a loading regime to enhance matrix synthesis for cartilage tissue engineering applications.
Our results show that expression of cartilage-matrix-specific genes is increased by dynamic compression initiated at later time points, which suggests that mechanical stimulus can help support or maintain a chondrogenic phenotype. Furthermore, we found that the cells were not initially sensitive to stimulus, and became responsive to loading at different time points depending on the spatial region of the constructs (Figs. 5 and 6). It has been postulated that the establishment of a chondrogenic phenotype and development of a PCM before the initiation of loading may be a crucial determinant of MSC response to this stimulus.37,38 At day 7, a small response to loading was observed in the core of the construct, which was not observed in the annular region until day 14. This response to loading can be correlated with an earlier pericellular staining for sGAG in the core of the construct (Fig. 2). Interestingly, PCM staining for sGAG was similar in the core of the construct at day 7 and in the annulus at day 14, suggesting a role for the PCM in determining the response of MSCs to loading. Additionally, the local osmotic environment (tonicity), which is related to both the PCM and ECM, has been shown to regulate chondrocyte cartilage-matrix-specific gene expression and matrix production39–43 and may be further regulated by the application of dynamic compression.
There was one noted exception to this general response to loading. It was observed that dynamic compression can downregulate expression when basal levels are naturally elevated in FS conditions (day 14 core levels, see Fig. 4), as evidenced by the lower levels of aggrecan and collagen type II expression in the cores of loaded constructs at day 14 (Fig. 5). It is possible that the application of loading when levels of cartilage-matrix-specific gene expression are already high in FS conditions (30–450-fold increase in comparison to day 0, Fig. 4) may result in overstimulation, causing a reduction of gene transcription through receptor-based regulatory mechanisms. This reduction in gene expression at this time point correlates with previous studies demonstrating that dynamic compression applied within 14 days of TGF-β3 supplementation can inhibit cartilage-specific ECM accumulation in MSC-seeded agarose hydrogels.5,22,26 At day 21, a well-developed PCM was observed around MSCs in both the core and annulus of the constructs. At this time point, loading enhanced cartilage-matrix-specific gene expression in both regions of the construct. These changes in expression following loading are modest in comparison to the peak in expression found at day 14 (Fig. 4A, B). However, as a significant reduction in expression follows this peak in FS conditions, the effect of loading after this time point may be significant as a mechanism for sustaining enhanced levels of cartilage-matrix-specific gene expression.
Conclusions
The application of mechanical stimulus to enhance cartilage ECM synthesis may be an important tool in regenerative medicine-based cartilage repair. Our results suggest that a chondrogenic phenotype and/or the establishment of a cartilage-specific PCM must first be established before mechanical signals can have a positive effect on cartilage-matrix-specific gene expression. Further, this study provides evidence that mechanical stimulus may play a key role in the maintenance of a chondrogenic phenotype.
Footnotes
Acknowledgments
The authors acknowledge the Science Foundation Ireland, President of Ireland Young Researcher Award (08/Y15/B1336) for funding.
Disclosure Statement
No competing financial interests exist.