
Abstract
One of the crucial points for a successful tissue-engineering approach for cartilage repair is represented by the level of in vitro maturation of the engineered tissue before implantation. The purpose of this work was to evaluate the effect of the level of in vitro maturation of engineered cartilaginous samples on the tissue quality after in vivo implantation. Samples were obtained from isolated swine articular chondrocytes embedded in fibrin glue. The cell-fibrin composites were either cultured in vitro or directly implanted in vivo for 1, 5, and 9 weeks. Other experimental samples were precultured for either 1 or 5 weeks in vitro and then implanted in vivo for 4 additional weeks. All the samples were analyzed by histology, immunohistochemistry, biochemistry, and gene expression. The results strongly suggest that the in vivo culture in this model promoted a better tissue maturation than that obtained in the in vitro condition, and that 1 week in vitro preculture resulted in the primary structuring of the engineered composites and their subsequent maturation in vivo, without affecting the cell viability and activity, while a prolonged in vitro preculture caused a cell and matrix degeneration that could not be rescued in vivo.
Introduction
Tissue engineering has addressed the issue of articular cartilage repair with the aim of restoring the original function by the regeneration of a fully differentiated tissue. In fact, both autologous chondrocytes implantation and second-generation techniques based on the use of bioresorbable scaffolds, preseeded with autologous chondrocytes, have been widely applied in clinical practice.9–21 Nevertheless, results achieved to date are far from being satisfactory in terms also of long-term follow-up of the repairing tissue quality, and integration of the engineered tissue in the host joint.16,22–26 Several studies evaluated the potential of different hydrogels embedding cells for cartilage tissue engineering, including alginate,27,28 pluronic, 29 poly(ethylene oxide),30,31 and fibrin gel.32–37 Hydrogel scaffolds are natural or synthetic polymers that provide a supportive three-dimensional environment, which allows cells to proliferate, re-differentiate, and synthesize matrix. 38
Fibrin glue has been extensively employed not only as a naked scaffolding material but also as a carrier for cells and growth factors, due to its ready availability on both an autologous and an allogenic basis. 16 Some investigators have used fibrin glues as a matrix that enhances articular cartilage repair and have demonstrated that fibrin gel is a suitable polymer for generating new cartilage matrix.38–45 A crucial point to be addressed is the determination of the proper level of in vitro maturation of the engineered cartilaginous composite before being implanted. 46 As a matter of fact, while a partial maturation of the engineered tissue may be helpful to the surgeon for handling the implant, however, a prolonged in vitro culture may be harmful to the chondrocytes' vitality and phenotypic stability. A culture model was recently developed, in order to evaluate the degree of in vitro maturation of the engineered cartilage over time42,47 and, therefore, assess the potential advantages of an in vitro preculture based on the repair model of chondrocyte-fibrin glue hydrogel. Two different time periods of the in vitro preculture, 1 and 5 weeks, were compared, 42 demonstrating that the prolongation of the culture of a chondrocyte-fibrin glue hydrogel results in a more mature engineered cartilage, characterized by a more abundant cartilaginous matrix.
The aim of the present study was to evaluate the effect of the level of in vitro maturation of engineered cartilaginous samples on the tissue quality after in vivo implantation. Cell-fibrin experimental samples were precultured for either 1 or 5 weeks in vitro and then implanted in vivo for 4 additional weeks. As a comparison, other composites were either cultured in vitro or directly implanted in vivo in subcutaneous pouches of nude mice for the same time points (1, 5, and 9 weeks). Analyses and comparisons were performed concerning histology, matrix composition, cellularity, and gene expression.
Materials and Methods
Animal care and treatment
All animals were treated in accordance with both the policies and the principles of laboratory animal care consistent with the European Union guidelines (86/609/EEC), which were approved by the Italian Ministry of Health (Law 116/92).
Study design
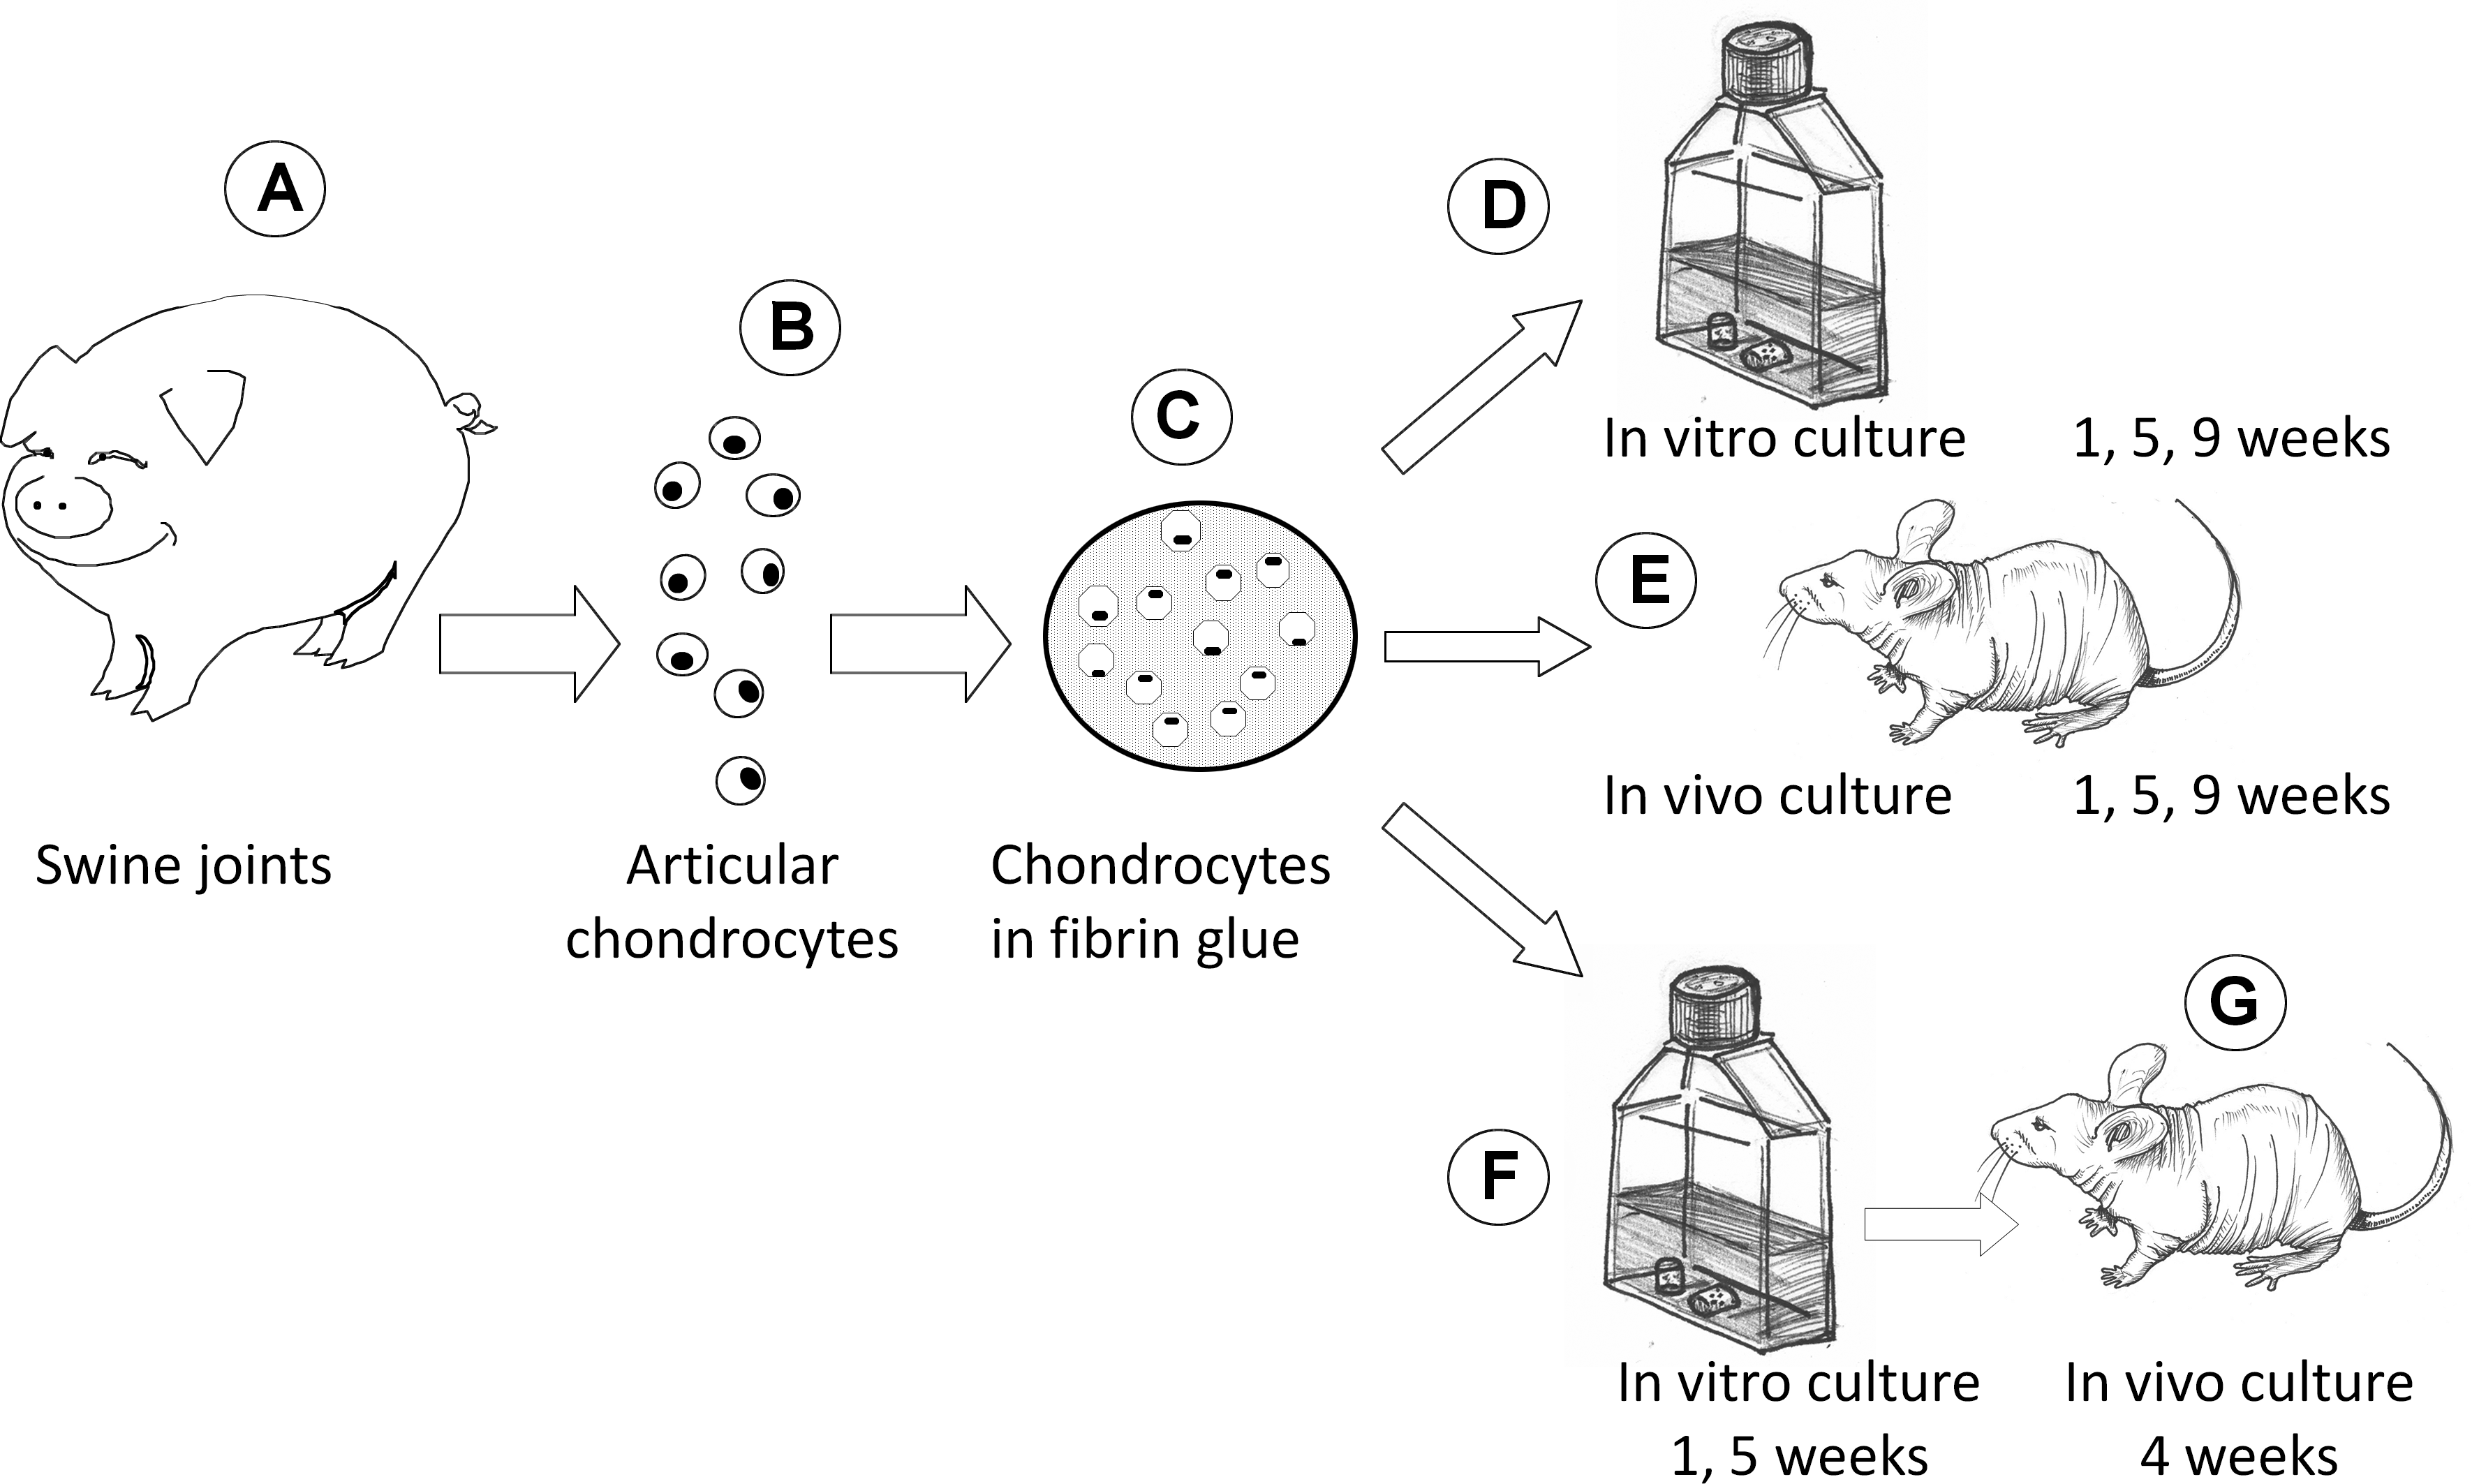
Experimental design is depicted in Figure 1. Cellular fibrin glue samples were prepared by combining fresh chondrocytes with a fibrin glue gel. Chondrocytes were isolated from the articular cartilage of shoulders and knees of young pigs (Landrace×Large White, live weight 10–14 kg, age 40±3 days) by collagenase digestion and resuspended in fibrinogen solution (80×106 cell/mL). Thrombin was added to form a fibrin glue gel composite embedding cells. Some samples were placed in standard culture conditions and then retrieved after 1, 5, or 9 weeks (T1 vitro, T5 vitro, and T9 vitro groups). Other samples were implanted in subcutaneous pouches of nude mice (male CD-1 nude mice, Charles River, Italy) for the same time schedule (T1 vivo, T5 vivo, and T9 vivo groups). At the end of the in vitro culture, half of the samples cultured for 1 and 5 weeks were implanted in nude mice for 4 additional weeks (respectively, T1+4 and T5+4 groups). At the end of each experimental time, the samples were analyzed (i) by standard histochemistry with SAFRANIN-0 staining; (ii) by immunohistochemistry and double immunofluorescence for collagen type 2 and 1; (iii) by biochemical assays for the quantification of the DNA and glycosaminoglycans (GAGs) contents; (iv) by gene expression for the determination of cell phenotype; (v) and by Western blot analysis for collagen type 2 production. Moreover, five native cartilage samples from five different piglets joints (see above) were collected and analyzed as control tissues for all the experimental samples.
From articular cartilage of shoulders and knees of young pigs
Chondrocytes isolation
Articular cartilage was harvested from young pigs' knees and shoulders under sterile conditions, avoiding the subchondral bone. Some cartilage slices (“native cartilage”) were frozen as a control tissue for morphological, biochemical, and gene expression analyses; all other cartilage slices were digested in Ham's medium (Celbio) containing 0.1% collagenase type 2 (DBA-Italia Srl) and 1% of the antibiotic/antimycotic solution (10,000 units Penicillin, 10 mg Streptomycin, and 25 μg Amphotericin B/mL in 0.9% sodium chloride; Sigma Chemical Co.). The specimens were incubated overnight in an oscillating water bath at 37°C. Undigested tissue and debris were removed by filtering the cell suspension using a 100 μm sterile filter (BD Falcon). The cell suspension obtained was centrifuged at 1400 rpm for 10 min. The cell pellet was washed twice in phosphate-buffered saline (PBS) (Celbio) and 2% antibiotic/antimycotic solution. The viability of the chondrocytes was assessed by Trypan blue staining (Sigma) and recorded as a percentage of viable chondrocytes per high-power field. The exact cell count per milliliter was established using a hemocytometer. Only those chondrocyte cultures having a viability score of 90% or greater were used in further experimental studies described next.
Chondrocytes were then resuspended in a solution containing bovine fibrinogen (110 mg/mL) (Fluka Chemie GmbH), aprotinin (0.2 mg/mL) (Sigma), and tranexamic acid (1.5 mg/mL) (Sigma) and adjusted to a concentration of 80×106 cells/mL.
Preparation of cellular fibrin glue samples
Fibrin glue samples were prepared in 48-multiwell plates. Three hundred microliters of the cell/fibrinogen solution were placed in each well. Three hundred microliters of thrombin (1.37 mg/mL) (Chemicon International, Inc.) were added in order to form a fibrin glue composite with cells. After 30 min, complete polymerization was reached, and the samples were placed in culture flasks for the in vitro phase and in the subcutaneous pouches of nude mice for the in vivo phase. Ten samples were prepared for each experimental group.
The in vitro samples were maintained in culture with Ham's medium (Celbio) adjusted with 10% fetal bovine serum (Sigma), ascorbic acid 50 μg/mL (Sigma), 1% glutamine (EuroClone), and 1% antibiotic/antimycotic solution (Sigma); the medium was changed thrice a week. The in vivo samples were placed in subcutaneous pockets in the dorsum of nude mice. The mice were anesthetized with 2,2,2 tribromoethanol (Sigma), and two small incisions were made on the right and left aspects of the dorsum. The chondrocyte-fibrin glue composites were placed into the pockets created by the incisions (2–4 implants/mouse), which were then closed with sutures at the end of the surgery. The composite implants were harvested under clean conditions after 1, 5, and 9 weeks, and the surrounding capsule was removed.
Biochemical analysis
Both cell-fibrin and native cartilage samples for biochemical evaluation were digested in papain (Sigma) for 16–24 h at 60°C; the digestion solution was composed of 125 μg/mL of papain (Sigma) in 100 mM sodium phosphate, 10 mM sodium EDTA (Sigma), 10 mM cysteine hydrochloride (Sigma), and 5 mM EDTA adjusted to 6.5 pH and brought to 100 mL of solution with distilled water. After the digestion, the samples were stored at −80°C until analysis. Aliquots of the papain digests were assayed separately for proteoglycan and DNA contents. The proteoglycan content was estimated by quantifying the amount of sulfated GAGs using the 1,9-dimethylmethylene blue dye binding assay (Polysciences Inc.) and a microplate reader (wavelength: 540 nm). The standard curve for the analysis was generated using bovine trachea chondroitin sulfate A (Sigma). DNA content was evaluated with the Quant-iT Picogreen dsDNA Assay Kit (Molecular Probes, Invitrogen), a fluorescence microplate reader, and standard fluorescein wavelengths (excitation 485 nm, emission 538 nm, and cut-off 530 nm). The standard curve for the analysis was generated using bacteriophage lambda DNA supplied with the kit.
Histochemical and immunohistochemical analysis
Both cell-fibrin and native cartilage samples were fixed in 10% (v/v) phosphate-buffered formaldehyde. The samples were then dehydrated in a graded 50% (v/v), 70% (v/v), 95% (v/v), and 100% (v/v) ethanol series; embedded in paraffin; and cut into 4-μm-thick sections. Finally, the sections were stained with SAFRANIN-0, using a standard staining protocol, for the evaluation of the morphology and GAGs deposition.
Other sections were used for immunohistochemical analysis of collagen type 2 (Chondrex staining kit; Chondrex Inc.). After rehydration, heat-induced antigen retrieval was performed by treating the sections in citrate buffer, pH 6.0, in a microwave oven. The sections were then washed thrice in PBS (pH 7.4). Before immunostaining, the sections were treated in a 2% hyaluronidase solution (Sigma) at room temperature for 30 min. To block endogenous peroxidase activity, the sections were incubated in an aqueous solution of 1% H2O2 for 30 min at room temperature and then washed thrice in PBS. The sections were incubated overnight with mouse anti-collagen type II antibody (Chondrex Inc.; 1:500). An affinity-purified biotinilated secondary antibody in conjunction with streptavidine peroxidase (1:500) was applied for 1 h at room temperature. Peroxidase activity was visualized with diaminobenzidine (Dakocytomation) and H2O2 as substrates.
All the incubations were performed in a moist chamber at room temperature, using PBS for washes between incubation steps. The sections were counterstained with hematoxylin, dehydrated, and mounted in mounting medium. Photomicrographs were taken with an Olympus BX51 microscope (Olympus) equipped with a digital camera, and final magnifications were calculated.
Double immunofluorescence
This procedure was utilized with the aim of revealing the possible co-localization of the two different types of collagen. After rehydration, heat-induced antigen retrieval was performed as previously described. The sections were then washed thrice in PBS (pH 7.4). They were subsequently incubated with the first-step primary antiserum, 1:50 anti-collagen type 1 (Millipore) for 24 h at 18°C–20°C, then washed in PBS, and subsequently treated with the Avidin-Biotin blocking kit solution (Vector Laboratories Inc.). The sections were then washed in PBS for 10 min and incubated with a solution of goat biotinylated anti-mouse IgG (Vector Laboratories Inc.) 10 μg/mL in Tris-buffered saline (TBS) for 1 h at 18°C–20°C. After rinsing twice in PBS, the sections were treated with Fluorescein-Avidin D (Vector Laboratories Inc.), 10 μg/mL in NaHCO3, 0.1 M, pH 8.5, and 0.15 M NaCl for 1 h at 18°C–20°C. The sections were then washed in PBS and incubated with mouse IgG (Vector Laboratories Inc.) for 2 h to inhibit binding of the second primary antiserum to the goat anti-mouse IgG used in the first sequence. For the second step of the double immunofluorescence procedure, the sections were treated in a 2% hyaluronidase solution at room temperature for 30 min. The slides were subsequently treated with 1:50 anti-collagen type-2 antiserum (Chondrex Inc.). A blocking step with the Avidin-Biotin kit (Vector Laboratories Inc.) was performed, and then, the sections were rinsed in TBS for 10 min and incubated with 10 μg/mL goat biotinylated anti-mouse IgG (Vector Laboratories Inc.) for 1 h at 18°C–20°C. The sections were then washed twice in PBS, and treated with Rhodamine-Avidin D (Vector Laboratories Inc.), 10 μg/mL in NaHCO3, 0.1 M, pH 8.5, with 0.15 M NaCl for 1 h at 18°C–20°C. Finally, the slides with tissue sections were embedded in Vectashield Mounting Medium (Vector Laboratories Inc.) and observed using a Confocal Laser Scanning Microscope (FluoView FV300; Olympus). The immunofluororeactive structures were excited using Argon/Helio-Neon-Green lasers with excitation and barrier filters set for fluorescein and rhodamine. The images containing superimposition of fluorescence were obtained by sequentially acquiring the image slice of each laser excitation or channel.
With the aim of obtaining more detailed structural observations, nuclei were counterstained with 10 g/mL of Hoechst bisbenzimide, after the double immunofluorescent procedure. These latter sections were observed using an Olympus BX51 light microscope equipped with an AFTER (Amplified Fluorescence by Transmitted Excitation of Radiation) Light Emitting Diodes (LED) Fluorescence Microscope kit (Lab Vision), thus providing an easy adaptation of a light microscope to a fluorescence one as described by Lang et al. 48 In the double-immunofluorescence experiment, the absence of cross-reactivity with the secondary antibody was verified by omitting the primary antibody during the first incubation step.
RNA extraction and reverse transcription
Both cell-fibrin and native cartilage samples were pulverized for 2 min at 3000 oscillations/min in a liquid-nitrogen-cooled dismembrator (Mikro-Dismembrator; Sartorius Stedim). A 1 mL aliquot of Qiazol (Qiagen Sciences) was added to the powdered samples in microcentrifuge tubes; after 10 min, 200 μL of chloroform were added to each sample before the centrifugation at 12,000 g for 15 min at 4°C.
RNA was extracted from the aqueous phase using a commercially available RNA purification kit (RNeasy Mini Kit; Qiagen). Digestion of DNA was carried out using a commercially available kit (RNase-Free DNase Set; Qiagen). The RNA was stored at −80°C before reverse transcription.
The purified RNAs were measured (ND-1000 spectrophotometer Nanodrop Technologies) and then, 600 ng RNA were used to prepare cDNA using the ImProm II Reverse Transcription System according to the manufacturer's instructions (Promega Italia). cDNAs were stored at −20°C before the relative quantification of gene expression.
Real-time polymerase chain reaction
Real-time polymerase chain reaction (PCR) was performed using the iQ SYBR green Supermix (Bio-Rad Laboratories Inc.). cDNA was amplified using specific primers (Table 1) at a concentration of 0.4 μM. After activating the DNA polymerase by incubation for 2 min at 95°C, 40 cycles of amplification were carried out. After PCR, the baseline subtraction method was used to determine the threshold cycle.
The results were analyzed using the comparative threshold cycle method. Expression levels for native cartilage were used as a baseline for each gene, which was further normalized to β2-microglobulin housekeeping expression. Baseline expression levels were, therefore, assigned a value of 100.
Tissue homogenization and Western blot analysis
Both cell-fibrin and native-cartilage samples were pulverized for 2 min at 3000 oscillations/min in a liquid-nitrogen-cooled dismembrator (Mikro-Dismembrator), and subsequently homogenized in 2 mL of ice-cold lysis buffer (50 mM Tris–HCl, pH 7.5, 0.2% Triton X-100, and protease inhibitor mixture) per 200 mg of tissue using an Ultra-Turrax homogenizer (IKA-Werke). The homogenate was then centrifuged at 14,000 rpm for 20 min at 4°C to remove all insoluble material. The supernatant was collected, and total protein content was measured using a commercial protein quantification kit (Pierce) based on bicinchoninic acid colorimetric detection of the cuprous cation obtained by protein Cu2+ reduction in an alkaline medium. The optical densities were read at 562 nm against a calibration curve using a bovine serum albumin (Sigma) working range of 50–800 μg/mL. Total proteins (50 μg) were resolved by 10% SDS-PAGE and electro-transferred onto nitrocellulose membranes. After blocking, the membranes were incubated at 4°C with collagen type 2 primary antibody (1:1000; Chondrex Inc.) for 2 h and subsequently with a horseradish peroxidase-conjugated secondary antibody (1:5000) at room temperature for 60 min. Immunoreactivity was detected by chemiluminescence autoradiography according to the manufacturer's instructions, and the images were scanned. The optical intensities of the protein bands of interest were densitometrically determined using Scion Image software.
Statistical analyses
Five different analyses of variance (ANOVA) followed by Dunnett's test were used to determine significance. Moreover, the one-way ANOVA test was specifically applied to the samples used in in vitro timing (T0 vs. T1 vs. T5 vs. T9), in vivo timing (T0 vs. T1 vs. T5 vs. T9), 1 week (in vitro vs. in vivo), 5 weeks (5 vitro vs. 5 vivo vs. 1+4), and 9 weeks (9 vitro vs. 9 vivo vs. 5+4). Data were expressed as means±SE, and statistical significance was established as p<0.05.
Results
Histochemical evaluation
At the end of each experimental time, samples were collected for SAFRANIN-0 staining, which is specific for GAGs deposition. Both cell-fibrin experimental (Fig. 2) and native cartilage samples (Fig. 3A) showed a matrix positive for the presence of GAGs with the exception of time 0 that was completely negative (Fig. 2, T0). The production of GAGs began in the first phases of both the in vitro and in vivo samples: after 1 week of in vitro culture, a weak positivity of the matrix was observed (Fig. 2, T1 vitro) that increased during the next few weeks of culture, but was associated with some degenerating phenomena in the cell-fibrin samples, which appeared as roundish cavities in the newly formed matrix (Fig. 2, T5 vitro, T9 vitro). Chondrocytes were scarce and small at time 0 (Fig. 2, T0), while they were more abundant in the subsequent time periods (Fig. 2, T1 vitro, T5 vitro, and T9 vitro). Samples from 1 week of the in vivo culture (Fig. 2, T1 vivo) showed a heavier positivity compared with those from the in vitro phase (Fig. 2, T1 vitro), which were prevalently located near and within the chondrocyte lacunae. The chondrocytes were numerous, and most of them showed positivity in the cytoplasm. The GAGs deposition in the matrix increased over the in vivo experimental times (Fig. 2, T5 vivo, T9 vivo), and those samples collected after 9 weeks showed an intensive staining for GAGs in both the chondrocytes' lacunae and the matrix (Fig. 2, T9 vivo).
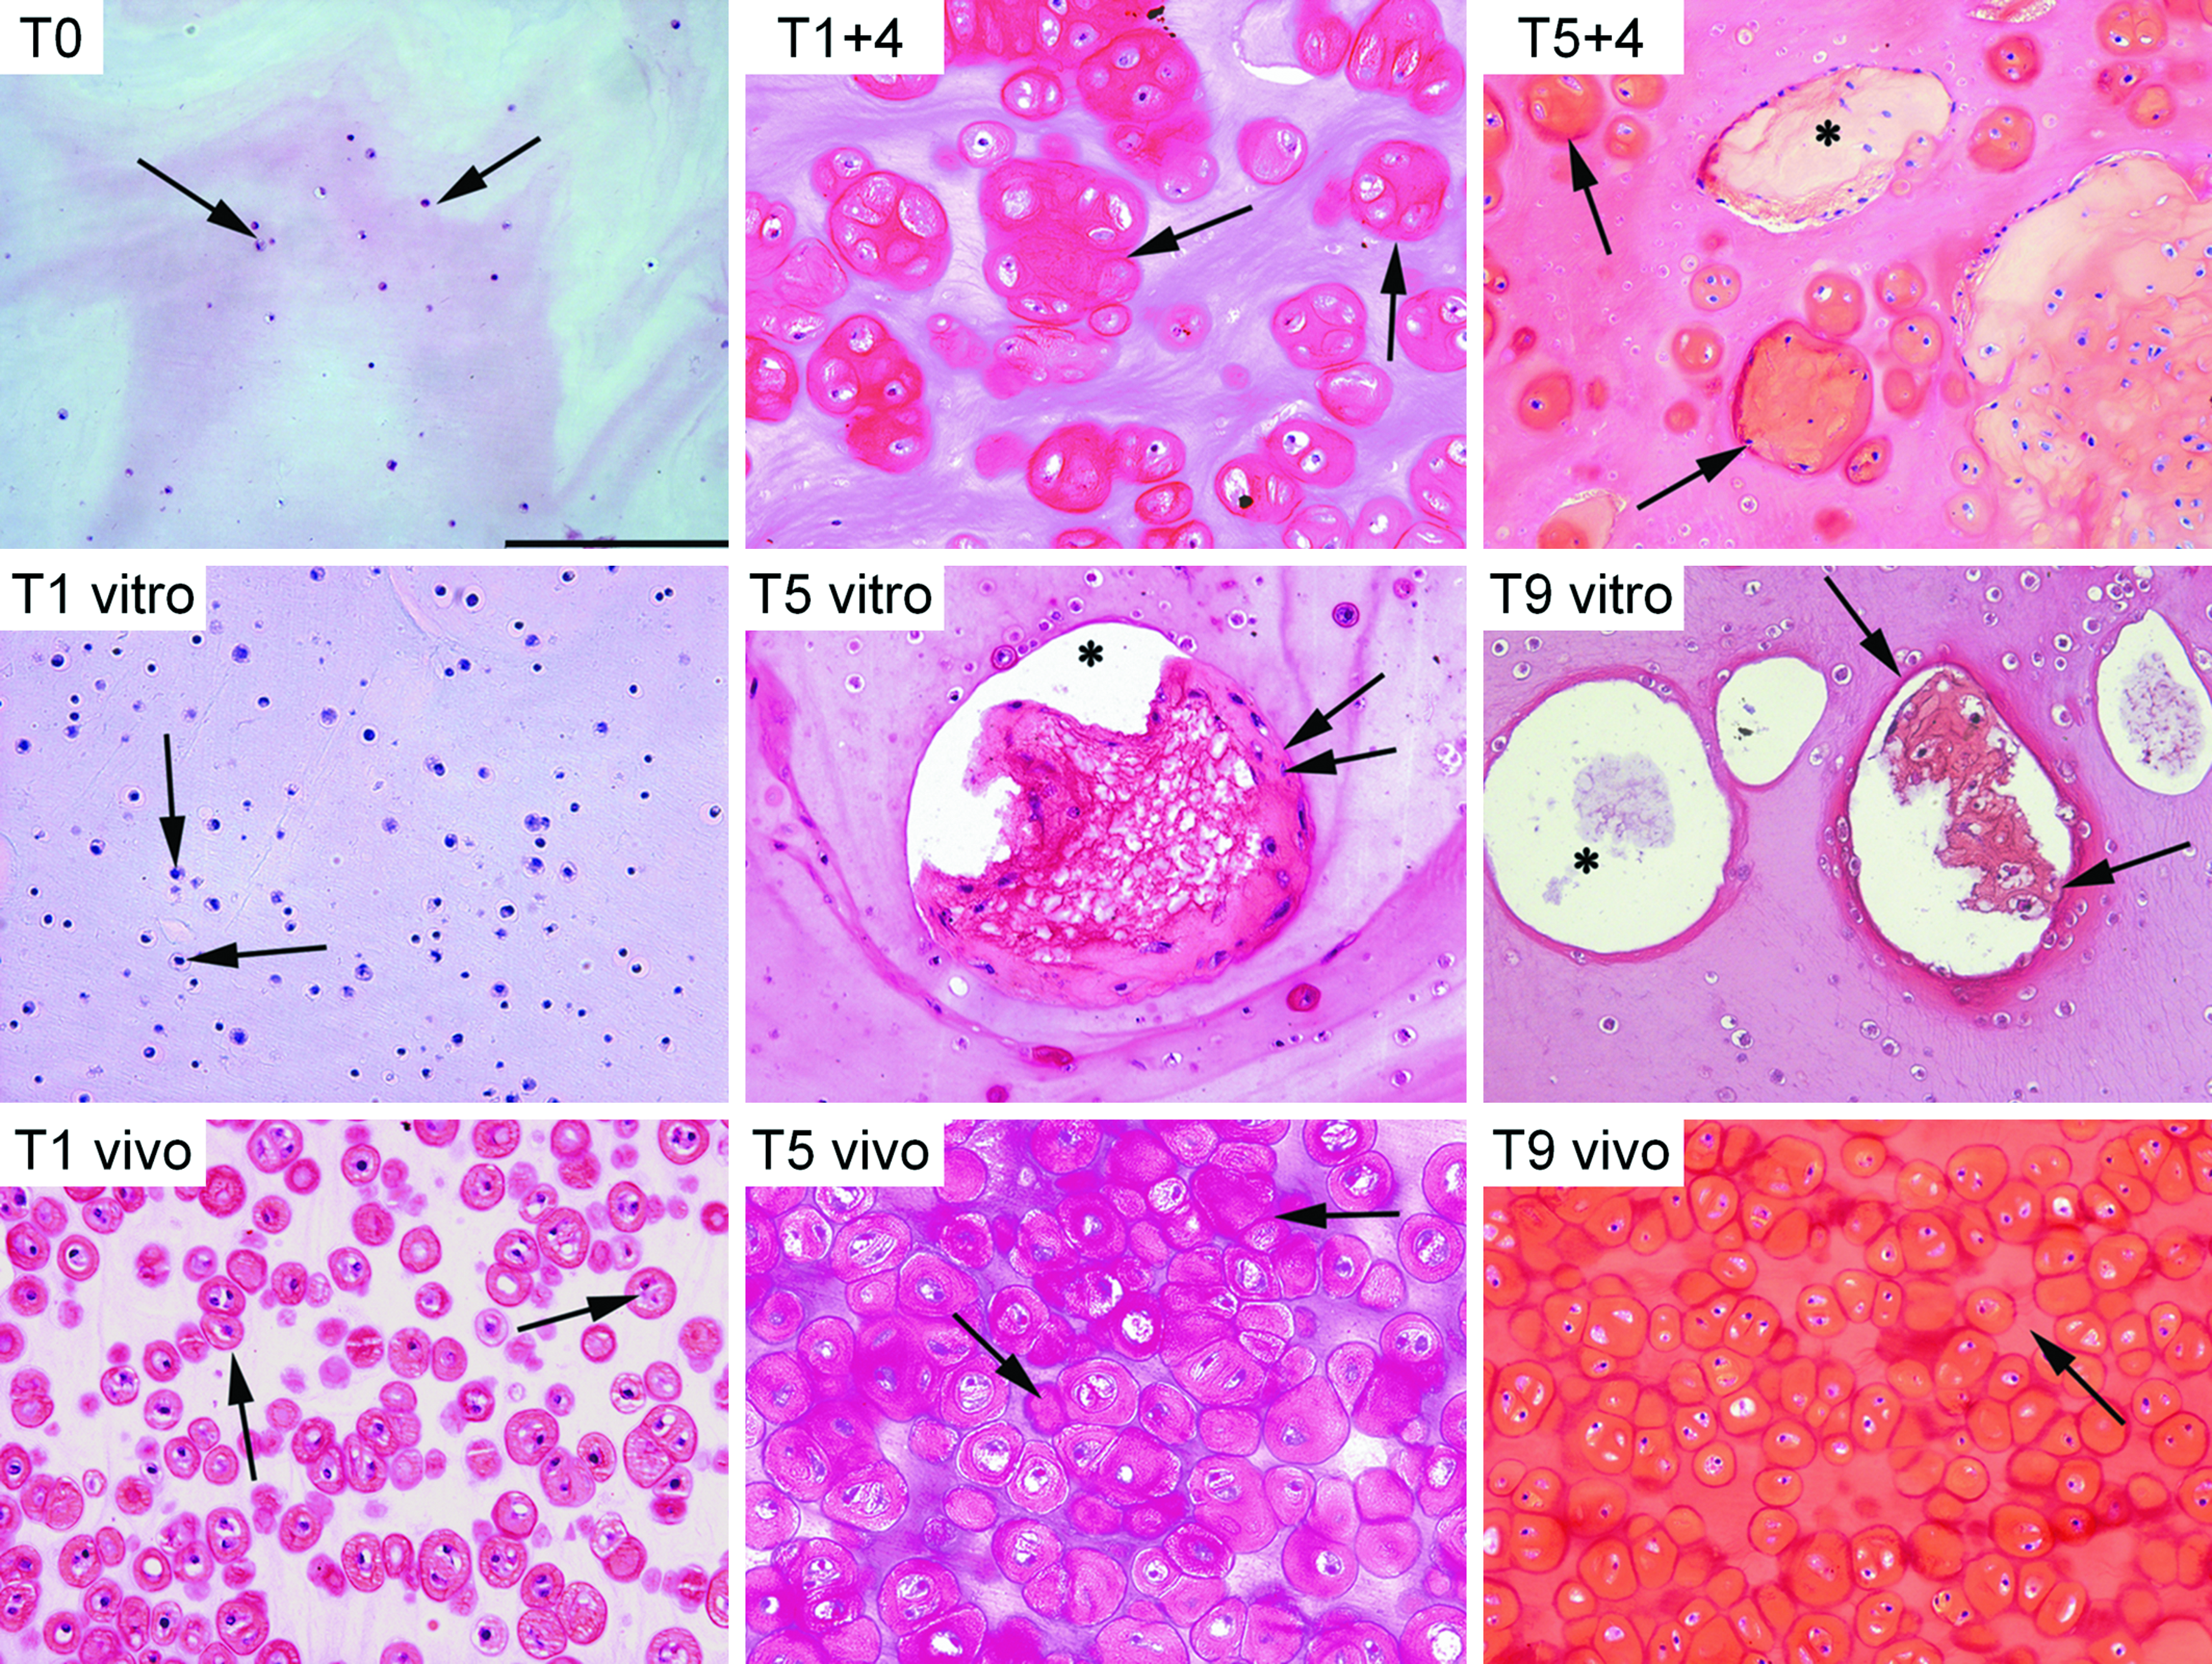
SAFRANIN-0 histochemical staining of engineered cartilage samples. All figures have the same scale bar located in

Native cartilage staining. All figures have the same scale bar located in A: scale bar 200 μm.
The cells-fibrin composites implanted in the nude mice after 1 or 5 weeks of in vitro preculture showed a higher content of GAGs compared with the samples of the in vitro phase, in particular in the lacunae: the in vivo culture enhanced the chondrocytes' production of GAGs (Fig. 2, T1+4, T5+4), but some degenerating areas were still present in the samples that had been precultured in vitro for 5 weeks (Fig. 2, T5+4).
The tissue morphology changed over the experimental times: the in vivo culture increased the number, size, and activity of the cells in the fibrin scaffold, as demonstrated by GAGs deposition and, as a consequence, the matrix matured into a cartilage-like tissue characterized by the presence of lacunae surrounding the chondrocytes (Fig. 2, T5 vivo, T9 vivo). The chondrocytes' activity was also supported by the in vitro culture, but a loss in the cell number and the formation of degenerating areas within the fibrin samples was observed at 5 and 9 weeks (Fig. 2, T5 vitro, T9 vitro). In addition, the samples precultured for 5 weeks in vitro (Fig. 2, T5+4) were affected by the presence of some degenerating phenomena but to a minor extent with regard to T9 vitro samples (Fig. 2, T9 vitro), while those precultured for 1 week only (Fig. 2, T1+4) showed a rescue in the cellularity and morphology of the tissue and appeared to be similar to the samples cultured in vivo.
Immunohistochemical evaluation of collagen 2
The cell-fibrin composites and native cartilage samples were stained for collagen 2, a cartilage-specific collagen isoform (Fig. 4 and Fig. 3B, respectively).

Collagen 2 immunohistochemical staining of engineered cartilage samples. All figures have the same scale bar located in T0: scale bar 200 μm. T0: Immunonegative and immature small chondrocytes are detected (arrows); T1 vitro: some small chondrocytes are immunopositive (arrows); T1 vivo: several mature chondrocytes are immunopositive in the cytoplasm and in the lacunae (arrows); T1+4: the immunopositivity is detected in the lacunae and in the matrix, especially near the lacunae; T5 vitro: scarce mature chondrocytes are grouped in a cluster-like formation with a weak positivity in the matrix (arrows); T5 vivo: mature chondrocytes are present, having a weak cytoplasmic positivity but a strong reactivity in the extracellular matrix (arrows); T5+4: mature chondrocytes are grouped in a cluster-like formation with a clear positivity in the matrix (arrows); T9 vitro: scarce mature chondrocytes are detected with a very weak positivity (arrows); T9 vivo: mature chondrocytes are present with a weak cytoplasmic immunoreactivity but a strong immunopositivity in the extracellular matrix (arrows). Color images available online at www.liebertonline.com/tea
At time 0, both scarce small chondrocytes and the extracellular matrix were immunonegative for collagen 2 (Fig. 4, T0). The samples collected after 1 week of in vitro culture showed some immunoreactivity, which was restricted to a limited number of lacunae around the cells (Fig. 4, T1 vitro) and was almost absent in the matrix; generally, the collagen 2 production was similar over the in vitro times (Fig. 4, T5 vitro, T9 vitro). The samples collected after 1 week of in vivo culture showed a higher deposition of collagen 2 in both the cytoplasm of several chondrocytes and the lacunae (Fig. 4, T1 vivo), which increased over the in vivo experimental times. In fact, after 5 and 9 weeks, the cartilage-like tissue was evidently enriched in collagen 2 content, which was either uniformly distributed in the matrix surrounding the chondrocytes (Fig. 4, T5 vivo, T9 vivo) or located near some lacunae or within them (Fig. 4, T9 vivo). All the samples that had been precultured in vitro before the in vivo procedures (Fig. 4, T1+4, T5+4) showed a higher deposition of collagen 2 compared with that of the in vitro samples: the specimens precultured for 1 week before the implantation showed a more mature tissue characterized by the presence of collagen 2 not only in the lacunae but also in some areas of the matrix (Fig. 4, T1+4), while the samples precultured for 5 weeks were characterized by a collagen deposition restricted to some chondrocyte clusters (Fig. 4, T5+4).
Double immunofluorescent detection of collagen I and II
Both engineered cartilage and native cartilage samples were contemporary immunostained for collagen 1 (green) and collagen 2 (red) (Fig. 5 and Fig. 3C, respectively). Time 0 samples appeared to be immature, with no deposition of any collagen isoform in the extracellular matrix and a very limited number of small chondrocytes staining positive for collagen 2 (Fig. 5, T0). Samples collected after 1 week of in vitro culture were characterized by collagen 2 deposition in the lacunae with a weak positivity for collagen 1 in some areas of the engineered tissue, while a minor co-expression (in yellow) of the two isoforms was detected (Fig. 5, T1 vitro). After 5 weeks of the in vitro culture, collagen 2 deposition was restricted to some chondrocyte clusters within the matrix, collagen 1 expression was reduced and restricted to a few chondrocytes, and a negligible co-expression of the two isoforms was occasionally detected (Fig. 5, T5 vitro); samples collected after 9 weeks of in vitro culture showed a similar appearance to those samples collected at an earlier time point, and collagen 2 deposition was confined only in some clusters (Fig. 5, T9 vitro). The in vivo phase strongly induced collagen 2 production: after 1 week, several chondrocytes and lacunae were collagen-2 positive with no detection of collagen 1 (Fig. 5, T1 vivo); at 5 and 9 weeks, the matrix was homogeneously immunostained for collagen 2 with a co-expression of collagen 1 in a very limited number of chondrocytes (Fig. 5, T5 vivo, T9 vivo). A similar picture was observed in the samples that had been precultured in vitro before being implanted: the matrix appeared strongly positive for collagen 2 in both experimental time points (Fig. 5, T1+4, T5+4), but the samples precultured for 5 weeks were characterized by a less homogeneous distribution of collagen 2 that was restricted to some clusters, and by the co-expression of collagen 1 in some chondrocytes forming the clusters (Fig. 5, T5+4).

Collagen 1 and 2 double immunofluorescent staining of engineered cartilage samples (collagen 2 in red, collagen 1 in green). The nuclei are represented in blue with Hoechst bisbenzimide. All figures have the same scale bar located in T0: scale bar 200 μm. T0: weak immunopositivity to collagen 2 in the cytoplasm of very scarce, small chondrocytes (red); T1 vitro: some chondrocytes are immunopositive to collagen 2 in the cytoplasm and lacunae (red), while a slight immunoreactivity to collagen 1 in the fibrin glue is also evident (green); one chondrocyte shows a limited co-localization with collagen 1 (yellow). T1 vivo: mature chondrocytes are immunopositive to collagen 2 in the cytoplasm and lacunae (red), and a scarce reactivity to collagen 1 is detected in the fibrin glue (green); a negligible co-localization with collagen 1 is present (yellow). T1+4: chondrocytes are present and grouped in isogenous islets, which reveal the immunopositivity to collagen 2 in the cytoplasmic rim of the majority of chondrocytes (red). T5 vitro: grouped mature chondrocytes positive to collagen 2 are detected (red), while an immunoreactivity to collagen 1 is also evident in the matrix (green); T5 vivo: chondrocytes are present with a strong immunoreactivity to collagen 2 in both the cytoplasm of the cells and the extracellular matrix (red) with scarce co-expression of collagen 1 (yellow); T5+4: mature chondrocytes are grouped in a cluster-like formation with a strong positivity to collagen 2 (red) and a co-expression of collagen 1 (yellow); T9 vitro: some chondrocytes with a collagen 2 positivity (red) in the matrix near the lacunae; T9 vivo: several chondrocytes are present with immunoreactivity to collagen 2 in both the cytoplasm and the extracellular matrix (red). The majority of them show co-expression with collagen 1 (yellow). Color images available online at www.liebertonline.com/tea
Biochemical analysis: cellularity and GAGs production
Cell-fibrin composites and native cartilage samples were digested in papain in order to measure either the DNA content, an index of cellularity, or the GAGs production as a marker of the extracellular matrix. With regard to native cartilage, only the samples cultured in vivo showed higher cellularity values (native cartilage: 0.13±0.01 μg/mg; T1 vivo: 0.23±0.03 μg/mg; T5 vivo: 0.21±0.03 μg/mg; T9 vivo: 0.24±0.04 μg/mg; T1+4: 0.24±0.02 μg/mg; T5+4: 0.24±0.01 μg/mg; p<0.01). All samples showed lower levels of GAGs with regard to native cartilage (native cartilage: 96.4±5.15 μg/mg; T0: 3.11±0.62 μg/mg; T1 vitro: 17.98±3.46 μg/mg; T5 vitro: 18.01±3.04 μg/mg; T9 vitro: 15.05±7.11 μg/mg; T1 vivo: 34.01±2.29 μg/mg; T5 vivo: 28.98±4.69 μg/mg; T9 vivo: 34.85±3.64 μg/mg; T1+4: 28.92±2.01 μg/mg; T5+4: 31.98±4.71 μg/mg; p<0.01). Moreover, all the samples showed lower levels of GAGs/DNA ratio with regard to native cartilage (native cartilage: 738.73±101.2 μg/mg; T0: 21.2±4.19 μg/mg; T1 vitro: 138.3±25.6 μg/mg; T5 vitro: 128.64±30.15 μg/mg; T9 vitro: 188.12±30.91 μg/mg; T1 vivo: 147.86±24.92 μg/mg; T5 vivo: 138.04±28.18 μg/mg; T9 vivo: 145.2±20.17 μg/mg; T1+4: 120.66±15.87 μg/mg; T5+4: 135.83±22.16 μg/mg; p<0.01).
In those samples cultured in vitro, the cellularity at times 0, 1, and 5 weeks was higher when compared with that at 9 weeks (p<0.01); the GAGs production and the GAGs/DNA ratio were higher at 1, 5, and 9 weeks with regard to time 0 (p<0.01; Fig. 6A).
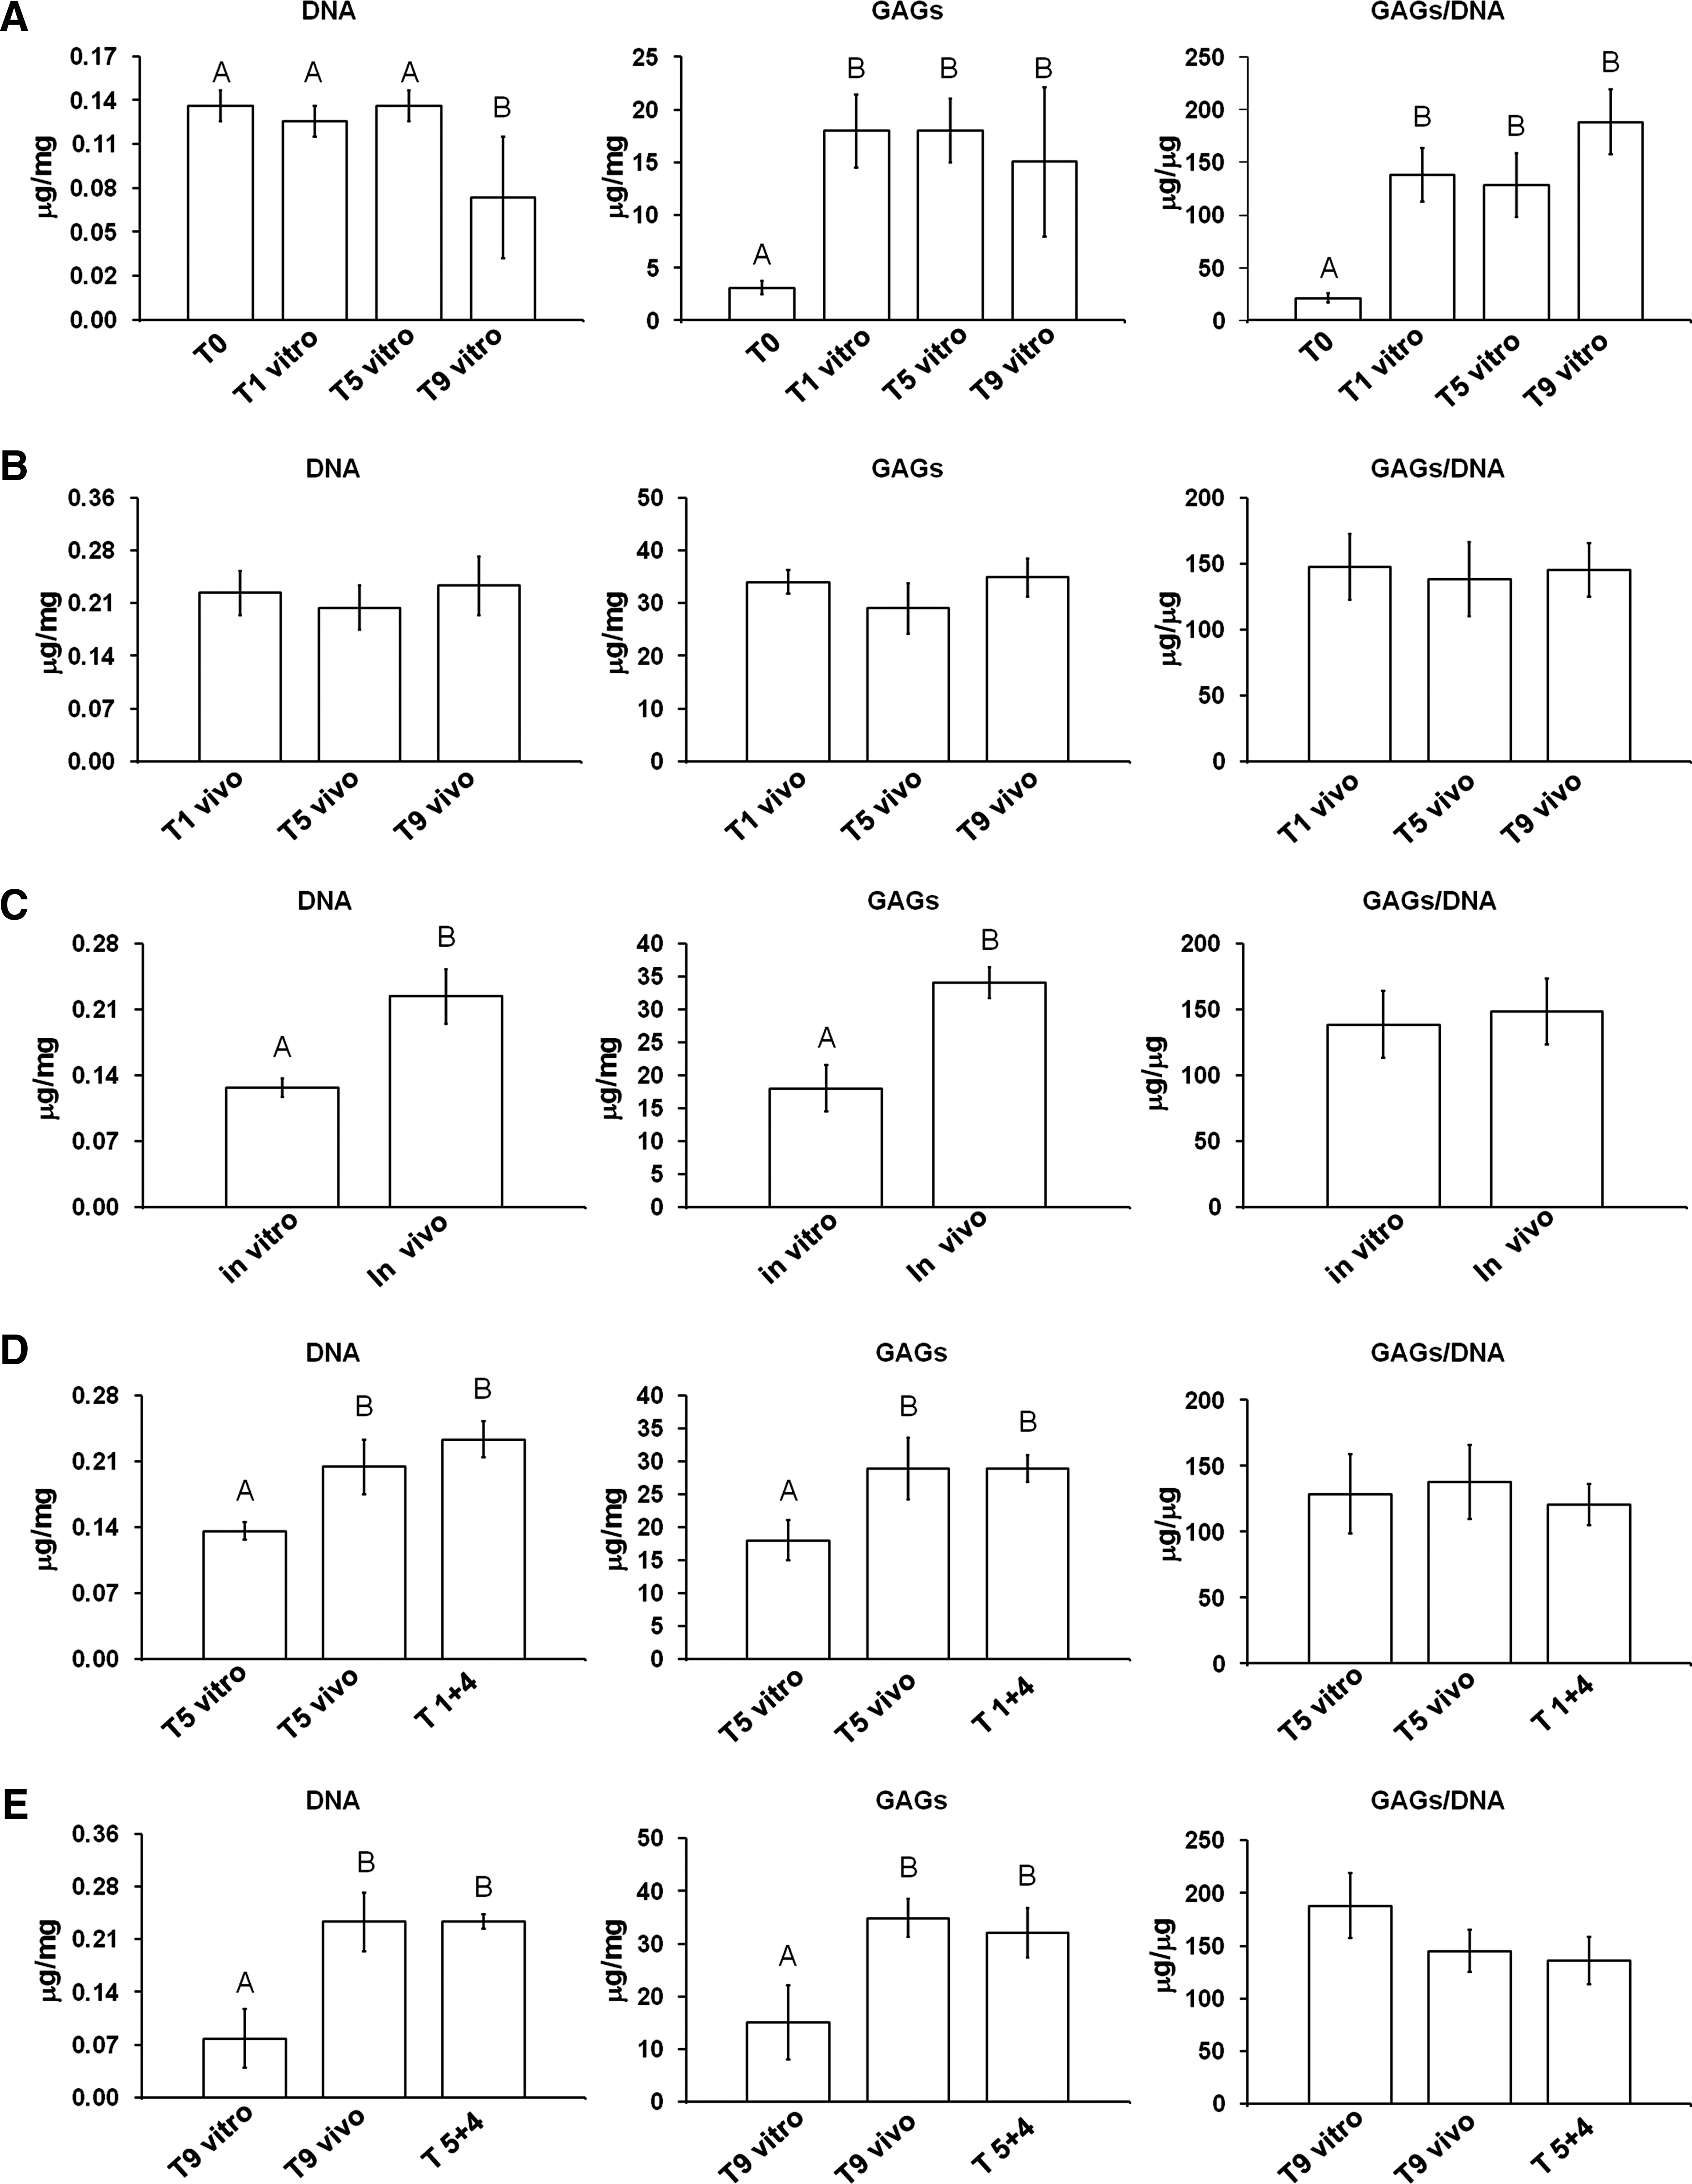
Differences in biochemical analyses (DNA, GAGs, and GAGs/DNA ratio) of the engineered cartilage composites at different conditions in
In the samples cultured in vivo, the cellularity was not different throughout the experimental times, as well as the GAGs production and GAGs/DNA ratio (Fig. 6B).
At 1 week, the values of cellularity and GAGs production were higher in the samples cultured in vivo than those of the samples cultured in vitro (p<0.01) (Fig. 6C).
At 5 weeks, in the samples 1+4 and T5 vivo, the cellularity and GAGs production were higher than those of the T5 vitro samples (p<0.01), whereas the ratio GAGs/DNA did not show statistical differences among the groups (Fig. 6D).
At 9 weeks, in the samples 5+4 and T5 vivo, the cellularity and GAGs production were higher with regard to the T9 vitro samples (p<0.01), whereas the ratio GAGs/DNA did not show statistical differences (Fig. 6E).
Gene expression analysis
The gene expression analyses of cartilaginous genes (collagen 2, aggrecan, and sox9) and non-cartilage specific genes (collagen 1) was performed to evaluate the maintenance of chondrocytes phenotype in the fibrin glue at the different culture conditions and time points.
When comparing all experimental samples (in vitro, in vivo, 1+4 and 5+4) with native cartilage samples, collagen 2 gene expression was lower only in T1 vitro (T1 vitro: 3.88±1.48 vs. native cartilage: baseline expression value of 100; p<0.05); aggrecan and sox9 were higher only in the T1 vivo group (aggrecan=T1 vivo: 350.81±74.81 vs. native cartilage; sox9=T1 vivo: 328.89±59.46 vs. native cartilage; p<0.01). Collagen 1 revealed no differences between the groups and the native cartilage.
When comparing the samples cultured in vitro, collagen 2 was lower at 1, 5, and 9 weeks with regard to time 0 (p<0.01), while no differences were observed for aggrecan, sox9, or collagen 1 expression (Fig. 7A). In the samples cultured in vivo, both aggrecan and sox9 expression was higher at 1 week than that at 5 and 9 weeks (p<0.01), while no differences were observed for collagen 2 and 1 expression (Fig. 7B). At 1 week, the expression of collagen 2, aggrecan, and sox9 in those samples cultured in vivo was higher (p<0.05 for collagen 2; p<0.01 for aggrecan and sox9) with regard to those cultured in vitro for the same time period (Fig. 7C). At 5 weeks, when comparing the samples 1+4, T5 vitro, and T5 vivo, the expression of both aggrecan and sox9 was lower in the T5 vivo and 1+4 groups (p<0.01; Fig. 7D). At 9 weeks, comparing the samples 5+4, T9 vitro and T9 vivo, no significant differences were observed throughout the experimental times (Fig. 7E).

Differences in gene expression analyses (collagen 2, aggrecan, sox9, and collagen 1) of the engineered cartilage composites at different conditions:
Western blot analysis
Cell-fibrin composites and native cartilage samples were homogenized, and total protein content was purified in order to determine collagen 2 production by Western blot. Collagen 2 production was lower in the samples T0 (0±0.01), T1 vitro (0.028±0.101), T9 vitro (0.159±0.047), T1 vivo (0.354±0.04), and T5+4 (0.229±0.103) with regard to the native cartilage (1.551±0.084) (p<0.01). In the samples cultured in vitro, collagen 2 production was higher in those samples cultured for 5 weeks in vitro than in all the other samples (p<0.05; Fig. 8A). In those samples cultured in vivo, no differences were observed among the different groups (T1 vivo; T5 vivo; T9 vivo) (Fig. 8B). At 1 week, collagen 2 production was higher in those samples cultured in vivo (p<0.01; Fg.8C). At 5 and 9 weeks of culture, no differences were observed among the different groups (Fig. 8D, E).

Western blot analysis. Differences in collagen 2 levels in the engineered cartilage composites at different conditions:
Discussion
The results obtained have demonstrated that fibrin glue can support swine chondrocyte's growth in both in vitro and in vivo conditions. However, an extensive (9 weeks, see next) in vitro preculture of the engineered samples could represent a limit for the further development of the cell-fibrin composite after in vivo implantation. In fact, the identification of the ideal preculture time before the in vivo implantation has represented the main focus of this article. For this purpose, fresh swine chondrocytes were embedded in fibrin glue and cultured under basic conditions without biomechanical stimuli. The fibrin samples were cultured in vitro and in vivo for 1, 5, and 9 weeks; some of the samples were precultured in vitro for 1 and 5 weeks before being implanted in subcutaneous pouches of nude mice, in order to analyze the effect of the different degrees of maturation on the further development of the tissue-engineered cartilage during the next in vivo implantation. All experimental samples were analyzed by morphology (SAFRANIN-0 staining, immunohistochemistry for collagen type 2, and double immunofluorescence for collagen type 2 and 1), biochemistry (for DNA content and GAGs production), gene expression (for collagen type 2 and 1, aggrecan and sox9), and Western blot analysis for collagen 2 production. For comparison, all the analyses just mentioned were in parallel performed on samples of swine native articular cartilage as well. Several considerations could be drawn by the analysis and the comparison of the results obtained in the different experimental culture conditions of the cell-fibrin composites.
In vitro culture
Chondrocytes were able to survive in the fibrin glue during the in vitro culture as well as to produce components that are typical of the cartilage extracellular matrix as demonstrated by the presence of collagen 2 positivity (Figs. 2, 4, 5, and 8A); albeit, in all samples, the GAGs production appeared to be inferior to that of the native cartilage. However, the chondrocytes embedded in fibrin glue showed a gene expression pattern which resembled that of the native cartilage with only a reduction of collagen type 2 at 1 week of culture. A prolonged (5 weeks) in vitro culture induced a partial cell loss and composite degeneration, as demonstrated by histochemical (Fig. 2E, H) and immunohistochemical analyses (Fig. 4E, H) and confirmed by biochemical analysis (Fig. 6A). However, in these composites, the surviving cells were still able to maintain a differentiated phenotype, as demonstrated by the gene expression and Western blot analyses. The cell loss observed during time is probably a consequence of the basic and static condition of the in vitro culture, while the tissue degeneration is probably caused by fibrin degradation over time. These data lead to the conclusion that further stimuli are required to ameliorate chondrocytes survival in fibrin glue during the in vitro culture.
In vivo culture
The in vivo culture of chondrocytes in fibrin glue promoted a gradual maturation of the composites into a cartilage-like tissue, as demonstrated by the histochemical and immunohistochemical analyses of the samples (Figs. 2C, F, I, and 4C, F, I). With regard to native cartilage, cell-fibrin composites presented a reduced GAGs production but a higher cellularity, a similar level of collagen 2 production at 5 and 9 weeks, and a differentiated phenotype: only the samples cultured for 1 week in vivo showed an abnormal phenotype for aggrecan and sox9 compared with native cartilage, expressing very high levels of these genes. We are not able at present to find a reasonable explanation of this phenomenon. We can only speculate that chondrocytes, having the natural tendency of filling up the gaps, which appear after the fibrin glue degradation, probably respond by upregulating the specific gene expression. Further studies are needed, however, to clarify this point.
1 week culture: in vitro versus in vivo
The samples cultured for 1 week in vitro and in vivo were compared. The in vivo culture promoted higher cellularity and GAGs production than the in vitro culture (Fig. 6C); moreover, the samples cultured in vivo showed a better maintenance of the phenotype, as shown by higher levels of collagen 2, aggrecan, and sox9 gene expression (Fig. 7C). In addition, the in vivo culture promoted a higher deposition of collagen 2 in the matrix as demonstrated by the Western blot analysis (Fig. 8C). According to these results, we can conclude that the in vivo culture was able to support chondrocytes survival and activity in fibrin glue, leading to the formation of a mature cartilage-like composite.
5 weeks of culture: in vitro versus in vivo versus in vitro preculture (1+4)
The samples, which had been precultured for 1 week in vitro before implantation, showed high cellularity and GAGs production as confirmed by the SAFRANIN-0 histochemical staining (Fig. 2, T1+4); additionally, the histological appearance of these samples was similar in terms of cartilage matrix quality compared with those that had matured exclusively in vivo for the same period (T5 vivo) (Fig. 2, T1+4 vs. Fig. 2, T5 vivo). With regard to native cartilage, the samples precultured for 1 week showed higher cellularity, similar levels of collagen 2 production, and similar expression levels of cartilage genes but reduced GAGs production and GAGs/DNA ratio. The cellularity and GAGs production of the samples precultured in vitro for 1 week was higher when compared with those samples cultured in vitro for the same time period (5 weeks), while they were similar to the samples cultured in vivo for 5 weeks (Fig. 6D). Therefore, it seems that the in vitro-preculture of cell-fibrin samples can be maintained for 1 week before implantation without affecting cell survival, cell differentiation, and matrix production.
9 weeks of culture: in vitro versus in vivo versus in vitro preculture (5+4)
With regard to native cartilage, the samples precultured for 5 weeks showed higher cellularity, similar levels of cartilage-gene expression, but reduced GAGs production, GAGs/DNA ratio, and collagen 2 production. These samples precultured for 5 weeks in vitro also showed higher levels of cellularity and GAGs production compared with those samples cultured for 9 weeks in vitro (Fig. 6E). However, morphologically, several areas of degeneration were observed (Fig. 2, T5+4) as a result of the prolonged in vitro preculture. These data lead to the conclusion that the prolonged in vitro culture (5 weeks) is partially rescued by the following in vivo culture in terms of cellularity but not in terms of matrix maintenance. This result can be explained by the observation that the progressive fibrin degradation that occurred during the in vitro culture was not followed by a sufficient deposition of new matrix during the next few weeks of the in vivo culture. In particular, while GAGs production was completely rescued (Fig. 6E), collagen 2 was restricted to some areas (Fig. 4, T5+4), suggesting a rescue in matrix production during the in vivo culture, which was, however, not complete for collagen 2, leading to the persistence of some degenerating areas.
Several biomaterials have been tested for supporting cell-based therapies for the treatment of cartilage lesions; these biomaterials include collagenic membranes, 49 hyaluronic acid, 50 synthetics polymers made of carbon fibers, 51 or Dacron/Teflon. 52 Some of these biomaterials are currently used in the clinical practice for the treatment of cartilaginous defects with the association of fibrin glue. 20 All these materials were tested in vitro or in vivo, but an analysis of the effect of the degree of in vitro maturation on the further in vivo development of the engineered cartilage was never studied. However, this is a key point in the development of tissue-engineered substitutes, as the in vitro refinement often precedes the in vivo implantation of the constructs. In fact, the in vitro preculture promotes a preliminary maturation of the cellular composites so that it can be easily handled during the surgical procedures and, therefore, immediately restore the cartilage surface of the damaged areas, although with a morphologically, biochemically, and mechanically still immature tissue.
In order to test this aspect, we have chosen the nude mice model for the in vivo maturation of the engineered cartilage. This heterotopic environment has supported the survival and activity of the fibrin-embedded chondrocytes, which have led to the formation of a structured cartilage-like tissue. However, the biochemical analysis has shown that the GAGs production was still inferior with regard to the native cartilage even at the longest time point, probably as a consequence of the lack of the biological and biomechanical stimuli, which are usually present in the joint.
Another limitation of this model is represented by the presence of a highly vascularized environment that could have influenced the signals for cell proliferation and differentiation: the interference of the mouse cells in the cell-fibrin composites was excluded in this work by the use of antibodies specific for pig collagen 2 and 1 (Figs. 4 and 5) and of primers specific for pig collagen 2, sox 9, aggrecan, and collagen 1 in real-time PCR analyses (Fig. 7). However, this simple model, although based on freshly isolated chondrocytes, which are probably not clinically relevant, is indeed well recognized in the scientific field as a valid tool for addressing specific questions,34,37,38 such as the need and extension of an in vitro preculture for tissue-engineered composites. In the present study, we have clearly shown the limit of an extensive in vitro standard culture of engineered composites based on freshly isolated chondrocytes. On the other hand, we were also able to show the potential of the embedded chondrocytes in maintaining the vitality and regaining the synthetic capacity when precultured for a limited time before in vivo implantation.
In conclusion, preculturing the samples for 1 week before the implantation allowed the stabilization of the fibrin glue and the subsequent maturation of the composite in vivo without affecting the cellularity, the cell activity, and the matrix morphology, while the prolongation of the preculture to 5 weeks caused a morphological sample degeneration that could not be rescued in vivo. According to these results, the optimal time recommended for the maturation of the cell-fibrin composites is 1 week. Further studies of this chondral swine model will focus on the mechanical analysis of the engineered samples, especially when compared with the native cartilage, and also on the refinement of this in vitro phase by the use of specific growth factors 53 during the preimplantation culture. Future studies will also possibly use an orthotopic model, obtained by implanting the engineered tissue in a cartilage lesion induced in the articular environment of large animals. Finally, the use of chondrocytes expanded in a monolayer culture would also be appropriate, in order to mimic the clinical application of this repair model.
Footnotes
Acknowledgments
The authors wish to thank Mr. Paolo Stortini for his excellent technical support and Mrs. Louise Whelan for revising the English language of this article. The authors gratefully acknowledge Dr. Celeste Scotti for his advice on research design. This research was supported by grants from the CARIPLO foundation (2008–2010) to G.M. Peretti, C. Domeneghini, and C. Sosio.
Disclosure Statement
No competing financial interests exist. No conflict of interest exists for any of the authors of the present article.