
Abstract
Osteogenic differentiation of human mesenchymal stromal cells (hMSCs) may potentially be used in cell-based bone tissue-engineering applications to enhance the bone-forming potential of these cells. Osteogenic differentiation and adipogenic differentiation are thought to be mutually exclusive, and although several signaling pathways and cues that induce osteogenic or adipogenic differentiation, respectively, have been identified, there is no general consensus on how to optimally differentiate hMSCs into the osteogenic lineage. Some pathways have also been reported to be involved in both adipogenic and osteogenic differentiation, as for example, the protein kinase A (PKA) pathway, and the aim of this study was to investigate the role of cAMP/PKA signaling in differentiation of hMSCs in more detail. We show that activation of this pathway with dibutyryl-cAMP results in enhanced alkaline phosphatase expression, whereas another cAMP analog induces adipogenesis in long-term mineralization cultures. Adipogenic differentiation, induced by 8-bromo-cAMP, was accompanied by stronger PKA activity and higher expression of cAMP-responsive genes, suggesting that stronger activation correlates with adipogenic differentiation. In addition, a whole-genome expression analysis showed an increase in expression of adipogenic genes in 8-br-cAMP-treated cells. Furthermore, by means of quantitative polymerase chain reaction, we show differences in peroxisome proliferator-activated receptor-γ activation, either alone or in combination with dexamethasone, thus demonstrating differential effects of the PKA pathway, most likely depending on its mode of activation.
Introduction
Both osteogenesis and adipogenesis are induced and regulated by a number of pathways and transcription factors. While osteogenesis is regulated by runt-related transcription factor-2 (Runx-2) and osterix (osx), 15 adipogenesis is controlled by peroxisome proliferator-activated receptor-γ (PPARγ). 16 Although an inverse correlation between adipogenic and osteogenic differentiation of hMSCs was suggested, various pathways activated by external stimuli that induce differentiation seem to play dual roles. For example, there are indications that BMP signaling, one of the main inducers of osteogenic differentiation in hMSCs, is also involved in adipogenic differentiation, depending on the dose and the type of receptor activated. 17
Several studies have demonstrated the involvement of the cAMP/protein kinase A (PKA) pathway in osteogenesis of different cell types. In MG-63 cells, it was demonstrated that high glucose levels inhibit osteogenic differentiation via increased levels of intracellular cAMP and phosphorylated ERK ½. 18 G-protein-coupled receptor ligands such as melatonin, prostaglandin E2 (PGE2), and parathyroid hormone were demonstrated to increase osteogenic differentiation of MC3T3 cells, rat osteoblast-like osteosarcoma cells, 19 calvaria osteoblast-like cells, 20 and human osteoblasts 21 in vitro, and PKA was shown to activate Runx2 in the rat osteosarcoma cell line UMR 106-01 22 as well as the osteocalcin promoter in human osteoblast-like cell lines via cAMP and forskolin. 23 In contrast, numerous studies have implicated this pathway in adipogenic differentiation. For example, Zhao et al. performed an siRNA screen on hMSCs and found that knockdown of GNAS, encoding the G protein α-subunit (Gsα), enhanced osteogenic differentiation. They demonstrated that treatment with forskolin inhibits osteogenic differentiation and treatment with dibutyryl-cAMP (db-cAMP), in combination with high concentrations of dexamethasone (10−7 M), enhanced adipogenic differentiation. 24 Similarly, Yang et al. demonstrated enhanced adipogenesis and adipogenic gene expression upon addition of PKA stimulators to MSCs in an adipogenic induction medium. 25 In contrast, in our lab, we have demonstrated that the same compound in the absence of dexamethasone can enhance osteogenic differentiation in vitro as well as improve the in vivo bone formation capacity of these cells. 8 In addition, we showed that intermittent exposure of hMSCs to db-cAMP decreased alkaline phosphatase (ALP) expression, which points to a more complicated role for the cAMP/PKA pathway in the balance between osteogenic and adipogenic differentiation. 26
Here, we used two different cAMP analogs [db-cAMP and 8-bromo-cAMP (8-br-cAMP)], and investigated their effects on short- and long-term cultures of hMSCs as well as their downstream activation patterns, to examine the role of PKA in osteogenic versus adipogenic differentiation in more detail.
Materials and Methods
Isolation and culture of hMSCs
Bone marrow aspirates were obtained from donors after obtaining written informed consent. hMSCs were isolated 27 and proliferated as described previously. 28 Briefly, aspirates were resuspended using 20G needles, plated at a density of 5.105 cells/cm2, and cultured in an hMSC proliferation medium, consisting of an α-minimal essential medium (α-MEM; Life Technologies), 10% fetal bovine serum (FBS; Cambrex Bio sciences, Verviers), 0.2 mM ascorbic acid 2-phosphate (ASAP; Sigma Aldrich), 2 mM L-glutamine (Invitrogen, Life Technologies), 100 U/mL penicillin (Life Technologies), 10 μg/mL streptomycin (Life Technologies), and 1 ng/mL basic fibroblast growth factor (bFGF; Instruchemie). Cells were grown at 37°C, in a humid atmosphere with 5% CO2. The medium was refreshed twice a week, and cells were used for further subculturing or cryopreservation upon reaching near confluence. The hMSC basic medium was composed of a proliferation medium without bFGF, and the osteogenic medium was composed of a basic medium supplemented with 10−8 M dexamethasone (Sigma), and the mineralization medium was composed of a basic medium supplemented with 10−8 M dexamethasone and 0.01 M β-glycerophosphate (BGP; Sigma Aldrich). The adipogenic medium was composed of the DMEM (Life Technologies), 10% FBS, 0.5 mM isobutylmethylxanthine (IBMX; Sigma), 1 μM dexamethasone, 10 μM insulin (both from Sigma), and 200 μM indomethacin (Sigma).
ALP expression
To assess ALP expression, hMSCs were seeded in triplicate at 5000 cells/cm2 in six-well plates. Cells were kept overnight in a proliferation medium to attach, after which the medium was replaced with a basic medium or a basic medium supplemented with 1 mM db-cAMP or 8-br-cAMP (both from Sigma, stock solutions 20 mM in water). As a negative control, cells were cultured in the basic medium. After 5 days, cells were trypsinized (0.25% Trypsin; Invitrogen life technologies), and 1 mL of blocking buffer (PBS with 5% bovine serum albumin [BSA; Sigma] and 0.1% sodium azide [Sigma]) was added and incubated for 30 min to prevent a-specific binding. After centrifugation and removal of the supernatant, cells were incubated with 50 μL of primary antibody (anti-ALP, B4-78 [Developmental Studies Hybridoma Bank, University of Iowa]) and diluted 1:50 in a wash buffer (PBS with 1% BSA and 0.05% sodium azide) for 1 h. For each condition, a part of the cells was used for the isotype control to determine a-specific binding. These cells were incubated with IGg-1 (BD bioscience, diluted 1:50 in a wash buffer), a randomly binding antibody. Subsequently, cells were washed twice with 500 μL of wash buffer. Next, 100 μL of secondary antibody (rat anti-mouse IgG1-PE; BD bioscience), diluted 1:100 in a wash buffer, was added. After incubation for 30 min, cells were washed again three times. Ten microliters of Viaprobe (Pharmingen) was added for live/dead staining, and ALP expression was determined using an FACSCalibur measuring 10,000 events (Becton Dickinson, Immunocytometry systems). FACS data were analyzed using CellQuest software. Cells with the right size (forward scatter) and granularity (side scatter) were gated, and debris and dead cells were excluded from the analysis. The percentage of ALP-positive cells was determined, with a minimum of 7500 gated events. Experiments were repeated with cells from five different donors.
Gene expression analysis
The hMSCs were seeded in triplicate at 5000 cells/cm2 in six-well plates and kept overnight in a proliferation medium to attach. Then, the medium was replaced with a basic medium containing 1 mM db-cAMP or 8-br-cAMP. Cells were lyzed for RNA isolation after 3, 5, or 10 days. For dexamethasone experiments, either db-cAMP or 8-br-cAMP, in combination with various concentrations of dexamethasone (10−8 M, 10−7 M, or 10−6 M), was added. As a control, cells were cultured in the basic medium. After 5 days, RNA was isolated using a Bioke RNA II nucleospin RNA isolation kit (Machery Nagel), and RNA concentrations were measured using an ND100 spectrophotometer (Nanodrop technologies). cDNA was synthesized from 250 ng of RNA, using iScript (BioRad), according to the manufacturer's protocol. For quantitative polymerase chain reaction (qPCR), a master mix containing distilled water, forward primer, reverse primer (Sigma Genosys), BSA, and SYBR green I mix (all from Invitrogen) was prepared, and real-time qPCR was performed using a Light-Cycler (Roche). Light-Cycler data were analyzed using the fit-points method of Light-Cycler software. The baseline was set at the lower log-linear part above the baseline noise, and the crossing temperature (Ct value) was determined. Ct values were normalized to the 18S housekeeping gene, and ΔCt (Ct, control–Ct, sample) was used to calculate the upregulation in gene expression. 29 Primer sequences are listed in Table 1.
Mineralization/adipogenesis
hMSCs were seeded at 5000 cells/cm2 in 12-well plates in triplicate and kept in a proliferation medium overnight to attach to the surface. Then, the medium was replaced with a mineralization medium (low dexamethasone; 10−8 M dexamethasone) or a mineralization medium with a high concentration of dexamethasone (10−6 M), with or without 1 mM db-cAMP or 8-br-cAMP (only during the first 5 days). As controls, cells were cultured in a basic medium supplemented with BGP or in an adipogenic medium. After 5 days, the medium was replaced with a fresh medium, but without cAMP analogs. After 28 days, the medium was removed, and cells were washed with PBS twice. About 0.5 mL of 0.5N hydrochloric acid was added and incubated for at least 4 h at room temperature on an orbital shaker. The supernatant was collected, and the amount of calcium was quantitatively determined, using a calcium assay kit (Sigma diagnostics, 587A), according to the manufacturer's protocol. The absorbance was measured using an ELx808 microplate reader (Biotek instruments). As a positive control for adipogenic cultures, 80% confluent cells were cultured in the adipogenic medium. For adipogenic stainings, cells were fixed in formol (3.7% formalin plus 1g/100 mL CaCl2.2H2O; Sigma), rinsed with water, and incubated with 60% isopropanol (Sigma) for 5 min. Then, the cultures were incubated with a freshly filtered Oil Red O solution (stock solution: 500 mg Oil Red [Sigma], 99 mL isopropanol, 1 mL water; working solution: 42 mL stock + 28 mL water). For quantification, the stain was extracted by incubating with 4% Igepal (Sigma) in isopropanol for 15 min on an orbital shaker at room temperature. About 100 μL of the solution was used to measure the absorbance at 520 nm using an ELx808 microplate reader (Biotek instruments).
PKA activity
hMSCs were seeded at 5000 cells/cm2 in six-well plates in triplicate and kept in a proliferation medium overnight to attach to the surface. The next day, either a basic medium or a basic medium supplemented with 1 mM db-cAMP or 8-br-cAMP was added and incubated for denoted time periods. Then, cells were lyzed, and PKA activity was assayed using the nonradioactive PepTag assay (Promega), according to the manufacturer's protocol. Briefly, cells were pelleted and lyzed in an extraction buffer (20 mM Tris [Sigma], pH 7.5, 5.5 mM EDTA [Sigma], 1 mM PMSF [Roche], and 10 mg/mL aprotinin [Roche]). A reaction mixture containing the lysate, the PKA-specific peptide substrate Peptag A1 (Kemptide), water, and peptide protection solution was prepared, which was incubated for 2 min at 30°C, and subsequently for 30 min at room temperature. The reaction was stopped by heat treatment at 95°C for 10 min, after which phosphorylated and unphosphorylated Peptag peptides were separated by gel electrophoresis. Bands were excised, solubilized in a gel solubilization solution, and the amount of peptide was quantified by measuring the fluorescence intensity of the solution with the excitation wavelength set at 540 nm and the emission wavelength set at 592 nm (Tecan). Liquefied agarose was used as a blank, and data are expressed relative to the PKA activity in a basic medium.
Whole-genome expression analysis
hMSCs were seeded in 12-well plates at 5000 cells/cm2 and allowed to attach for 10–15 h in a proliferation medium. The next day, either a basic medium or a basic medium supplemented with 1 mM db-cAMP or 8-br-cAMP was added. After 6 or 72 h of treatment, cells were lyzed directly from the plate, and RNA was isolated as described above. Then, from 500 ng of RNA, cRNA was synthesized using the Illumina TotalPrep RNA amplification Kit (Ambion/Life Technologies), according to the manufacturer's protocol, and RNA and cRNA quality was verified on Bioanalyzer 2100 (Agilent). Microarrays were performed using Illumina HT-12 v3 expression Beadchips (Illumina), according to the manufacturer's protocol. Briefly, 750 ng of cRNA was hybridized on the array overnight, after which the array was washed and blocked. Then, by addition of streptavidin Cy-3 (Illumina), a fluorescent signal was developed. Arrays were scanned on an Illumina iScan, and raw intensity values were background corrected in Genomestudio (Illumina). Further data processing and statistical testing were performed using R and Bioconductor statistical software (www.bioconductor.org/). The probe-level raw intensity values were quantile normalized and transformed using variance stabilization. A linear modeling approach with empirical Bayesian methods, as implemented in the Limma package, 30 was applied for the differential expression analysis of the resulting probe-level expression values. p-values were corrected for multiple testing using the Benjamini and Hochberg method 31 , and differentially expressed genes were ranked on log2-fold-change values.
Statistics
All experiments were performed in triplicates. Data were analyzed in SPSS (PASW statistics) using a one-way analysis of variance followed by the Tukey's multiple comparison test (p<0.05 or p<0.01). The donor number and passage for each experiment are listed in Table 2.
ALP, alkaline phosphatase; qPCR, quantitative polymerase chain reaction; PKA, protein kinase A.
Results
db-cAMP induces ALP expression to a higher extent than 8-br-cAMP
To investigate the effect of both cAMP analogs on osteogenic differentiation, we examined expression levels of the early osteogenic marker ALP, in hMSCs from five different donors after treatment with these compounds. As demonstrated before, db-cAMP increases the expression of this marker by approximately two- to threefold, whereas 8-br-cAMP does induce ALP expression in some donors, but always to a lower extent than db-cAMP, as depicted in Figure 1A.
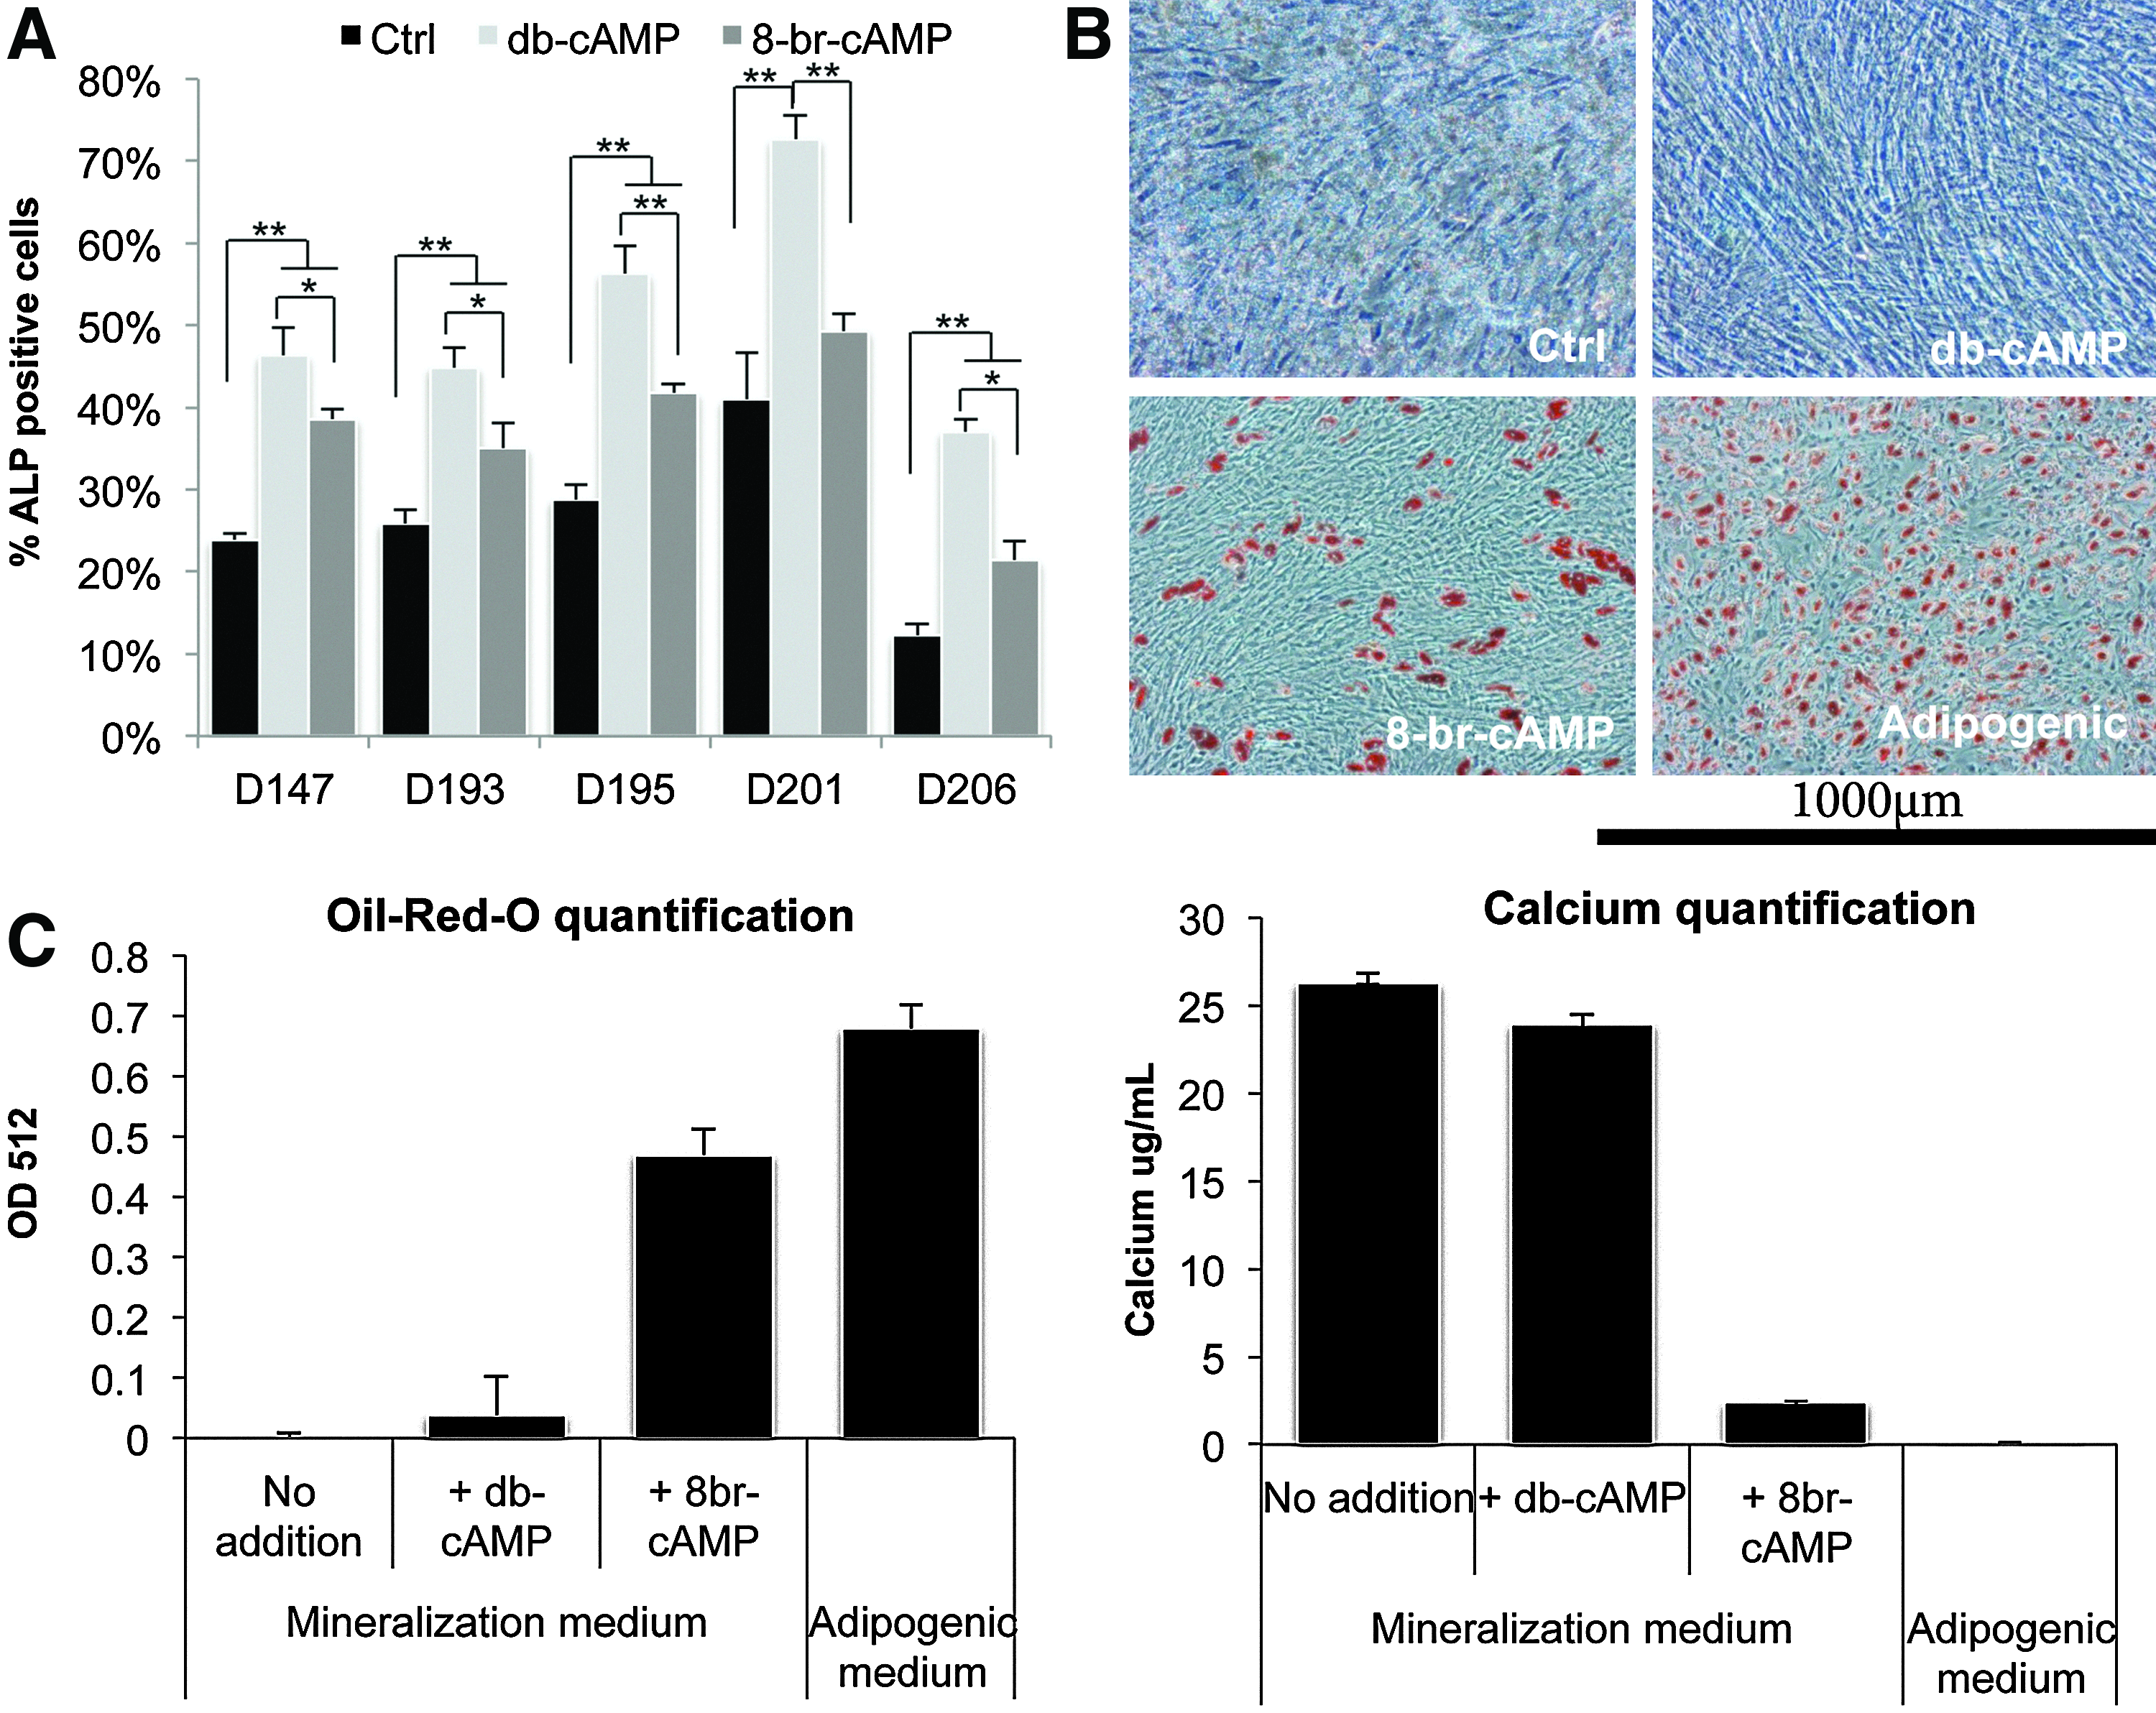
db-cAMP and 8-br-cAMP have distinct effects on differentiation of human mesenchymal stromal cells (hMSCs).
8-br-cAMP induces adipogenic differentiation
To investigate the effects of 8-br-cAMP on differentiation of hMSCs in more detail, a long-term culture assay was performed. hMSCs from 1 donor were cultured in a mineralization medium supplemented with either of the two cAMP analogs for 5 days, after which the cells were kept in the mineralization medium for three more weeks. In contrast with previous findings, we did not find increased calcium deposition after treatment of hMSCs with db-cAMP in the donor used, even though ALP expression levels increased upon treatment with db-cAMP. As demonstrated before using dexamethasone, hMSCs from different donors vary in their response to osteogenic stimuli, 32 which is in line with our findings here. Surprisingly, however, addition of 8-br-cAMP to the mineralization medium resulted in the formation of lipid droplets (Fig. 1B), an observation that was confirmed using hMSCs from four other donors (data not shown). Staining of lipids with Oil Red O and subsequent quantification showed that treatment with 8-br-cAMP resulted in almost 60% of the lipid amount in adipogenic control cultures (Fig. 1C), whereas db-cAMP did not induce any lipid formation. Although lipids and calcium nodules were observed in the same cultures, compared to mineralization or db-cAMP cultures, calcium deposition was severely inhibited by 8-br-cAMP-treatment.
8-br-cAMP induces expression of PPARγ
We then examined the gene expression profile of the two transcription factors controlling osteogenic and adipogenic differentiation, Runx2 and PPARγ, respectively, after treatment with both cAMP analogs. Figure 2 shows expression levels of these genes in hMSCs of several donors after 3, 5, and 10 days of treatment. Although for some donors, Runx2 expression was slightly higher after treatment with 8-br-cAMP, in general, there was no difference between the two analogs. For PPARγ, however, there was a clear trend toward higher expression in 8-br-cAMP-treated cells, especially during early timepoints, where PPARγ expression was induced by 8-br-cAMP treatment in five out of seven donors. Since dexamethasone is known to have distinct effects on differentiation of hMSCs, depending on its concentration (high or low concentrations induce adipogenic or osteogenic differentiation, respectively), we combined 8-br-cAMP treatment with various concentrations of dexamethasone in the mineralization medium. As shown in Figure 3A, the amounts of lipid droplets gradually increased with increasing concentrations of dexamethasone, with 10−6 M resulting in the highest amounts of lipid droplets. In contrast, no lipids were present in the absence of cAMP, and hardly any lipids were present in cultures with both db-cAMP and 10−6 M dexamethasone. In addition, gene expression profiling of Runx2 and PPARγ also demonstrated that, whereas in the absence of dexamethasone, neither cAMP analogs affected expression of these genes (see Fig. 3B), in the presence of dexamethasone, 8-br-cAMP significantly increased expression of PPARγ compared to db-cAMP. Expression of Runx2 was decreased with higher concentrations of dexamethasone, and even further by 8-br-cAMP, but not by db-cAMP.
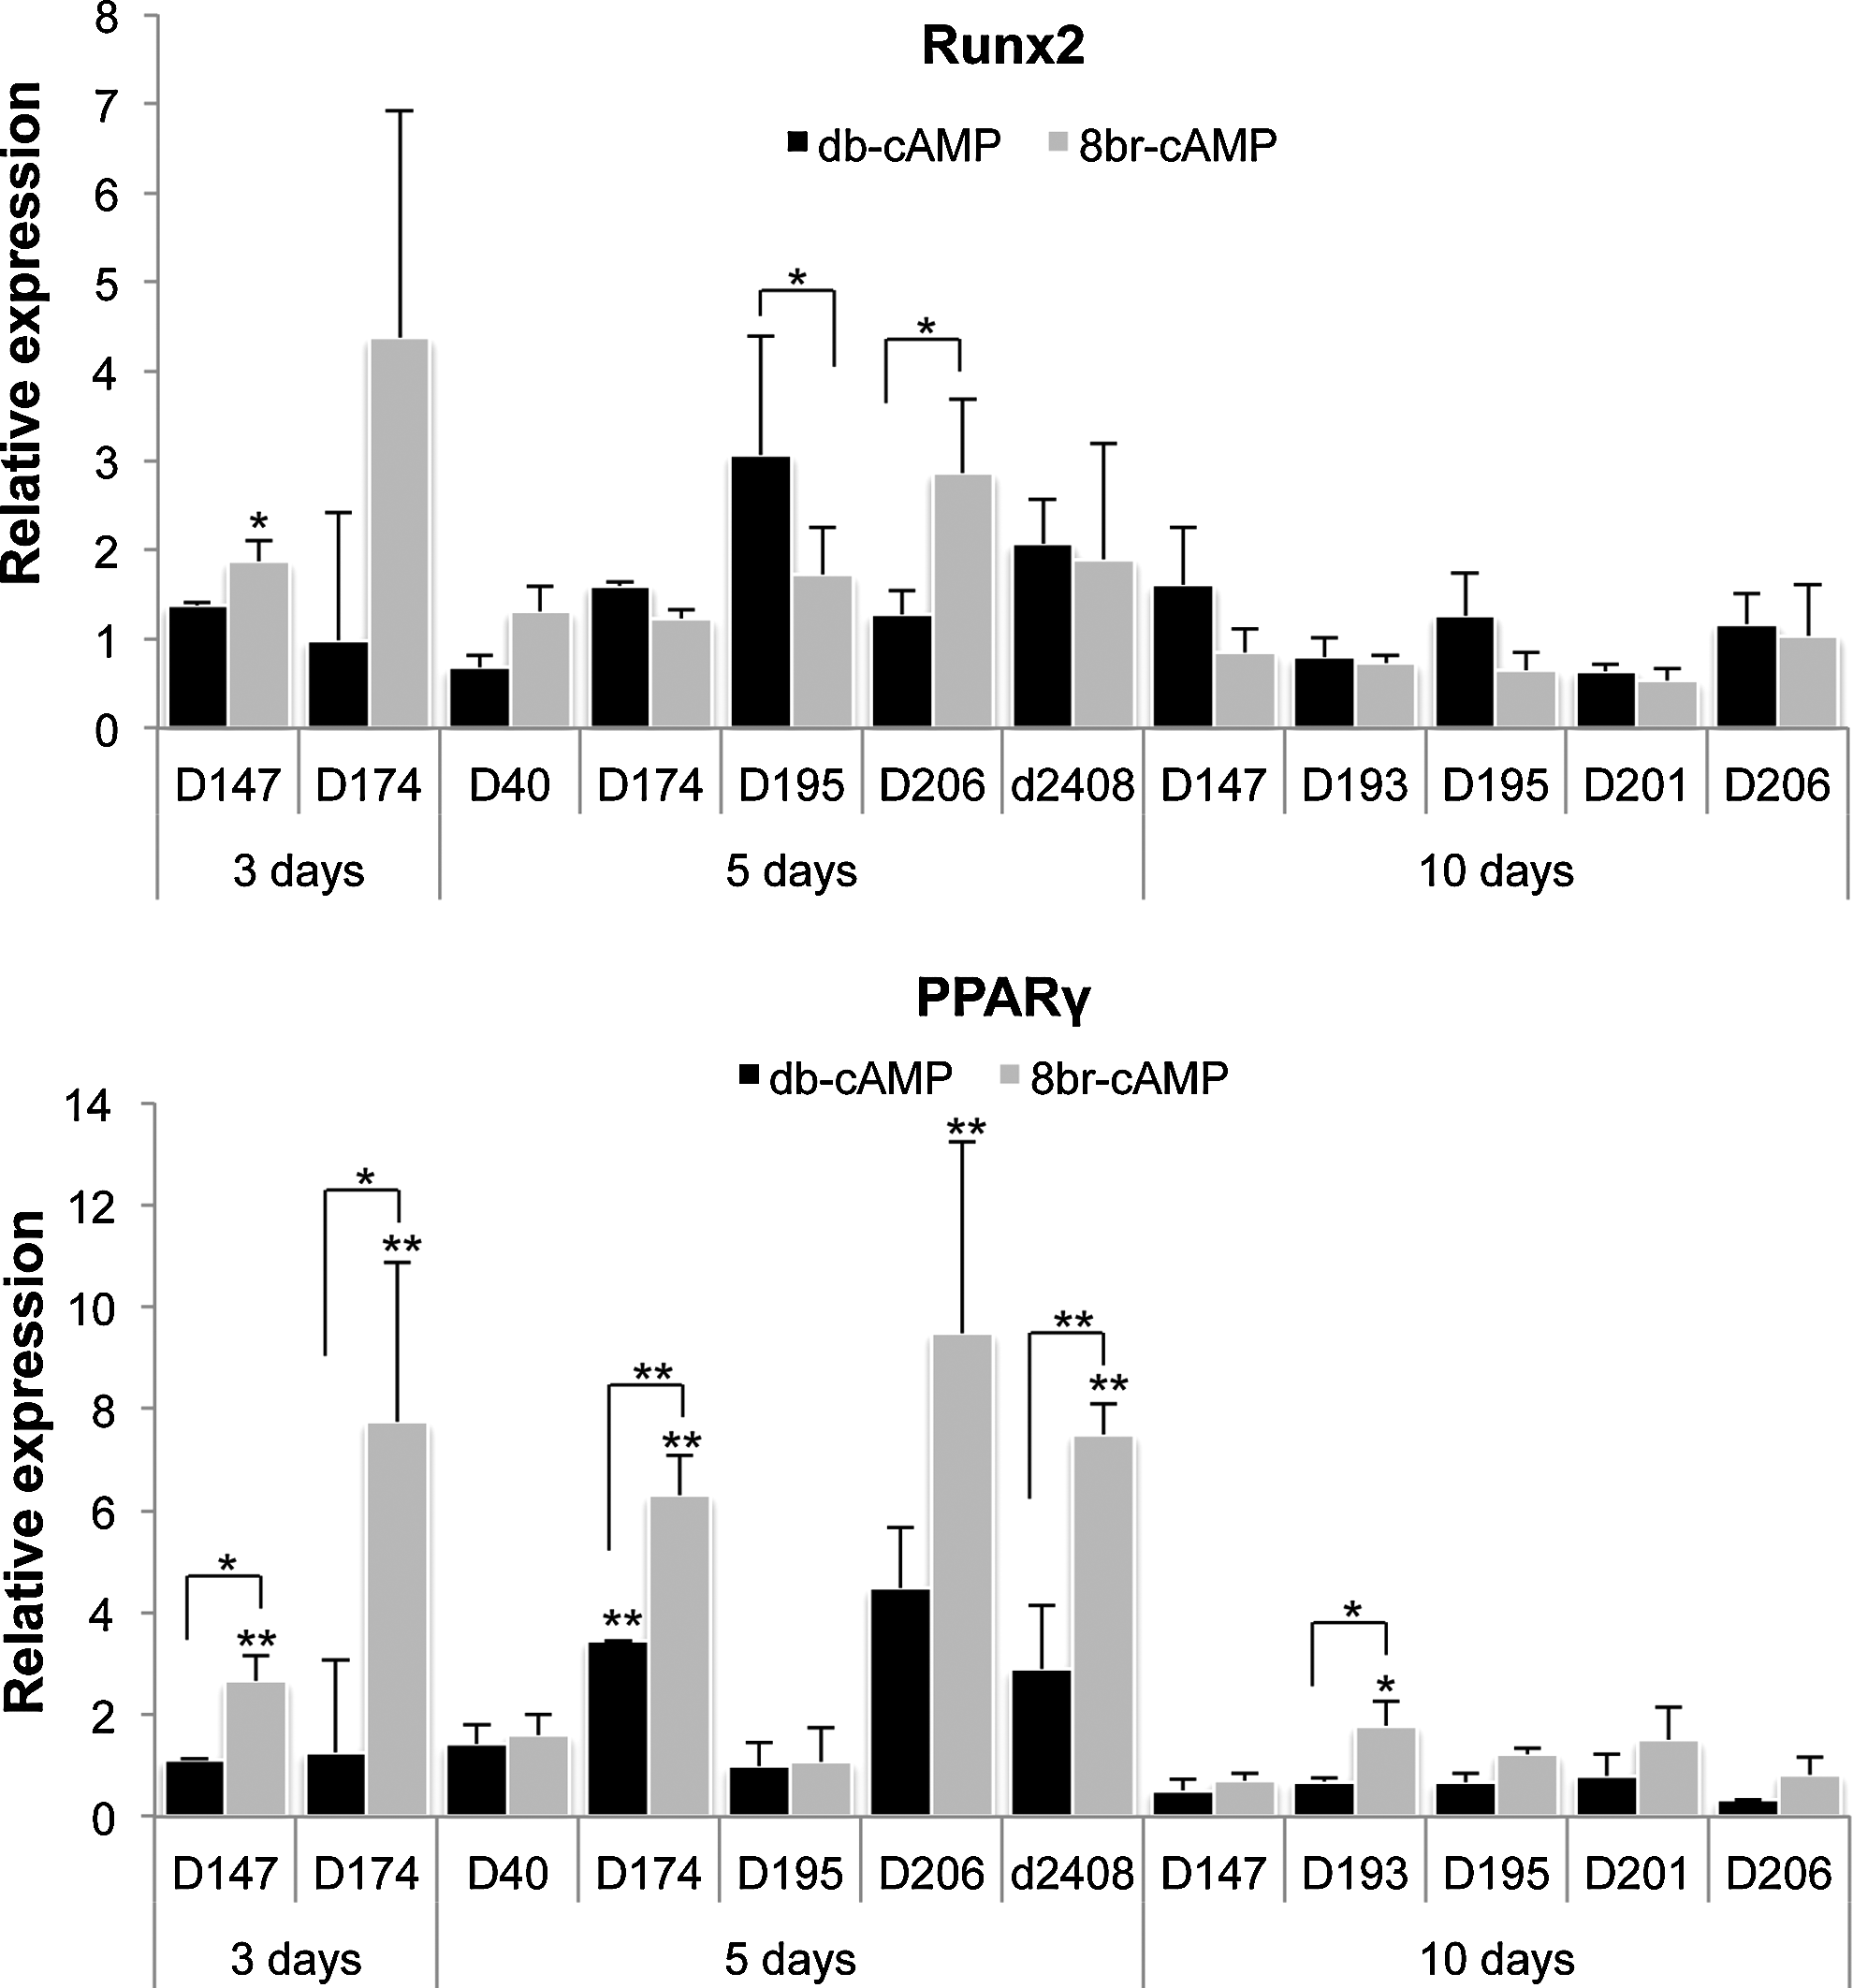
8-br-cAMP induces expression of peroxisome proliferator-activated receptor-γ (PPARγ). Treatment of hMSCs with db- and 8-br-cAMP for 3, 5, and 10 days did not result in significant changes in Runx2 expression. Expression of PPARγ, however, showed a clear trend toward higher expression in 8-br-cAMP-treated cultures. Data are depicted as relative gene expression in either 8-br-cAMP- or db-cAMP-treated cells, relative to cells in the basic medium. *p<0.05; **p<0.01.
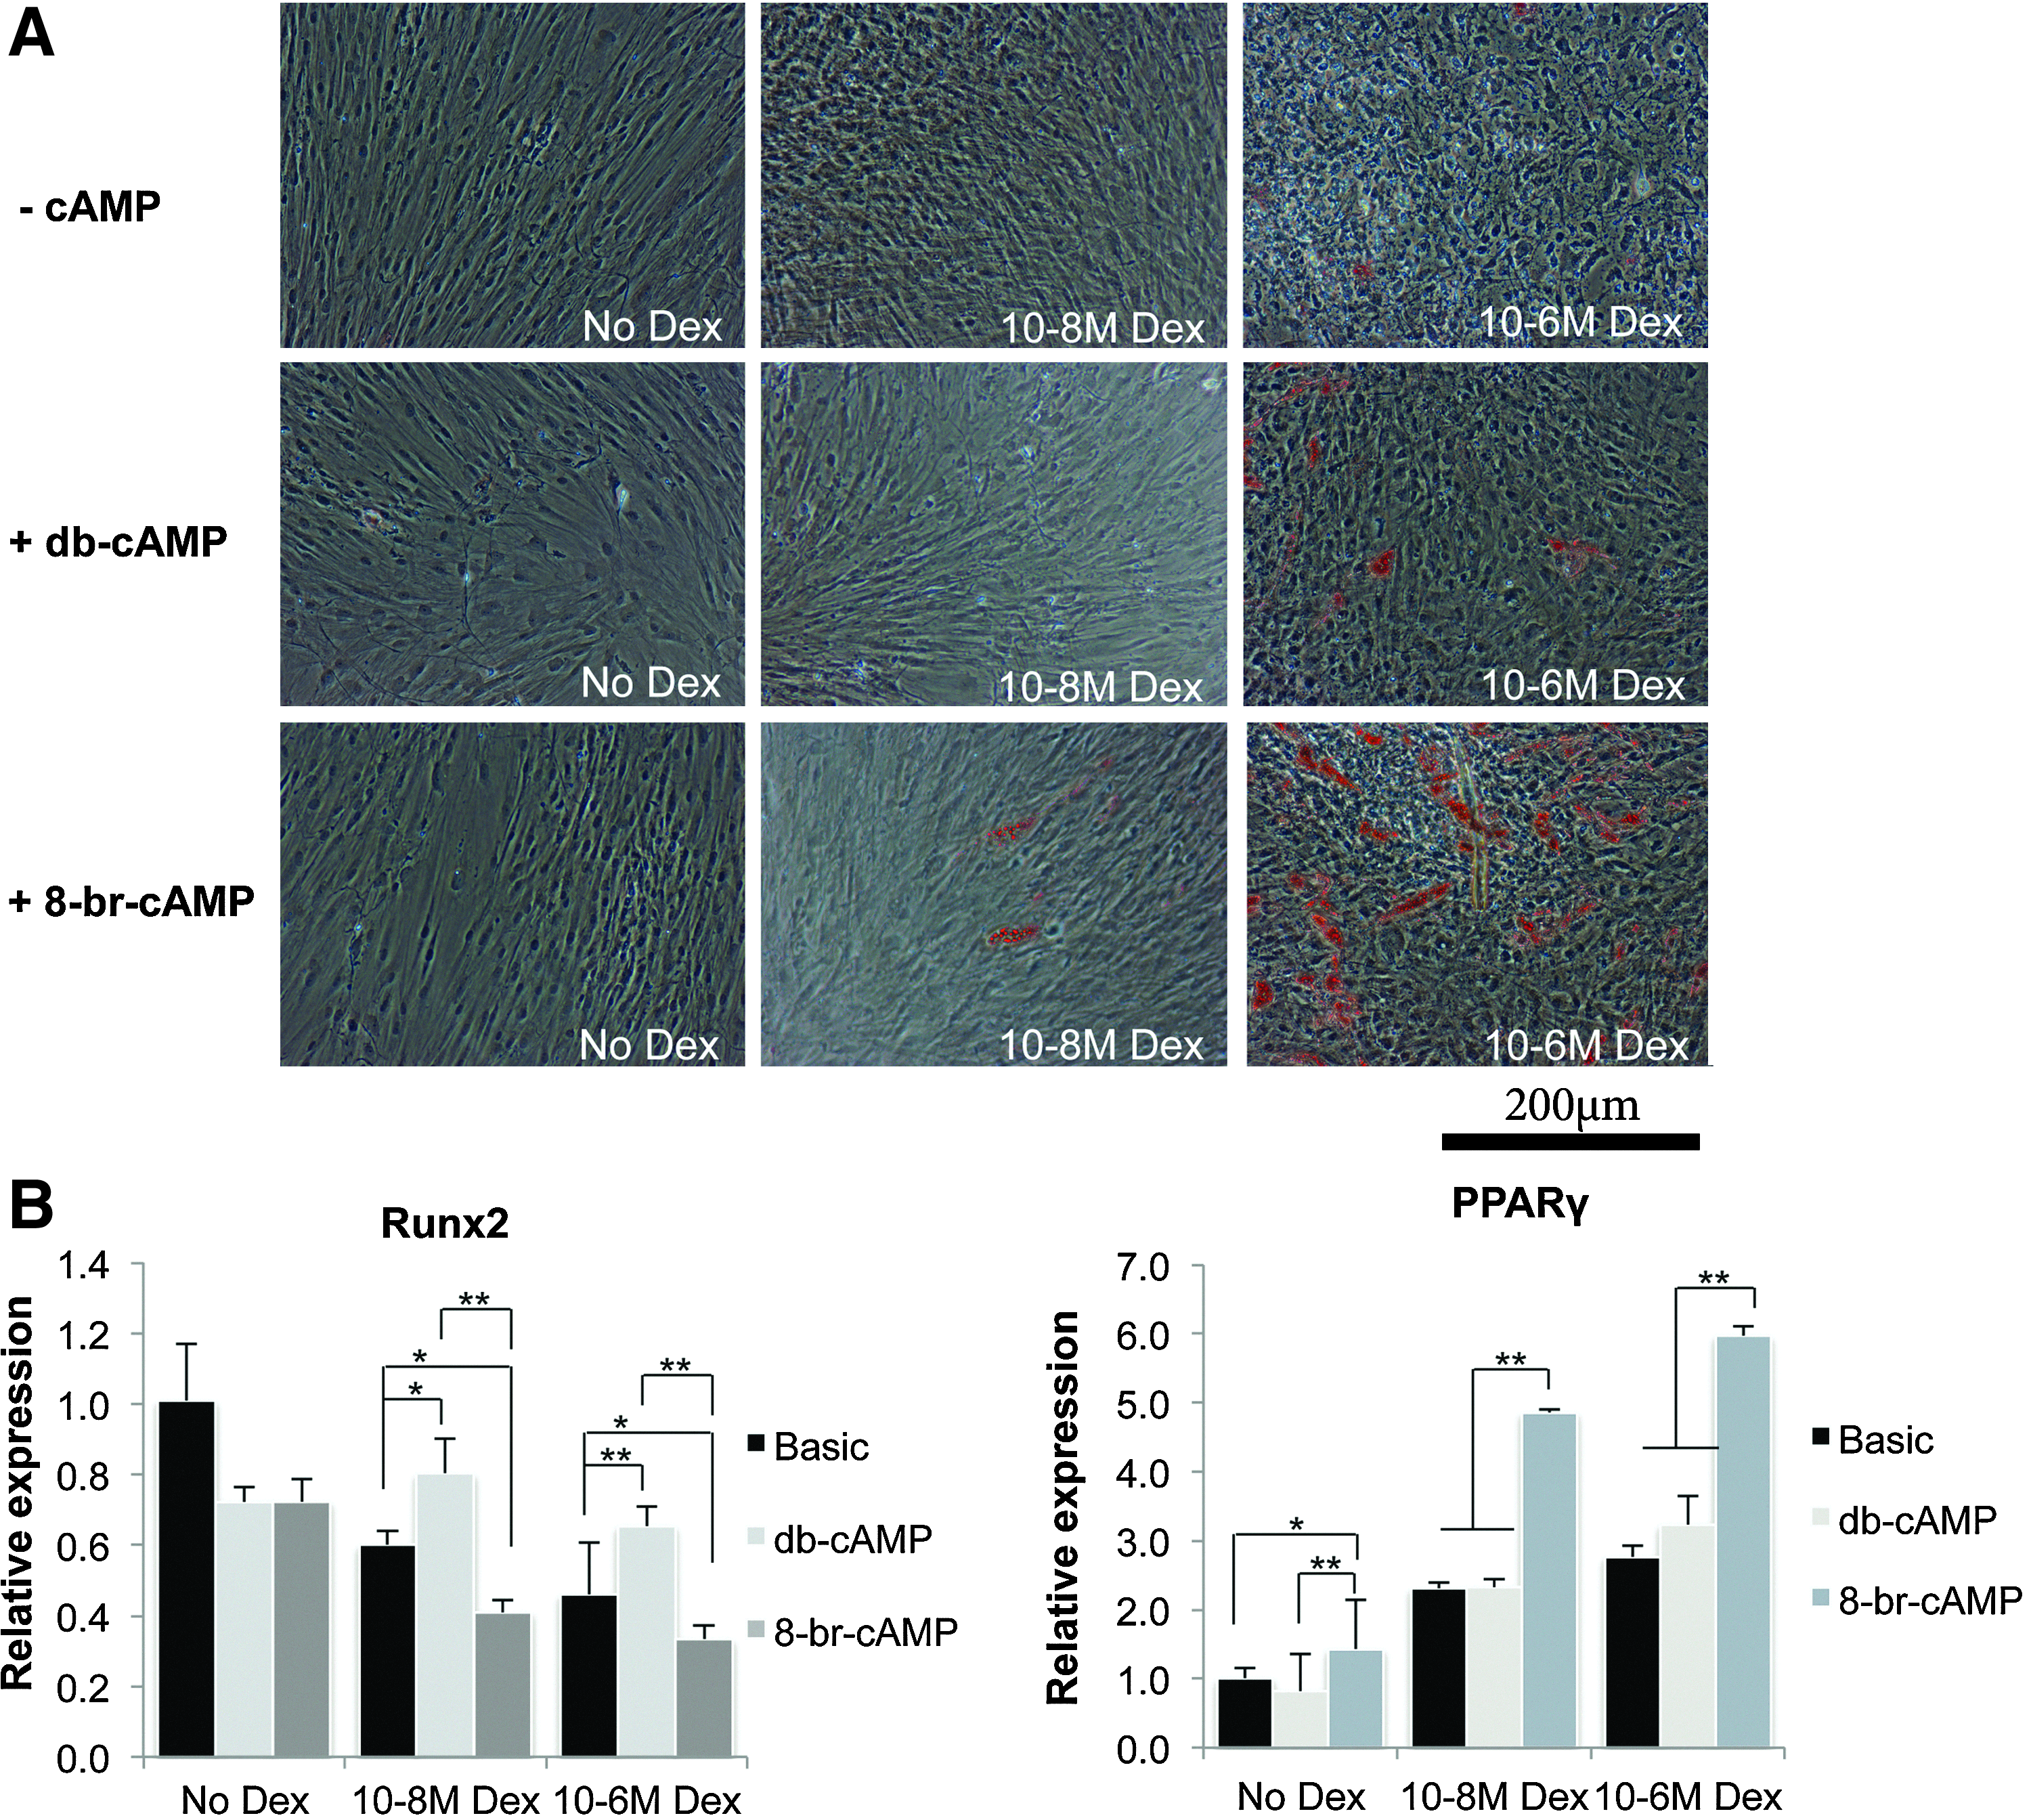
8-br-cAMP induces adipogenesis synergistically with dexamethasone.
8-br-cAMP is more potent in activating PKA- and cAMP-responsive genes
To elucidate if both analogs differentially activate downstream targets, we examined PKA activity after 2, 8, 24, and 48 h of stimulation. Figure 4A demonstrates that although there was no difference in activity after 2 h, after 8, 24, and 48 h, PKA activity was higher after stimulation with 8-br-cAMP, which was significant after 8 and 48 h. To explore this further, hMSCs were cultured in a basic medium or a basic medium supplemented with either 8-br-cAMP or db-cAMP for 6 h, after which we performed whole-genome expression profiling. Using the lists of cAMP-responsive genes as described by Zhang et al., 33 we examined the expression of cAMP-responsive genes in both db-cAMP- and 8-br-cAMP-treated hMSCs. Figure 4B demonstrates the fold change in expression in either 8-br-cAMP- or db-cAMP-treated cells, relative to cells in the basic medium. Of 154 analyzed genes, the expression of 21 genes was increased by treatment with 8-br-cAMP, whereas the expression of 2 genes was decreased. On the other hand, treatment with db-cAMP resulted in increased expression of 13 genes and decreased expression of 9 genes. Interestingly, of the 37 genes with altered expression, 26 showed higher expression in 8-br-cAMP-treated hMSCs, whereas only 11 genes were highly expressed after treatment with db-cAMP. This suggests that 8-br-cAMP more strongly induces transcription of the downstream PKA/CREB target genes.

db-cAMP and 8-br-cAMP have distinct activation mechanisms.
8-br-cAMP induces adipogenic gene expression
To provide more insight in the different mechanisms of db-cAMP and 8-br-cAMP, we analyzed the global gene expression profile of hMSCs treated with both compounds for either 6 or 72 h. Figure 5 shows the relative gene expression in 8-br-cAMP cultures, compared to db-cAMP cultures. In line with our long-term culture experiments, the expression of several adipogenic genes was higher in cells treated with 8-br-cAMP than db-cAMP after 6 h, and expression of these genes increased even further after 72 h. After 6 h of treatment, expression of several osteogenic genes was also increased in 8-br-cAMP cultures, but after 72 h, expression of most of these genes had declined and was instead increased in db-cAMP cultures. Functions of these genes are listed in Table 3. Also of interest was the large number of Wnt-related genes with differential expression. After 6 h, positive regulators of Wnt were mainly decreased in 8-br-cAMP cultures, whereas after 72 h, the expression of both stimulators and inhibitors of the Wnt pathway was higher in 8-br-cAMP cultures, as well as two Wnt target genes, WISP1 and WISP2. We and others have demonstrated that activation of Wnt signaling in hMSCs inhibits osteogenic differentiation,34–37 and the high number of Wnt-regulated genes in 8-br-cAMP possibly negatively correlates with osteogenic differentiation. Insulin-like growth factor (IGF) signaling and in particular the IGF-binding proteins (IGFBPs) were also differentially expressed between the two types of cultures. As depicted in Figure 5, after 6 h, expression of IGF2BP3 and IGFBP5 was higher in 8-br-cAMP cultures, whereas expression of IGFBP2, 3, and 7 was lower. After 72 h, expression of all IGFBPs was higher in 8-br-cAMP cultures. Generally, disruptions in IGF signaling result in reduced adipogenic differentiation, and most IGFBPs were shown to be present at moderate to high levels in fat tissue and to inhibit IGF- or insulin-induced adipogenesis. 38
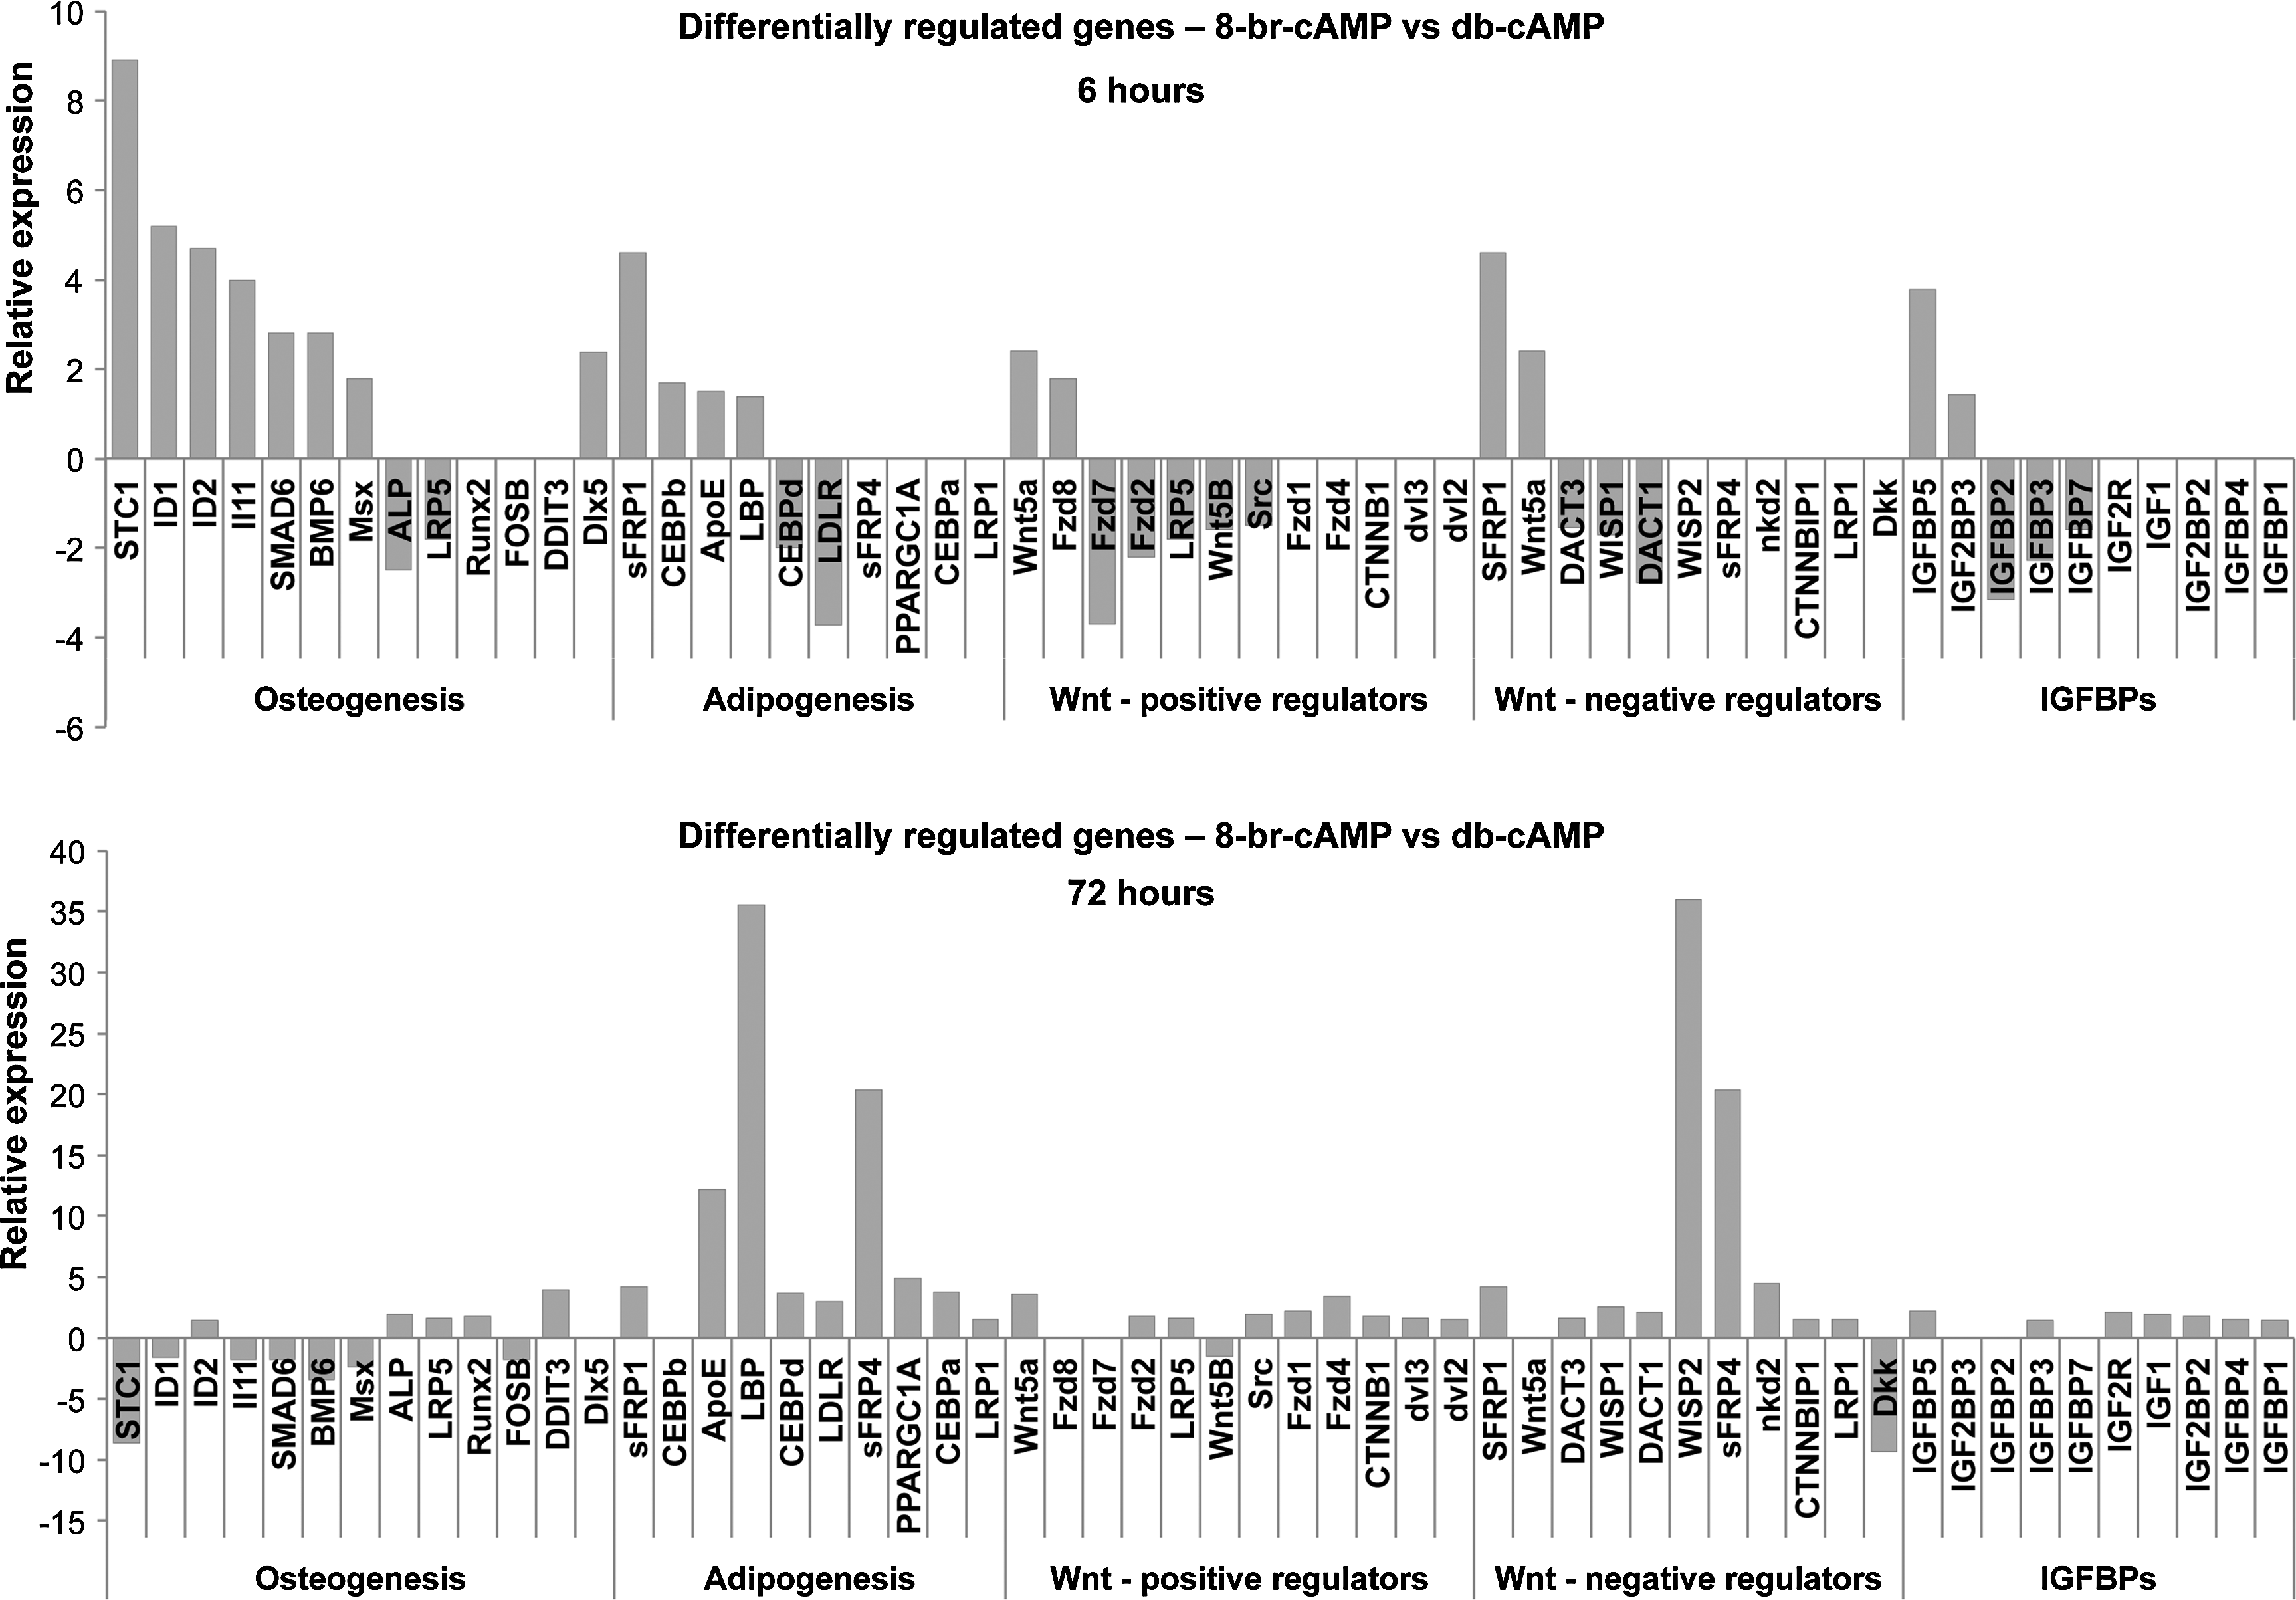
8-br-cAMP induces adipogenic gene expression. Whole-genome expression analysis after 6 and 72 h of treatment with 8-br-cAMP and db-cAMP. After 6 h, expression of several adipogenic genes was increased in 8-br-cAMP-treated cultures, and this number increased further after 72 h. In addition, expression of several osteogenic genes was increased after 6 h, but after 72 h, this profile had changed, and these genes were mostly decreased in 8-br-cAMP. Also of interest was the high number of Wnt-regulated genes. After 6 h, a few negative regulators were increased in 8-br-cAMP cultures, whereas most positive regulators were decreased. However, after 72 h, 8-br-cAMP had increased expression of a large number of positive Wnt regulators, as well as negative regulators, suggesting active Wnt signalling in 8-br-cAMP-treated cultures. In addition, expression of IGF-binding proteins was differentially regulated. After 6 h, expression of IGFBP5 and IGF2BP3 was increased by treatment with 8-br-cAMP, whereas expression of IGFBP2, 3, and 7 was decreased. After 72 h, however, expression of all IGFBPs was increased by treatment with 8-br-cAMP. Data are depicted as gene expression in 8-br-cAMP cultures relative to db-cAMP cultures.
Discussion
We have previously demonstrated enhanced osteogenic differentiation and increased in vivo bone formation of hMSCs after treatment with db-cAMP and forskolin, both activators of the cAMP/PKA pathway.8,39 In contrast, here we show that another cAMP-analog, 8-br-cAMP, induces adipogenesis in the osteogenic medium. Upon addition of dexamethasone, 8-br-cAMP also induced gene expression of PPARγ, and lipid droplet formation was even further increased, whereas db-cAMP did not affect expression of PPARγ or lipid formation.
As described in the introduction, cAMP/PKA signaling has been involved in both osteogenic and adipogenic differentiation, but no general consensus exists on the specific role of this pathway in the hMSC cell fate. The studies by Zhao et al. 24 and Yang et al. 25 have in common that both used a relatively high concentration of dexamethasone (10−7 M), which may explain the contradictory results obtained in our study, where a lower concentration of dexamethasone was used (no or 10−8 M dex). Here, we show that treatment with 8-br-cAMP in combination with higher concentrations of dexamethasone results in higher expression of PPARγ, and several other studies already described that dexamethasone may sensitize receptors or promote responsiveness of cells to other stimuli. In 1986, Rodan and Rodan suggested that dexamethasone increases the abundance of receptors and Gs in rat osteoblast 12/2.8 cells, 40 and Ma et al. demonstrated that dexamethasone increases expression of β2-adrenergic receptors in calvarial osteoblasts, thereby increasing their responsiveness to adrenergic stimulation. 41 Watanabe et al. showed that both PGE2 and forskolin induce expression of aromatase synergistically with dexamethasone, but not alone.42,43 In line with these data, we have also demonstrated synergistic effects between the cAMP inducers forskolin and cholera toxin and dexamethasone in our own lab. Dexamethasone also induced intracellular cAMP levels when combined with PGE2, whereas PGE2 alone did not affect cAMP levels. 26
Beside the interplay with dexamethasone, the various downstream-signaling pathways that are activated by cAMP may have a distinct effect. Although it was traditionally believed that cAMP exerts its effects through PKA, around a decade ago it was recognized that cAMP also activates exchange protein directly activated by cAMP (Epac). Two Epac variants (1 and 2), also called guanine–nucleotide exchange factor 1 and 2, have been identified, and they activate the small GTPases Rap1 and Rap2 (reviewed in. 44 ). It has been suggested that at low concentrations, cAMP activates PKA, whereas at higher concentrations, additional effects are exerted via Epac. 44 Specific PKA- and Epac-activating cAMP analogs have been designed, but the cAMP analogs used here activate both PKA and Epac. Our microarray data show that treatment with 8-br-cAMP results in higher expression of cAMP-responsive genes, and in addition, 8-br-cAMP activates PKA more strongly than db-cAMP. This suggests a mechanism where 8-br-cAMP is either more stable or more potent than db-cAMP and exerts additional effects via Epac, thus resulting in adipogenic differentiation, or a mechanism where low PKA activity (db-cAMP) results in osteogenic differentiation and a strong PKA activity (8-br-cAMP) leads to adipogenic differentiation.
The precise functions of PKA and Epac in adipogenic and/or osteogenic differentiation are now the topic of investigation, and it was demonstrated that, whereas knockdown of Epac resulted in a significant inhibition, blockage of PKA did not affect adipogenesis of 3T3-L1 preadipocytes,45,46 thus suggesting a model in which cAMP activates Epac to stimulate adipogenesis. On the other hand, it was nicely demonstrated by Petersen et al. that adipogenic differentiation of 3T3-L1 cells requires activation of both PKA and Epac. 47 Using Epac- or PKA-specific activators, they demonstrated that neither Epac- nor PKA-selective stimulation is sufficient to induce adipogenic differentiation. Furthermore, they showed that PKA inhibits Rho-kinase signaling, and that knockdown of Rho-kinase signaling results in enhanced adipogenic differentiation. Thus, activation of PKA is not required for adipogenic differentiation as long as Rho kinase is inhibited. The involvement of RhoA and Rho-associated protein kinase (ROCK) was also demonstrated before by McBeath et al., who showed that ROCK activity was associated with the cell shape and accordingly, with lineage commitment. 48 Overexpression of RhoA resulted in osteogenic differentiation, whereas expression of dominant negative RhoA leads to the formation of adipocytes in the absence of any inducing factors. In addition to these findings, Li et al. demonstrated that although both forskolin and 8-br-cAMP enhance dexamethasone- and insulin-stimulated adipogenesis, but in the presence of the phosphodiesterase 1-methyl-3-isobutyl xanthine (MIX), these compounds inhibited adipogenic differentiation. 49 Most likely, the increased cAMP levels are rapidly decreased in the absence of MIX, whereas in the absence, a prolonged continuous rise in the cAMP levels occurs. Furthermore, it was shown that the inhibiting effect on adipogenesis was mediated via PKA and possibly via increased phosphorylation of insulin receptor substrate-1 at ser789, thus inhibiting its activity, which is thought to be a prerequisite for adipogenic differentiation. Thus, it was suggested that a moderate increase of cAMP levels correlates with adipogenic differentiation of 3T3L1 preadipocytes, whereas high levels have a strong inhibitory effect. Our data show a more robust effect of 8-br-cAMP on PKA and cAMP-responsive genes, correlating with adipogenic differentiation. A possible explanation for this apparent contradiction could be Epac, as a prerequisite for adipogenic differentiation, which might be additionally activated by 8-br-cAMP, but not by db-cAMP. A schematic overview of the various signaling pathways mentioned here is given in figure 6.
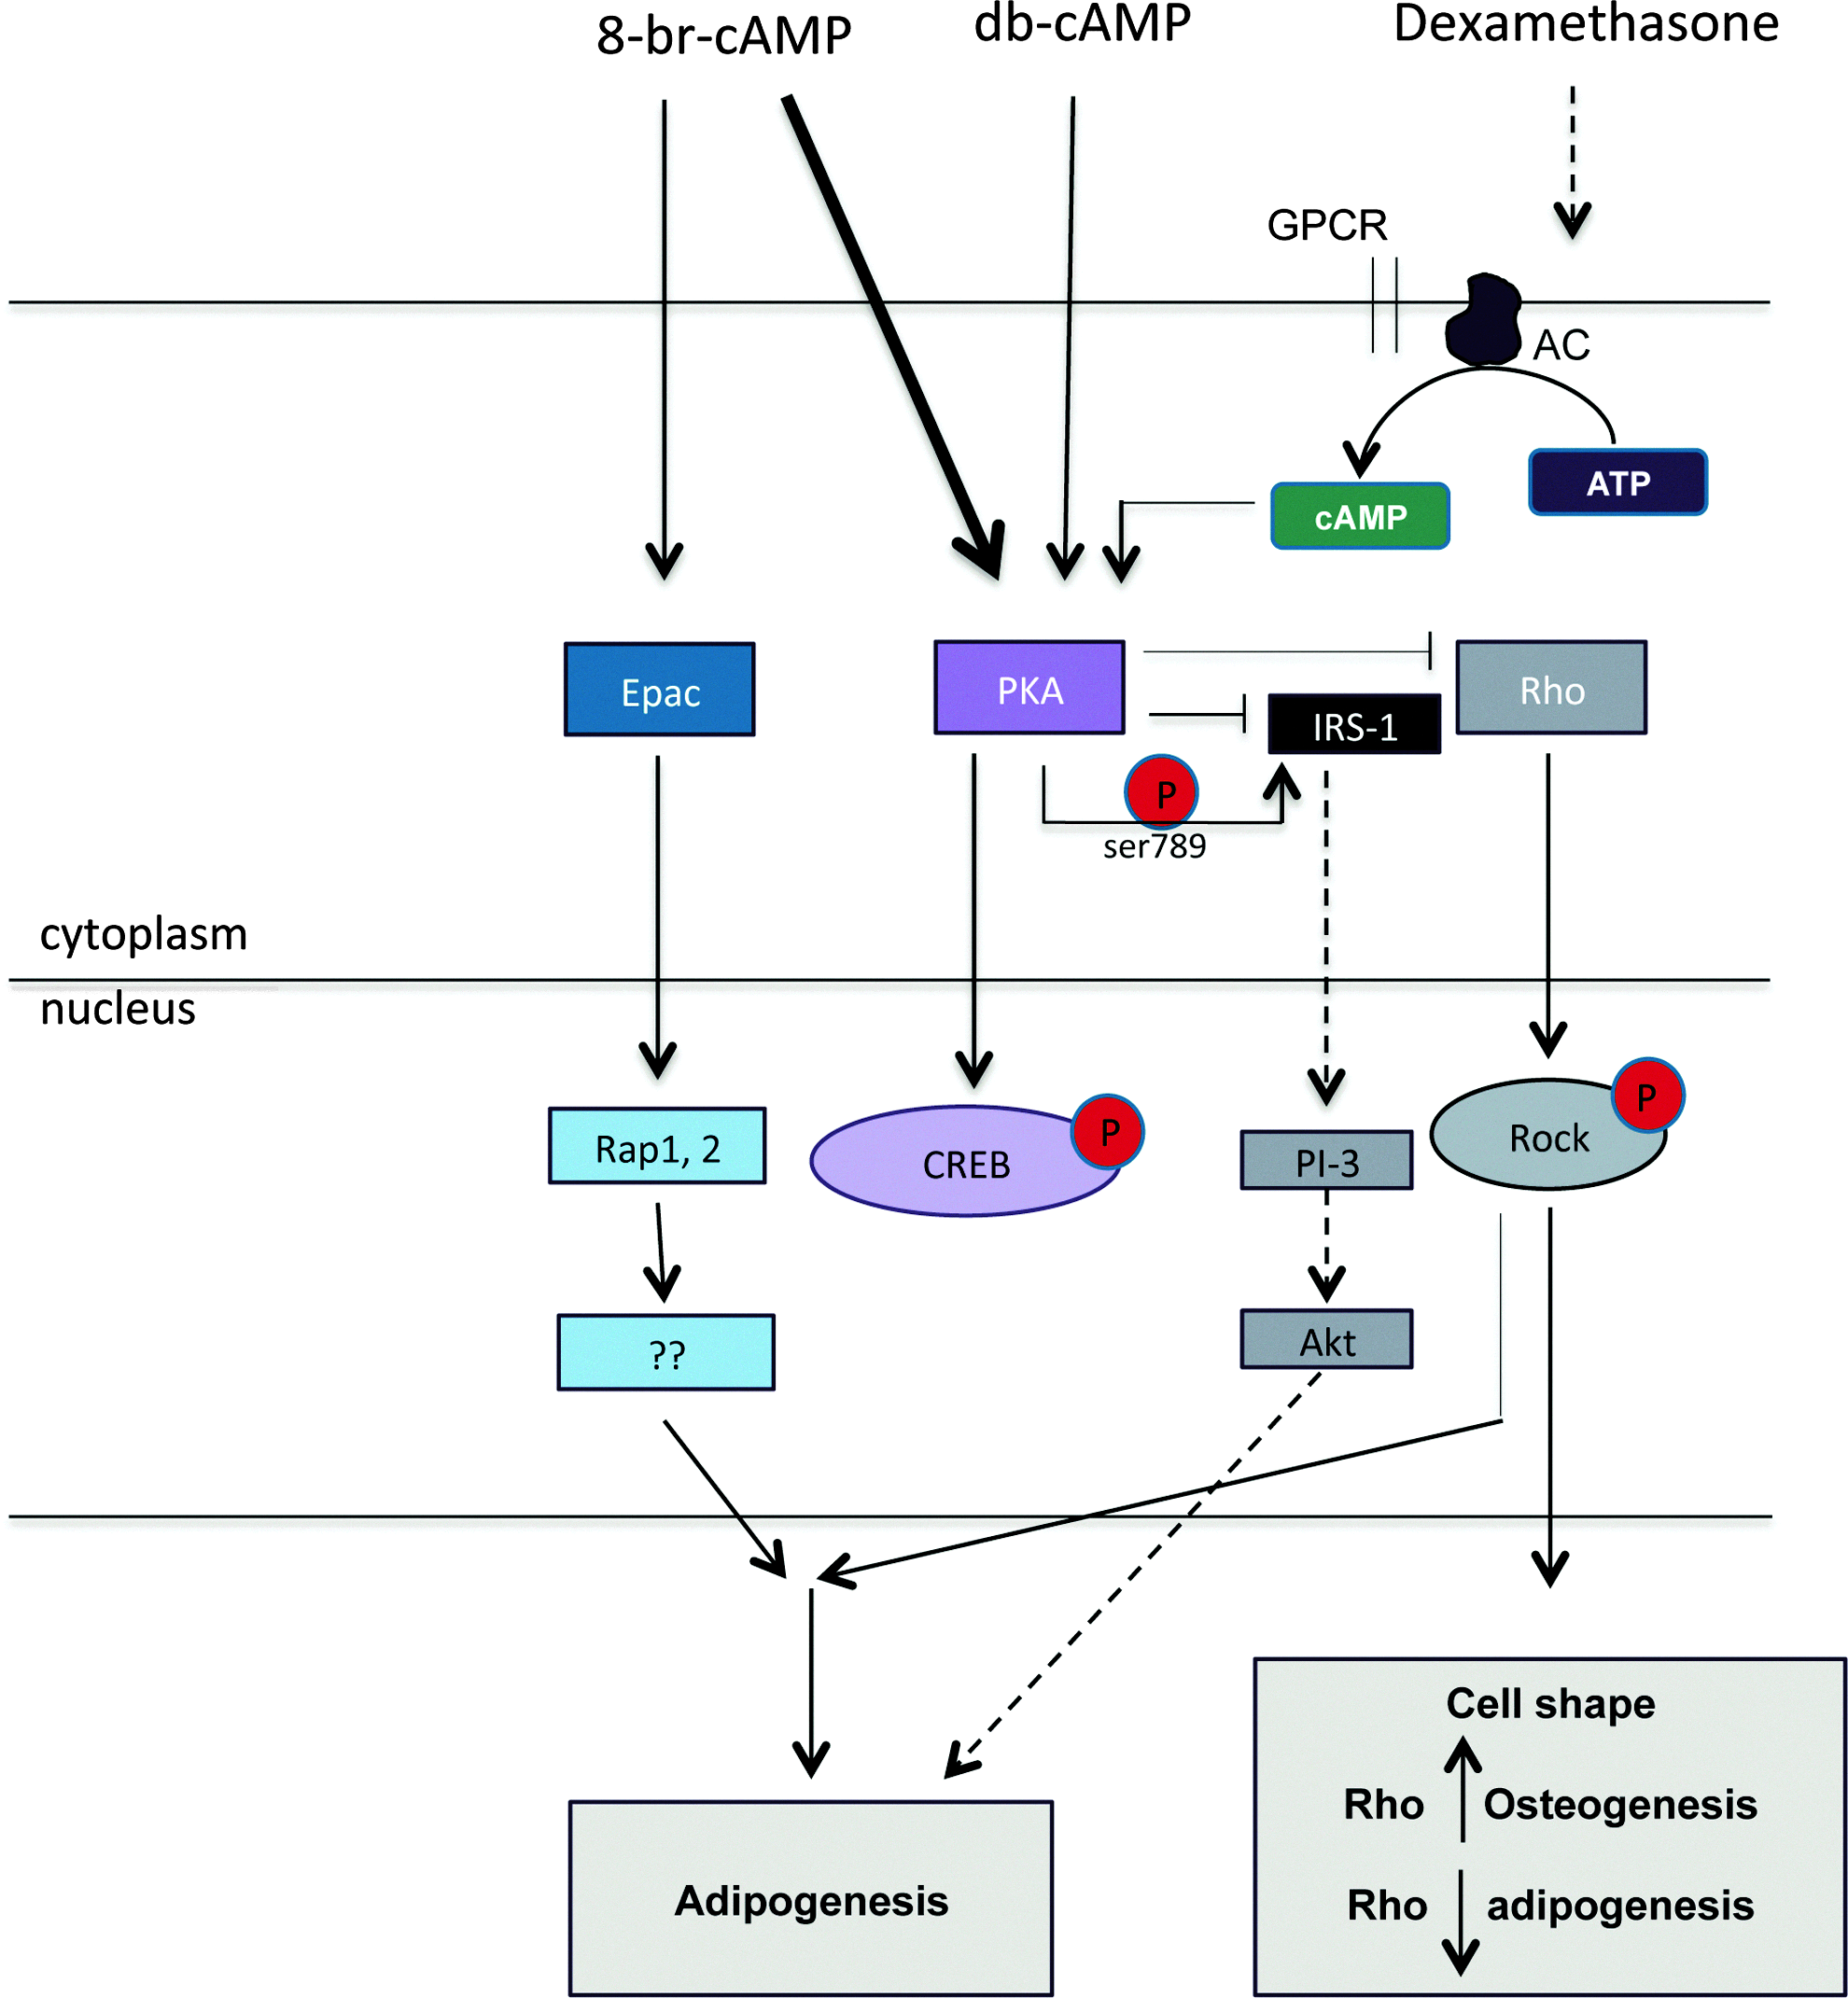
Schematic overview of signalling pathways and crosstalk. PKA is normally activated upon binding of a ligand to a G-protein-coupled receptor via adenylate cyclase and cAMP. PKA phosphorylates CREB, which activates transcription of target genes in the nucleus. In addition, cAMP can activate Epac, which activates Rap1 and 2. The cAMP analogs used in this study are nonspecific; thus, they directly activate PKA, but can also activate Epac. Treatment with 8-br-cAMP results in higher PKA activity than treatment with db-cAMP, and high levels of cAMP are thought to exert additional effects via Epac. In this model, the large arrow depicts relatively strong activation. Furthermore, PKA inhibits Rho kinase (inducer of osteogenic differentiation), which together with Epac has been shown to induce adipogenic differentiation of 3T3-L1 preadipocytes. On the other hand, PKA phosphorylates insulin receptor substrate-1 (IRS-1) at serine-789, thus inhibiting its activity and subsequently inhibiting adipogenic differentiation. The exact mechanism and the role of the various components remain to be determined. Color images available online at www.liebertpub.com/tea
The aim of this study was to evaluate the role of cAMP/PKA signaling in osteogenic and adipogenic differentiation of hMSCs. We demonstrate here that two analogs activating the same pathway can have differential effects on long-term differentiation of hMSCs and gene expression levels, thus pointing to a role for the cAMP/PKA pathway in this balance. These data provide more insight in the stimuli required for osteogenic differentiation of hMSCs, and in addition, information on the underlying biology between osteo- and adipogenic differentiation may be valuable for the treatment of osteoporosis, where this balance is disturbed.
Footnotes
Acknowledgments
We would like to thank Prof. André Uitterlinden for the use of the Illumina equipment. Furthermore, the authors gratefully acknowledge the support of the Smart Mix Program of the Netherlands Ministry of Economic Affairs and the Netherlands Ministry of Education, Culture, and Science.
Disclosure statement
No conflict of interest exists.