
Abstract
Within the field of bone tissue engineering, the endochondral approach to forming bone substitutes represents a novel concept, where cartilage will undergo hypertrophic differentiation before its conversion into bone. For this purpose, clinically relevant multipotent stromal cells (MSCs), MSCs, can be differentiated into the chondrogenic lineage before stimulating hypertrophy. Controversy exists in literature on the oxygen tensions naturally present during this transition in, for example, the growth plate. Therefore, the present study focused on the effects of different oxygen tensions on the progression of the hypertrophic differentiation of MSCs. Bone marrow-derived MSCs of four human donors were expanded, and differentiation was induced in aggregate cultures. Normoxic (20% oxygen) and hypoxic (5%) conditions were imposed on the cultures in chondrogenic or hypertrophic differentiation media. After 4 weeks, the cultures were histologically examined and by real-time polymerase chain reaction. Morphological assessment showed the chondrogenic differentiation of cultures from all donors under normoxic chondrogenic conditions. In addition, hypertrophic differentiation was observed in cultures derived from all but one donor. The deposition of collagen type X was evidenced in both chondrogenically and hypertrophically stimulated cultures. However, mineralization was exclusively observed in hypertrophically stimulated, normoxic cultures. Overall, the progression of hypertrophy was delayed in hypoxic compared with normoxic groups. The observed delay was supported by the gene expression patterns, especially showing the up-regulation of the late hypertrophic markers osteopontin and osteocalcin under normoxic hypertrophic conditions. Concluding, normoxic conditions are more beneficial for hypertrophic differentiation of MSCs than are hypoxic conditions, as long as the MSCs possess hypertrophic potential. This finding has implications for cartilage tissue engineering as well as for endochondral bone tissue engineering, as these approaches deal with, respectively, the inhibition or enhancement of hypertrophic chondrogenesis.
Introduction
A critical process during endochondral ossification is the transition of chondrocytes to hypertrophy before mineralization can take place. This process is spatially illustrated in the growth plate, where the sequential events of chondrocytes transiting to hypertrophy, that is, the deposition of collagen type X, matrix mineralization, and blood vessel invasion, are all visible at the same time. 6
In recent years, it has been demonstrated that oxygen levels are important in the control of MSC proliferation and can also drive MSC differentiation.10–14 Hypoxia, a condition of low oxygen supply, has already been shown by others to stimulate chondrogenic matrix production in chondrocytes and MSCs.15–17 This is in agreement with the observations that cartilage is a tissue, in which naturally low oxygen tensions exist, varying from 1% to 10%.10,18,19 Nonetheless, a few studies have addressed the influence of hypoxia on chondrocyte maturation toward hypertrophy.17,18,20 In vivo, the oxygen tensions governing the zones of the growth plate, varying from resting and proliferating to hypertrophic chondrocytes, were determined. Low oxygen tensions (2%–3%) were demonstrated in vivo in resting and hypertrophic chondrocyte zones in a rabbit joint, while high oxygen tensions (7%–14%) were measured in both the proliferating columnar cells and the diaphysis. 18 In contrast, when explanted for an in vitro culture, the oxygen tension in the hypertrophic zone increased to around 10%. 18 However, consensus exists regarding the presence of an oxygen gradient from hypoxia to normoxia over the hypertrophic zone, although reported values range from <1% to 14%.18,21,22 In addition, hypoxia (5% oxygen) stimulated BMP-2-induced chondrogenesis, but was shown to decrease collagen type X expression of a murine MSC line (C3H10T1/2) compared with normoxia. 17 In line with these observations, when oxygen levels are increased to exceed normoxic tensions, reactive oxygen species (ROS) are generated. These ROS were shown to further enhance the hypertrophic differentiation of chondrocytes.23,24 Together, these data suggest a beneficial effect of high oxygen tensions on the hypertrophic differentiation of chondrocytes or MSCs.
The present study addressed the effects of hypoxic and normoxic culture conditions on human MSCs, which are maintained in chondrogenic (C) or hypertrophic (T3) 25 media. We hypothesized that controlling oxygen tensions is crucial when trying to induce the transition to hypertrophy and that the process will proceed optimally under nonhypoxic conditions. In addition, the inter-donor variations in the hypertrophy of the human MSCs were established, as these are known to occur during the hypertrophic differentiation of MSCs. 4
Materials and Methods
Isolation of MSCs
Human MSCs from bone marrow biopsies from the iliac crest were isolated after obtaining the written informed consent (Medical Ethical Committee, University Medical Center Utrecht) of four patients undergoing hip replacement surgery (donor A: female, 54 years; donor B: female, 47 years; donor C: male, 48 years; donor D: male, 72 years). After Ficoll centrifugation, the mononuclear plastic-adhesive fraction was expanded in αMEM (22561, Minimum Essential Medium α; Invitrogen) containing 10% heat-inactivated fetal bovine serum (DE14-801F; BioWhittaker), 0.2 mM L-ascorbic acid 2-phosphate (A8960; Sigma), 100 U/mL penicillin with 100 μg/mL streptomycin (PenStrep, 15140; Invitrogen), and 1 ng/mL basic fibroblast growth factor (FGF2, 233-FB, R&D Systems). The cells were harvested at passages 2–4 for pellet formation.
After expansion, the MSCs were characterized for their surface marker expression profiles using fluorescence-activated cell sorting (FACS). The expression of CD73 (AD2, PE-conjugated; BD Pharmagen), CD90 (5 E10, Alexa647-conjugated; Biolegend), CD105 (MEM229, FITC-conjugated; Abcam), and W8B2 (PE-conjugated, Biolegend) was confirmed along with the absence of CD31 (LCI-4, FITC-conjugated; Serotec), CD34 (581, FITC-conjugated; BD Pharmagen), and CD45 (HI30, PECy7-conjugated; BD Pharmagen). Isotype-matched control IgGs were purchased from AbD Serotec. In addition, MSC multipotency was established by differentiating the cells into osteoblasts and adipocytes. 26 Chondrogenic potential was assessed in the pellet cultures.
Pellet formation
MSCs were centrifuged in 96-well plates (7007; Corning) at 300 g for 5 min to form cell pellets of 250,000 cells each. The cell aggregates were subsequently maintained in two medium groups at two oxygen tensions for a total of 4 weeks. Chondrogenic controls (group C) were cultured in a chondrogenic differentiation medium (CDM) containing high-glucose Dulbecco's modified Eagle's medium (DMEM, Invitrogen, 31966) with 1% ITS+ premix (354352; BD Bioscienes), 10−7 M dexamethasone (D8893; Sigma), 0.2 mM L-ascorbic acid 2-phosphate, PenStrep, and 10 ng/mL TGF-β2 (302-B2; R&D Systems). The pellets of the hypertrophic group (group T3) were cultured in CDM for 2.5 weeks and, thereafter, transferred to the hypertrophic induction medium 25 consisting of DMEM, 1% ITS+ premix (BD Biosciences), 10−9 M dexamethasone, 10 mM β-glycerophosphate, 0.2 mM L-ascorbic acid 2-phosphate, PenStrep, and 1 nM 3,3′,5-triiodo-L-thyronine (T3, Sigma).
Pellets from both medium groups were cultured under either normoxia (N, 20% O2) or hypoxia (H, 5% O2) for the entire culture period of 4 weeks in humidified incubators at 37°C and 5% CO2. The gas inlet of the hypoxic incubator consisted of N2, and the inflows of both CO2 and O2 were set to 5%. Taken together, 4 different experimental conditions were imposed on the pellets, which will be referred to as CN, CH, T3N, and T3H.
All media were refreshed twice weekly, and medium samples were taken every week. At 4 weeks, the pellets were harvested for (immuno)histochemistry and stored for biochemical analyses and a polymerase chain reaction (PCR).
Histology and immunohistochemistry
The pellets were fixed in formalin, embedded in paraffin, and 5 μm sections were cut. Before (immuno)histological stainings were performed, the sections were deparaffinized and rehydrated. The stained sections were evaluated with light microscopy (Olympus).
Safranin-O staining
The sections were stained with Weigert's hematoxylin (640490; Klinipath BV) for 5 min and 0.4% fast green (1.04022.0025; Merck) for 4 min. Then, they were rinsed in 1% acetic acid and stained with 0.125% Safranin-O (1.15948.0025, Merck) for 5 min. Finally, the sections were dehydrated and mounted in depex.
Von Kossa staining
The sections were rinsed with distilled water and then incubated at room temperature in a 1% silver nitrate (5/1240/46; Fisher Scientific) solution directly under a light bulb for 1 h. The sections were subsequently washed with 5% sodium thiosulphate (A17629; Alta Aesar). The cell nuclei were counterstained with hematoxylin before dehydration to xylene and mounting.
Immunohistochemistry
After deparaffinization and rehydration, antigen retrieval was performed by treating the sections with 1 mg/mL pronase (30 min) and 10 mg/mL hyaluronidase (30 min) for collagen type II immunostaining. Sections for collagen type X staining were pretreated with hyaluronidase for 30 min and in 1 mg/mL pepsin (P7012, Sigma) at pH 2.0 for 2 h. Then, tissue sections were blocked with 0.3% H2O2 and with 5% BSA (bovine serum albumin) in PBS (phosphate buffered saline). Incubation with the respective primary antibodies for collagen type II (1:100 from ascites, II-II6B3, Developmental Studies Hybridoma Bank) and collagen type X (1:20,×53, Quartett, Germany) was performed overnight at 4°C. Next, incubation with the secondary goat anti-mouse, horse-radish peroxidase (HRP)-conjugated antibody (P0447; Dako) was performed at room temperature for 1 h at a 1:200 dilution for collagen type II staining. For collagen type X detection, a 1-h incubation was performed in biotinylated sheep anti-mouse secondary antibody (1:200, RPN1001v1; GE Healthcare) and followed by incubation with streptavidin-HRP (Beckman Coulter) at a 1:500 dilution. Detection was performed by incubation with 3,3′-diaminobenzidine tetrahydrochloride hydrate (DAB, D5637; Sigma) for no longer than 10 min. Before dehydration and mounting, the sections were counterstained with hematoxylin. Isotype control staining was performed by replacement of the primary antibody with mouse isotype IgG1 monoclonal antibody (X0931; Dako) at concentrations similar to those used for the stainings.
Biochemical analyses
Glycosaminoglycans
Amounts of glycosaminoglycans (GAGs) that were released into the culture medium (measured in triplicate for each donor) were assessed using the 1,9-dimethyl-methylene blue (DMMB, 341088; Sigma) assay as previously described. 27 Medium samples were collected each week for 4 weeks. For donors B and D, the culture periods were extended to 42 days. The samples were diluted to obtain GAG concentrations within the assay's range. Twice the sample volume of the DMMB staining solution (46 μM DMMB, 0.04M NaCl, 0.04M glycine, and pH 3.0) was added to each diluted sample. Standards were treated identically and were prepared from chondroitin sulphate C (C4384; Sigma). Absorbances were measured immediately after the addition of the DMMB solution at 540 and 595 nm in a 96-well plate reader. The concentrations of GAG were then calculated by taking the ratio of absorbances at 540/595 nm and based on a second-degree polynomial fit of the standard curve. The latter fit was performed, as the commonly used linear fit was less reliable at higher concentrations.
Vascular endothelial growth factor
A commercially available ELISA kit for VEGF (DVE00, R&D Systems) was used according to the manufacturer's protocol on 1:10 diluted medium samples of donors A and B. Absorbance of the assay plate was read at 450 nm, and the background absorbance at 540 nm was subtracted from that reading. Vascular endothelial growth factor (VEGF) concentrations were calculated from the supplied standards and corrected for the dilution factor. Medium samples were collected at the end of each week for 4 weeks. The values obtained for the medium samples were divided by the number of days that they resided on the pellets, ranging from 3 to 4 days, to obtain VEGF release from the pellets per day. Medium blanks showed no absorbance.
Real-time-polymerase chain reaction
Three pellets of each donor were pooled in TRIzol (Cat. No. 15596-018; Invitrogen Life Science Technologies) after 28 days of culturing. Nucleic acids were extracted and treated with 10×TURBO™ DNase (Ambion). Subsequently, the RNA concentrations were corrected to the lowest concentration present among the groups, and cDNA was synthesized by using the iScriptTM cDNA Synthesis kit (Bio-Rad) according to the manufacturer's instructions. Finally, semi quantitative real-time PCR was performed by applying the iQ SYBR Green Supermix (Cat. No. 170-8885; Bio-Rad) on a MyIQ PCR system (Bio-Rad).
Gene expression patterns were determined for osteocalcin, osteopontin, VEGF, alkaline phosphatase, collagen types 1, 2, and 10, and matrix metalloproteinase 13. The sequences of the primers that were added are summarized in Table 1. The Ct values of the different genes were corrected for GAPDH expression levels. Data are represented as the fold induction of the genes of interest for hypertrophic conditions versus chondrogenic conditions using the delta-delta Ct method.
BGLAP, osteocalcin; SPP1, osteopontin; VEGF, vascular endothelial growth factor; ALPL, alkaline phosphatase; COL, collagen; MMP, matrix metalloproteinase; GAPDH, glyceraldehyde 3-phosphate dehydrogenase.
Due to the spontaneous disintegration of hypoxic pellet cultures, samples of donor C were lost for PCR analysis.
Statistical analyses
All data are presented as means and their standard deviations. The differences in the release of GAG and VEGF proteins were analyzed for significance (p<0.05) using analysis of variance in SPSS (version 15.0) with Bonferroni posthoc analysis. The data of the RT-PCR were based on technical triplicates of pooled samples. Therefore, no statistics was performed on the PCR data set.
Results
The multilineage potential of the isolated cells and their CD-marker expression profile were confirmed and are summarized in Supplementary Figure S1 (Supplementary Data are available online at www.liebertpub.com/tea).
Chondrogenic differentiation
The MSCs of all 4 human donors successfully formed spherical aggregate cultures. The chondrogenic differentiation of the cultures was examined with Safranin-O staining (Saf-O) of proteoglycans and collagen type II immunohistochemistry (Fig. 1, CN, CH). Saf-O staining revealed heterogeneous tissue development of cultures in all the groups (Fig. 1a). MSCs from all donors were capable of chondrogenic differentiation under standard normoxic conditions as evidenced by the presence of proteoglycans and collagen type II (Fig. 1b, CN) expression. In contrast, under hypoxic conditions (CH), the MSCs from only two donors (B and D) underwent chondrogenesis, whereas those of donors A and C did not.
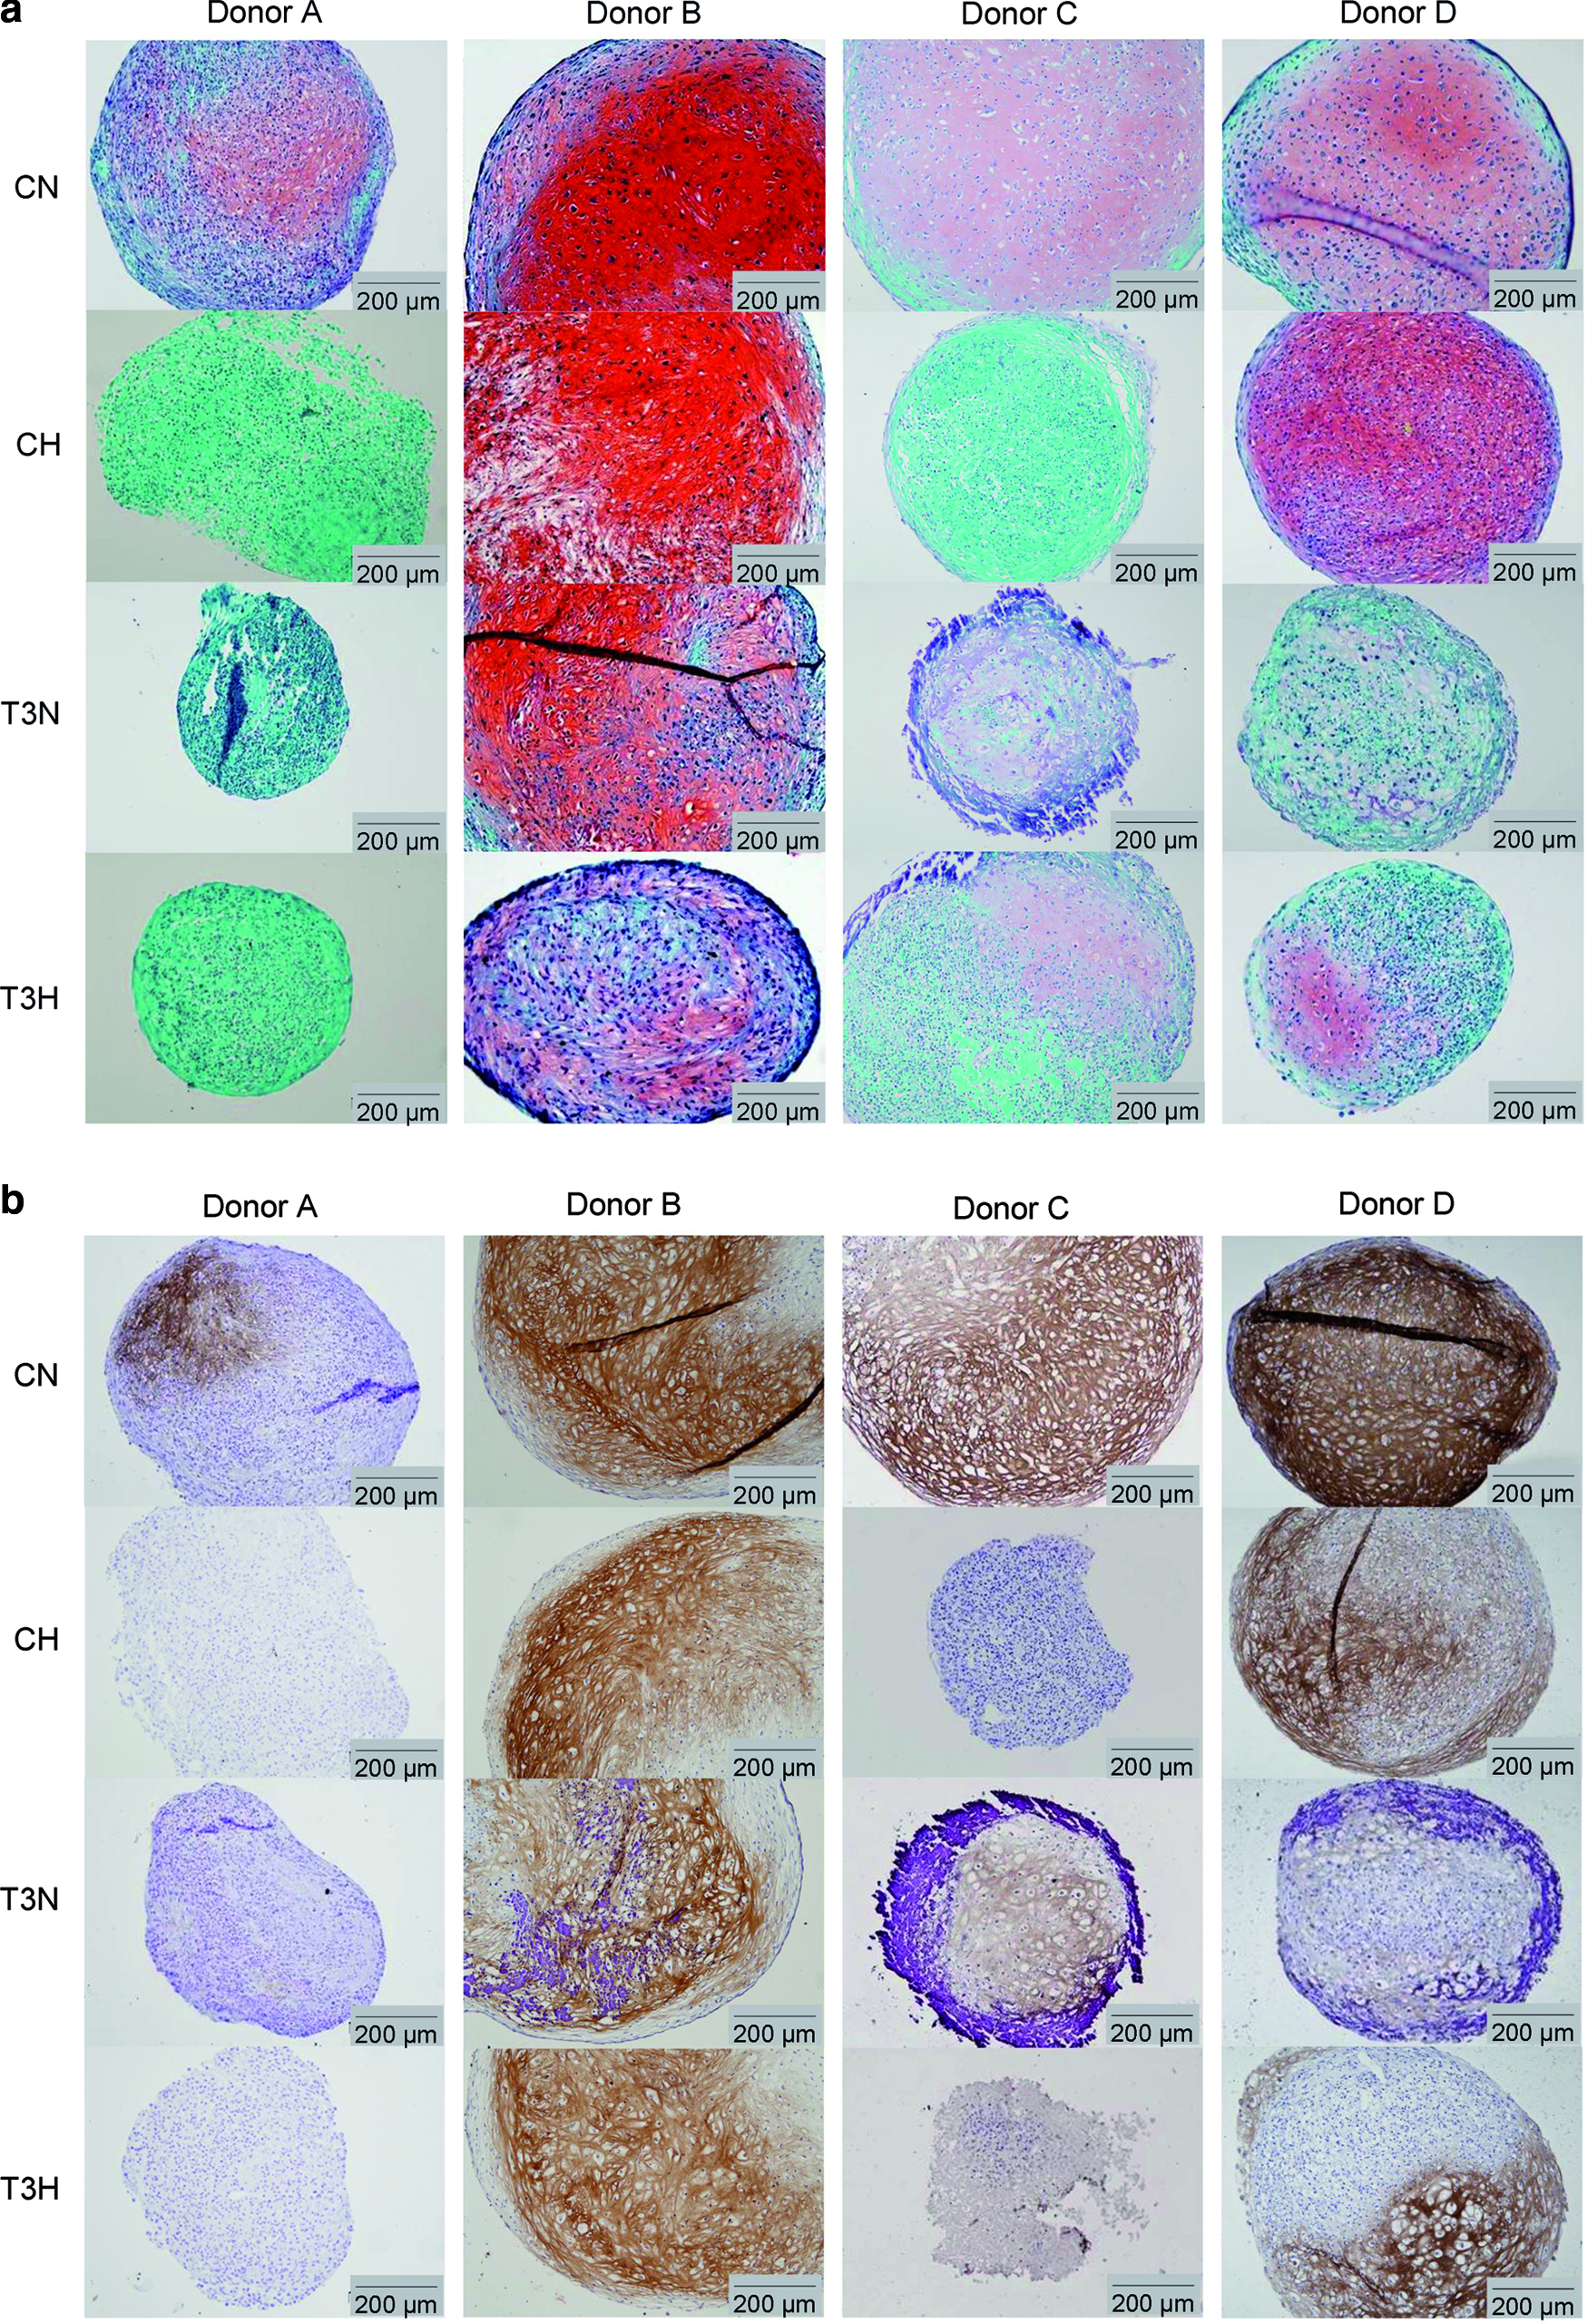
Chondrogenic differentiation of multipotent stromal cell (MSC) pellets, isolated from 4 human donors (A–D) and cultured for 4 weeks under normoxia (N) or hypoxia (H) in either chondrogenic (C) or hypertrophic (T3) media.
Hypertrophic differentiation
Hypertrophic differentiation was induced in chondrogenically predifferentiated MSC aggregates. Effective hypertrophic induction was observed in the cultures of donors B, C, and D, whereas those of donor A did not undergo hypertrophy (T3N). This was evidenced by collagen type X expression (Fig. 2a) and matrix mineralization (Fig. 2b) in the hypertrophic cultures. Furthermore, at 4 weeks, the cultures of the normoxic T3-stimulated conditions appeared to be in a more advanced state of hypertrophy than their hypoxic counterparts (T3H), as these exhibited greater areas involved in both collagen type X production and mineralization. The hypoxic samples of donors A and B even lacked any sign of hypertrophy.
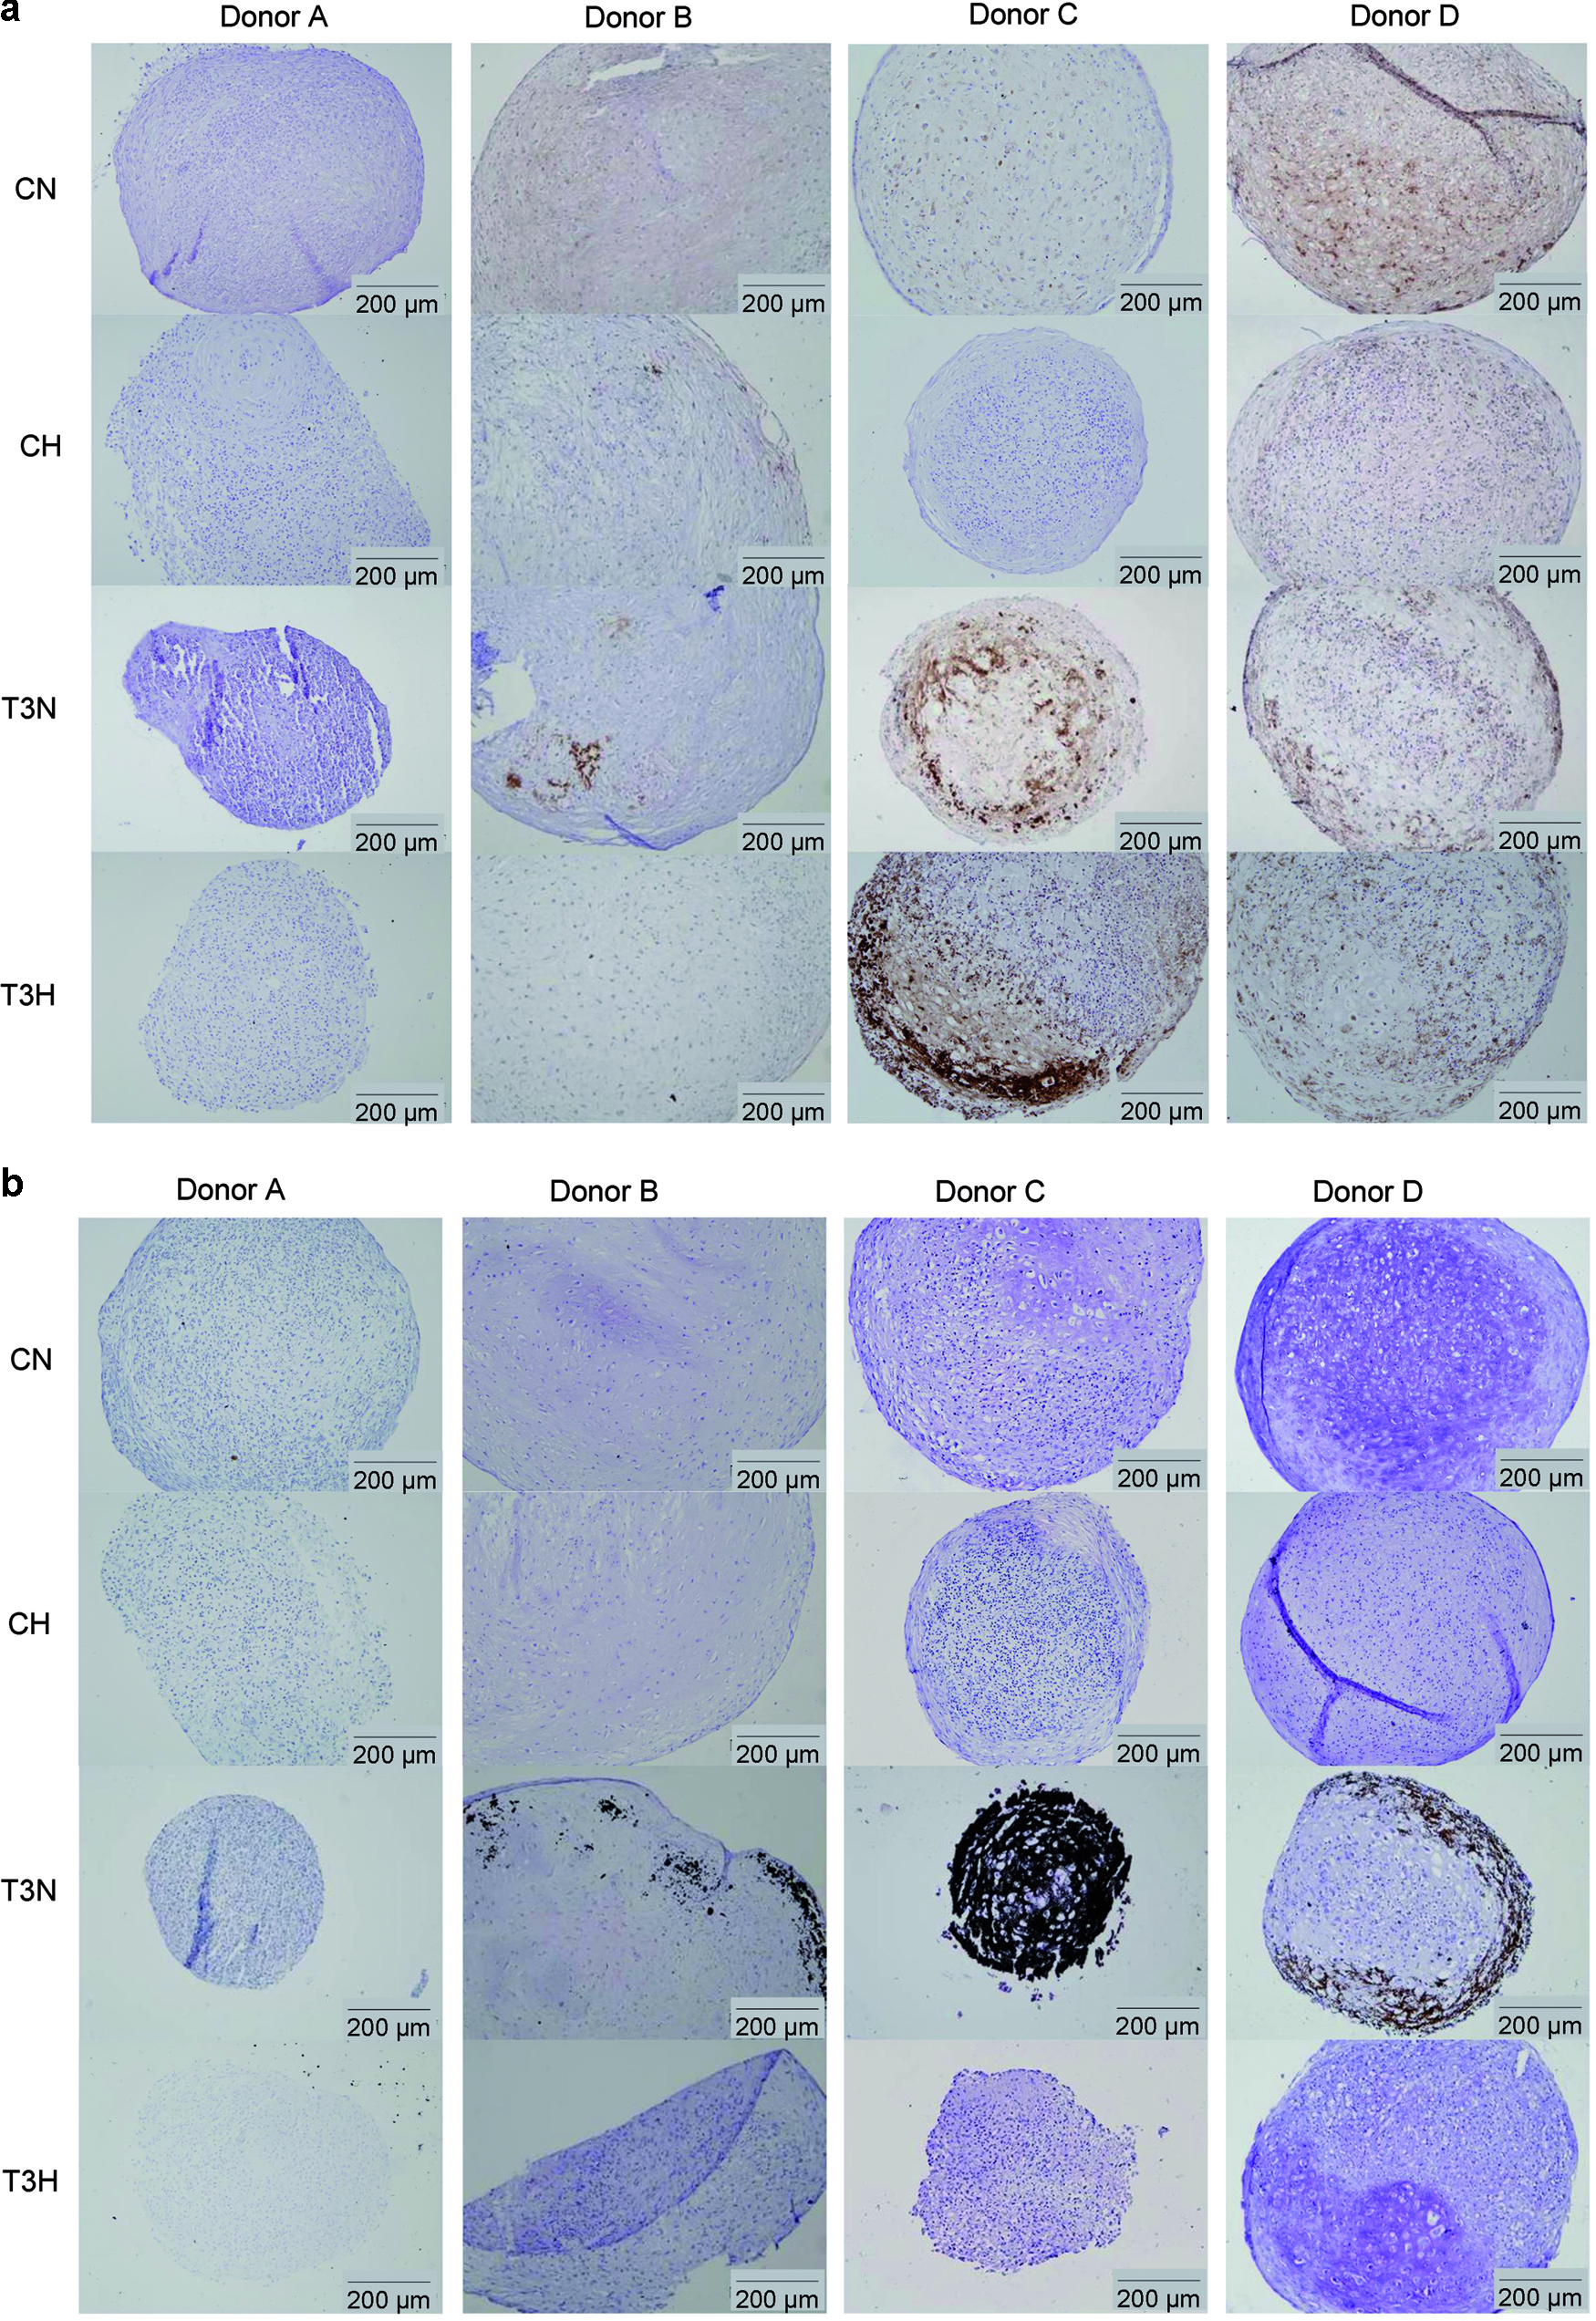
Hypertrophic differentiation and mineralization of MSC pellets, isolated from 4 human donors (A–D) and cultured for 4 weeks under normoxia (N) or hypoxia (H) in either chondrogenic (C) or hypertrophic (T3) media.
Besides the effect of the oxygen tension on MSC differentiation, donor variation obviously affected chondrogenic and hypertrophic differentiation. For example, the cultures of donor B were in a less advanced hypertrophic stage of differentiation than those of donors C and D (T3N, T3H). In contrast, although MSCs from donor A were able to differentiate into the chondrogenic lineage (Fig. 1, CN), they were not capable of hypertrophic chondrogenesis with the T3-containing induction medium (Fig. 2, T3N, T3H). Finally, the basal expression of collagen type X was observed for the chondrogenically differentiated cultures of donor D under normoxic conditions (CN).
Real-time monitoring of GAG release
In addition, the release of sulphated GAGs into the culture medium was determined to assess its potential as a real-time means to monitor hypertrophic tissue differentiation. The release of GAGs increased with culture time in the normoxic chondrogenic cultures (Fig. 3b, c, d) and reached a donor-dependent plateau value within 14–28 days. In donor A (Fig. 3a), a low release was observed at all time points, which may be explained by the small part of the culture actually showing chondrogenesis compared with the other three donors in the histological results (Fig. 1, CN). The onset of hypertrophy at 2.5 weeks in the normoxic T3-stimulated MSC cultures was accompanied by a decreased GAG release into the culture medium (Fig. 3, significant for donors C and D at 28 days). The decrease in GAG release was exclusively observed in the medium from cultures that underwent hypertrophic differentiation (normoxic T3-stimulated pellets of donors B-D) and appeared to correlate with the amount of culture mineralization. The steeper decrease in GAG release for donor C by day 28 compared with that for donors B and D was reflected by a more extensive degree of mineralization in those cultures.
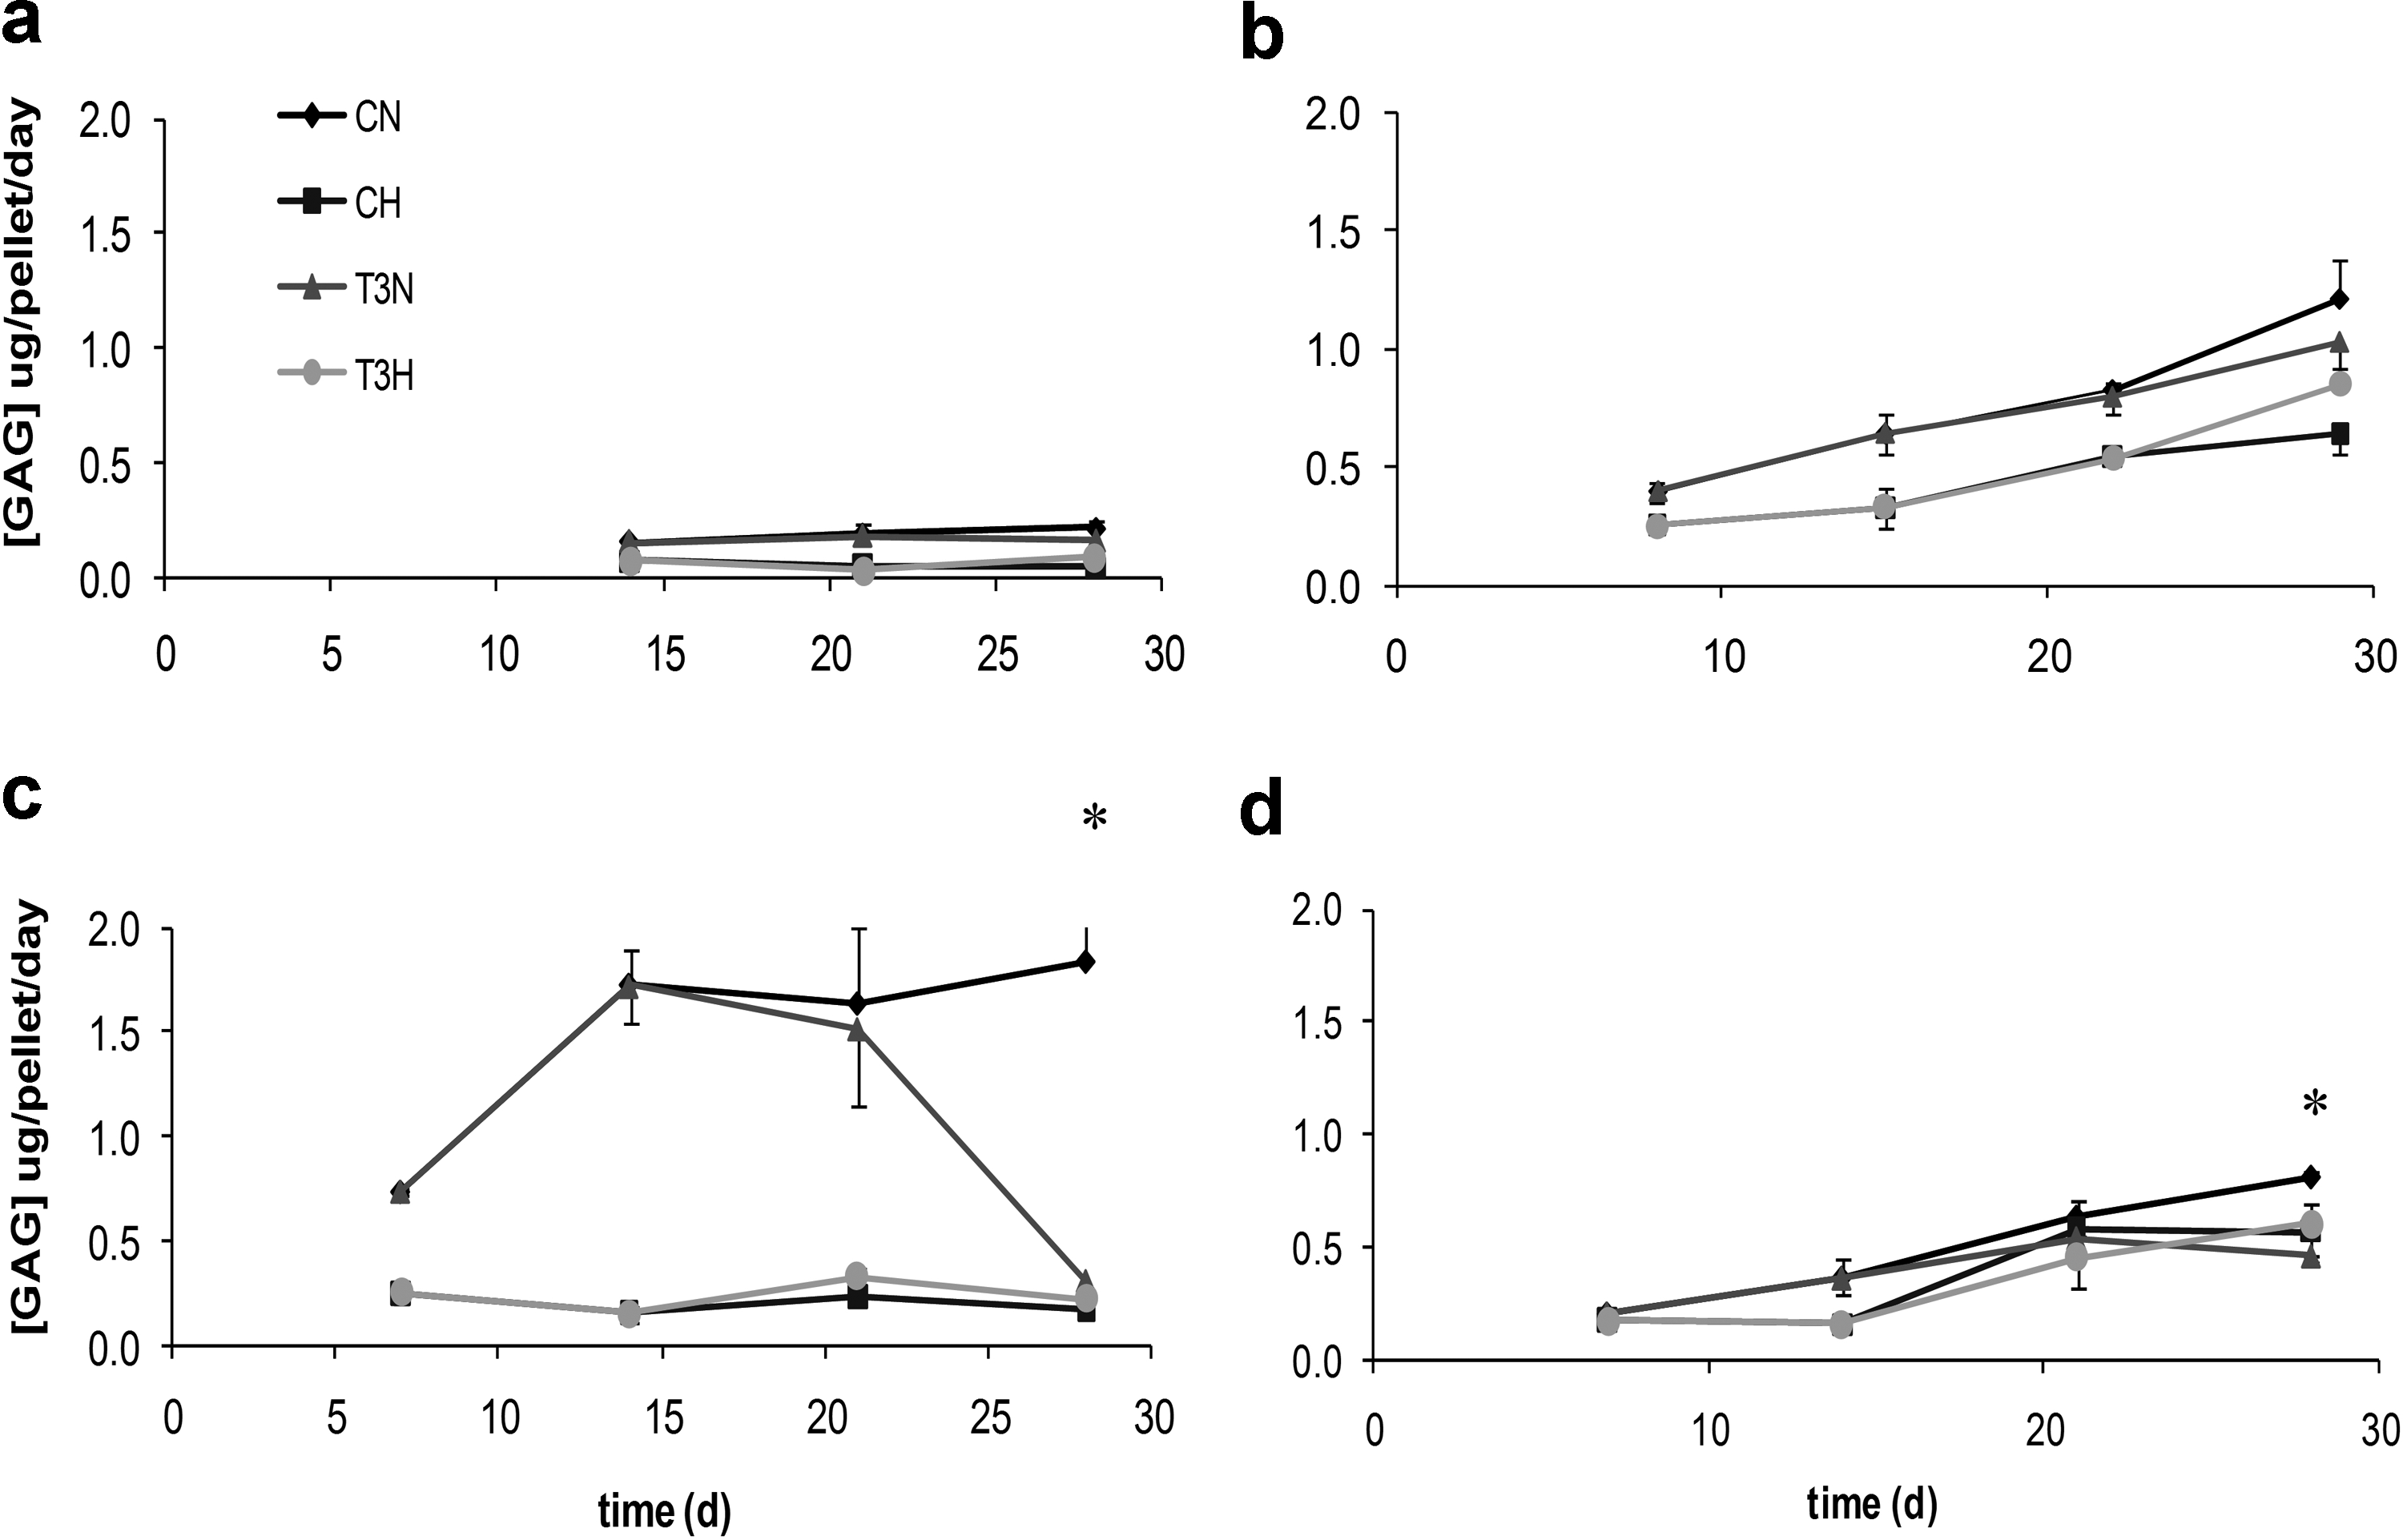
Release profiles of glycosaminoglycans (GAG) (per pellet per day, n=3) are shown for both chondrogenically (C) and hypertrophically (T3) stimulated cultures under normoxia (N) or hypoxia (H). *denotes p<0.05 for CN versus T3N at a certain time point. The data for donors A, B, C, D are shown in panels
Altogether, measuring GAG release on medium changes during a culture is a promising means of monitoring tissue differentiation status.
Real-time monitoring of VEGF release
Simultaneously, the monitoring potential of VEGF, a marker for hypertrophic differentiation, was assessed for cultures of donors A and B (Fig. 4). VEGF release significantly decreased with time for the samples of both donors. Although it was expected that VEGF release would increase on hypertrophic differentiation and with hypoxia, significantly less VEGF was released from T3-stimulated cultures compared with their chondrogenic controls (day 28). This was reflected in the data of donor B that differentiated hypertrophically, while the effect was not observed for donor A, whose samples did not exhibit hypertrophy. In addition, the release of this angiogenic factor was not increased in hypoxic conditions.

Release profiles of vascular endothelial growth factor (VEGF) during chondrogenic (C) or hypertrophic (T3) differentiation of hypoxic (H) or normoxic (N) cultures. The graphs represents data from donors A (panel
Overall, it cannot be concluded here that VEGF release into the medium is a reliable method for monitoring the progression of hypertrophic differentiation in these cultures.
Expression of chondrogenic and hypertrophic genes
To further analyze tissue differentiation, RNA expression in donors A, B, and D of several chondrogenic, hypertrophic, and late hypertrophic or osteogenic markers was analyzed at 4 weeks (Fig. 5). The data for the cultures of donor A are shown, but these samples did not undergo hypertrophy. Caution was taken in interpretation of these data, as they represent gene expression in pooled cultures.

The fold change of gene expression in hypertrophic versus chondrogenic cultures, normalized to housekeeping gene GAPDH (technical triplicates of 5 pooled cultures) for donors A, B, and D at 28 days. In general, late hypertrophic markers osteopontin (SPP1) and osteocalcin (BGLAP) are up-regulated in the normoxic hypertrophically differentiated cultures. In the cultures of donor B also, several early hypertrophic markers were up-regulated under normoxic conditions, including Col10a1, VEGF, ALPL, and MMP13. ND, not determined; ALPL, alkaline phosphatase; Col2a1, collagen type II; Col10a1, collagen type X; MMP13, matrix metalloproteinase 13.
Collagen type II expression, indicative of chondrogenic differentiation, was elevated in hypertrophic versus chondrogenic cultures at 4 weeks. In general, the (early) hypertrophic marker genes for VEGF, MMP13, ALP, and collagen type X were expressed at the highest levels in the hypertrophic, normoxic cultures of donor B, compared with their chondrogenic counterparts. In contrast, these genes were not highly expressed in the T3N cultures of donor D. From these data, we infer that the differentiation of cultures of donor D was more advanced at 4 weeks than for those of donor B. Furthermore, the late hypertrophic marker genes of osteopontin and osteocalcin were highly expressed in the hypertrophic, normoxic groups of both donors B and D (osteopontin: 3.7- and 11.7-fold increase, and osteocalcin: 132.5- and 9.4-fold increase for hypertrophic vs. chondrogenic cultures). The up-regulation in hypertrophic versus chondrogenic cultures of osteopontin and osteocalcin in hypoxic cultures was less pronounced (osteopontin: 2.7-fold for donor D; osteocalcin 3.5- (B) and 6.8 (D)-fold) or even down-regulated (osteopontin: 0.6-fold for donor B). This is also in line with the observations in Figure 2, where more advanced hypertrophy was shown in the normoxic (T3N) versus hypoxic (T3H) cultures.
To summarize, in hypertrophic versus chondrogenic conditions, donors B and D showed an increased gene expression profile related to hypertrophic differentiation, most efficiently under normoxia. The cultures of donor D showed even more hypertrophically advanced expression patterns than those of donor B.
Discussion
The differentiation capacity toward the (hypertrophic) chondrogenic lineage of MSCs derived from the bone marrow of four human donors was assessed under hypoxic and normoxic conditions. Donor-dependent chondrogenic potential was observed. Once chondrogenesis had occurred, subsequent hypertrophic differentiation showed a donor-dependent rate of progression as well. Furthermore, normoxic conditions, in general, supported the progression of hypertrophic differentiation compared with hypoxia.
Chondrogenic differentiation and hypoxia
The stimulatory effect of hypoxia (2%–5%) on chondrogenic matrix synthesis (collagen II and proteoglycans) was previously established for rat and human MSCs.16,28 In addition, a selective effect of hypoxic conditions in favor of chondrogenically potent MSCs has been demonstrated. 14 Nevertheless, also negative effects of low oxygen tensions on chondrogenesis were shown in aggregate cultures of human and murine MSCs.13,29 These dissimilar effects of hypoxia on chondrogenesis were reflected in our histological data and collagen type II gene expression. In contrast to other reports showing rather uniform results within their respective studies, we obtained both the stimulation and inhibition of chondrogenesis under identical experimental settings. It has been proposed that the experimental setting and culture model influence the actual oxygen tensions that the cells are exposed to,29,30 and, thus, the variation in outcomes when comparing different studies. In our setting, where MSCs from different donors were cultured in parallel, intrinsic properties of the MSCs isolated from the different donors are more likely to have influenced the differentiation of the cultures.
The presence of donor-dependent differences in MSC differentiation toward chondrogenic and hypertrophic phenotypes under normoxic conditions was shown earlier.4,29 However, beyond donor variation, the site-specific MSC characteristics can affect the chondrogenesis of the derived cells. 31 To minimize the influence of the isolation site, all the MSCs used in the present study were isolated from human bone marrow aspirated from the iliac crest.
It is suggested that inter-donor variations account for the discrepancies in hypoxic chondrogenic differentiation of MSCs rather than inter-experimental or inter-species differences. This may be explained by the heterogeneity of the MSC population. Since no selection criteria exist that uniquely identify the ‘true’ MSC, all plastic-adherent mononuclear cells contribute to the population. Recently, the considerable variation in the capacity to differentiate within clonally expanded MSCs of one single donor was demonstrated (H-J. Prins et al., manuscript in preparation). The clonal subpopulations derived from a single aspirate included unipotent, bipotent, and multipotent progenitors and stem cells. The fraction of clones capable of chondrogenic differentiation was noticeably smaller than the osteogenic and adipogenic progenitor fractions. This stresses the need for selection of the MSC subpopulation of interest by an appropriate marker set.
Hypertrophy is delayed under hypoxia
Various studies have indicated that high oxygen tensions would favor the hypertrophic differentiation of chondrogenic cultures or tissues.17,18,22–24 In concert with these investigations, hypertrophy was inhibited in hypoxic monolayers of murine MSCs. 17 In the present study, the influence of oxygen tensions on the hypertrophic differentiation of 3D aggregate cultures of MSCs was compared among several human donors. First, within each donor, the expression profiles of hypertrophic markers increased with culture time, as previously reported.4,9 This was illustrated by significant decreases in the GAG release of donors C and D by 28 days and by a comparison of the 4-week histology to a 2.5-week time point (data not shown). In all donors who exhibited hypertrophic differentiation, the extent of differentiation was more pronounced in the normoxic cultures at 28 days. It may be suggested that the process occurred at a slower rate in the hypoxic conditions compared with their normoxic controls. However, it should be noted that the timing and extent of hypertrophic differentiation varied among MSC cultures from the different donors, at both protein and gene expression levels.
The highest extent of hypertrophic differentiation was observed for normoxic cultures of donors C and D, when considering the expression of collagen type X protein and pellet mineralization. To a lower extent, this pattern was observed in donor B. This may suggest a slower progression of differentiation in the cultures of donor B. This suggestion is supported by the gene expression profiles of donors B and D. The induction of VEGF, ALP, collagen type X, and MMP13 is up-regulated in the normoxic hypertrophic cultures of donor B, while these hypertrophic markers are down-regulated for these samples of donor D at 4 weeks. The late hypertrophic markers osteopontin and osteocalcin are up-regulated in normoxic cultures of both donors. This confirms a more advanced stage of differentiation for the samples of donor D at 4 weeks, as is also reflected in the histological data. In addition, hypoxic culture conditions allowed the hypertrophic differentiation of the cultures but resulted in a less mature stage of differentiation at 4 weeks. This was evidenced by both protein and mineral deposition in the pellets and an overall low increase in the expression of hypertrophic genes on hypertrophic stimulation, compared with normoxic cultures.
A point of debate in the present and similar studies is the issue of changing the medium at ambient or hypoxic conditions. In the present study, the medium was replaced under normoxic conditions, for obvious practical reasons. The sudden change in oxygen levels during medium replacement of hypoxic cultures may have affected cell differentiation, especially at the periphery of the pellets. Even more, a sudden increase in oxygen tensions could have evoked ROS production, which is known to stimulate hypertrophy.23,24
It is probable that the limited chondrogenesis under hypoxic conditions in the cultures of donors A and C resulted in limited hypertrophy. It was earlier shown that without chondrogenesis of MSCs, no hypertrophy was observed. 25 Finally, it would be interesting to study the effects of hypoxic chondrogenesis of MSCs, followed by normoxic conditions during hypertrophic induction. Moreover, increasing oxygen tensions even above ambient levels may further accelerate hypertrophic differentiation.
Monitoring of differentiation progression
Monitoring the release of GAGs into the culture medium may be a promising approach for real-time assessment of hypertrophic differentiation. The DMMB assay is a more economical technique than the VEGF ELISA. More importantly, the high and constant release of GAGs into the culture medium after 2.5 weeks of culture decreased on culture mineralization as assessed with histological techniques. The altered GAG release was also reproducible for several MSC isolates. Therefore, monitoring GAG release is a promising nondestructive means for monitoring hypertrophic tissue differentiation. It is suggested that in our culture model no GAGs are synthesized during the late stages of hypertrophic differentiation, and the release into the medium is either unaffected or enhanced by matrix degrading proteins, such as the matrix metalloproteinases (MMP13 gene expression is elevated in hypertrophic cultures).
VEGF is an important factor for blood vessel recruitment in endochondral bone formation. While chondrocytes are known to prevent the vascular invasion of cartilage and exhibit anti-angiogenic properties, hypertrophic chondrocytes secrete angiogenic factors, such as VEGF.6,32 In the present study, it was hypothesized that once cells were stimulated to undergo hypertrophy, VEGF production would be increased. However, the natural pattern of VEGF protein expression was not paralleled in the in vitro simulation of endochondral bone formation. A considerable production of VEGF by chondrogenic cultures was demonstrated in the present study and has been described earlier.2,4 At 4 weeks, VEGF gene expression was elevated in the hypertrophic cultures of donor B compared with chondrogenic controls. In contrast, VEGF protein release was significantly decreased for hypertrophically stimulated cultures of donor B (p<0.0001 CN vs. T3N and p=0.035 CH vs. T3H). This decrease in VEGF protein release on the addition of a hypertrophy-inducing medium was in concert with previous in vitro observations.2,4 It is unlikely that the retainment of VEGF in the tissue's matrix can account for this decreased release, as the amount of VEGF that could be isolated from similar pellet cultures was low compared with the amount of released protein. 2 Overall, more studies are required to address the potential of using the temporal release profile of VEGF protein into the culture medium as a measure for hypertrophic differentiation.
In conclusion, hypertrophic stimulation of chondrogenically preconditioned MSC pellets is enhanced by normoxia. The higher rate of hypertrophic differentiation under normoxia was reproducible for all MSC populations being capable of hypertrophic differentiation. This effect is of crucial importance for both the maintenance of engineered cartilage and for inducing the chondrogenic maturation of MSCs through the endochondral route.
Footnotes
Acknowledgments
This work is a part of the UMC Utrecht strategic program on Regenerative Medicine. The authors gratefully acknowledge the support of the Smart Mix Program of the Netherlands Ministry of Economic Affairs and the Netherlands Ministry of Education, Culture, and Science. The antibody against collagen type II (II-II6B3), developed by T.F Linsenmayer, was obtained from the DSHB developed under the auspices of the NICHD and maintained by The University of Iowa, Department of Biology, Iowa City, IA 52242. The authors are grateful to Willy Noort for her assistance in the FACS characterization of the MSCs.
Disclosure Statement
No competing financial interests exist.
References
Supplementary Material
Please find the following supplemental material available below.
For Open Access articles published under a Creative Commons License, all supplemental material carries the same license as the article it is associated with.
For non-Open Access articles published, all supplemental material carries a non-exclusive license, and permission requests for re-use of supplemental material or any part of supplemental material shall be sent directly to the copyright owner as specified in the copyright notice associated with the article.