
Abstract
Coculture of endothelial cells (ECs) and smooth muscle cells (SMCs) in vitro can yield confluent monolayers or EC networks. Factors influencing this transition are not known. In this study, we examined whether the spatial arrangement of EC-SMC cocultures affected EC migration, network morphology, and angiogenic protein secretion. Human umbilical cord blood–derived ECs (hCB-ECs) were grown in coculture with human aortic SMCs in either a mixed or lamellar spatial geometry and analyzed over a culture period of 12 days. The hCB-ECs cultured on SMCs in a mixed system had higher cell speeds, shorter persistence times, and lower random motility coefficients than ECs in a lamellar system. By day 12 of coculture, mixed systems demonstrated greater anastomoses and capillary loop formation than lamellar systems as evidenced by a higher number of branch points, angle of curvature between branch points, and percentage of imaged area covered by networks. The network morphology was more uniform in the mixed systems than the lamellar systems with fewer EC clusters present after several days in culture. Proliferation of hCB-ECs was higher for mixed cocultures during the first 24 h of coculture, and then declined dramatically suggesting that proliferation only contributed to network formation during the early stages of coculture. Proteome assay results show reduced solution levels, but no change in intracellular levels of angiogenic proteins in lamellar systems compared to mixed systems. These data suggest that mixing ECs and SMCs together favors the formation of EC networks to a greater extent than a lamellar arrangement in which ECs form a cell layer above a confluent, quiescent layer of SMCs.
Introduction
The spatial arrangement and ratio of ECs and SMCs in coculture may affect network formation by influencing cell migration, alteration of local concentration gradients, or the types and amounts of secreted cytokines.11,12 Network formation of ECs is influenced by cell motility and the secretion of cytokines by supporting stromal cell types cultured with ECs.13–16 Although ECs secrete vascular endothelial growth factor (VEGF), supporting cells, such as SMCs, are required for formation and stabilization of the networks.17,18 The cell ratio affects network formation in which EC to stromal cell ratios greater than one result in a confluent monolayer 19 and lower ratios produce robust microvessel formation in vitro.20,21
To understand the differences between lamellar and mixed coculture, we tested the hypothesis that the mixed coculture of ECs and SMCs better promote capillary networks than a lamellar arrangement of ECs adherent on a layer of SMCs due to the greater amount of contact area between human umbilical cord blood–derived ECs (hCB-ECs) and SMCs. The increased contact between ECs and SMCs aids in activating signaling pathways involved in neovessel formation. To address this hypothesis, we examined cell migration, capillary network morphology, and angiogenic protein secretion using two subconfluent densities of ECs and SMCs.
Materials and Methods
hCB-EC isolation and cell culture
Umbilical cord blood was obtained from the Carolina Cord Blood Bank at Duke University. All procedures complied with policies determined by the Duke University Institutional Review Board. hCB-ECs were isolated from umbilical cord blood as previously described. 22 Late outgrowth ECs were harvested by day 10 of primary culture. The hCB-ECs were expanded in a growth medium (endothelial basal media-2 supplemented with endothelial growth media-2 SingleQuots with 10% fetal bovine serum and 1% antibiotic–antimycotic solution.) Confluent cultures of hCB-ECs were verified as ECs by platelet endothelial cell adhesion molecule (PECAM) staining to visualize junctions. We have previously characterized these cells and found the hCB-ECs to be positive for many typical ECs markers, such as vWF, VE-cadherin, acetylated low-density lipoprotein, and negative for the monocytic cell marker, CD14. These cells respond to flow in a manner similar to vascular endothelium. 22 hCB-ECs were used at passage 4–7 for all experiments.
Human aortic ECs (HAECs), used as a control, were purchased from Cambrex and maintained in the same growth medium as the hCB-ECs. Human aortic SMCs (Cambrex) were expanded using the smooth muscle basal medium supplemented with smooth muscle growth media-2 SingleQuots (Cambrex) and 1% antibiotic–antimycotic solution. SMCs and HAECs were used at passages 6–9 for all experiments.
Capillary network morphology studies
To study cell migration and the morphology of the networks over time, the cells were transduced with lentivirus before coculture. The lentivirus vector system used packaging vectors, psPAX2 (Addgene #12260) and pMD2G (Addgene #12259). For GFP expression, the vector FUGW (Addgene #14883) was used. For the FU tdTomato.W, we performed simple ligation on the GFP gene in FUGW with the tdTomato gene. The transduction efficiency was nearly 80% for the ECs and 70% for the SMCs. The transduced cells allowed high-resolution imaging for up to 12 days of culture. Images were taken at 4× magnification on days 3, 6, and 12 after onset of coculture on a Nikon® Eclipse Inverted Microscope system. For each condition, 24 images were taken at each time point. The images were analyzed by Metamorph's Angiogenesis Tube Formation module for percentage of image area covered by tubes and for the number of endothelial clusters present. Based on in vivo measurements from literature, 23 we used a maximum capillary width of 11.1 μm and a minimum width of 3 μm. A tube segment was defined as a cell with a width that falls between the minimum and maximum capillary widths assigned. An EC cluster was defined as a group of cells greater than 30 μm in width, which were not undergoing elongation at the time of imaging. EC clusters were organized in patterns of confluent ECs on larger vessels rather than ECs that form networks. The branch points of each image were counted manually using ImageJ. A branch point was defined as any point, where three or more tube segments converged. The curvature between branch point segments was also measured manually using ImageJ angle measurement tool. The curvature is a measure of capillary loop formation and was found by measuring the angle between two segments of the branch point.
Mixed and lamellar coculture conditions
Tissue culture-treated polystyrene 24-well plates (BD Falcon) were incubated with 3.3 μg/mL of fibronectin buffered in DPBS without calcium or magnesium (Gibco) for 1 h before plating. To form lamellar cocultures, SMCs were plated at a density of 80,000 cells/cm2 and allowed to adhere for 24 h. ECs were then added at ratios of either 0.2 (16,000 cells/cm2) or 0.6 (48,000 cells/cm2) ECs:SMCs. Upon addition of hCB-ECs or HAECs to SMCs, the culture media was changed to media composed of endothelial basal media-2 (without supplements), 10% fetal bovine serum, and 1% antibiotic–antimycotic solution. The media was changed every 48 h.
The mixed coculture conditions contained the same 0.2 and 0.6 ratios of ECs:SMCs as in the lamellar conditions. The hCB-ECs and SMCs were mixed together before plating using a 100-μL pipette. The same coculture media was used as in the lamellar condition.
To verify capillary lumen formation in EC networks, 10,000 MW dextran labeled with TRITC (Invitrogen) was added to 0.6 mixed cocultures at day 14 at a concentration of 0.5 mg/mL. Fourteen hours later, the dextran solution was aspirated and the cocultures rinsed three times with DPBS with calcium and magnesium (Gibco). The cocultures were imaged with a Leica SP5 confocal microscope. Cross-sectional images were 1 μm in thickness with 13 sections per sample. The images were analyzed using Imaris software.
Cell migration assays
The 0.2 and 0.6 lamellar/mixed conditions were imaged on 35-mm glass dishes (FluoroDish™; World Precision Instruments, Inc.), precoated with 3.3 μg/mL of fibronectin 1 h before plating of ECs and SMCs, during the first 24 h of coculture. After allowing cells to adhere for 1 h, an Olympus VivaView FL incubator microscope imaged the cocultures at four-stage locations every 15 min for a time period of 24 h. This time frame was chosen based on preliminary observations of the most active cell movement observed. A total of 19 hCB-ECs and 19 SMCs were tracked for each condition. Cell migration movements were analyzed using the Metamorph® for Olympus track object tool. The root mean square displacement was used to determine cell motility parameters (Equation 1).
13
Where α and β are motility parameters and T refers to duration time in hours. These calculations resulted in a series of <D 2 > values for increasing time increments.
Nonlinear regression was performed to fit the experimental mean square displacements against time to Equation 1 using the MATLAB® Levenberg-Marquardt algorithm for nonlinear least squares. The speed, persistence time, and random motility coefficient values can be derived from the random motility parameters:
To ensure that changes to the measured persistence time of hCB-ECs in coculture conditions were due to migration rather than cell death or growth arrest, the cell viability was evaluated using Live–Dead® viability/cytotoxicity staining (Invitrogen) and proliferation of hCB-ECs measured using a Click-iT® Alexa Fluor 488 EdU incorporation assay (Invitrogen) (n=8) 24 h after initial plating. Cocultures were incubated with EdU for 2 h followed by labeling of cell nuclei with DAPI. The hCB-ECs were labeled with anti-PECAM (Invitrogen) and an Alexa Fluor 594 secondary antibody (Invitrogen). The EdU is incorporated into the DNA during the S-phase and EdU-positive nuclei associated with PECAM-stained hCB-ECs were used to identify the hCB-ECs in the S-phase.
Angiogenic-protein proteome arrays
To analyze the expression profiles of proteins in the lamellar and mixed geometries, we used the Proteome Profiler™ Human Angiogenesis Array kit to detect relative levels of expression for 55 angiogenesis-related proteins (#ARY007; R&D Systems). The supernatant from cocultures at the 0.2 and 0.6 ratios for the mixed and lamellar conditions were tested at 72 h postplating using the protocol provided by the manufacturers. This time point was chosen based on preliminary imaging experiments, which showed the greatest change in the EC phenotype into capillary networks occurring at day 3 of coculture. For the lamellar conditions, the supernatant was collected 72 h after adding ECs. For each condition, four separate assays of the supernatant were performed using hCB-ECs from three different biological donors. The resulting proteome arrays were analyzed by the pixel density on ImageJ and normalized to controls provided on each array. To account for proteins present in the medium, a proteome array was performed on the coculture medium and protein expression values subtracted from the coculture conditions. Intracellular concentrations of proteins found to be significantly different between the supernatant of mixed and lamellar systems were assessed using the same proteomic array following protocols suggested by the manufacturer. Briefly, cells were rinsed with PBS before adding the lysis buffer (1% Igepal CA-630, 20 mM Tris-HCl [pH 8.0], 137 mM NaCl, 10% glycerol, 2 mM EDTA, 10 μg/mL Aprotinin, 10 μg/mL Leupeptin, and 10 μg/mL Pepstatin). Resuspended cells were rocked at 4 °C for 30 min before microcentrifugation at 14,000 g for 5 min and the resulting supernatant assayed immediately.
Statistics
Statistics were done using either parametric or nonparametric testing. The parametric tests consisted of one-way ANOVA and the post hoc Tukey–Kramer HSD test. The nonparametric tests used the Kruskal–Wallis test. In cases where nonparametric testing was used, the variance of the samples was confirmed to be nonhomogeneous by the Welch's test for unequal variances. A p-value of less than 0.05 was used to indicate significance.
For the proteome array studies, the global intensity normalization method was performed to account for variation in the array technology. 24 The normalization factor is calculated as the ratio of average protein expression for each condition to the global average protein expression of all conditions. To determine whether the slopes were different for regression plots of actual versus predicted protein expression, the analysis of covariance test was used. All statistical analysis was performed by JMP® 9.0 software.
Results
hCB-EC migration in lamellar and mixed systems
In the lamellar coculture systems, ECs moved over the SMC layer without changes in speed or direction (Supplementary Videos SV1–SV4; Supplementary Data are available online at www.liebertpub.com/tea). In the mixed system, ECs collided with SMCs and changed direction; movement of hCB-ECs over SMCs was not observed. Pathways of representative hCB-ECs at the 0.2 hCB-EC:SMC ratio for lamellar and mixed systems (Fig. 1) show that hCB-ECs in lamellar culture move further in one direction before changing their direction of migration, whereas for the mixed system, the hCB-EC:SMC collisions cause more frequent changes in cell direction.
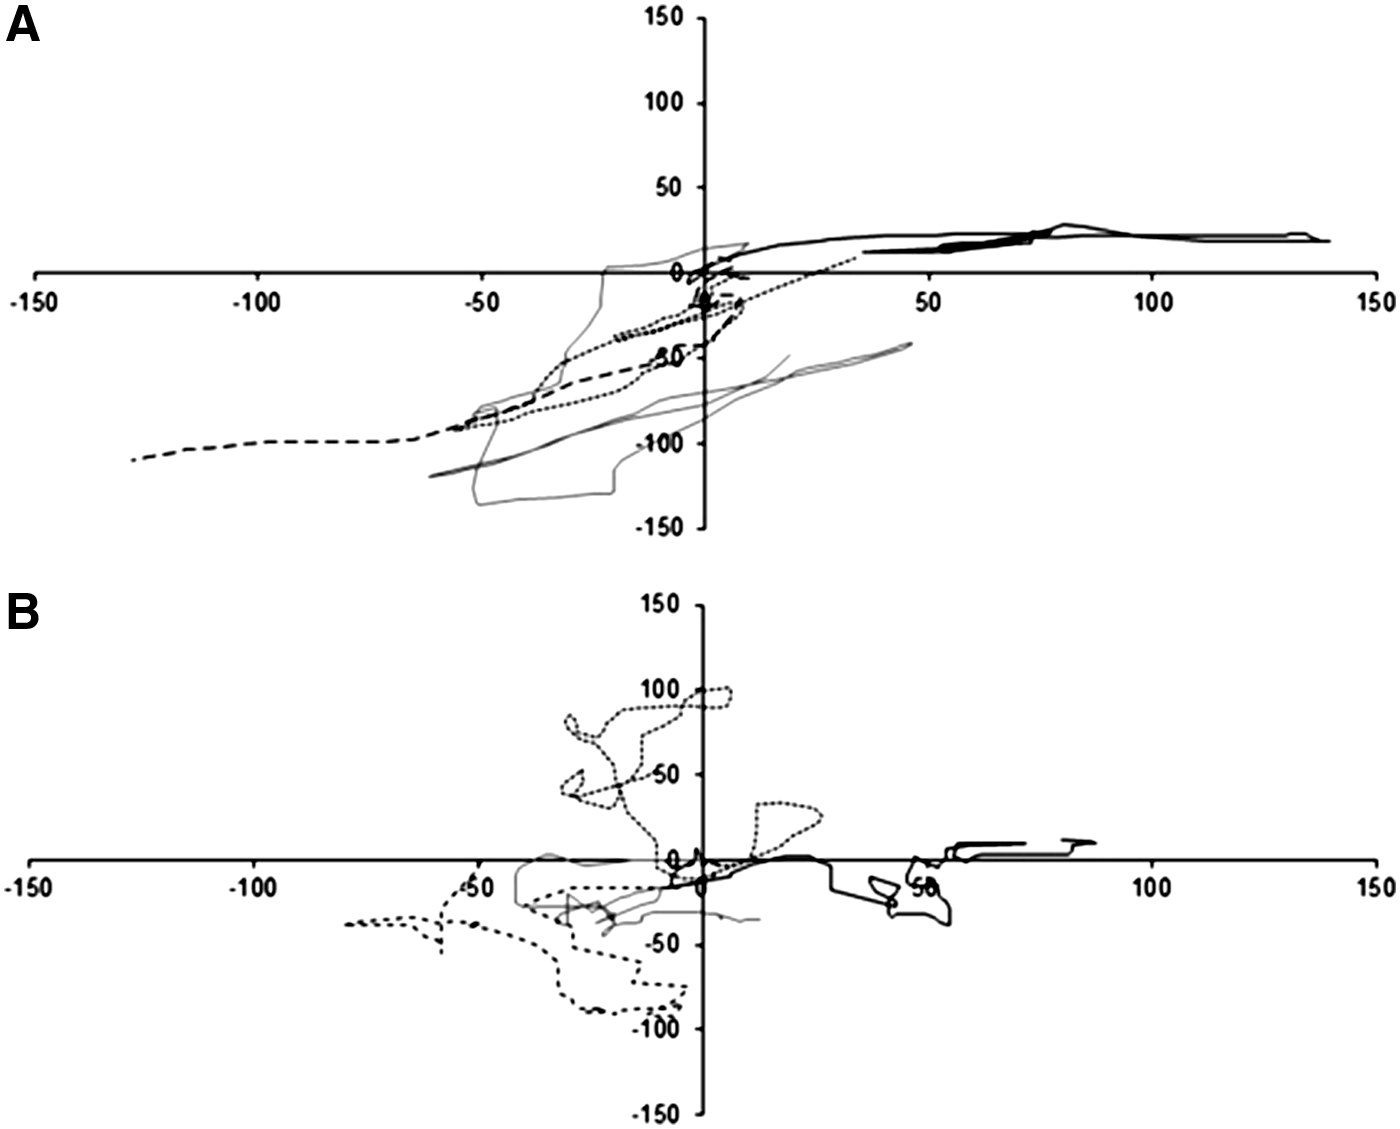
Position plots of representative hCB-ECs from 0.2 lamellar
These qualitative observations were quantified using a model for cell migration (Table 1). The mean persistence time for ECs to follow a particular trajectory and the random motility coefficients were significantly higher for lamellar conditions than for the mixed coculture conditions. Although the hCB-ECs in mixed coculture were more likely to collide with SMCs, the average speed for hCB-ECs in both the 0.2 and 0.6 ratio mixed coculture systems was significantly higher (p=0.027) than for the lamellar coculture systems. These results suggest that the manner in which coculture is performed affects the migration of ECs and SMCs.
Values reported as mean±standard error of the mean. n=19 hCB-ECs and SMCs tracked per condition.
p<0.05 compared to 0.2 mixed hCB-ECs.
p<0.05 compared to hCB-EC control.
p<0.05 compared to 0.2 lamellar SMCs.
p<0.05 compared to 0.6 mixed hCB-ECs.
p<0.05 compared to 0.6 lamellar SMCs.
EC, endothelial cell; hCB-ECs, human umbilical cord blood–derived ECs; SMC, smooth muscle cells.
The Supplementary Videos show that SMCs move more slowly than hCB-ECs. Correspondingly, the random motility coefficients were significantly lower for SMCs compared to hCB-ECs for all conditions. Persistence times of SMCs showed similar trends with ECs, but tended to be smaller than corresponding values for hCB-ECs. Cell speeds of hCB-ECs and SMCs were similar, suggesting that fundamental mechanics regulating the two cell types were similar, and that SMC migration was limited by the coculture arrangement and cell density.
Mixed coculture favors capillary network formation with increased anastomosis and capillary loop formation
Next, we examined whether the spatial arrangement of cells in coculture affected the evolution of networks. The maturation of the ECs into elongated networks was observed from day 3 to 12 of culture (Fig. 2). At day 3 of coculture, ECs formed more clusters for the lamellar conditions than the mixed conditions. By day 6, networks began to elongate in all of the coculture systems. By day 12, the networks had matured and appeared more connected. The lamellar conditions tended to form parallel arrangement of networks with little connectivity occurring between segments. Lumen formation was confirmed in 0.6 mixed systems at day 14 of culture by cross-sectional images showing concentrated dextran within hCB-EC networks (Supplementary Fig. S1).

Representative images of ECs transduced with tomato lentivirus forming into capillary networks for mixed and lamellar coculture systems at day 3, 6, and 12 time points. Scale bar equals 500 μm. EC cluster indicated by white arrow in 0.2 lamellar at day 3.
To assess the extent of capillary formation due to cell proliferation or migration, we measured EdU incorporation at 24 h, 4 days, and 9 days after initial plating (Fig. 3). We observed a significant decrease in the number of ECs in the S-phase after 24 h of culture. The mean percentage of hCB-ECs in the S-phase for mixed conditions dropped from nearly 70% at 24 h to near 2% by days 4 and 9. The same trend was observed for lamellar conditions. In contrast, the percentage of SMCs in the S-phase was 7% at 24 h and declined to less than 1% on days 4 and 9. These findings suggest proliferation plays a greater role in the initial stages of network formation, while migration processes dominate the latter stages of network elongation and anastomosis. Using a live/dead assay, we observed very little cell death in either mixed or lamellar 0.2 coculture conditions at 24 h and 4 days after initial plating (Supplementary Fig. S2).
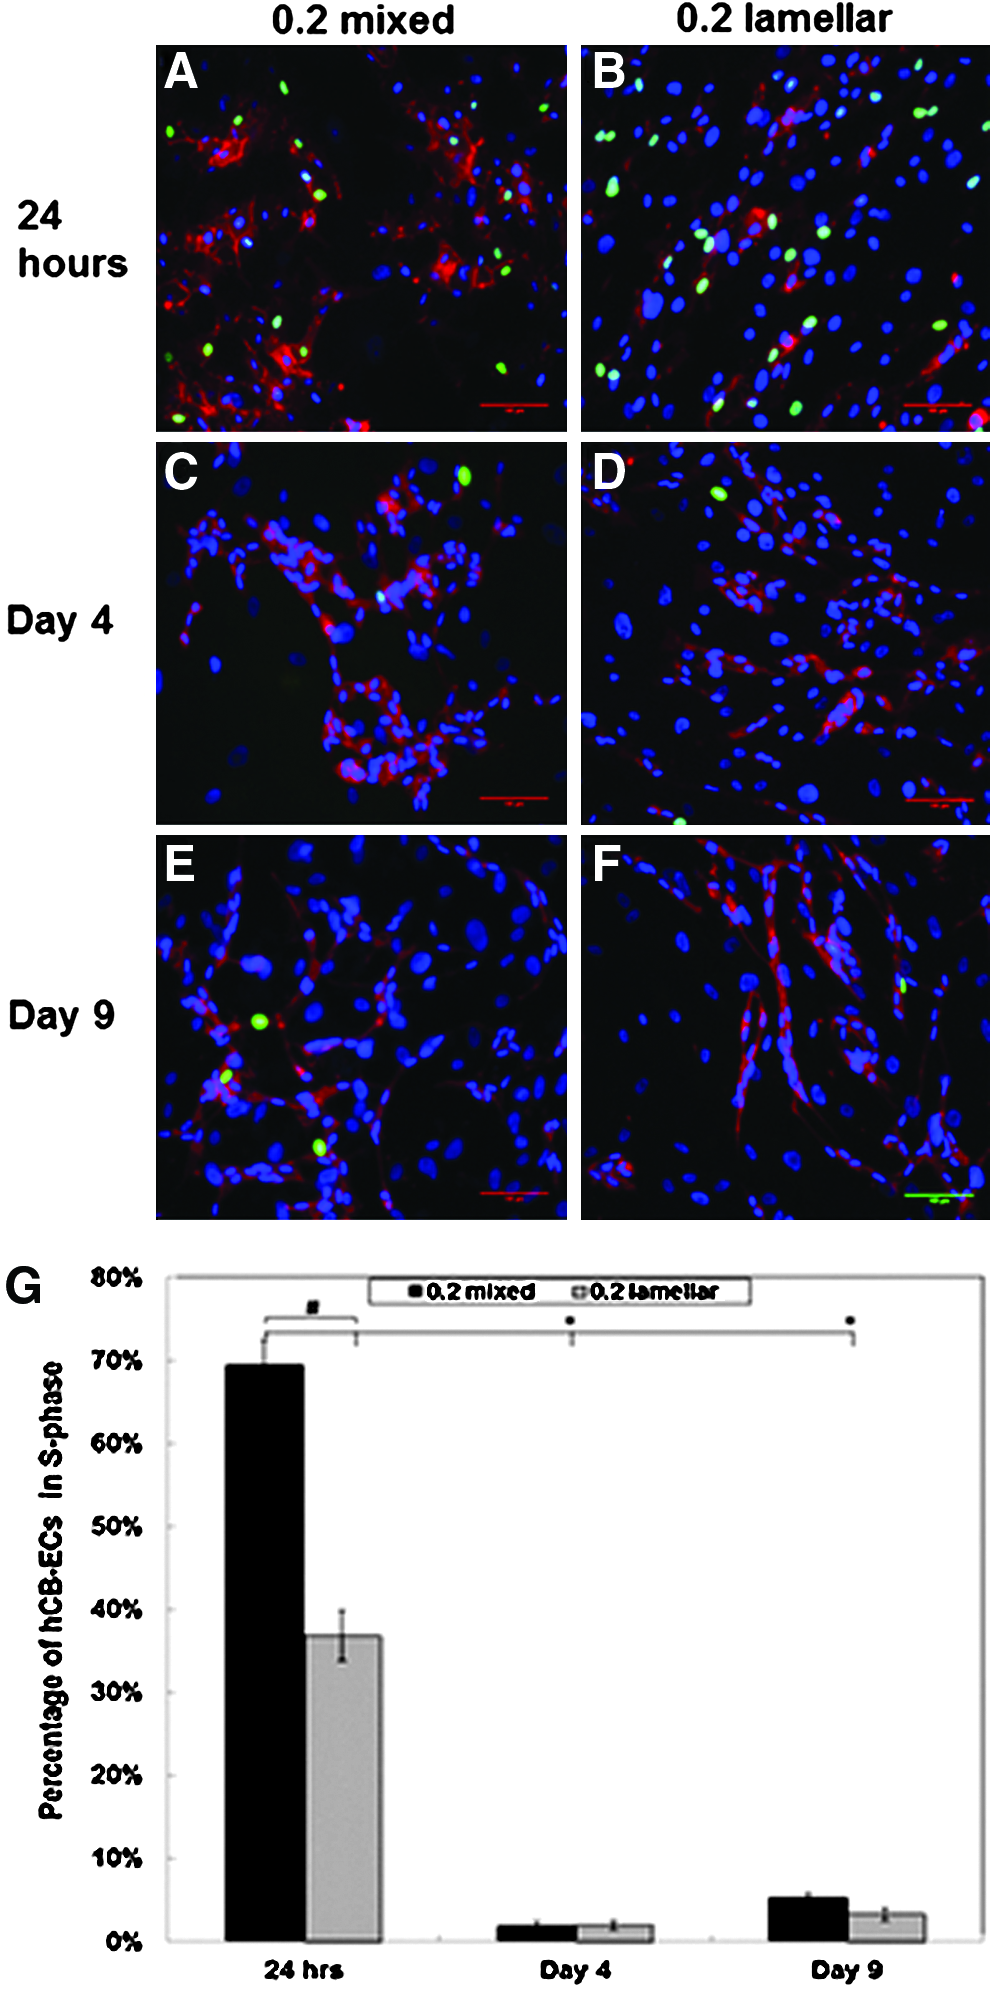
Representative images of EdU Assays at time points of 24 h for 0.2 mixed
To determine whether the EC source affects network formation, we compared networks formed by hCB-ECs and HAECs in a 0.6 ratio lamellar conditions (Supplementary Fig. S3). By day 12 of coculture, the capillary networks formed by hCB-ECs were comparable to those formed using HAECs in coculture. However, larger, more extensive EC clusters were observed at day 12 of cocultures with HAECs than with hCB-ECs.
While ECs formed clusters in both the mixed and lamellar systems, the number of clusters present declined with time and fewer clusters formed in the mixed systems than in the lamellar systems (Fig. 4). The clusters represent ECs not in the process of forming networks, and the decline in clusters indicates that over time most of the ECs form networks. By day 12 of coculture, the mixed systems had an average of about one EC cluster present per imaged field (0.07 cm2) in comparison to about eight EC clusters present per imaged field in the lamellar systems. These results demonstrate a greater uniformity of network formation in mixed cocultures in comparison to lamellar cocultures.

Number of EC clusters per field for mixed and lamellar cocultures differ. Image area is 0.07 cm2. n=24 images analyzed per condition. Error bars represent SEM. *Significance compared to 0.2 lamellar with p=0.0331 at day 3, p=0.0025 at day 6, p<0.0001 at day 12. #Significance compared to 0.6 hCB-EC lamellar with p=0.0006 at day 3, p<0.0001 at day 6, p<0.0001 at day 12. SEM, standard error of the mean.
To further characterize the networks formed, the percentage of area covered by tubes, the number of branch points, and the curvature between branch points were analyzed for day 12 images. At day 12, there was a greater image field area covered by tubes in the mixed coculture system than in the lamellar (Fig. 5A). The 0.6 lamellar conditions exhibited a higher area covered by tubes than did the 0.2 lamellar conditions (p=0.008). No difference in tube coverage was observed between the 0.2 and 0.6 mixed conditions.
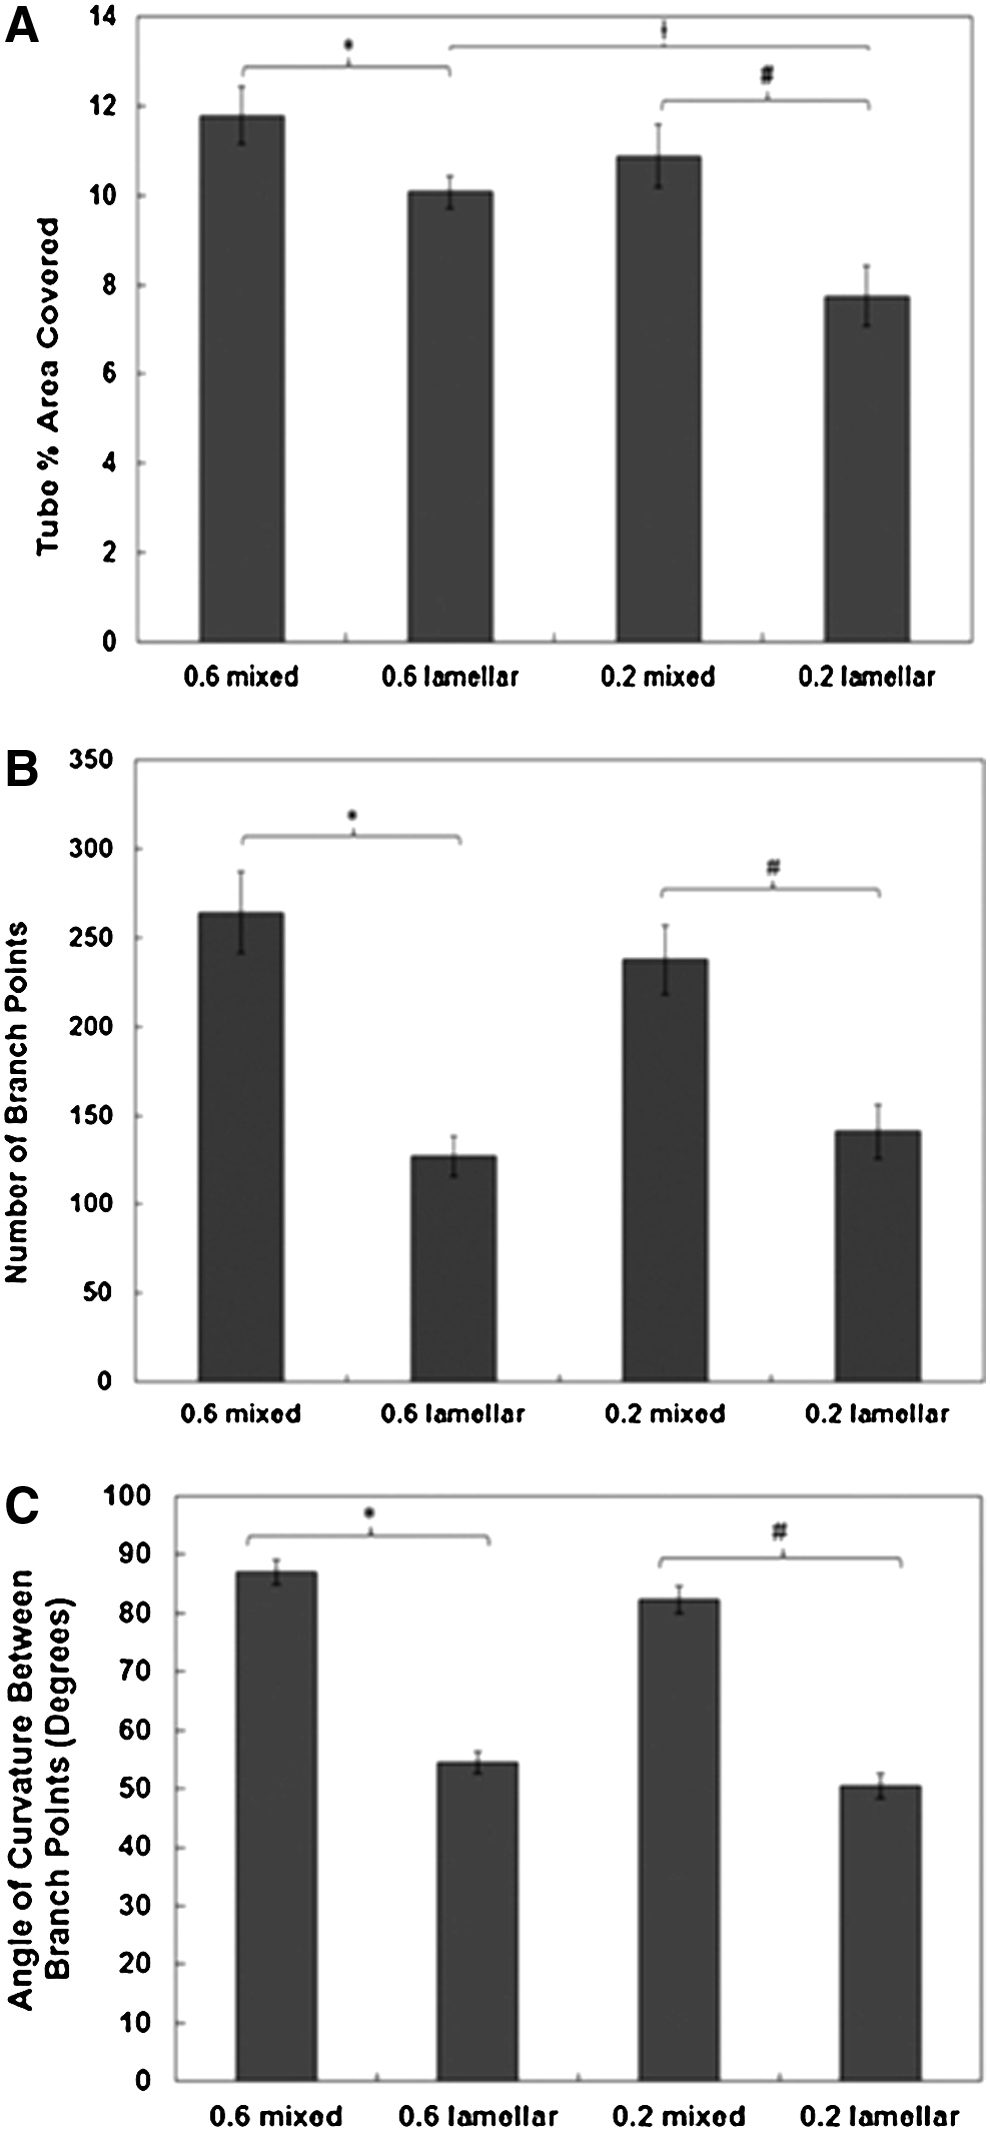
By day 12, the mixed coculture conditions had a greater number of branch points than the lamellar conditions of the same hCB-EC: SMC ratio (Fig. 5B). This result indicates a greater number of anastomoses in the mixed conditions than in the lamellar conditions. To quantify capillary loop formation of the networks, the angle of curvature between each branch point was measured. (Fig. 5C) The mean value for the mixed systems angle of curvature was about 85 degrees in comparison with 52 degrees for the lamellar systems. The higher angle of curvature indicates a greater capillary loop formation occurring in the mixed systems than in the lamellar systems.
Lower levels of angiogenic proteins in supernatant for 0.2 lamellar coculture compared to mixed coculture
Protein arrays were used to analyze 55 angiogenic-related proteins in the supernatant of mono- and coculture systems, 72 h postplating. Because the mixed systems appeared to have greater anastomoses and tube coverage compared to lamellar systems, we hypothesized that greater proangiogenic protein levels would be observed. Those angiogenic proteins that showed significant differences between the 0.2 ratios of mixed and lamellar cocultures are shown in Figure 6A. (Results for all proteins in the array are provided in the Supplementary Tables S1 and S2.) A statistically significant higher level of protein expression of inteleukin-8 (IL-8), insulin-like growth factor-binding protein 2 (IGFBP2), monocyte chemotactic protein 1 (MCP1), tissue inhibitor of metalloproteinase 1 (TIMP1), matrix metalloproteinase-8 (MMP8), fibroblast growth factor–acidic (FGF-Acidic), and FGF-basic was found in the 0.2 mixed versus the 0.2 lamellar systems. No differences in angiogenic protein levels in the supernatant were found when comparing the 0.6 ratios of mixed vs. lamellar conditions. Comparing the coculture conditions to hCB-EC and SMC controls, only the 0.2 mixed conditions increased the expression of IL-8, IGFBP2, and MCP1 compared to the hCB-EC control. In contrast, lamellar conditions contained lower levels of IL-8, MCP1, and IGFBP2 compared to monocultures of hCB-ECs and SMCs.
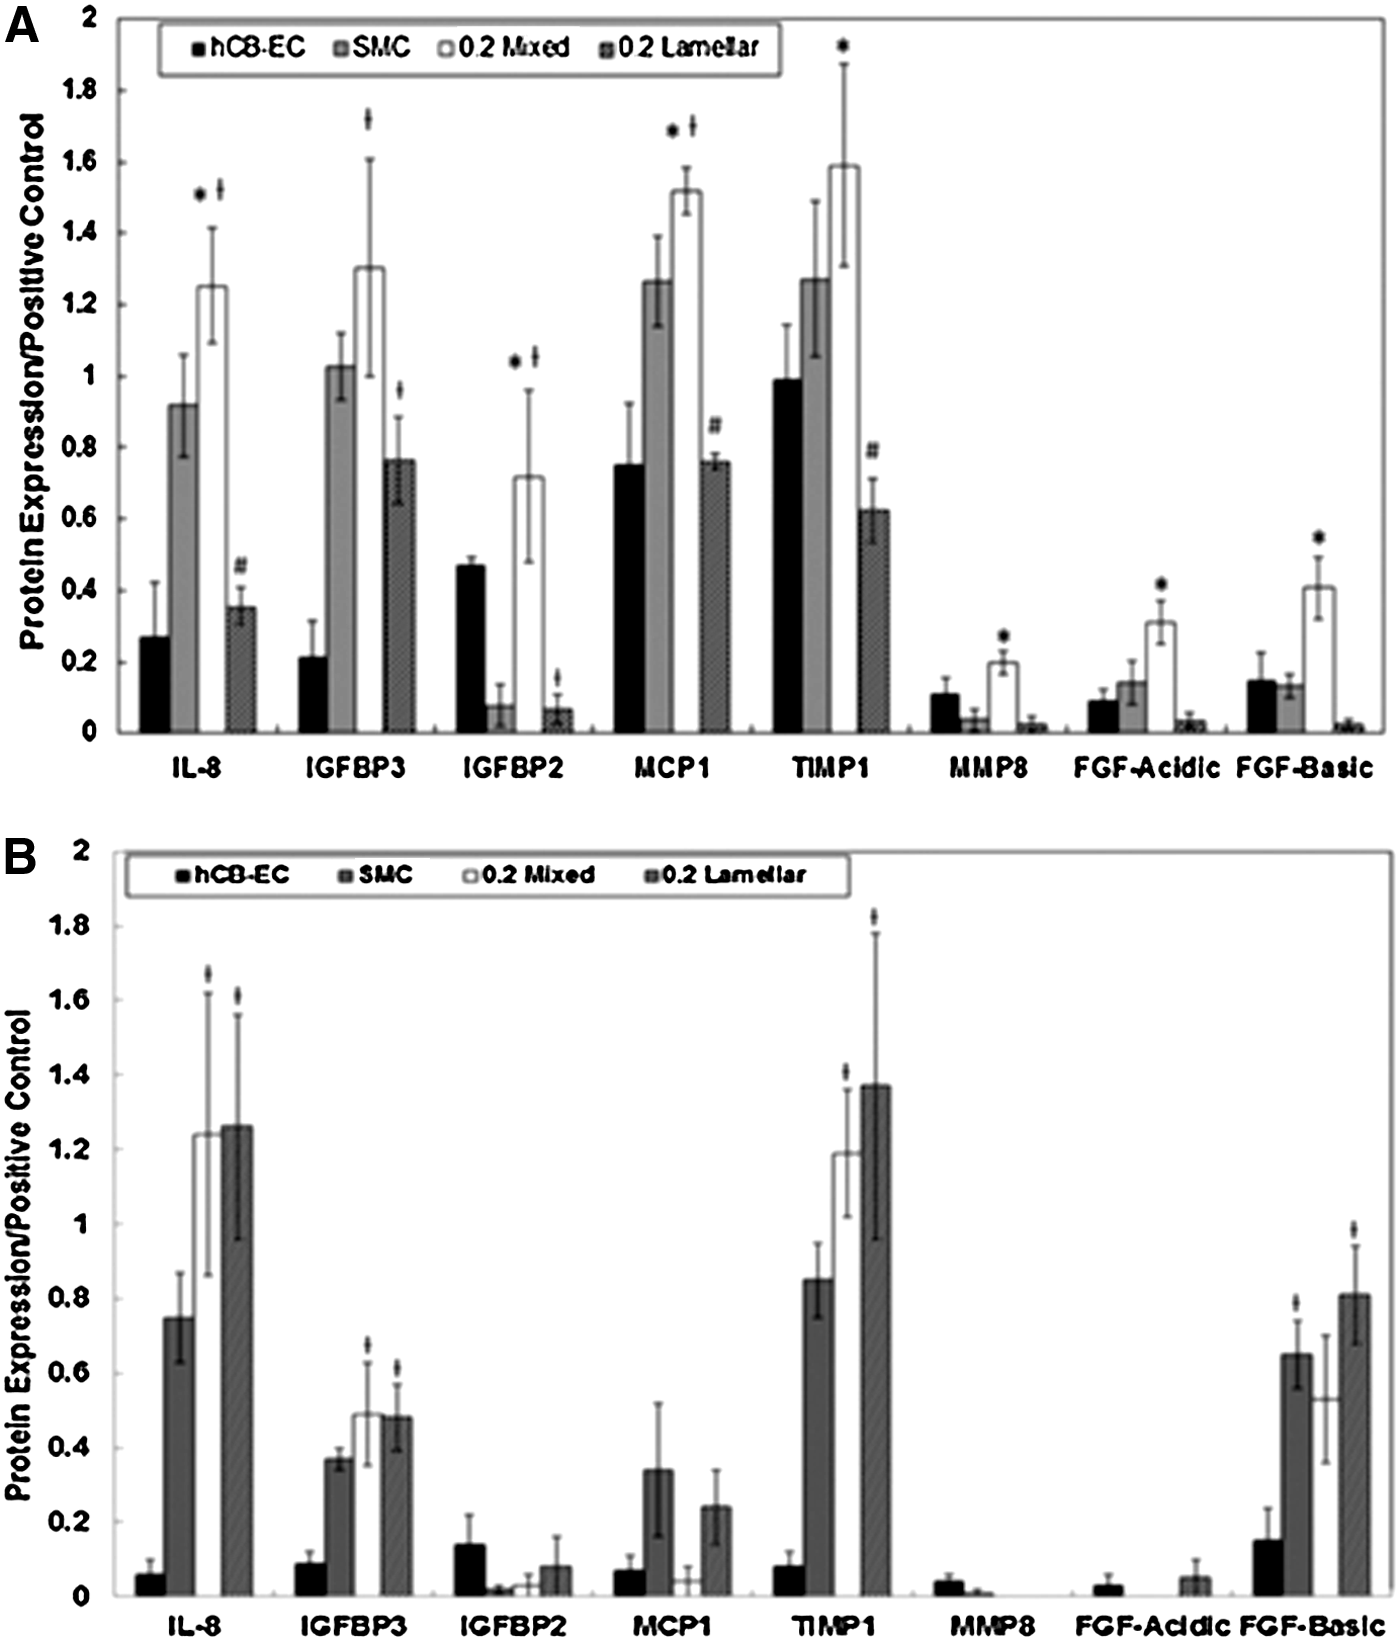
To gain further insight into the mechanism influencing the lower angiogenic protein levels in the supernatant, we used the protein arrays to measure intracellular concentrations of those proteins found to be significantly different in the supernatant at 72 h postplating (Fig. 6B). Although IL-8, IGFBP3, TIMP1, and FGF intracellular levels in cocultured hCB-ECs and SMCs at a ratio of 0.2 differed from levels in hCB-ECs monocultures, we found no difference in IL-8, IGFBP3, IGFBP2, MCP1, TIMP1, MMP8, FGF-Acidic, or FGF-Basic intracellular levels between mixed and lamellar systems.
Changes to the intracellular and supernatant levels could be due to alterations in protein synthesis or release by the source cells, uptake by the target cells or degradation in the media or by the target cells. Considering the various combinations of these four processes, the decrease in the supernatant levels and absence of change in the intracellular levels of proteins could arise from either an increased uptake by the target cells or degradation in the medium or by the target cells without alteration in the net rates of protein synthesis and secretion by the source cells or by a corresponding decrease in protein synthesis and secretion, but no change in uptake or degradation.
Comparing protein levels in the supernatant for the two EC:SMC ratios and the same coculture condition, IL-8 supernatant levels were greater for the 0.2 mixed than for the 0.6 mixed condition (Supplementary Fig. S4A), whereas IL-8 and MCP1 levels were greater for the 0.6 lamellar than for the 0.2 lamellar (Supplementary Fig. S4B). While VEGF present in SMC supernatant was greater than hCB-ECs or HAECs alone, there was no difference in VEGF levels among the various coculture conditions (Supplementary Table S1).
Comparing the effect of EC source on angiogenic protein secretion, hCB-ECs in coculture with SMCs had significantly higher solution levels of MCP1 (p=0.0421) and IL-8 (p=0.0304) than in cocultures using HAECs (Supplementary Fig. S5).
Discussion
In this study, we found that the spatial arrangement of hCB-ECs cocultured with SMCs influenced hCB-EC motility, the morphology of networks formed, and the expression of angiogenic proteins. The hCB-ECs cultured on SMCs in a mixed system had higher cell speeds, shorter persistence times, and lower random motility coefficients than ECs in a lamellar system. While SMCs in mixed and lamellar systems followed the same trend in speed and persistence time as hCB-ECs, their motility was much slower than the motility of hCB-ECs. By day 12 of coculture, mixed systems produced more uniform networks with fewer hCB-EC clusters than lamellar systems and mixed cocultures had more anastomoses, as inferred by the number of branch points, and more prominent capillary loop formation, as evidenced by the angle of curvature between branch points, than lamellar systems. For an hCB-EC:SMC ratio of 0.2, proangiogenic protein levels of MCP1, IL-8, and IGFBP-2 were greater than in monoculture for the mixed cocultures and less than in monocultures for lamellar cocultures. These data suggest that mixing ECs and SMCs together favors the formation of EC networks to a greater extent than a lamellar arrangement in which ECs form a cell layer above a confluent, quiescent layer of SMCs.
In vivo, stromal cells play an important role in capillary stabilization. Several studies have shown that mixing ECs with stromal cells promotes network formation and stabilization in vitro and when cells are injected into animals to promote revascularization.6,7,9,10 In this study, the capillary networks formed in cocultures of hCB-ECs and vascular SMCs were observable for nearly 2 weeks in culture, longer than any reported network formation formed in a Matrigel system6,7 and consistent with studies using cocultures of human umbilical vein EC and SMC.6,20 Interestingly, networks were observed to form in media containing no additional growth factors beyond those present in serum. Based on the previous studies we conducted, we observed growth factors reduced the rate of EC growth, but did not arrest growth as observed in the coculture conditions of this study.22,25 A decrease in EC proliferation during network formation is consistent with angiogenesis observed in vivo and may support a stable and quiescent state for capillary networks. 26 These results suggest that coculture is a suitable way to promote stable EC networks in vitro.
The optimal coculture ratio for promoting microvessel formation has been an area of interest in tissue engineering.12,21 In our study, we observed a similar extent of image area covered by capillary networks in 0.2 and 0.6 mixed condition, while lamellar conditions had a significantly lower coverage in the 0.2 versus 0.6 lamellar conditions. This difference between mixed and lamellar conditions may be due to the difference in hCB-EC proliferation for the 0.2 ratio during the first 24 h after forming the cocultures. These results suggest that a mixed spatial arrangement reduces the total number of ECs required for tissue engineering microvessels.
Although the dynamics of network formation differ between coculture and monoculture systems exposed to a growth factor gradient, 13 we note several common features in cell migration between these two conditions. The speed and persistence time of hCB-ECs in mixed and lamellar cocultures are similar to values found by Stokes for ECs seeded without agarose overlays. 13 The random motility coefficients for hCB-ECs in the current study were an order of magnitude smaller than the values for ECs reported by Stokes et al. 13 The cell seeding density of ECs in the current study (80,000 cells/cm2) is higher than the density in the study by Stokes et al. 13 (400 cells/cm2) and may account for this difference since a lower number of cells reduces the number of collisions and resulting change in cell direction. Consistent with the results of Stokes et al., 27 we found an association between longer persistence times and parallel growth of blood vessels.
We found that the hCB-ECs in the mixed system have much lower motility coefficients than the lamellar systems or hCB-ECs alone. Thus, collisions with SMCs in the mixed system are likely causing a decrease in the motility coefficient and persistence time of hCB-ECs without affecting speed. These findings are consistent with our hypothesis that mixed systems provide more contact between SMCs and ECs than lamellar systems, facilitating assembly into capillary networks.
The lower levels of proangiogenic proteins FGF-Acidic, FGF-Basic, IGFBP2, IL-8, MCP1, MMP9, and TIMP1 in the 0.2 lamellar system in comparison to the 0.2 mixed system is consistent with the lower extent of network formation shown at day 12. These proteins are known to be involved in cell migration. 28 MCP1 induces chemotaxis of both SMCs and ECs and mediates mural cell recruitment to stabilize newly formed blood vessels.29,30 Inhibition of IL-8 blocks IL-8-mediated capillary tube formation, while addition of exogenous IL-8 to ECs inhibits ECs apoptosis and enhances antiapoptotic gene expression. 31 IGFBP is a pleiotropic factor involved in cellular proliferation, motility, and differentiation of microvessel ECs and SMCs.32–38 IGFBP2 enhances the cellular invasive capability and upregulates invasion-enhancing proteins, such as MMP2.33,36–39 The invasiveness of cells parallels many of the processes in angiogenesis, such as the loss of tumor suppressor genes APC, PTEN, and p53 as well as activating similar signaling pathways and their downstream effectors. 40 TIMP1 inhibits the MMP8 protein, which degrades collagen I, II, and III to enable tissue remodeling. 41 FGF-Acidic is a potent mitogen for ECs. 42 FGF-Basic induces ECs migration and invasion. 43
The spatial arrangement of ECs and SMCs and differences in cellular synthesis, secretion, uptake, or degradation affect the growth factors concentration and concentration gradients. A significant increase in the rate of cellular uptake of FGF-basic in ECs can decrease vessel density, self-loop formation, and migration speed of vascular networks by altering the gradient to which ECs respond. 44 Given that at least four different processes are operational (synthesis and release by source cells, uptake by target cells, and degradation in the medium or target cells) and assuming sufficient time to reach steady state, we could reduce the possible explanations of the data to either increased uptake or degradation with no net changes in the rates of synthesis or secretion by the target cells or an equivalent decrease in synthesis and release with no change in uptake or degradation. Additional experiments are needed to distinguish between these possibilities. For the mixed system, the arrangement of the ECs and SMCs facilitates the production of local concentration gradients that may affect motility, whereas with the lamellar system, no such gradient would be established because the ECs are all on the surface of the SMC layer. Thus, changes in the spatial arrangement of cells can significantly affect the levels and gradients of angiogenic proteins.
Based on these results, we hypothesize that the mixed coculture system enhances EC network formation due to the greater number of collisions between the ECs and SMCs. The collisions facilitate changes in the protein secretion of cells, resulting in the higher level of cytokines released in the mixed system, thus enabling ECs to rapidly form networks.
Conclusions
This is the first study investigating the effect of mixed and lamellar EC-SMC coculture spatial arrangements upon microvasculature formation in vitro. We found that mixed systems provide a more favorable environment for network formation by producing more uniform, anastomosed networks with greater capillary loop formation and levels of proangiogenic proteins than lamellar systems. The lamellar systems inhibit network formation with the presence of EC clusters, parallel vessel growth with less anastomosis and decreased supernatant levels of angiogenic proteins IGFBP2, IL-8, and MCP1. Through the results of this study, we establish spatial arrangement of coculture systems as a means to regulate the design of tissue-engineered capillaries. Future studies can apply these findings by seeding mixed cocultures on tissue-engineered constructs to promote network formation. Further work can also be done to investigate the metabolic differences of angiogenic proteins in coculture systems.
Footnotes
Acknowledgments
The authors would like to thank Yasheng Gao from the Duke University Light Microscopy Core Facility for help with the live cell imaging assays. The work was supported by the NIH grant 88825, the W.H. Gardner, Jr. Society of Engineering fellowship and an NSF graduate Research Fellowship to E.B.P. and Flight Attendant Medical Research Institute: Young Clinical Scientist award to N.C. This study is dedicated to the living memory of Kyoung Ok Cho.
Disclosure Statement
No competing financial interests exist.
References
Supplementary Material
Please find the following supplemental material available below.
For Open Access articles published under a Creative Commons License, all supplemental material carries the same license as the article it is associated with.
For non-Open Access articles published, all supplemental material carries a non-exclusive license, and permission requests for re-use of supplemental material or any part of supplemental material shall be sent directly to the copyright owner as specified in the copyright notice associated with the article.