
Abstract
When prospectively applied for regenerative therapies, human bone-marrow-derived mesenchymal stem cells (hMSCs) interact with the locally residing host cells. With respect to the developmentally particular origin of oral cells, little is known about the putatively discriminative behavioral responses of hMSCs in interaction with various oral cell types, including human alveolar bone osteoblasts (hOAs), periodontal ligament fibroblasts (hPDLs), and gingival fibroblasts (hGFs). To assess the crosstalk between hMSCs and oral cells, interactive cocultures were established by combining well-characterized hMSCs with hOAs, hPDLs, or hGFs, and the behavioral hMSC aspects, that is, proliferation and gene expression, were measured by employing a 5-bromo-2′-deoxyuridine assay and real-time polymerase chain reaction, while apoptosis was quantified by in situ cell death detection kit. hMSCs expressed the typical antigen spectrum lacking CD34, CD45, CD14, CD19, and HLA-DR, while expressing CD73, CD90, and CD105, and could successfully be transformed into adipocytes, osteocytes, and chondrocytes. Monocultured control hMSCs proliferated readily, whereas a general reduction of BrdU-labeled cells was observed in cocultures. Globally, upon extending time periods, interactive coculture combinations of hMSCs with hOAs reduced both osteogenic gene and stem cell marker transcription in hMSCs, a phenomenon appearing less pronounced by combining hMSCs with hPDLs, such that the observed effects in terms of proliferation and gene expression followed the same ranking: hOAs>hGFs>hPDLs. Vice versa, in interactive hMSC cocultures, the cell survival rate was significantly increased, irrespective from the combined coculture cell counterpart. Our results show for the first time that behavior of hMSCs reflected by proliferation and gene expression was governed by interaction with various oral cells in a cell-type-discriminative manner. In addition, hMSC coculture restrains apoptosis, such that influences on cell behavior appear as a crosstalk. In summary, interactive cocultures render the basis for a prospective prediction of mutual cell behavior in hMSC-based oral tissue regeneration disclosing that oral cells shift hMSC behavior from proliferation to differentiation and apoptosis-repressing features.
Introduction
Materials and Methods
All chemicals were purchased from Sigma Aldrich GmbH, Munich, Germany, unless otherwise indicated. For a detailed description of the experiments performed, see the “Supplementary Materials and Methods” section.
Cell isolation and culture
All experiments have been carried out in accordance to the guidelines of the World Medical Association Declaration of Helsinki and were approved by the Committee of Ethics of the Medical Faculty of the Albert Ludwigs-University Freiburg, Germany (EK-199/09). Primary hMSCs were purchased (PromoCell, Heidelberg, Germany) at passage 2; cultivated in hMSC proliferation medium supplemented with 10% fetal calf serum, 50 ng/mL amphotericin, and 50 μg/mL gentamicin (all from Provitro, Berlin, Germany); and passaged for four to six additional times.
For each oral tissue, three primary cultures derived from operative biopsies of four individual patients (n=12 in total) were established using the explant technique. 15 In brief, tissue specimens were painstakingly separated from contaminating tissue fragments if present, minced, plated as explants, and kept under standard culture conditions in low-glucose Dulbecco's modified Eagle's medium (containing 25 mM HEPES and L-glutamine; PAA, Pasching, Austria) supplemented with 10% fetal bovine serum (FBS; Biochrom, Berlin, Germany), 1% kanamycin, and 1% glutamax (Invitrogen, Darmstadt, Germany) until cell outgrowth. Due to small tissue specimen quantities, the outgrowing cells were expanded in number by subsequent passaging (hOAs: 5–7 passages; hPDLs: 7–12 passages; and hGFs: 7–9 passages) and their ability to synthesize mineralized matrix was routinely checked thereafter.16,17
Interactive coculture systems
For the generation of interactive coculture systems, hMSCs were established in 96-well plates at a density of 0.15×10⁵ cells/cm2 for proliferation assessment and in 12-well plates at a density of 0.25×10⁵ cells/cm2 for gene expression analysis. The oral cells were inoculated at 5×10³ cells/96-well insert or 4×10⁵ cells/12-well insert in compatible culture inserts with a porous uncoated poly (ethylene terephthalate) (PET) membrane (3.0 μm), thus facilitating their interactive crosstalk with hMSCs for the respective culture periods and the subsequent examination of BrdU incorporation or mRNA expression in hMSCs devoid of oral cell BrdU or mRNA contamination, respectively. For the generation of cell-containing matrices, hMSCs were suspended in FBS and added to a collagen I solution (4 mg/mL; Life Technologies, Darmstad, Germany) supplemented with 10% Hank's buffered salt saline. The resulting gel was titrated with sodium hydroxide to pH 7.4 and polymerized for 2 h at 37°C, covered with culture medium, supplied with oral cells on the gel surface after 24 h, and lifted to 1.0 μm PET membrane cell culture inserts (Millipore, Schwalbach, Germany) after 48 h in order to guarantee an optimal all-side culture medium nutriment supply during a culture period of 21 days. All cell cultures of each specimen and combination were run in duplicate for all experiments.
Basic cell characterization
Differentiation assays
Medium supplements were used to induce the differentiation of hMSCs into osteoblasts, adipocytes, or chondrocytes. The hMSC-derived adipocytes' lipid vesicles were visualized by Oil Red-O staining and indirect immunofluorescence labeling of lipid-droplet-associated perilipin; the amount of extracellular matrix calcium deposits induced during the osteogenic differentiation was assessed by von Kossa and Alizarin red staining; and the chondrogenic differentiation was evaluated by Safranin-O staining and indirect immunofluorescence labeling of cartilage-specific proteoglycan aggrecan according to established protocols. In addition, the hMSC differentiation was verified by quantitative polymerase chain reaction (qPCR) (for further details, see the “Supplementary Materials and Methods” section).
Flow cytometry
For each run, a total of 1×10⁶ cells were incubated with a final concentration of 5 μg/mL each of fluorescein isothiocyanate–, phycoerythrin-, or allophycocyanin-conjugated mouse anti-human CD34, CD45, CD14, CD19, HLA-DR, CD73, CD90, CD105, and CD166 antibodies (BD Biosciences, Heidelberg, Germany), or isotype-matched controls, respectively (20 min, 4°C in the dark). After intense washing and resuspending in phosphate-buffered saline (PBS), flow cytometric analysis was performed using an FACSCalibur (BD Biosciences) flow cytometer. Data were collected and analyzed with CellQuest software (BD Biosciences). For each run, 10,000 cell events were gated and fluorochrome spectral overlap was checked and compensated whenever required.
Proliferation assay
The BrdU incorporation into newly synthesized DNA in interactive cocultures was measured using a cell proliferation enzyme-linked immunosorbent assay (ELISA) kit (Roche, Mannheim, Germany) according to manufacturer's instructions. In brief, cells were fixed and DNA was denatured with a one-step ready-to-use solution supplied by the kit for 30 min at room temperature (RT). After thoroughly removing the solution, a peroxidase-labeled anti-BrdU antibody was added (1:100, 90 min, RT). The immune complexes were detected by adding tetramethyl benzidine (30 min, RT), the substrate reaction was stopped by adding 1 M sulfuric acid (1:5), and the reaction product was quantified by immediately measuring the absorbance at 450 nm (reference wavelength 690 nm).
Quantitative real-time PCR
After accurately washing the cells with PBS, total cellular RNA was purified separately from both coculture layers using a guanidium–thiocyanate method (RNeasy Mini kit; Qiagen, Hilden, Germany) and stored at −80°C. Genomic DNA contamination was eliminated by DNase digestion according to manufacturer's instructions (RNase free DNase kit; Qiagen). The RNA integrity and quantity were verified using the Experion RNA StdSens chip microfluidic technology and cDNA was synthesized from 500 ng of total RNA by using the iScript reaction mix (Bio-Rad, München, Germany). For real-time PCR, cDNA samples were amplified in duplicate in a 25 μL reaction mixture using pre-validated RT2 qPCR primer assays (SABiosciences, Frederick, MD) with a iQ-SYBR Green Super Mix (Bio-Rad). Data were collected and analyzed using the CFX96 Manager Software version 1.0 (Bio-Rad).
Cell survival assay
For in situ cell death detection, cryosections from each interactive coculture gel were stained by using an in situ apoptosis detection kit (Roche). Briefly, DNA strand breaks of apoptotic cells were visualized by terminal deoxynucleotidyl transferase (TdT) dUTP nick end labeling (TUNEL reaction). Specimens were fixed, permeabilized, and incubated with TdT-label solution for 60 min at 37°C in the dark. After counterstaining with 4′,6-diamidin-2-phenylindole (DAPI), specimens were mounted (Fluoromount G; Southern Biotech, Birmingham, AL) and photographed and analyzed with a Biozero BZ-9000 fluorescence microscope and software (BZ-II Analyzer software; Keyence Corp., Neu-Isenburg, Germany).
Statistical analysis
To evaluate the effect of groups and time, a repeated measures analysis was performed for each outcome of interest. To this purpose, one linear model per outcome was fitted within which the structure of data, that is, repeated measurements per group (at several time points), was accounted for. Group effects and differences of least squares mean (LSM) were calculated with their 95% confidence intervals. Multiple comparisons of LSM in group and time combinations were performed and accordingly adjusted p-values were considered significant when p<0.05. All calculations were performed with the statistical software SAS 9.1.2. using PROC MIXED.
Results
hMSCs fulfill the standard characterization criteria
Dealing with MSCs, the current terminology is confusingly heterogeneous. 18 Hence, we employed the standard hMSC characterization criteria of the International Society for Cellular Therapy for hMSCs that were subsequently employed for cocultures (Supplementary Figs. 1A, B and 2A, B; Supplementary Data are available online at www.liebertpub.com/tea).
Expression of surface markers
Flow cytometry screening of four to six times passaged hMSCs revealed that the cells were reasonably homogeneous in size and granularity and positively expressed CD73, CD90, CD105, and CD166, but were neither labeled for CD34 and CD45 (Supplementary Fig. 1A) nor for CD14, CD19, and HLA-DR (Supplementary Fig. 2B), reflecting the typical spectrum of hMSC surface molecules.
Plastic adherence and colony formation
The hMSCs were supplied as adherent cells within a cell culture device and did not hesitate to adopt a polymorphous and elongated polygonal shape and to proliferate well, while emanating from cell colonies at early stages (Supplementary Fig. 1B).
Multilineage differentiation
The hMSCs were successfully transformed into adipocytes, osteoblasts, or chondrocytes. After 21 days of differentiation induction, the abundant number of hMSC-derived adipocytes was easy to identify by Oil Red-O stains of their huge lipid droplets (Supplementary Fig. 1B), quantification of peroxisome-proliferator-activated receptor-γ mRNA (Supplementary Fig. 2A1, A2), and staining of lipid-droplet-associated protein perilipin (Supplementary Fig. 2A3). When induced by transforming growth factor-β, hMSCs expressed remarkable quantities of collagen 2a1 mRNA (Supplementary Fig. 2B1, B2) and their extracellular matrix comprised acid mucopolysaccharides as revealed by Safranin-O and indirect aggrecan immunofluorescence stains (Supplementary Figs. 1B and 2B3), indicating a chondrogenic differentiation. Osteogenic induction resulted in higher amounts of osteopontin (OPN) mRNA expression (Supplementary Fig. 2C1, C2) and huge amounts of extracellular matrix calcium deposits visualized by von Kossa and Alizarin red staining (Supplementary Figs. 1B and 2C3).
Interactive oral cell coculture seriously restricts the proliferation of hMSCs
Behavioral cell reactions to environmental stimuli appear in multiple ways. With respect to the potential in vivo interaction with oral tissue cells, we therefore addressed the proliferation and gene transcription of hMSCs upon interactive coculture with hOAs, hPDLs, and hGFs.
The baseline proliferation of control hMSCs was determined by means of measuring BrdU incorporation at 1, 3, 7, 10, and 14 days of culture. We found that proliferation in solitary grown control hMSCs appeared in a peak-to-valley manner. Herein, compared with day 1, the BrdU incorporation was significantly increased at days 3 and 7 (Fig. 1, solid line), while being declined at days 10 and 14. This hMSC proliferation dynamics suggests a progressive decline in mitotic activity with extending culture periods.
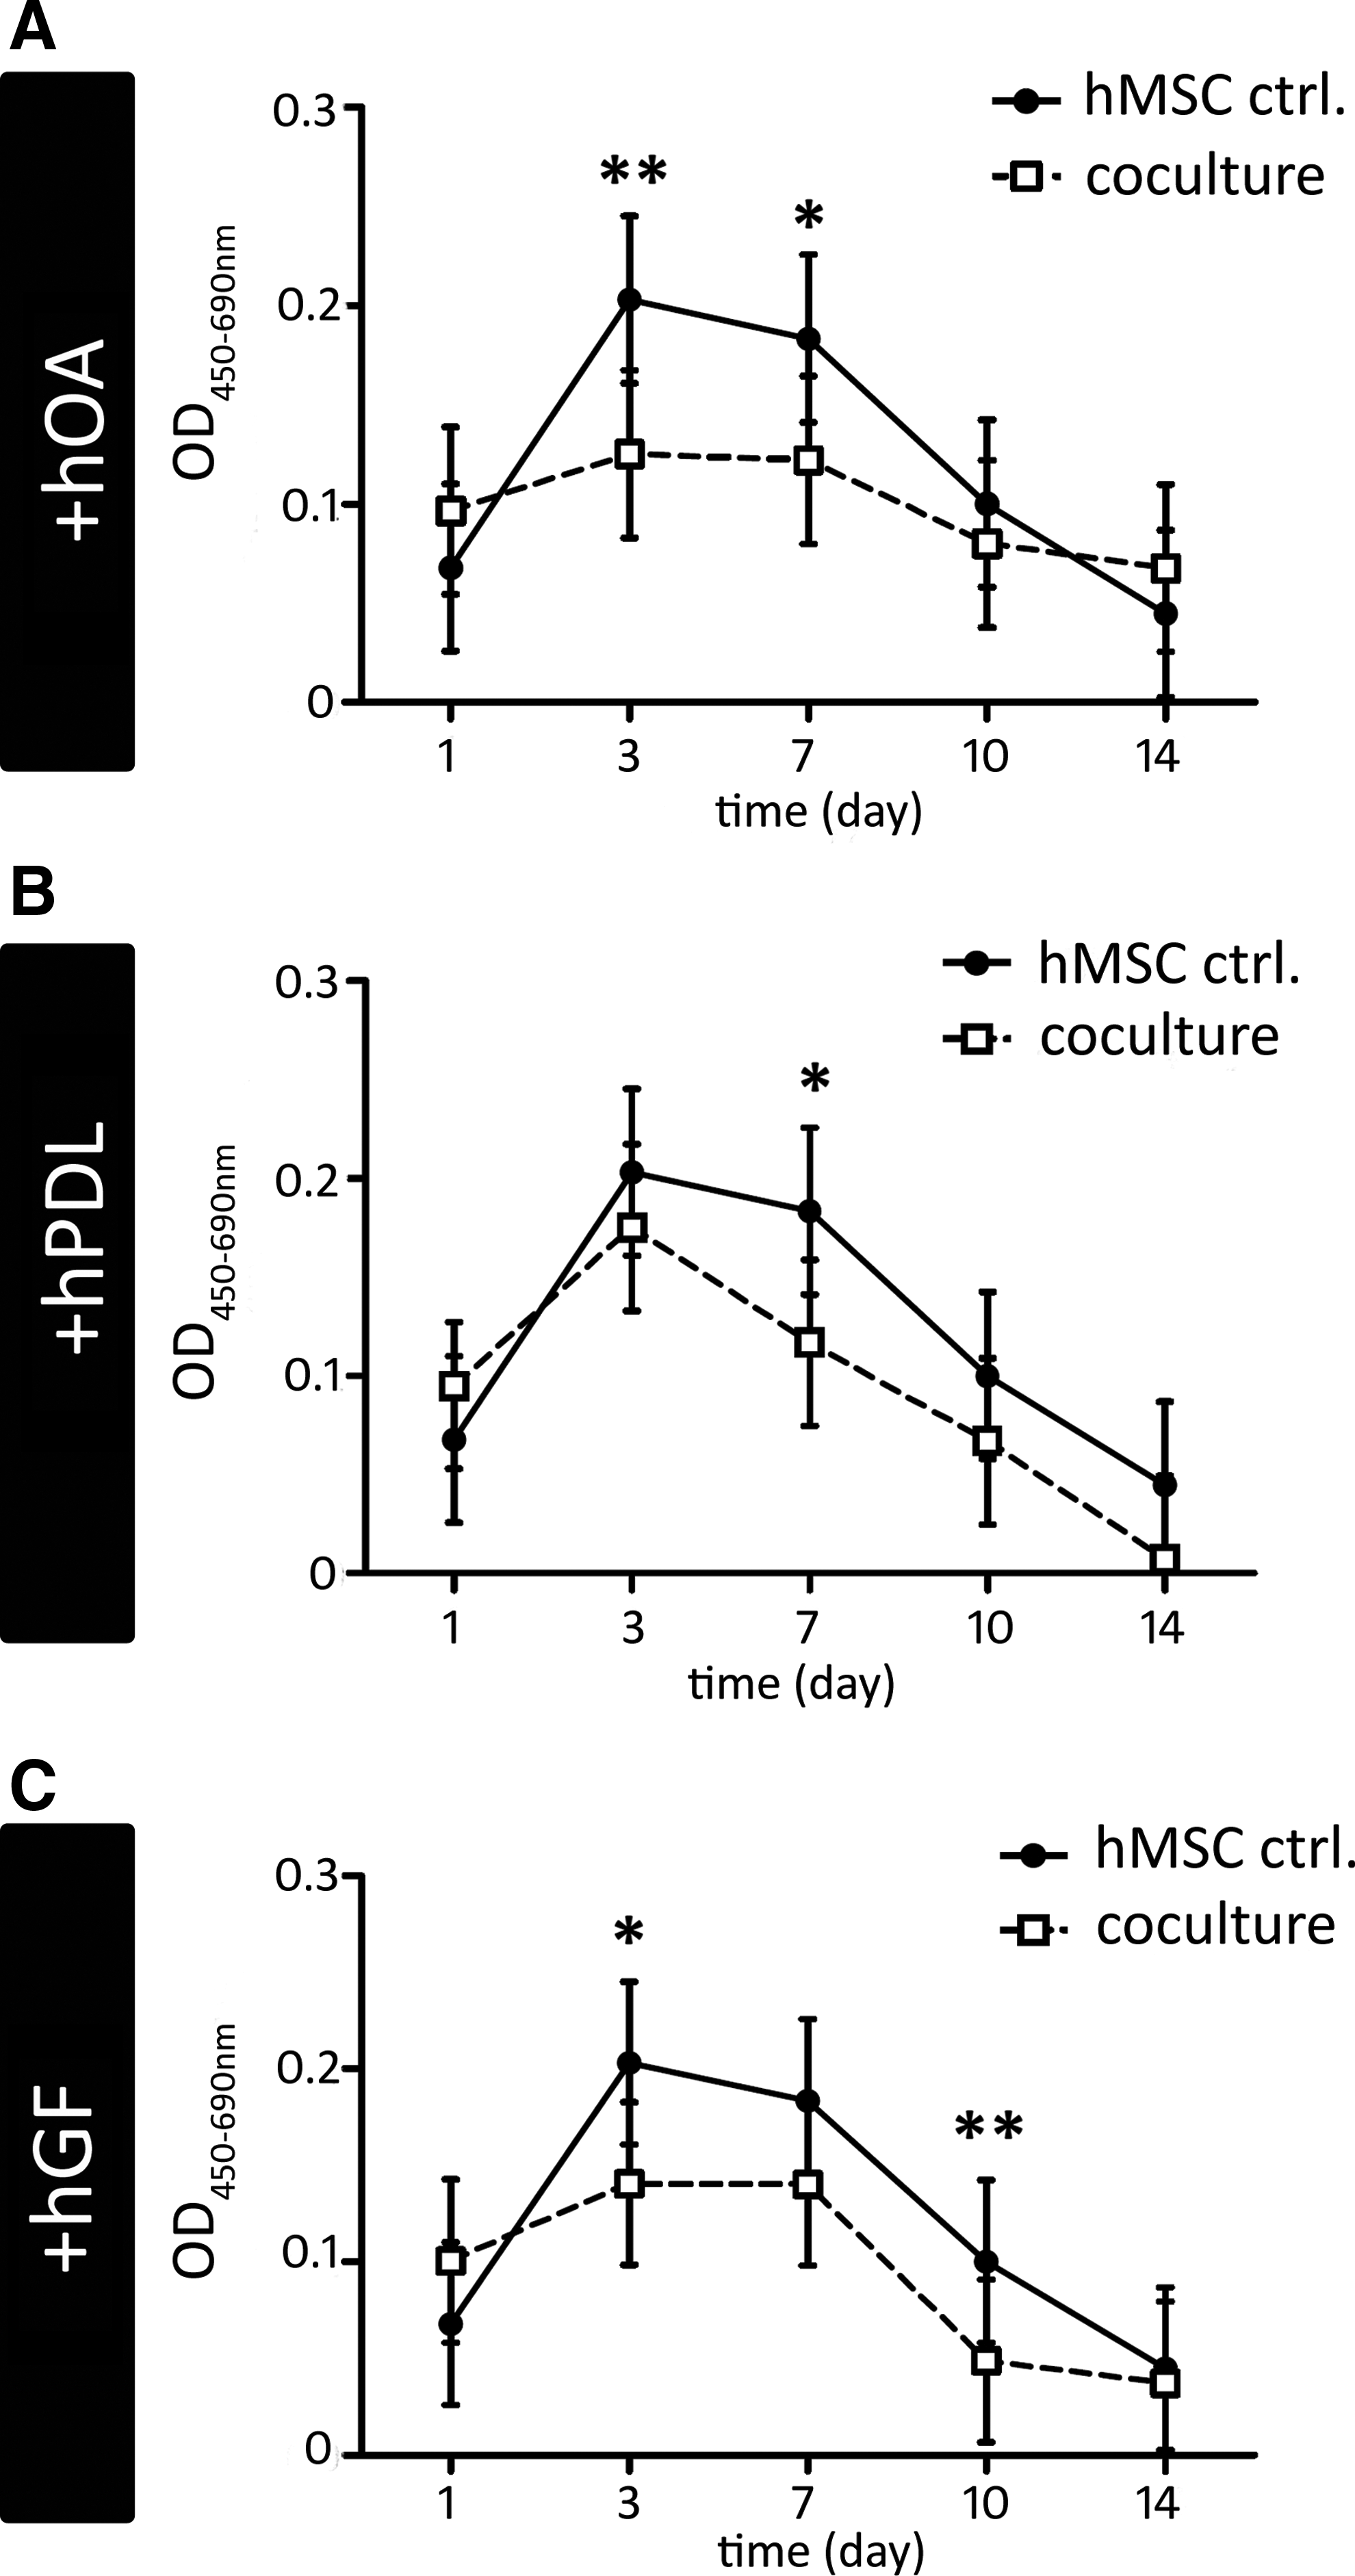
Proliferation dynamics of human bone-marrow-derived mesenchymal stem cells (hMSCs) in response to interactive oral cell coculture. Line graphs showing the least squares mean bromodeoxyuridine (BrdU) incorporation with 95% confidence intervals measured as optical density units (y-axis, 450 nm: measuring wavelength, 690 nm: reference wavelength) of control hMSCs (black dots, connected by a black line) and hMSCs cocultured with
Interactive coculture with oral cells generally yielded a striking reduction of hMSC proliferation from the beginning. In detail, in hOA-cocultured hMSCs, the mean BrdU incorporation was significantly reduced at all time points under study (Fig. 1, dashed line), thereby completely leveling out the peak-to-valley dynamics previously described for control hMSCs. An interesting issue concerns the interculture mode comparison, revealing that in cocultures, hMSCs at days 3 and 7 displayed significantly lower levels of proliferating cells [Fig. 1; compare white rectangles (hOA/hMSC cocultures) with black dots (control hMSCs), at days 3 and 7]. This finding may indicate a restriction in hMSC proliferation, due to coculture-innate cell-to-cell interactions. Regarding the obvious proliferation-restrictive effect of a cocultured oral cell counterpart, hMSC proliferation was diminished fairly similarly in interaction with hPDLs (Fig. 1B), and even more pronounced with hGFs (Fig. 1C; compare white rectangles with black dots in Fig. 1B, C, respectively). This pattern points to a ranking in the proliferation restriction, depending on the type respective cocultured cell type by prioritizing hOAs, followed by hGFs and hPDLs.
Interactive coculture with oral cells influences the gene expression in hMSCs
Keeping in mind that oral cells affected hMSC proliferation, we next assessed the interactive coculture impact on hMSC gene expression. For this purpose, the expression of a panel of stemness- and osteogenic differentiation-associated genes was monitored at baseline, day 7, and day 14. Similar to the time course of BrdU incorporation, the gene expression in control hMSCs globally appeared in a peak-to-valley manner or remained unchanged after day 7.
hOA coculture rectifies and hPDL coculture restores the transcription of stemness-associated genes in hMSCs
The baseline transcription of the stemness-associated genes under study tended to decrease with prolonged culture period in solitary grown control hMSCs. Interactive coculture yielded a striking modification of the gene expression gradient, as shown in Figure 2. The most interesting findings with matched controls were that interactive hOA coculture displayed an alternative gene expression slope with respect to stemness-associated gene expression, that is, declining in a continuously linear manner. By contrast, interactive hPDL coculture provoked a peak-to-valley pattern that was even more pronounced than in control hMSCs, while hGF coculture yielded a gene expression pattern similar to control.

Expression of stem-cell-associated mRNA in hMSCs relative to interactive oral cell coculture. Least squares mean ΔCt values with 95% confidence interval of control hMSCs (top row) and of interactive hOA (second row), hPDL (third row), and hGF (bottom row) cocultures, respectively, each at day 0 (baseline, represented by a dotted line), day 7, and day 14 (right y-axis, gradient represented by dashed line). The Ct values of the respective gene of interest
In detail, the expression of POU domain class 5 transcription factor 1 (POU5F1) was significantly lowered at days 7 and 14 in control hMSCs (Fig. 2A). Interactive hOA coculture entailed a delayed (day 7), but finally significant downregulation of the POU5F1 expression (Fig. 2A), while the latter appeared recovered in hPDL coculture (Fig. 2A), but similar to control in hGF coculture (Fig. 2A).
Transcription factor homeobox protein Nanog remained quite constant in control hMSCs (Fig. 2B). In interactive hOA coculture, Nanog expression was downregulated by trend, while in hPDL cultures it appeared significantly increased at day 14, and hGF coculture trended to augment Nanog transiently (Fig. 2B).
The downregulation of ATP-binding cassette sub-family G member 2 (ABCG2) expression appeared in outlines in control hMSCs (Fig. 2C). Only interactive hOA coculture yielded a significant downregulation of ABCG2 transcription at day 14, during a linear gene expression decrease (Fig. 2C). In contrast, interactive hPDL coculture almost recovered ABCG2 expression (Fig. 2C), while it was fairly unaltered in hGF coculture (Fig. 2C).
Stem cell growth factor receptor, also known as tyrosine protein kinase kit (c-kit), was expressed in a peak-to-valley manner being significantly downshifted at day 7 but reinforced at day 14 in control hMSCs (Fig. 2D). Interactive hOA coculture showed abolishment of this alternating trend, by yielding a continuously significant c-kit expression decrease, such that the interculture comparison resulted in a significant diminishment (Fig. 2D). In interactive hPDL culture, peak-to-valley pattern of c-kit appeared re-intensified (Fig. 2D), while hGFs as interactive partner resulted in significant c-kit expression decrease (Fig. 2D).
Similar to POU5F1, the transcription of leukemia inhibitory factor (LIF) was significantly decreased in control hMSCs at days 7 and 14 (Fig. 2E). Precisely, in interaction with hOAs, significant downshifting of LIF expression was prevented, while we observed significant LIF downregulation in hPDL coculture at day 7 and a continuous and the overall strongest LIF downregulation in hGF coculture (Fig. 2E).
These findings may indicate an alteration in the hMSC gene expression profile, due to coculture-dependent cell-to-cell interactions. Intriguingly, the mode of transformation in gene expression of the respective cocultured oral cell type implicates a ranking in gene expression modification with emphasis on hOAs, followed by hGFs and finally hPDLs.
Interactive hOA coculture decreases the expression of osteogenic genes in hMSCs
The transcription of genes correlated with an osteogenic differentiation was either stable or increased with prolonged culture period in solitary grown control hMSCs. Therefore, we were interested in seeking for putative gene transcription modulation under interactive coculture conditions. In fact, we found that the earlier-mentioned trend was mostly counteracted by interactive hOA coculture, which interestingly tended to decrease the osteogenic gene expression, while hPDL and hGF cocultures yielded a virtually unaltered gene expression profile if compared with control hMSCs.
The runt-related transcription factor 2 (RUNX2) was expressed quite constantly with regard to culture duration with a subtle increase at day 7 (Fig. 3A). The interaction with hOAs resulted in a significantly decreased RUNX2 expression (Fig. 3A), while interactive hPDL coculture yielded a marginal increase in RUNX2 expression. Similarly, we observed a transient augmentation in RUNX2 transcription upon hGF coculture (Fig. 3A).

Expression of differentiation-associated mRNA in hMSCs interacting with oral cells. Least squares mean ΔCt values with 95% confidence intervals of control hMSCs (top row) and of interactive hOA (second row), hPDL (third row), and hGF (bottom row) cocultures, respectively, each at day 0 (baseline, represented by dotted line), day 7, and day 14 (right y-axis, gradient represented by dashed line). The Ct values of the respective gene of interest
In control hMSCs, OPN followed a comparable expression time course, showing a gentle and transient increase at day 7 (Fig. 3B). In interaction with hOAs, OPN expression was significantly reduced (Fig. 3B), while coculture neither with hPDLs nor with hGFs remarkably modulated gene expression with matched controls (Fig. 3B).
The expression of secreted protein acidic and rich in cysteine (SPARC) was tremendously increased upon extending culture period in control hMSCs (Fig. 3C). Similar to controls, a significant SPARC increase was detectable in interactive coculture with each hOAs, hPDLs, and hGFs (Fig. 3C) such that it globally failed to strengthen the already strong increase in SPARC expression (Fig. 3C).
Accordingly, collagen 1 alpha 1 (Col1a1) was immensely upregulated in control hMSCs with a strong expression at day 7 (Fig. 3D). This trend was slightly reduced in presence of hOAs as an interactive partner (Fig. 3D), whereas the increase in Col1a1 transcription remained fairly unaffected in hPDL or hGF cocultures (Fig. 3D).
Interactive hMSC cocultures display increase in cell survival rate
Regarding tissue regeneration, it cannot be excluded that supportive effects are reflected by modulation of proliferation and differentiation, but also by an improvement of cell survival. We therefore analyzed apoptosis in solitary oral cell cultures and interactive hMSC cocultures. Taking into account the number of apoptotic events, we observed that irrespective of the oral cell type involved, interactive hMSC coculture significantly increased the cell survival ratio as represented by the ratio total cell number per apoptotic cell nuclei in comparison to hMSC-lacking controls (for comparison: Fig. 4A1 with 4A2, Supplementary Figure 3A1 with 3A2, 3B1 with 3B2, for hOAs; Fig. 4A3 with 4A4, Supplementary Figure 3A3 with 3A4, 3B3 with 3B4, for hPDLs; and Fig. 4A5 with 4A6, Supplementary Figure 3A5 with 3A6, 3B5 with 3B6, for hGFs). In detail, cell survival rates are illustrated in Figure 4B and summarized in Figure 4C. This finding on augmentation of cell survival, obtained from interactive cocultures, points to a possible contribution of hMSCs to an improvement of oral cell survival, or vice versa, concerning putative oral tissue regeneration strategies.

Cell survival ratio in interactive oral cell cocultures, as shown by
Discussion
In oral regenerative medicine, stem cells face two unique challenges: first, the developmental exceptionality of oral tissues, and second, the necessity to rebuild a complex arrangement of different soft and hard tissue components. 19 In this context, the periodontium represents an ideal model for evaluating the diverse responses of stem cells to the various oral tissue components that originate from neural crest cell induction and hence, from ectodermal–mesenchymal cell interactions. 9 hMSCs are promising key candidates for periodontal regeneration purposes.5,7,20,21 Thus, our study has investigated for the first time the interplay of hMSCs with different oral cell types by means of an innovative in vitro approach, based on interactive cocultures facilitating physiologically relevant nondirect contact-based cell-to-cell interactions, also occurring in vivo.
Given that hOAs, hPDLs, and hGFs are derived from distinct provenances as hard or soft tissues, it seems just a logical consequence that hMSCs may react differentially to the diverse cell types. In fact, we have unequivocally shown that hMSCs display discriminative responses to oral cell coculture, thereby in turn allowing for a systematic comparison of oral tissue cells. Interestingly, the performance of hMSCs cocultured with oral cells followed a ranking that was the same for all parameters of hMSC behavior under study, that is, proliferation, gene expression, and apoptosis. The peak-to-valley behavior of control hMSCs was leveled out by hOA coculture, reduced by hGF coculture, and remained fairly unaffected or even re-intensified by hPDLs.
With regard to proliferation, expected growth curves were obtained for control hMSCs, including a strong initial increase and a peak reflecting the transition from a stationary phase to a final decrease. These growth phases are characterized by increasing cell number, and a subsequently ceasing cell growth due to contact inhibition by monolayer formation.22,23 Since all behavioral hMSC features were modified by oral cells following the same hierarchy, we hypothesize that oral-cell-induced decrease of hMSC proliferation reflects a shift of the hMSC behavior from proliferation to differentiation and environment-supporting actions. Nevertheless, the finding that oral cells reduced the proliferation of hMSCs seems to contrast recent evidence that long-bone osteoblasts11,24 or hPDLs 14 promote the proliferation of cocultured hMSCs in vitro. However, the reported increase in hMSC proliferation occurred either in response to conditioned medium or to direct cell–cell contacts, which were not existent in our experimental set-up. We speculate that our observations in proliferation may be a result of the above-mentioned more physiological interactions, provided by our coculture approach. In addition, our findings substantiate the hypothesis that hMSCs do react differently in response to femoral than to alveolar osteoblasts. 9 With respect to connective tissue fibroblasts, as for instance hGFs, their suitability as feeder layer for embryonic stem cells is known for a long time, 25 and here we show that they render the same service to hMSCs.
It is tempting to assume that a reduced proliferation comes along with an emphasis in differentiation. In fact, we found that the expression of differentiation-associated genes increased with time in a peak-to-valley manner, in analogy to the observed proliferation profile. Our data clearly show that various oral cells affect the gene transcription in hMSCs in a cell-type-distinctive manner. This distinction is substantiated by hOAs as the main proliferation modulator, which turned out to exert the greatest effects on the expression of hMSC genes under study, followed by hGFs and hPDLs. Nevertheless, hOA-cocultured hMSCs reacted differently from the way their mesoderm-derived counterparts were so far reported, and thus, expected to do.12,24,26 This was reflected by the finding that transcription of osteogenic genes was not enhanced, but rather decreased in comparison to control hMSCs. Although we admittedly cannot rule out that the expression of further differentiation-associated genes was augmented, we may speculate that the differing reaction relies on the divergent developmental biology nature of alveolar compared with femoral osteoblasts.9,27,28
These findings may lead to the assumption that in interplay with different oral cells, hMSCs may contribute to tissue regeneration by innate features other than enhancement of proliferation and extensive reinforcement of differentiation. Indeed, we could show that apoptotic events appeared significantly reduced when hMSCs were available as interactive cell counterpart for any of the cocultured oral cell type. This observation strongly suggests that the improvement of general cell survival, including the addressed tissue, may contribute to the supportive effects of hMSCs in the context of tissue regeneration.29–31
In summary, our results show that interactive hMSC cocultures with various oral cells are characterized by a crosstalk, gradually regulated by the oral cell type. This crosstalk is ratified by government of proliferation and differentiation in hMSCs, and improvement of cell survival, as indicated by global apoptosis reduction. In mechanistic terms, this mutually displayed influence on behavioral cell features under study may be orchestrated by nondirect contact-innate cell-to-cell interactions, provided in our coculture approach. Thus, our results valuably contribute to the understanding of the putative cellular processes during hMSC-based oral tissue regeneration and explicitly outline the urgent need for fine tuning the complex interactions of the different cell types involved. Such knowledge will be precious for the future identification of hMSC-customized therapy concepts, including interactive tissue-based concepts.
Footnotes
Acknowledgments
The authors acknowledge the excellent technical assistance of Yrgalem Abreha and Heike Jahnke who supported the cell culturing and staining. We are grateful to Dr. Brigitte Altmann for fruitful discussions and technical advice. The study was funded by the Research Committee of the Medical Faculty of the University Freiburg Medical Center (PRO723/09) and by the Deutsche Gesellschaft für Zahn-, Mund- und Kieferheilkunde (DGZMK, 11/2010).
Disclosure Statement
The authors declare that they have no competing interests.
References
Supplementary Material
Please find the following supplemental material available below.
For Open Access articles published under a Creative Commons License, all supplemental material carries the same license as the article it is associated with.
For non-Open Access articles published, all supplemental material carries a non-exclusive license, and permission requests for re-use of supplemental material or any part of supplemental material shall be sent directly to the copyright owner as specified in the copyright notice associated with the article.