
Abstract
Trichostatin A (TSA) is a potent histone deacetylase (HDAC) inhibitor with a broad spectrum of epigenetic activities known to regulate diverse cellular mechanisms, including differentiation of mesenchymal stem cells. In this study, we demonstrate that TSA promotes proliferation and odontoblast differentiation of human dental pulp stem cells (hDPSCs) in vitro and has the ability to enhance dentin formation and odontoblast differentiation in vivo during tooth development. We observed that TSA increased the expression of proliferating cell nuclear antigen and cyclin D1 in hDPSCs at a certain concentration and the activation of JNK/c-Jun pathway was essential for TSA-dependent hDPSC proliferation. Further, TSA accelerated mineral nodule formation in vitro and increased gene expression of dentin sialophosphoprotein, dentin matrix protein 1, bone sialoprotein, and osteocalcin. In addition, TSA significantly upregulated the levels of phospho-Smad2/3, Smad4, and nuclear factor I-C, while the specific inhibitor of Smad3 inhibits TSA enhancing mineralization differentiation of hDPSCs. HDAC3 is downregulated by TSA treatment, suggesting a possible mediator of TSA-dependent pathways among the members of HDAC family. Moreover, TSA-injected embryos exhibited increased dentin thickness, larger dentin areas, and higher odontoblast numbers in their postnatal molars with stronger dentin sialoprotein expression in immunohistochemical staining. These findings indicate that TSA may serve a key role in proliferation and odontoblast differentiation of hDPSCs in dental developmental stages and can be used as an accelerator in dental hard tissue engineering.
Introduction
Histone deacetylase (HDAC) inhibitors are known to modulate the expression of genes by increasing histone acetylation and thereby regulating chromatin structure and transcription. 17 Various HDAC inhibitors are reported to enhance osteoblast differentiation in multiple cell types, including osteoblasts, bone marrow mesenchymal cells, and adipose-derived stromal cells.18–20 Current evidence indicates that HDAC inhibitors act not only to block the catalytic activity of the enzyme but may also affect the protein–protein interaction of specific HDACs with various critical protein partners. 21 These target proteins are involved in many cell pathways, including gene expression, cell proliferation, differentiation, cell migration, and cell death, and have a role in angiogenesis and immune response. 22 Among several kinds of HDAC inhibitors, trichostatin A (TSA) is a hydroxamic acid and blocks the activity of all HDACs with similar affinities, except class IIa HDACs, which was originally isolated as a fungistatic antibiotic from the Streptomyces platensis strain. 23 However, the effects of TSA on the hDPSCs and its precise molecular mechanism remains unclear.
In this study, we aim to investigate how TSA affects the proliferation and differentiation of the hDPSCs in vitro and identify the molecular mechanisms by which this occurs. Next, we examine whether TSA induces odontoblast differentiation and dentin formation in vivo during tooth development stages.
Materials and Methods
Primary cell culture
Human third molars were collected from three healthy young men (18–25 years of age) under the protocol approved by the institutional review board at the Seoul National University Dental Hospital, Seoul, South Korea (IRB No. 05004). The pulp tissue was gently separated from extracted third molars and the separated tissues were digested in a solution of 3 mg/mL collagenase type I (Worthington Biochem, Freehold, NJ) and 4 mg/mL dispase (Boehringer, Mannheim, Germany) for 1 h at 37°C. Single-cell suspensions were obtained by passing the cells through a 40 μm strainer (Falcon, BD Labware, Franklin Lakes, NJ) and were cultured in alpha-modification of Eagle's medium (GIBCO BRL, Grand Island, NY) supplemented with 10% fetal calf serum (Equitech-Bio, Inc., Kerrville, TX), 100 μM ascorbic acid 2-phosphate (WAKO, Tokyo, Japan), 2 mM glutamine, 100 U/mL penicillin, and 100 μg/mL streptomycin (Biofluids, Rockville, MD) and incubated at 37°C in 5% CO2. After 24 h, medium was changed and then changed for every 3 days. The colonies were picked up and cultured separately. Total of three colonies of hDPSCs were randomly selected and the cellular pool of those colonies was used for in vitro proliferation and differentiation studies. All primary cells used in this study were in passage 2 or 3.
Flow cytometric analysis
Approximately 1.0×10⁶ number of cells were cultured as hDPSCs in their third passage. After trypsin/ethylenediaminetetraacetic acid (EDTA) digestion, the cells were fixed with 4% paraformaldehyde for 10 min. After resuspension in 1% bovine serum albumin (BSA) (ICN Biomedicals, Aurora, OH) blocking buffer, the cells were incubated with primary STRO-1 (R&D Systems, Minneapolis, MN) or CD146 (Abcam, Cambridge, United Kingdom) antibody (experimental cells; 10 mg/mL) or phosphate-buffered saline (PBS) (control cells) at 4°C for 3 h, followed by secondary antibody of fluorescence at room temperature for 1 h. The percentage of STRO-1-positive-stained hDPSCs was measured with an FACS Calibur flow cytometry (Becton Dickinson Immunocytometry Systems, San Jose, CA) and the results were analyzed by the software Cell Quest Pro (Becton Dickinson). For analysis of STRO-1- and CD146-positive cells, the percentage of the cells positioned in the right side of the M1 gate was measured. The M1 gate was defined as a peak of negative control cells without primary antibody. The relatively positive cells were calculated from the percentage of the experimental cells minus the percentage of the control cells.
Cell proliferation assay
Cell proliferation and viability were measured using the colometric 3-(4,5-dimethylthazol-2-yl)-2,5-diphenyltetrazolium bromide (MTT) assay kit (Promega, Madison, WI). Briefly, hDPSCs (3.0×10³ cells/well) were seeded in 96-well plates and cultured for 24 h. 1 Various concentrations of TSA (Sigma Aldrich, St. Louis, MO) were added as 5, 10, 20, 50, and 100 nM for final concentration in 100 μL of culture media per well. About 15 μL of premixed optimized dye solution was added after different time durations: 0, 12, 24, 48, and 72 h. The cells were incubated in 5% CO2 at 37°C for 4 h and then 100 μL of a solubilization/stop solution was added to the cultures to solubilize the formazan product. Each condition was prepared triplet and the reactions were assessed with enzyme-linked immunosorbent assay reader at 595 nm (655 nm as reference) and the values are expressed as optical density (O.D.) (mean±standard deviation).
For the experiment of SP600125, a specific JNK inhibitor (Calbiochem, La Jolla, CA), hDPSCs (3.0×10³ cells/well) were seeded and cultured with or without 20 nM TSA in the presence or absence of SP600125 (10 μM) in 96-well plates for the different culture durations (0, 12, 24, 48, and 72 h). 24 Then, the cell proliferation was measured with the same method as described previously.
Western blot analysis
To confirm the elevated proliferative capability of the TSA-treated hDPSCs, Western blot analysis was performed as resolved on 10% sodium dodecyl sulfate–polyacrylamide gel electrophoresis (SDS-PAGE). The hDPSCs (1.0×10⁶ cells/dish) were seeded in a 60-mm culture dish and cultured for 24 h. Various concentrations of TSA were added as 5, 10, 20, 50, and 100 nM for final concentration in 3 mL of culture media and cultured for 48 h. Protein concentrations of cell lysates were determined by using the DC Protein Assay Kit (Bio-Rad Laboratories, Hercules, CA). An equal amount of proteins (30 μg/lane) was resolved by SDS-PAGE and transferred to a polyvinylidene difluoride membrane (GE Healthcare, Chalfont St. Giles, United Kingdom). Primary antibodies against proliferative cell nuclear antigen (PCNA; Santa Cruz Biotechnology, Santa Cruz, CA) and cyclin D1 (Cell Signaling Technology, Danvers, MA) were used. Blots were finally developed by using horseradish peroxidase–conjugated secondary antibodies (Cell Signaling Technology) and were visualized by using enhanced chemiluminescence (Enhanced Chemiluminescence kit; GE Healthcare). The primary antibodies against phospho-AKT, AKT, phospho-ERK, ERK, phospho-p38, p38, phospho-JNK, JNK, phospho-c-Jun, c-Jun, and α-Tubulin (Cell Signaling Technology) were used for further mechanism study.
To evaluate whether TSA induced odontoblast differentiation of hDPSCs, 1.0×10⁶ cells were seeded in a 60-mm dish and cultured for 3 weeks under mineralization differentiation induction condition. Primary antibodies against HDAC1, HDAC2, HDAC3, HDAC4, HDAC5 (Cell Signaling Technology), phospho-Smad2/3, Smad4, Runx2, and β-actin (Santa Cruz Biotechnology) were used. The specific antibody against nuclear factor I-C (NFI-C) was a kind gift from Dr. JC Park (Seoul National University, Seoul, Korea). 25
RNA preparation and real-time polymerase chain reaction analysis
To evaluate gene expression levels in TSA-induced differentiated hDPSCs, 1.0×10⁶ cells were seeded in a 60-mm culture dish and cultured for 3 weeks under mineralization differentiation induction condition. Total RNA was prepared by using an RNeasy Mini kit (QIAGEN, Valencia, CA) according to the manufacturer's instructions, and cDNA was synthesized from 5 μg of total RNA using reverse transcriptase (Superscript II Preamplification System; Invitrogen, Gaithersburg, MD). Real-time polymerase chain reaction (PCR) was performed with SYBR Green PCR Master Mix (ABI Prism 7500 sequence detection system; Applied Biosystems, Warrington, United Kingdom). The reaction conditions were 40 cycles of 15 s of denaturation at 95°C, and 1 min of amplification at 60°C. All reactions were run in triplicate and were normalized to housekeeping gene hypoxanthine-guanine phosphoribosyl transferase. For comparison of the gene expression between the control and the TSA-treated groups, ΔΔcycle threshold value was calculated and compared. 26 The relative expression of mRNA in hDPSCs and their TSA-treated counterparts was compared in a histogram. The specific primer sets for the analysis are listed in Table 1.
DSPP, dentin sialophosphoprotein; BSP, bone sialoprotein; DMP1, dentin matrix protein 1; OCN, osteocalcin; HPRT, hypoxanthine-guanine phosphoribosyl transferase.
Mineralization induction with alkaline phosphatase staining and alizarin red S staining
The influence of TSA on the mineralization differentiation of hDPSCs was observed by alkaline phosphatase (ALP) staining and alizarin red S staining under the mineralization differentiation condition. The hDPSCs were seeded on six-well plates (8.0×10⁴ cells/well) and cultured with normal growth medium (NGM). After 3 days, 20 nM TSA was added for the TSA group and the cells were cultured in mineralization induction medium (MIM) with 50 μg/mL ascorbic acid, 10 mM β-glycerophosphate, and 100 nM dexamethasone (Sigma Aldrich) for the mineralization induction group. The medium was changed every 3 days and cultured for 1 week for ALP staining and 3 weeks for alizarin red S staining. For ALP staining, cells were fixed with 10% formalin, incubated with 0.1% Triton X-100 for 5 min, and then stained by the Leukocyte Alkaline Phosphatase Kit (Sigma Aldrich) according to the manufacturer's protocol. On day 21, accumulation of mineral nodules was detected by 2% alizarin red S staining at pH 4.2 (Sigma Aldrich). For destaining procedure and for measurement of calcium content, 3 mL of 10 mM sodium phosphate–10% acetylpyrimidium (pH 7.0) solution was added to each stained well and incubated at room temperature for 15 min. The destained sample was transferred to a 96-well plate and the absorbance was measured at 562 nm. For the study with specific inhibitor of Smad3 (SIS3), TSA was added with or without 3 μM of SIS3 after 3 days of culture in NGM and then the media were changed into the NGM or MIM. Alizarin red S staining and destaining procedures were the same as described previously.
Histological and histomorphometric analysis
To study the effects of TSA on dentin formation during tooth developmental stages in vivo, we used four pregnant ICR mice in 5 days of gestation. The mice were divided into two groups: TSA group (n=2), 50 μM/kg of TSA in 100 μL volume was injected via tail vein from 6.5 days to 17.5 days of gestation; control group (n=2), the same volume of PBS was injected via tail vein in the same duration. For histological analysis, six newborn mice from each group (total n=12) were sacrificed at postnatal day 7 (P7) and whole murine heads were cut and fixed in 3.7% paraformaldehyde solution for 48 h at 4°C and then decalcified with 12% EDTA; then, each specimen was processed for paraffin embedding. Semi-serial 5-μm sections of first and second molars were prepared, and the three mid-sagittal sections from each tooth were hematoxylin and eosin (H&E) stained and examined under light microscope (Olympus U-SPT, Japan).
For quantitative analysis of TSA-induced dentin formation, histomorphometric analysis was performed with the LS starter program (OLYMPUS Soft Imaging Solution, Müster, Germany). Dentin thickness (μm) was measured as the shortest vertical distance beginning from an enamel cusp tip. The distances from the two different cusp tips were measured and the average value was used for thickness evaluation. The gross area of the dentin was calculated with the software as the measured amount of the selected area, while the number of odontoblasts was counted manually by the two different investigators and the average value was evaluated. All of the measurements were repeated three times and the differences of the values were evaluated statistically (p<0.05).
Immunohistochemical analysis
The deparaffinized sections were immersed in 0.6% hydrogen peroxide/methanol for 20 min to quench the endogenous peroxidase activity. Then, they were preincubated with 1% BSA in PBS for 30 min and incubated overnight at 4°C with rabbit polyclonal anti-mouse DSP antibody (a kind gift from Dr. JC Park, Seoul National University; 1:100). Sections were incubated for 1 h at room temperature with the secondary antibody and reacted with avidin-biotin-peroxidase complex (Vectastain ABC Systems; Vector Laboratories, Burlingame, CA) in PBS for 30 min. After color development with 0.05% 3,3′-diaminobenzidine tetrahydrochloride (DAB Peroxidase Substrate; Vector Laboratories), the sections were counterstained with hematoxylin.
Statistical analysis
Data are expressed as mean±standard deviation. Statistical significance of differences between the groups in histomorphometric measurements, dentin thickness, gross area of dentin, and number of odontoblasts in TSA group and control group were analyzed by Mann–Whitney U-test. A p-value<0.05 or 0.01 was considered statistically significant.
Results
Characterization of hDPSCs
The isolated cells formed single-cell-derived colonies and most of the cells retained their fibroblastic spindle shape (Fig. 1A). Three different colonies from three donors were randomly selected and the cellular pool of the colonies was used as hDPSCs for in vitro studies. Flow cytometric analysis showed that the hDPSCs contained approximately 45.2% of STRO-1- and 53.0% of CD146-positive cells (Fig. 1B, the most left figure). STRO-1 and CD146 are known as the representative putative mesenchymal stem cell markers.27,28 The percentage of STRO-1- and CD146-positive cells was determined by relative intensity of antibody-binding cells. The percentage of control cells (46.6%) at the right side of M1 gate was deducted from the percentage of the experimental cells (STRO-1, 91.8%; CD146, 99.6%) at the right side of M1 gate (Fig. 1B).
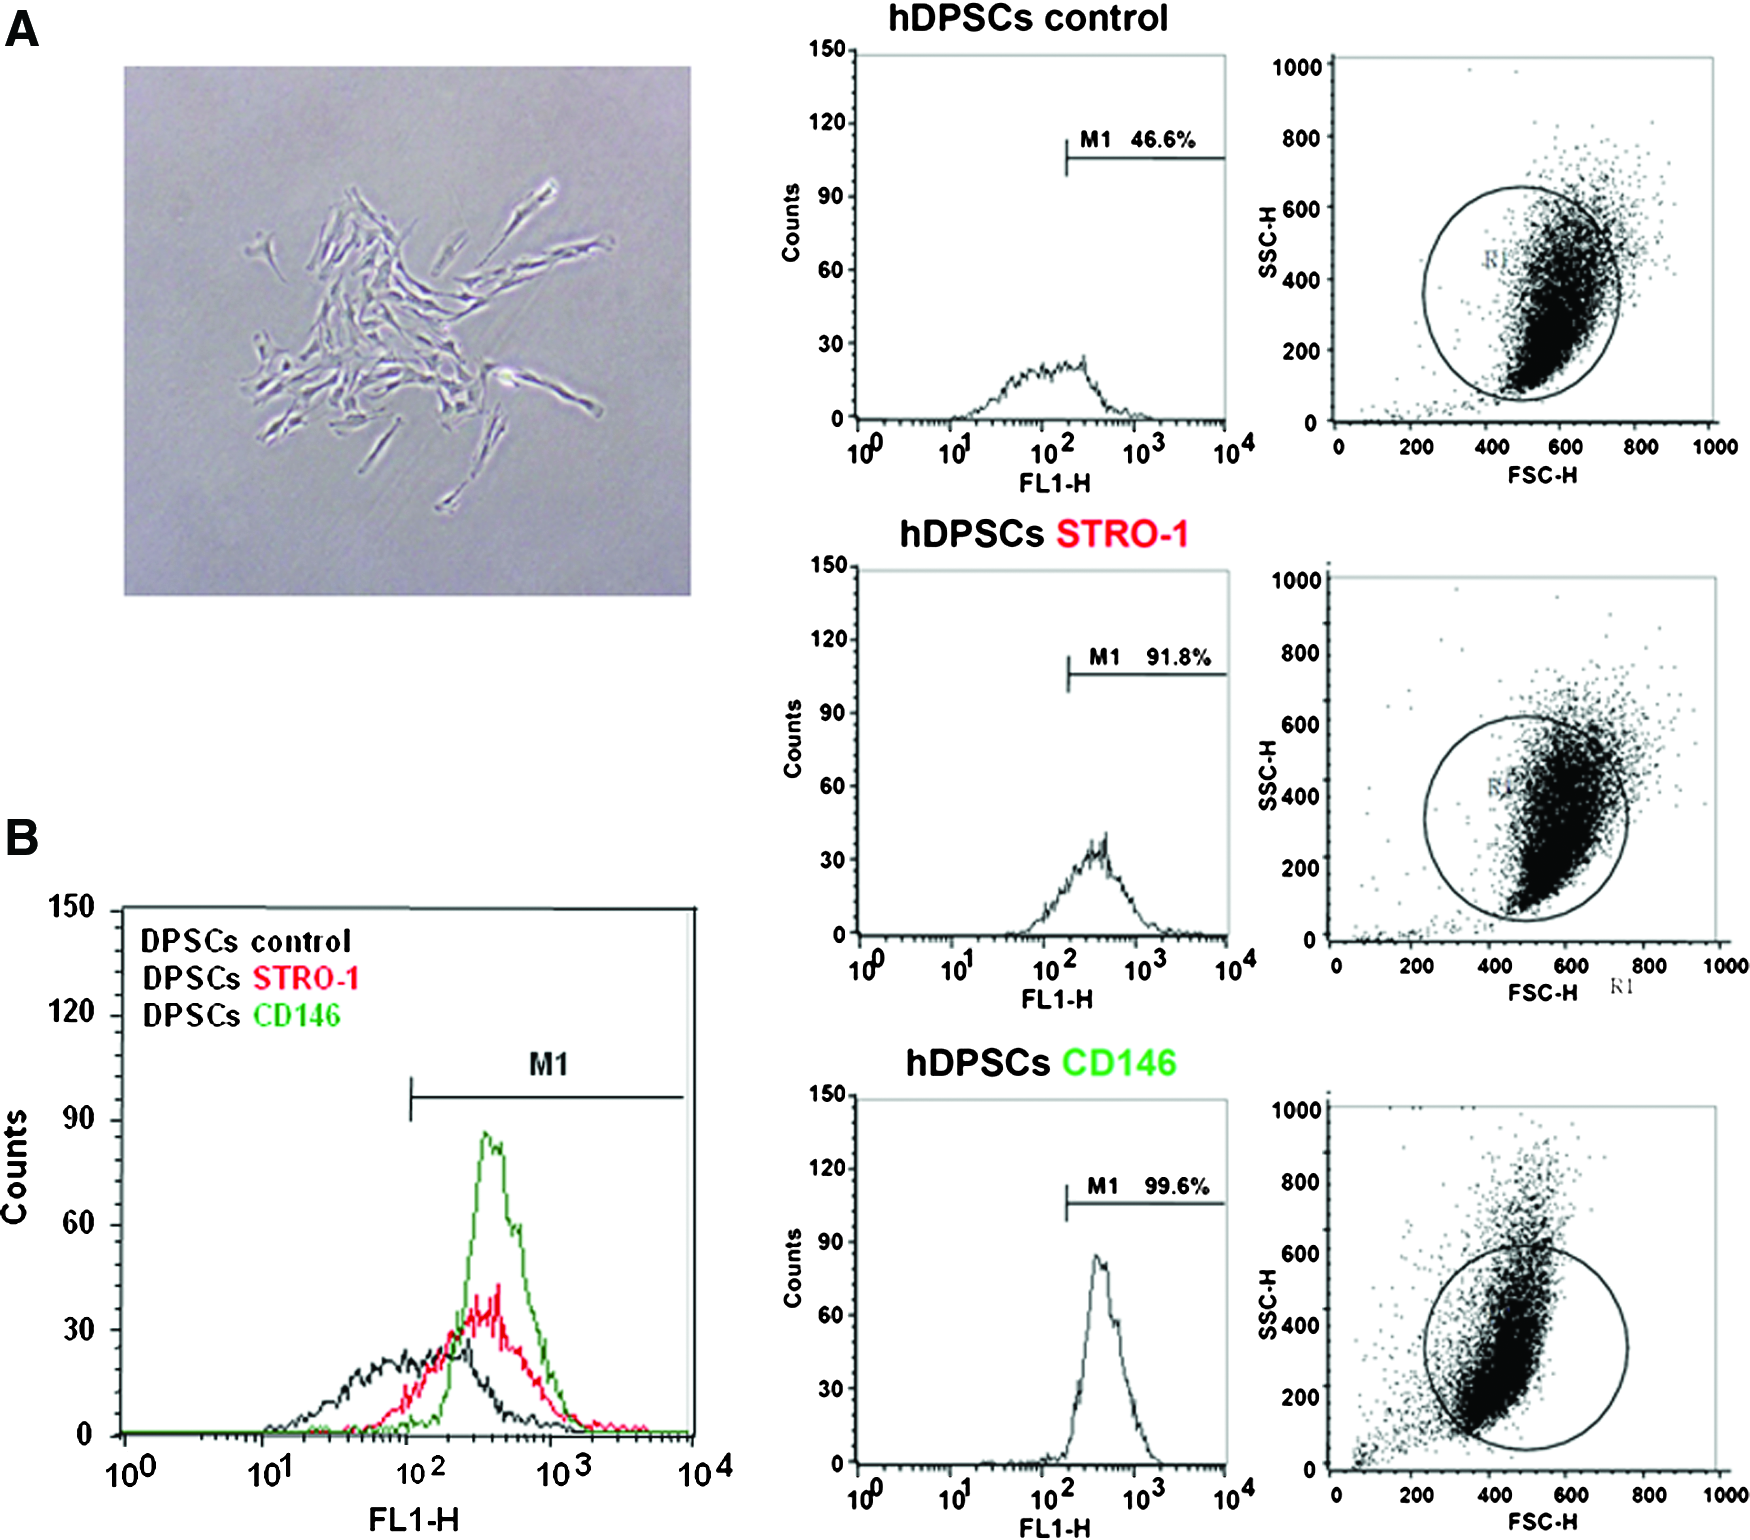
Characterization of hDPSCs.
TSA increased proliferation of hDPSCs in vitro
To examine the effect of TSA on proliferation of hDPSCs in vitro, 0, 5, 10, 20, 50, and 100 nM of TSA were added to the hDPSCs. At 48 h of culture, MTT assay showed that TSA increased proliferation of hDPSCs by 20 nM but O.D. value slightly decreased at 50 nM (Fig. 2A). When 100 nM of TSA was added, O.D. value decreased as the same as the control and showed cytotoxicity (data not shown). To confirm the elevated proliferative capability of hDPSCs in protein level, PCNA and cyclin D1 were detected by Western blot with the same serial concentrations of TSA treatment. Expression of PCNA increased according to the TSA concentration by 20 nM, while cyclin D1 increased by 50 nM (Fig. 2B). Expression of these proteins was almost diminished at 100 nM of TSA because of cytotoxicity (data not shown). Therefore, it was concluded that 20 nM of TSA showed the highest proliferative effect on hDPSCs in vitro.

TSA increased proliferation of hDPSCs in vitro.
When 20 nM of TSA was added to hDPSCs, proliferation increased in time-dependent manner (Fig. 2C). During 72 h of culture, O.D. value was higher than the control group.
TSA stimulates proliferation of hDPSCs via JNK and c-Jun phosphorylation
To explore the molecular mechanism how TSA induces proliferation of hDPSCs, we examined the key molecule levels of signaling pathways: ERK, JNK, p38, and AKT pathways (Fig. 3A). Among the four proteins and their phosphorylated forms, p-JNK was the only protein increased by 20 nM of TSA. Phosphorylated c-Jun (p-c-Jun), the downstream target protein of JNK, was also increased by TSA treatment (Fig. 3A), and 10 μM of SP600125, a specific JNK inhibitor, completely decreased TSA-induced proliferation during 72 h of culture (Fig. 3B). Therefore, it was speculated that JNK signaling pathways played an essential role in TSA-induced proliferation of hDPSCs.

TSA stimulates proliferation of hDPSCs via JNK and c-Jun phosphorylation.
TSA induces odontoblast differentiation of hDPSCs in vitro
After 1 week of mineralization differentiation induction, the control group (0 nM of TSA) showed no change by ALP staining compared with the normal growth condition (Fig. 4A, the first column). However, 20 nM of TSA induced positive ALP staining and the whole well showed the difference of staining positivity between the control and the TSA groups (Fig. 4A, the second column). After 3 weeks of mineralization induction, the control group (0 nM of TSA) began to show mineralized nodules stained by alizarin red S (Fig. 4B, the first column). However, TSA group showed more and larger calcified nodules and stronger staining by alizarin red S. The results of destaining procedure showed higher calcium contents in TSA group (Fig. 4B, the second column). Therefore, it was concluded that 20 nM of TSA under mineralization induction condition promotes differentiation of hDPSCs into mineral-forming cells, such as odontoblasts or osteoblasts in vitro.
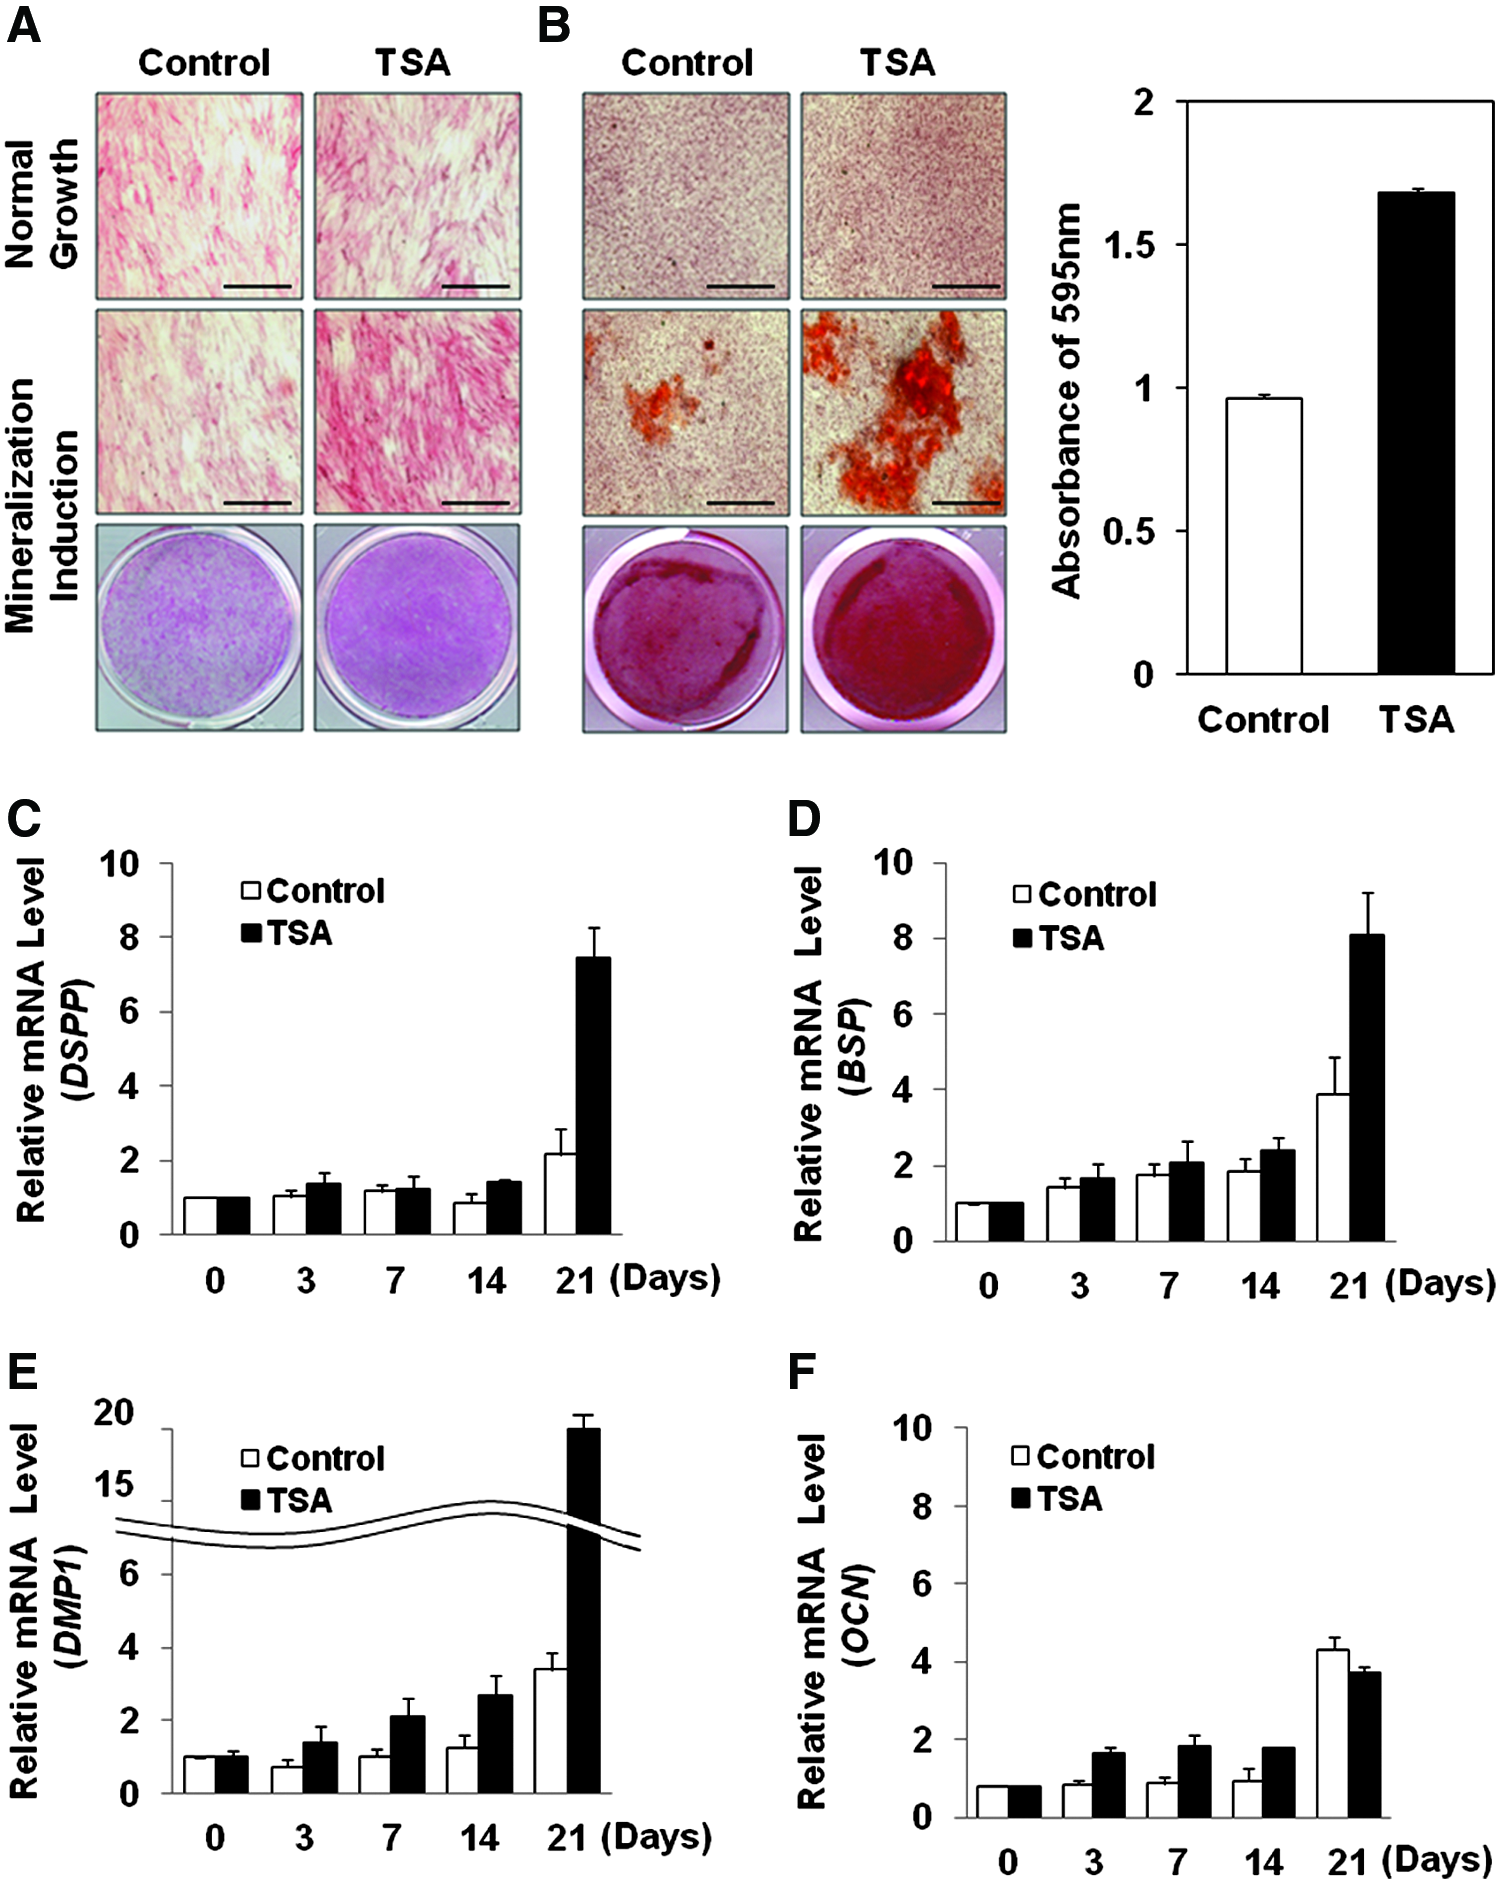
TSA induces odontoblast differentiation of hDPSCs in vitro.
To further investigate whether TSA differentiates hDPSCs into osteoblasts or odontoblasts, the related gene expression was checked by real-time PCR. DSPP is known as a single-gene odontoblast and its mRNA expression was slightly increased at 21 days of culture under mineralization induction condition without TSA (Fig. 4C, white histograms). However, with TSA treatment, expression of DSPP was significantly increased at 21 days of mineralization induction compared with the control group (Fig. 4C, black histograms). Bone sialoprotein (BSP), dentin matrix protein 1 (DMP1), and osteocalcin (OCN) are known as the genes expressed commonly by osteoblasts and odontoblasts. 3 Without TSA, the mRNA expression of BSP, DMP1, and OCN showed tendency to increase during 21 days of mineralization induction, and BSP and DMP1 in TSA treatment group were significantly increased and higher than the control group (Fig. 4D, E). The expression of DMP1 mRNA in TSA group was especially higher, approximately seven times higher than the control group at 21 days of mineralization. Interestingly, OCN was slightly decreased in TSA group at 21 days compared with the control group (Fig. 4F).
TSA-induced odontoblast differentiation was mediated by Smad2/3 and possible NFI-C-dependent pathways
To inspect the key molecular mechanisms by which TSA induces differentiation of hDPSCs, the target HDAC should be examined firstly among the members of HDAC family. Protein level of HDAC3 was decreased by 20 nM of TSA treatment, while HDAC1, HDAC2, HDAC4, and HDAC5 showed no changes (Fig. 5A). Then, the levels of NFI-C and Runx2 were evaluated, as Nfic was known as one of the key genes for odontoblast differentiation, while Runx2 is the representative transcriptional factor of osteoblast differentiation.29,30 The results of Western blot showed increased level of NFI-C by 20 nM of TSA, while there was no effect on the level of Runx2 (Fig. 5B). The levels of phospho-Smad2/3 and Smad4 were also tested as they were thought to be the upstream proteins for NFI-C-targeting signaling pathway.31,32 As expected, TSA significantly upregulated the levels of phospho-Smad2/3 and Smad4 (Fig. 5B). To confirm whether Smads play an essential role in TSA-induced odontoblast differentiation of hDPSCs, SIS3 was used in differentiation induction of hDPSCs. 33 Compared to staining positivity of TSA group after 3 weeks of differentiation induction, decreased mineral nodule formation was shown in TSA with SIS3 group by alizarin red S staining (Fig. 5C, left). The increased calcium contents by TSA treatment was verified again after destaining procedures and decreased calcium contents by SIS3 was also shown (Fig. 5C, right). Therefore, SIS3 inhibited TSA–induced mineralization differentiation of hDPSCs in vitro and Smad2/3 and Smad4 seem to play an essential role in TSA-induced odontoblast differentiation of hDPSCs.
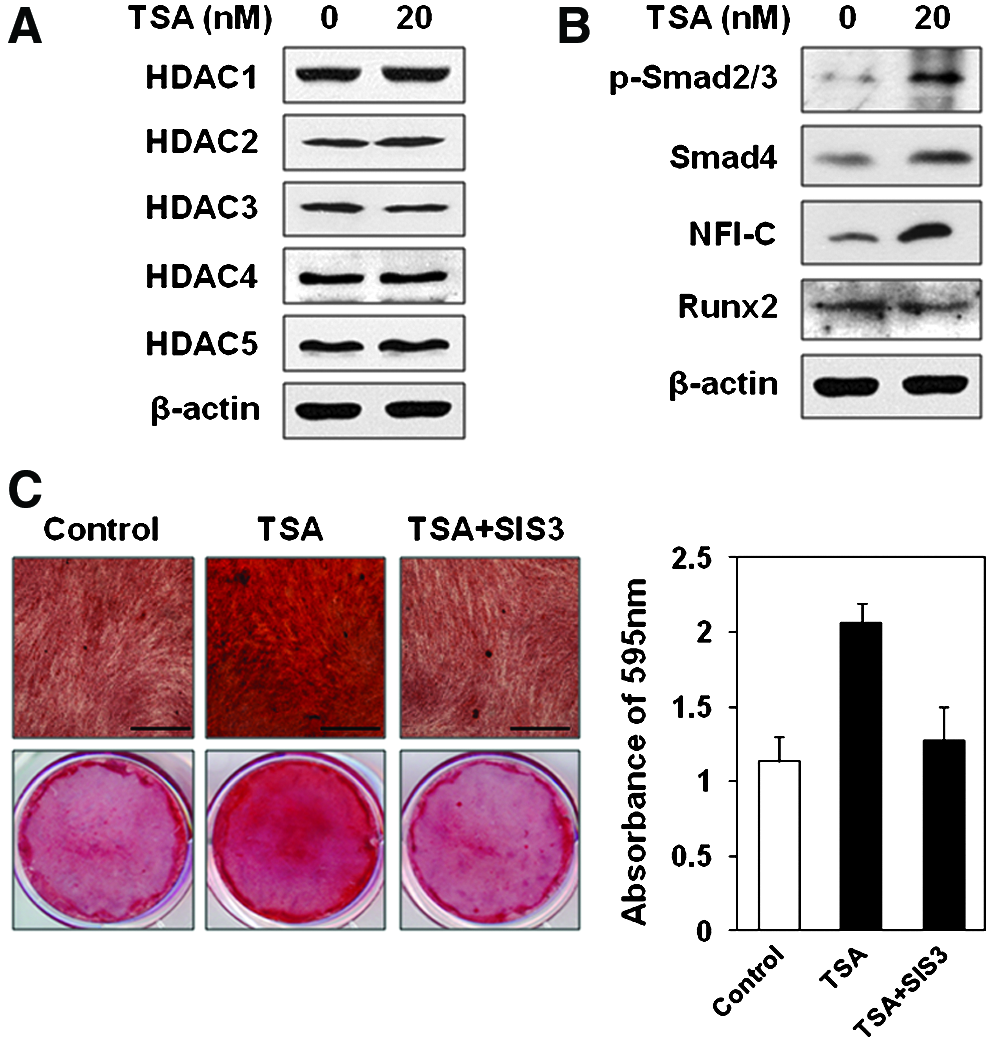
TSA-induced odontoblast differentiation was mediated by Smad2/3 and possible NFI-C-dependent pathways.
TSA increased dentin formation and possible odontoblast differentiation of DPSCs in vivo during murine tooth development stages
To examine how TSA affects tooth development in vivo, 50 μM/kg of TSA was injected to two pregnant ICR mice (TSA group). Six newborn mice from each group were sacrificed and examined at the late bell stage of the first lower molar—at the postnatal day 7 (P7), when the progenitor cells in dental papilla began to differentiate into odontoblasts. H&E staining of the mid-sagittal cuts of the first lower molars showed thicker and denser dentin layer compared with the control group (Fig. 6A, B). Higher magnification figures showed that longer odontoblasts and denser calcified dentin were definite in TSA group (Fig. 6C, D, white arrows). Histomorphometric analysis showed that dentin was thickened by 1.64-fold; dentin area became larger by 1.70-fold and the number of odontoblasts in the same gross area was higher by 1.74-fold in TSA group, compared with the control group (Fig. 6E–G). The difference of data showed statistical significance (p<0.01, p<0.01, and p<0.05 in Fig. 6E–G, respectively). Subsequently, we examined whether the phenotypically changed odontoblasts had an increased ability to secrete DSP, the odontoblast-specific protein that regulates initiation of dentin mineralization. 34 Immunohistocheimcal staining showed stronger staining positivity of DSP in TSA group in both of the first and the second molars (Fig. 7). The stronger expression of DSP was shown especially under the cusp tips, where the differentiation of the odontoblasts began during tooth development (Fig. 7C, D, G, and H, red arrows).
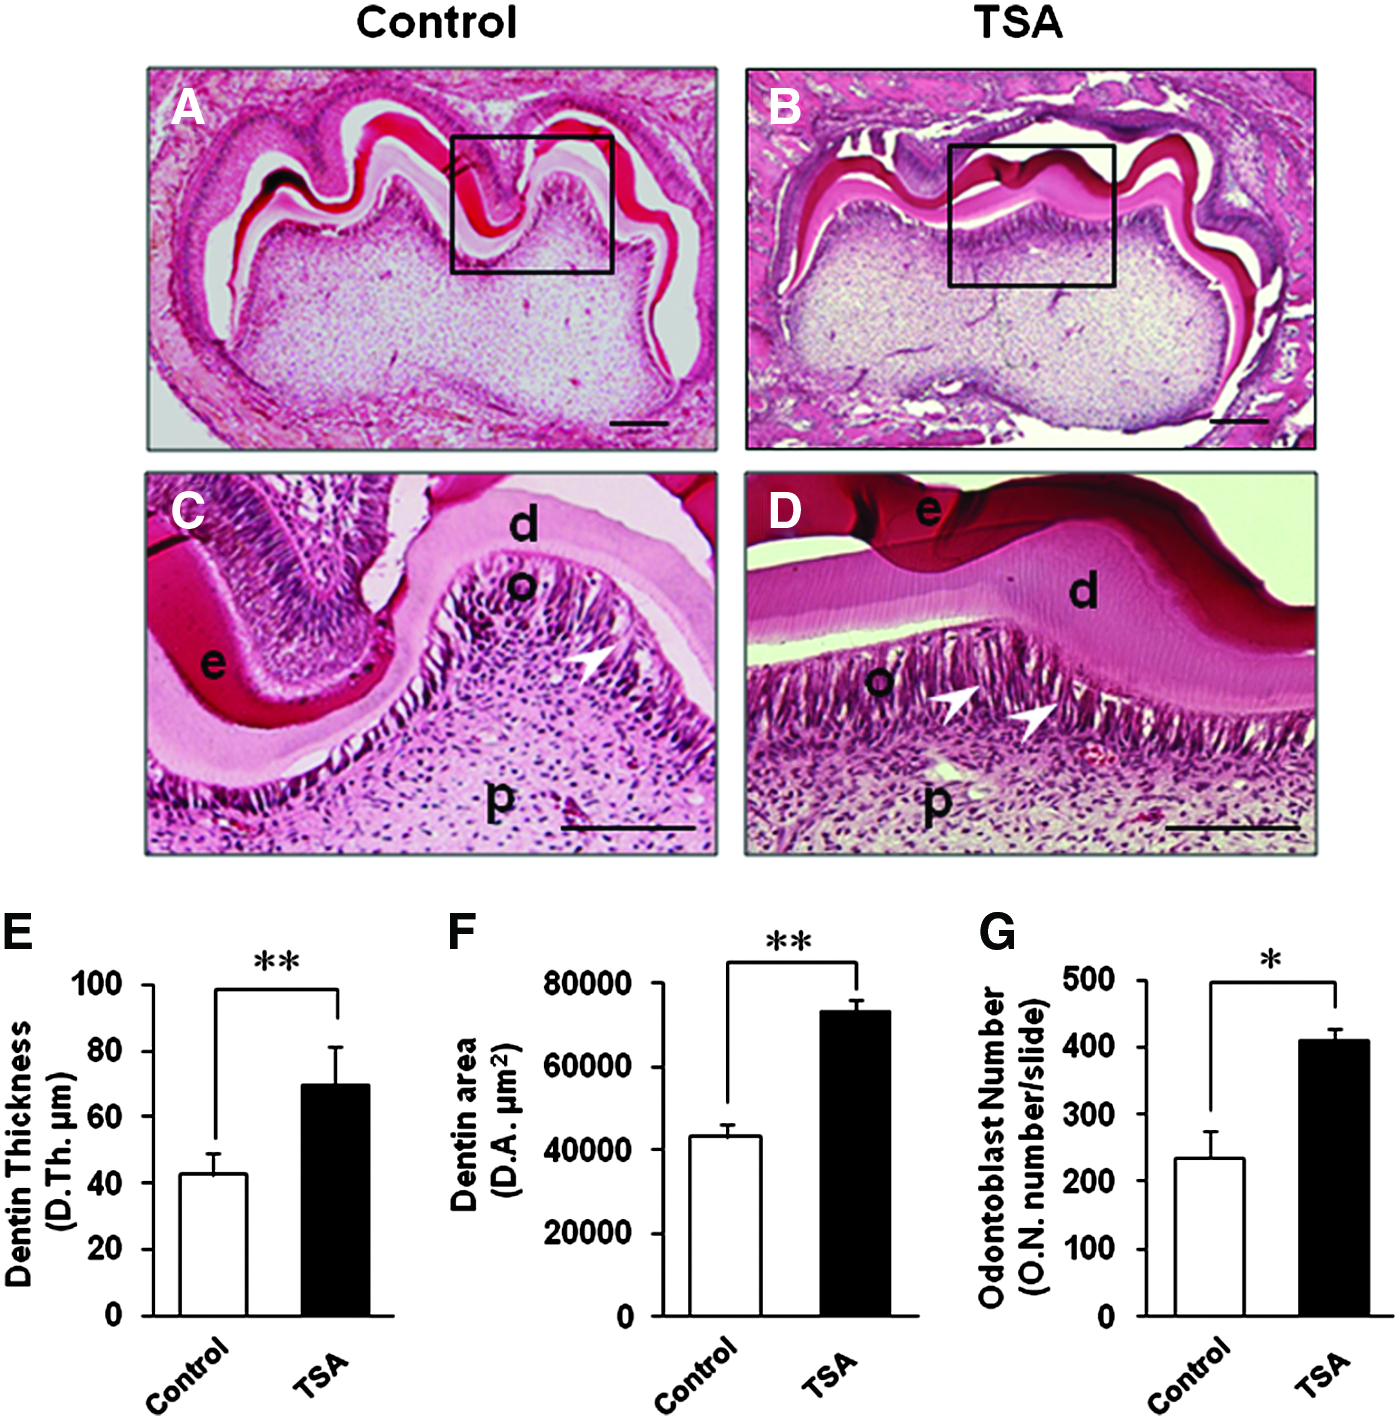
Histological and histomorphometric analysis showed that TSA increased dentin formation in vivo during murine tooth development stages.
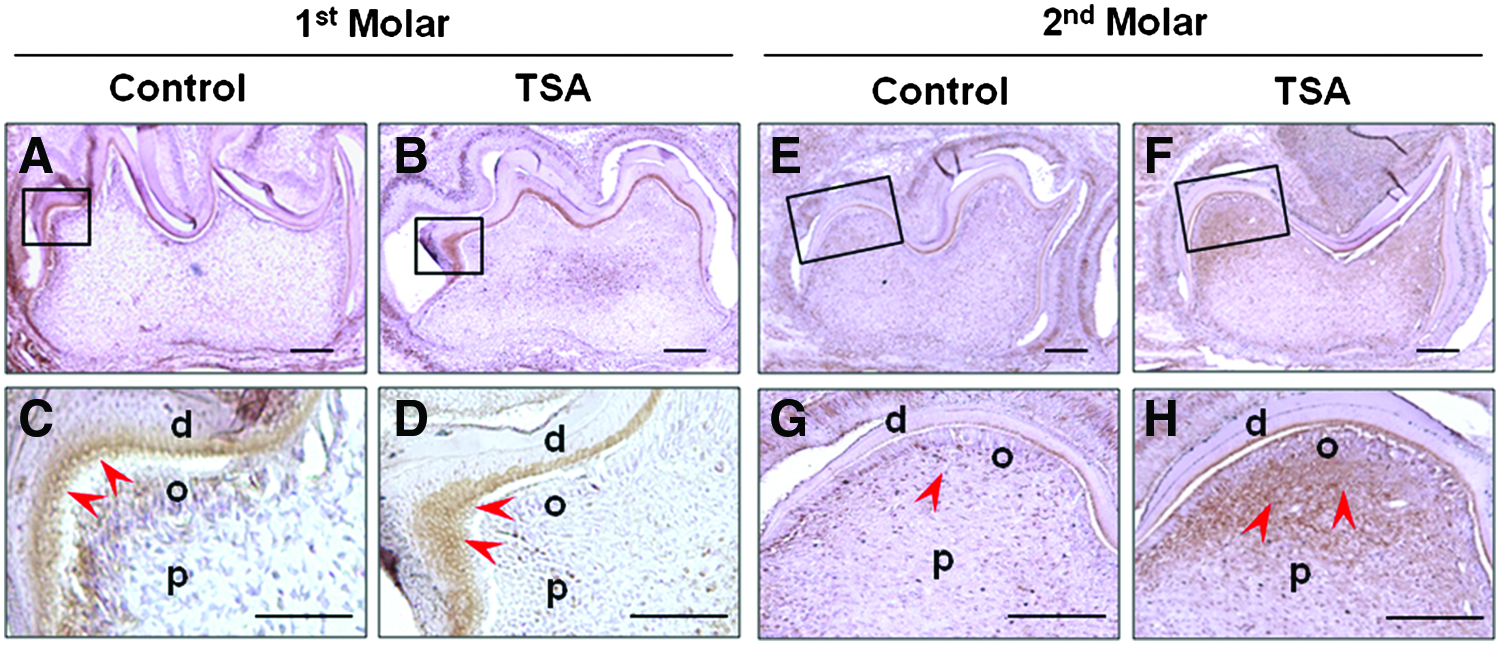
Immunohistochemical analysis showed that TSA promoted odontoblast differentiation in vivo during murine tooth development stages. Immunohistocheimcal staining showed stronger staining positivity of DSP in TSA group in both of the first and the second molars
The morphodifferentiation of second lower molars was later than that of first molars and the trend was also shown in this study (Fig. 7). 35 Interestingly, immunostained DSP was found around the secretary odontoblasts that were not lined up yet and more dispersed inside the dental papilla, compared with the first molar. However, inclination of the differentiated odontoblasts has begun, so the DSP expression was shown near the dentin–enamel junction and the DSP expression was much stronger in TSA group (Fig. 7, 2nd Molar, red arrows). Therefore, it was concluded that prenatally injected TSA promoted odontoblast differentiation and higher DSP production, and finally enhanced dentin formation in murine teeth in vivo.
Discussion
For the first time our present study showed that TSA promoted proliferation and odontoblast differentiation of hDPSCs in vitro and has the ability to enhance dentin formation in vivo during murine tooth development. TSA is known as a potent HDAC inhibitor that suppresses the activities of HDACs, including all 11 known human class I and class II HDACs. 36 HDACs have been recently implicated as coregulators in diverse tissue differentiation, such as adipogenesis and osteogenesis.37–39 Treatment of human mesenchymal stem cells with TSA stimulates their osteogenic differentiation with increased expression of ALP and mineralization in vitro. 18 Another study reported that inhibition of HDAC activity resulted in adipocyte differentiation in 3T3-L1 cells. 39 However, the effects of TSA on dental stem cells for their proliferation and differentiation in vitro and in vivo have never been elucidated.
Our previous studies showed successful isolation and characterization of various human dental stem cells and there were differences in proliferation and differentiation abilities among the stem cell kinds. 1 The differences exist depending on the cell donors, tooth developmental stages, and even cell colonies, although the colonies were isolated from the identical tissue.40,41 To standardize the discrepancy originated from cell diversity, we used the pooled hDPSCs from three different single-cell colonies that were randomly selected from the three different donors' dental pulp. The pooled hDPSCs showed 45.2% and 53.0% of relative intensity of STRO-1 and CD146, respectively, and the level of relative intensities was similar as the related previous studies.1–3
The most appropriate concentration of TSA that can affect on the proliferation of hDPSCs was 20 nM in vitro. Concentration of 100 nM definitely showed cell cytoxicity and O.D. value began to decrease from 50 nM of TSA treatment. TSA of 20 nM increased proliferation of hDPSCs by 72 h and two cell proliferation markers PCNA and cyclin D1 were also highly expressed at 48 h of culture. Therefore, it was concluded that a certain concentration of TSA promotes proliferation of hDPSCs in vitro. This proliferative effect of TSA was related JNK pathways without affecting the activation of ERK, p38, and AKT. C-Jun, the best-characterized substrates of JNK, was also upregulated with TSA treatment. Further, we found that the prevention of JNK/c-Jun pathway by JNK inhibitor SP600125 inhibited the TSA-induced proliferation of hDPSCs. Taken together, it was proved that JNK/c-Jun pathway is essential in TSA-induced proliferation of hDPSCs.
The differentiating effects of TSA on hDPSCs were also proved in this study at early stage of mineralization as well as at the mature stage. Only 1 week of mineralization induction showed higher ALP staining in TSA group than in control group and 3 weeks of differentiation induction certainly showed significantly higher calcium contents in TSA group (Fig. 4A, B). However, the specific differentiation lineage of hDPSCs by TSA should be examined: whether hDPSCs would differentiate into osteoblasts or odontoblasts. TSA increased mRNA expression of BSP and DMP1 after 21 days of culture (Fig. 4D, E), but the expression of these genes was known to be shared by osteoblasts and odontoblasts. 3 BSP is a non-collagenous protein in bone, dentin, cementum, and calcified cartilage tissues but BSP is ∼10-fold more abundant in bone than in dentin.38,42 DSPP is known as the odontoblast-specific gene that regulates initiation of dentin mineralization and DSPP protein is 400-fold more abundant in dentin than in bone. 34 The mRNA level of DSPP was increased by approximately eight folds in TSA-treated hDPSCs in this study, compared with the control hDPSCs. Besides, NFI-C is an essential transcription/replication factor for odontogenic cell proliferation and odontoblast differentiation, and the protein level of NFI-C was increased by 20 nM TSA treatment. However, Runx2, which commits multipotent mesenchymal cells into the osteoblastic lineage and inhibits adipocyte differentiation and also essential for chondrocyte maturation, was not influenced by TSA at all 30 (Fig. 5B). These data suggested that TSA promoted differentiation of hDPSCs into the specific lineage of mesenchymal cells, the odontoblasts, not into the osteoblasts.
During dentin formation, odontoblasts undergo a series of maturation stages, including cell proliferation, matrix synthesis, and a final stage of differentiation concomitant with extracellular matrix mineralization. 43 Proliferating odonto-progenitors then proceed to differentiate into mature odontoblasts. Therefore, based on the results of this study, it was postulated that the proliferative effects of TSA on hDPSCs could be related to the further differentiation induction ability of TSA.
It was also revealed for the first time that Smad2/3 was crucial in TSA-dependant odontoblast differentiation of hDPSCs in this study. Smad proteins play a pivotal role in mediating the diverse effects of TGF family members that regulate many diverse biological processes, such as developmental pattern formation, cell proliferation, differentiation, and tumorigenesis.32,44 Currently, the functional relationship between Smad proteins and NFI-C in odontoblast differentiation and dental root formation is under investigation.31,45 Nevertheless, TSA treatment in hDPSCs increased the levels of phospho-Smad2/3 and Smad4 as well as NFI-C and the SIS3 inhibited TSA-induced mineralization differentiation. SIS3 inhibits Smad3 specifically, but Smad2 and Smad3 are known to interact directly with and form heteromeric complexes with Smad4 on phosphorylation. Smad4 is known as a common mediator for all Smad pathways. 33 Therefore, treatment of SIS3 induced inhibition of Smad2, 3, and 4 complexes formation and possibly disturbed downstream pathways, targeting NFI-C. Therefore, further study is necessary to investigate whether Smad2/3 is directly connected to NFI-C. Although this hypothesis cannot be concluded in this study, it was strongly suggested that Smad2/3 and NFI-C play an important role in TSA-dependant odontoblast differentiation of hDPSCs (Fig. 5B, C).
Our murine animal experiment supported that TSA also affected odontoblast differentiation and dentin formation in vivo. The regenerative animal defect model, such as mouse calvarial bony defect or designed tooth defects with or without TSA treatment, could be also used in this study. However, we strongly believe that no regenerative model can exactly reproduce the embryological in vivo developmental stages. Tooth development was known as such complicated and delicate processes with various progenitor cells from different origins and their interactions.29,31,32,34,38,43 Therefore, observation of the mouse embryos with or without TSA can be the most appropriate in vivo study to elucidate the function of TSA in odontoblast differentiation and dentin formation. TSA was injected via tail vein and the drug could influence not only the progenitor cells in dental papilla but also various neighboring cells. However, odontoblasts have been known as the specific cells that secrete DSP so far, and the odontoblasts were originated from the progenitor cells in dental papilla and begin to differentiate at the late bell stage. 43 Therefore, the thicker dentin, more odontoblasts, and higher DSP detection in TSA group strongly suggested that the injected TSA may influence DPSCs, promoted odontoblast differentiation and dentin formation in vivo (Fig. 6).
To conclude, we have demonstrated that a certain concentration of TSA increased proliferation of hDPSCs via JNK signaling pathway and promoted odontoblast differentiation via Smad2/3- and NFI-C-related signaling pathways in vitro. TSA seemed to influence DPSCs in dental papilla in the murine late bell stage and also promoted odontoblast differentiation and dentin formation in vivo. Based on these results, further studies on TSA as a regulator of dental tissue regeneration are necessary and its therapeutic application is possible.
Footnotes
Acknowledgment
This research was supported by the National Research Foundation of Korea (NRF) funded by the Ministry of Education, Science and Technology (No. 2011-0028922).
Disclosure Statement
No competing financial interests exist.