
Abstract
Tissue engineering is a promising approach to repair critical-size defects in bone. Damage to vasculature at the defect site can create a lower O2 environment compared with healthy bone. Local O2 levels influence stem cell behavior, as O2 is not only a nutrient, but also a signaling molecule. The hypoxia-inducible factor-1 (HIF-1) is a transcription factor that regulates a wide range of O2-related genes and its contribution in bone repair/formation is an important area that can be exploited. In this study, we examined the effect of low O2 environments (1% and 2% O2) on the osteogenic differentiation of adipose-derived stem cells in both two-dimensional (2-D) and three-dimensional (3-D) culture systems. To determine the role of HIF-1 in the differentiation process, an inhibitor was used to block the HIF-1 activity. The samples were examined for osteogenesis markers as measured by quantification of the alkaline phosphatase (ALP) activity, mineral deposition, and expression of osteonectin (ON) and osteopontin (OPN). Results show a downregulation of the osteogenic markers (ALP activity, mineralization, ON, OPN) in both 1% and 2% O2 when compared to 20% O2 in both 2-D and 3-D culture. Vascular endothelial growth factor secretion over 28 days was significantly higher in low O2 environments and HIF-1 inhibition reduced this effect. The inhibition of the HIF-1 activity did not have a significant impact on the expression of the osteogenic markers, suggesting HIF-1-independent inhibition of osteogenic differentiation in hypoxic conditions.
Introduction
The loss of vasculature at CSD sites creates a hypoxic environment with O2 concentrations of ∼0%–3%.8–11 Hypoxia can exert a significant influence on stem cell behavior as O2 is not only a nutrient, but a signaling molecule.12–15 Hypoxia-inducible factor 1 (HIF-1) is a heterodimeric transcription factor. The stability of the alpha subunit (HIF-1α) is primarily regulated by the O2 concentration. HIF-1 drives transcription of a wide range of O2-regulated genes through interaction with hypoxia-responsive elements in their promoters, introns, and/or 3′ enhancers.16,17 Many stem cells are found in hypoxic environments in the body (defined as <5% O2) and the HIF activity is critical in embryonic development.18–20 The important role HIF-1 plays in bone formation and repair has been discussed in a number of prior reviews.21–23
Formation of new, vascularized bone to repair a CSD is a complex process involving numerous cell types and interplay of biochemical, mechanical, and environmental stimuli. This contributes to the difficulty in interpreting results regarding the importance of hypoxia and HIF signaling in these processes. Studies conducted in vivo have shown the importance of HIF signaling on bone formation and repair, but it is difficult to decouple osteogenesis from angiogenesis.24,25 Hypoxic signaling is a major driving force for angiogenesis and the vascular endothelial growth factor (VEGF) is a critical target of the HIF activity.26,27 HIF-1 plays a key role in blood vessel formation and blocking the HIF-1 activity will impair vascular growth and bone repair.
The HIF-1 activity is also involved in chondrogenesis and maintenance of chondrocyte viability that are essential steps in endochondral bone formation.28–30 The steps toward bone formation are difficult to track and isolate in in vivo, and while the HIF activity seems to be essential for bone formation in general, its impact on osteogenesis is less clear.
The majority of the literature indicates an inhibitory role for hypoxia on osteogenesis of mesenchymal stem cells in vitro.31–36 A few studies, however, have shown the opposite effect.37,38 This could be due to varied cell sources, a range of O2 conditions used to represent hypoxic conditions, and the timing of hypoxic exposure. 39
Bone formation strategies taking place ex vivo can occur in a wide range of possible O2 concentrations and many utilize atmospheric conditions (20% O2). However, when differentiation takes place at a CSD, the environment will be hypoxic. Determination of whether HIF-1α represents a therapeutic target with respect to osteogenesis would enhance bone tissue-engineering efforts. Our studies were designed to provide information about the impact of hypoxia on osteogenesis of ADSCs in both two-dimensional (2-D) and three-dimensional (3-D) culture conditions and whether blocking the HIF-1 activity would alter this effect. VEGF secretion from ADSCs in identical conditions was also monitored as coupling of osteogenesis and angiogenesis is essential to recreate endochondral bone formation.
Materials and Methods
Cell culture
Human ADSCs were purchased from Invitrogen and cell culture was performed according to the supplier's specifications. Cells were cultured in the proprietary MesenPRO RS™ basal medium supplemented with the MesenPRO RS Growth Supplement, 1% penicillin/streptomycin (Mediatech), and 2 mM L-glutamine (MP Biomedicals). Culture conditions for passaging were maintained at 95% air and 5% CO2 at 37°C. For experiments, cells between passages 2 and 7 were used as recommended by the supplier.
Hypoxic culture conditions
Nitrogen-purged, programmable incubators were used to maintain a constant 1% or 2% O2 level for hypoxic studies (Napco Series 8000 WJ; Thermo Electron). For 1% or 2% O2 experiments, all media, buffered salt solutions, and fixatives to be used with cells were kept in vented tubes in the hypoxic incubator for 24 h before use so as to equilibrate the solutions to the appropriate dissolved O2 concentration. Previous studies in our laboratory have shown this period to be sufficient to equilibrate the dissolved O2 concentration. 40 Media changes and imaging procedures were kept under 10 min per day to limit exposure to atmospheric conditions. Dissolved O2 concentration studies conducted in our laboratory showed that levels rose from 0.3 to 0.4 mg/L during a 10-min atmospheric exposure (which correlates to a 1% O2 to 1.5% O2 environment). The 1% or 2% O2 levels are re-established within 10 min of return to the incubator.
Cell encapsulation for 3-D experiments
Poly(ethylene glycol) (PEG) with an average molecular weight of 10,000 Da (Sigma-Aldrich) was functionalized by addition of methacrylate end groups resulting in poly(ethylene glycol) dimethacrylate (PEGDM) using a previously published method. 41 ADSCs were trypsinized, counted using a hemocytometer, and spun down in a microcentrifuge tube before removal of the media. Cells were then resuspended in a solution of 10 wt% PEGDM and 0.025 wt% 2-hydoxy-1-[4-(2-hydroxyethoxy)-phenyl]-2-methyl-1-propanone (Irgacure 2959; Ciba), which is a photoinitiator in the Hank's balanced salt solution (HBSS; Mediatech). ADSCs were suspended in PEGDM to create a concentration of 10,000 cells/μL. For each gel, 40 μL of this ADSC/PEGDM suspension was added to a 1-mL syringe and exposed to a 365 nm light source at an intensity of 7 mW·cm2 for 10 min under sterile conditions. The resulting gels were transferred to a 24-well plate, washed in HBSS, and placed in 1 mL of media. The plates were cultured in the varied O2 conditions on orbital shakers set to continuous rotation at 100 rpm. The encapsulation process is shown in a previously published video. 42
Osteogenic differentiation
Osteogenic differentiation was induced by culture in the StemPro® Osteocyte/Chondrocyte Differentiation Basal Medium and StemPro Osteogenesis Supplement (Invitrogen). These experiments were carried out for ADSCs in 2-D (100,000 ADSCs seeded per well of 12-well culture plates) as well as 3-D environments (encapsulated ADSCs as detailed in the previous section). The cells were monitored over a period of 28 days in 1%, 2%, and 20% O2 with the osteogenic medium replenished every 3 days.
HIF-1 inhibition
To inhibit the activity of HIF-1, a HIF-1 inhibitor {3-[2-(4-adamantan-1-yl-phenoxy)-acetylamino]-4-hydroxybenzoic acid methyl ester; Calbiochem} was used. It is a cell-permeable amidophenolic compound that inhibits the hypoxia-induced HIF-1 transcription activity. The inhibitor selectively blocks the hypoxia-induced accumulation of the cellular HIF-1α protein, while exhibiting no apparent effect on the cellular level of HIF-1α mRNA or that of the HIF-1β protein. For both 1% and 2% O2 samples, a concentration of 60 μM of this inhibitor was sufficient to reduce accumulation of HIF-1α to levels below detection in Western blotting (Supplementary Fig. S1; Supplementary Data are available online at www.liebertpub.com/tea). Toxicity tests showed no loss of viability of ADSCs exposed to the inhibitor at concentrations up to 100 μM (data not shown).
Alkaline phosphatase activity and DNA quantification
Measurements of the alkaline phosphatase (ALP) activity in the media of ADSCs were taken on days 7, 14, 21, and 28. The activity was determined using an ALP colorimetric assay kit (Abcam) with p-nitrophenyl phosphate as a substrate. The ALP activities were normalized to the cellular DNA content using a PicoGreen dsDNA quantitation kit (Molecular Probes) according to the manufacturer's instructions. The ALP activity is quantified on days 7, 14, 21, and 28 and is expressed in μmol/mL/min/mg DNA. The values included represent the mean of three independent studies.
Alizarin Red staining for mineralization
Mineral deposition was quantified on days 14 and 28 using the Alizarin Red S staining procedure. The cells were rinsed with calcium- and phosphate-free HBSS, and fixed with ice-cold 70% ethanol for 1 h. After a brief wash with HBSS, the cells were stained for 20 min with 40 mM of the Alizarin Red solution (pH 4.2) at room temperature (RT). The cells were rinsed two times for 15 min with HBSS (on an orbital shaker) to reduce nonspecific Alizarin Red staining. A 10% acetic acid was then added to the samples for 30 min on a shaker. Samples were collected by scraping (2-D) or vortex (3-D) and heated at 80°C for 10 min. The extracts are then centrifuged at 8000 rpm for 20 min and quantified spectrophotometrically with a microplate reader (Biotek) at 570 nm. The calcium concentration was calculated from the standard curve generated from a serial dilution of a calcium standard solution, and the values were normalized to DNA contents (expressed in mg mineral/mg DNA). Values included represent the mean of three independent studies.
Protein expression
Total cell lysates were collected from the 2-D and 3-D samples with the radio immunoprecipitation assay (RIPA) lysis buffer containing a protease and phosphatase inhibitor cocktail (Thermo Scientific), stirred on ice for 10 min, and sonicated for 15 min. The mixtures were then centrifuged at 14,000 rpm at 4°C for 15 min. The supernatants were collected and the protein concentration was quantified using a Coomassie Plus Bradford Assay kit (Thermo Scientific) according to the manufacturers' instructions.
Western blotting was performed by sodium dodecyl sulfate polyacrylamide gel electrophoresis (SDS-PAGE) with 50 μg of protein lysate loaded per lane of 4%–20% gradient gels followed by transfer to polyvinylidene fluoride membranes (Millipore). The membrane was first incubated in 5% dry milk, 1% bovine serum albumin (BSA) diluted in HBSS for 1 h at RT. The membrane was then washed twice for 10 min each in wash 1 (0.1% Tween-20, 0.1% dry milk, 0.1% BSA in HBSS). The membrane was then incubated with rabbit anti-HIF-1α antibody (1:1000; Santa Cruz Biotechnology), rabbit anti-osteonectin/SPARC antibody (1:1000), anti-osteopontin (OPN; 1:1000), or rabbit anti-β-actin antibody (1:1000; Santa Cruz Biotechnology) for 2 h at RT. The membrane was then washed three times for 10 min each in wash 1. Membranes were then incubated with peroxidase-conjugated goat anti-rabbit IgG (1:5000; Rockland Immunochemicals) for 2 h at RT. Membranes were then washed three times for 10 min each in wash 2 (0.1% Tween-20 in HBSS). Protein detection was achieved by a 5-min incubation in a chemiluminescence reagent, SuperSignal West Pico Substrate (Thermo Scientific). Bands were then detected using ChemiDoc™ XRS+ System with Image Lab™ image acquisition and analysis software (Bio-Rad). With densitometry analysis, the expression of proteins was normalized to β-actin and multiplied by 100 to generate a % intensity optical density (IOD) fold difference of protein expression. All incubation steps and washes were performed on an orbital shaker set to continuous rotation at 100 rpm. The statistics shown represent results obtained from three independent studies.
VEGF release
VEGF release was monitored in 2-D and 3-D samples with and without the HIF-1 inhibitor over 28 days. The supernatant was collected on days 1, 4, 7, and 28 and VEGF levels were determined using a colorimetric VEGF enzyme-linked immuno sorbent assay (ELISA) kit according to the manufacturer's instructions (Invitrogen). The absorbance was measured at 450 nm and VEGF standards are used to calculate a VEGF concentration. These values are multiplied by the volume used during the release studies, normalized relative to the viable cell number and expressed as (fg/cell). The data represent three independent studies and release over a 24-h period for all time points.
Viability of ADSCs
A Live/Dead® staining kit (Invitrogen) was used to test the viability of the samples over 28 days. Fluorescent dyes indicate an esterase activity (observed as the green signal in live cells) or a loss of nuclear membrane integrity (observed as the red signal in dead cells). The 2-D and 3-D samples were kept in culture conditions identical to the previous experiments and the staining was performed in accordance with the manufacturer's guidelines. Results are given as a percentage of viable cells based on analysis of three independent studies.
Statistical analysis
Statistical analysis was performed using Graphpad Prism 4.01 (GraphPad Software Inc.). Experimental results are expressed as the mean±standard deviation. All the collected data were analyzed by two-way analysis of variance (ANOVA) for comparisons and p-values <0.05 were defined as statistically significant differences.
Results
ALP activity
In 2-D, the ALP activity at 20% O2 without the HIF inhibitor was 9.15±0.93, 22.11±3.14, 32.01±3.14, and 33.98±2.34 μmol/mL/min/mg DNA on days 7, 14, 21, and 28, respectively. With the HIF inhibitor, the ALP levels were 8.43±2.76, 20.21±2.47, 28.73±2.31, and 31.79±3.12 μmol/mL/min/mg DNA on days 7, 14, 21, and 28, respectively. At 2% O2, the ALP levels without the inhibitor were 9.42±0.72, 20.35±3.31, 21.82±3.32, and 23.21±1.68 μmol/mL/min/mg DNA on days 7, 14, 21, and 28, respectively. With the inhibitor, the ALP levels were 6.45±1.43, 18.75±2.36, 22.36±1.92, and 24.42±2.67 μmol/mL/min/mg DNA on days 7, 14, 21, and 28, respectively. At 1% O2, ALP levels without the inhibitor were 8.11±0.91, 19.43±1.87, 23.13±1.21, and 23.89±1.62 μmol/mL/min/mg DNA on days 7, 14, 21, and 28, respectively. With the HIF inhibitor, the ALP levels were 10.1±1.32, 16.23±2.42, 19.87±1.91, and 21.42±2.63 μmol/mL/min/mg DNA. These results are shown in Figure 1A.

The alkaline phosphatase (ALP) activity of adipose-derived, mesenchymal stem cells at 1%, 2%, and 20% O2 with and without the hypoxia-inducible factor-1 inhibitor in
In 3-D, ALP levels at 20% O2 without the HIF inhibitor were 7.75±0.76, 19.11±1.34, 28.17±2.53, and 35.39±3.25 μmol/mL/min/mg DNA on days 7, 14, 21, and 28, respectively. With the inhibitor, the ALP levels were 8.91±1.65, 21.45±2.41, 27.81±3.11, and 38.21±3.22 μmol/mL/min/mg DNA on days 7, 14, 21, and 28, respectively. At 2% O2, the ALP levels without the inhibitor were 7.51±0.75, 20.73±1.45, 23.26±3.62, and 24.32±2.33 μmol/mL/min/mg DNA on days 7, 14, 21, and 28, respectively. With the inhibitor, the ALP levels were 8.13±1.23, 17.53±2.62, 22.81±2.14, and 22.87±4.54 μmol/mL/min/mg DNA on days 7, 14, 21, and 28, respectively. At 1% O2, the ALP levels without the inhibitor were 6.22±0.87, 16.95±1.52, 23.42±1.89, and 23.84±1.28 μmol/mL/min/mg DNA on days 7, 14, 21, and 28, respectively. With the inhibitor, the ALP levels were 9.65±1.54, 17.57±2.34, 21.42±3.73, and 22.13±2.51 μmol/mL/min/mg DNA on days 7, 14, 21, and 28, respectively. These results are shown in Figure 1B.
Mineralization
In 2-D, at 20% O2 and without the inhibitor, mineral deposition was observed to be 33.04±1.61 and 55.28±3.66 mg mineral/mg DNA on days 14 and 28, respectively. With the inhibitor, the mineral deposition levels were 31.13±1.52 and 54.21±3.54 mg mineral/mg DNA on days 14 and 28, respectively. At 2% O2, the mineral deposition levels without the inhibitor were 11.34±1.34 and 34.87±2.76 mg mineral/mg DNA on days 14 and 28, respectively. With the HIF inhibitor, the mineral deposition levels were 9.83±3.16 and 32.45±2.710 mg mineral/mg DNA on days 14 and 28, respectively. At 1% O2, the mineral deposition levels without the inhibitor were 8.85±0.63 and 32.04±2.04 mg mineral/mg DNA on days 14 and 28, respectively. Without the inhibitor, the mineral deposition levels were 12.26±2.17 and 31.52±2.64 mg mineral/mg DNA on days 14 and 28, respectively. These results are shown in Figure 2A.
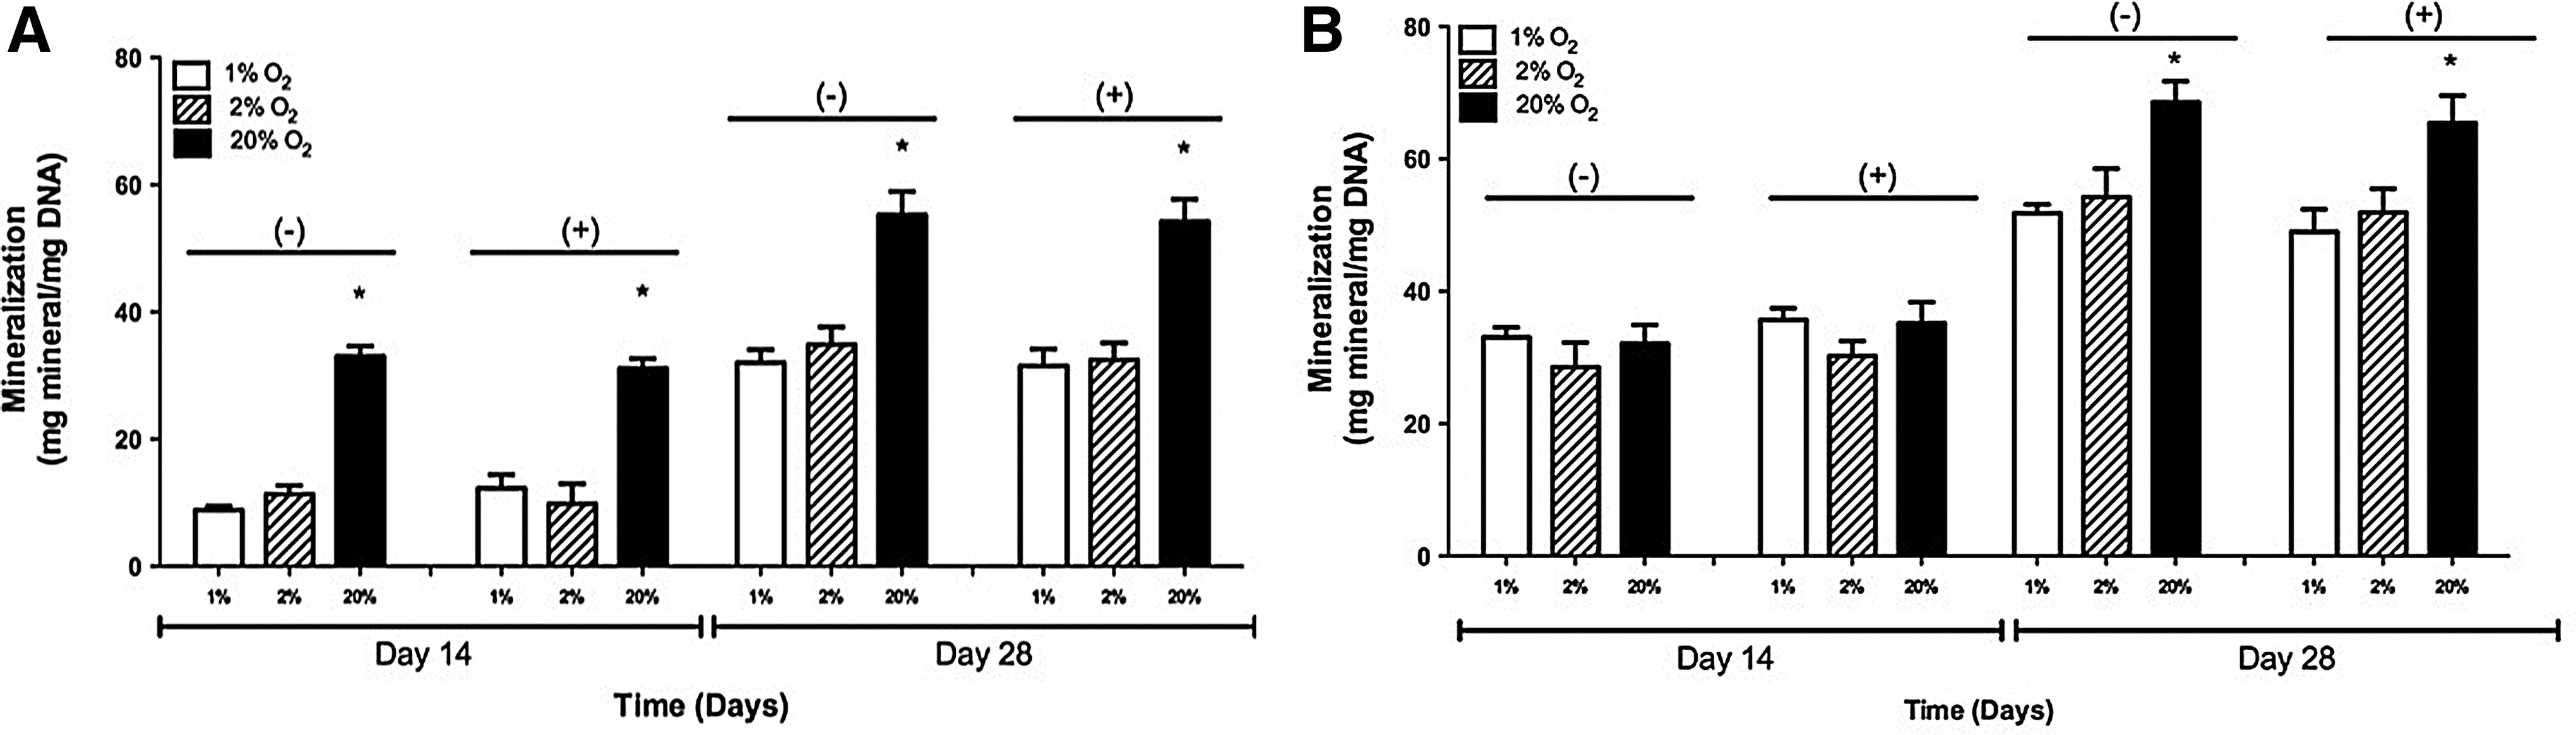
Quantification of Alizarin Red staining of adipose-derived, mesenchymal stem cells cultured in 1%, 2%, and 20% O2 with and without the hypoxia-inducible factor-1 inhibitor in
In 3-D samples, at 20% O2 and without the inhibitor, mineral deposition was observed to be 32.07±2.86 and 68.55±3.19 mg mineral/mg DNA on days 14 and 28. With the inhibitor, the mineral deposition levels were 35.15±3.23 and 65.42±4.16 mg mineral/mg DNA on days 14 and 28, respectively. At 2% O2, mineral deposition levels without the inhibitor were 28.56±3.72 and 54.23±4.28 mg mineral/mg DNA on days 14 and 28, respectively. With the inhibitor, the mineral deposition levels were 30.24±2.23 and 51.92±3.54 mg mineral/mg DNA on days 14 and 28, respectively. At 1% O2, mineral deposition levels without the inhibitor were 33.04±1.52 and 51.77±1.36 mg mineral/mg DNA on days 14 and 28. With the inhibitor, the mineral deposition levels were 35.71±1.72 and 48.98±3.41 mg mineral/mg DNA on days 14 and 28, respectively. These results are shown in Figure 2B.
HIF-1α protein expression
No HIF-1α protein was observed in 2-D studies when the inhibitor was present. In the absence of the inhibitor, no HIF-1α was observed at 20% O2. In the absence of the inhibitor, HIF-1α expression of 6.31±2.03 and 6.63±2.32 %IOD fold difference was observed in 2% and 1% O2 environments, respectively. A representative image of a gel and the collective results are shown in Figure 3A and B.
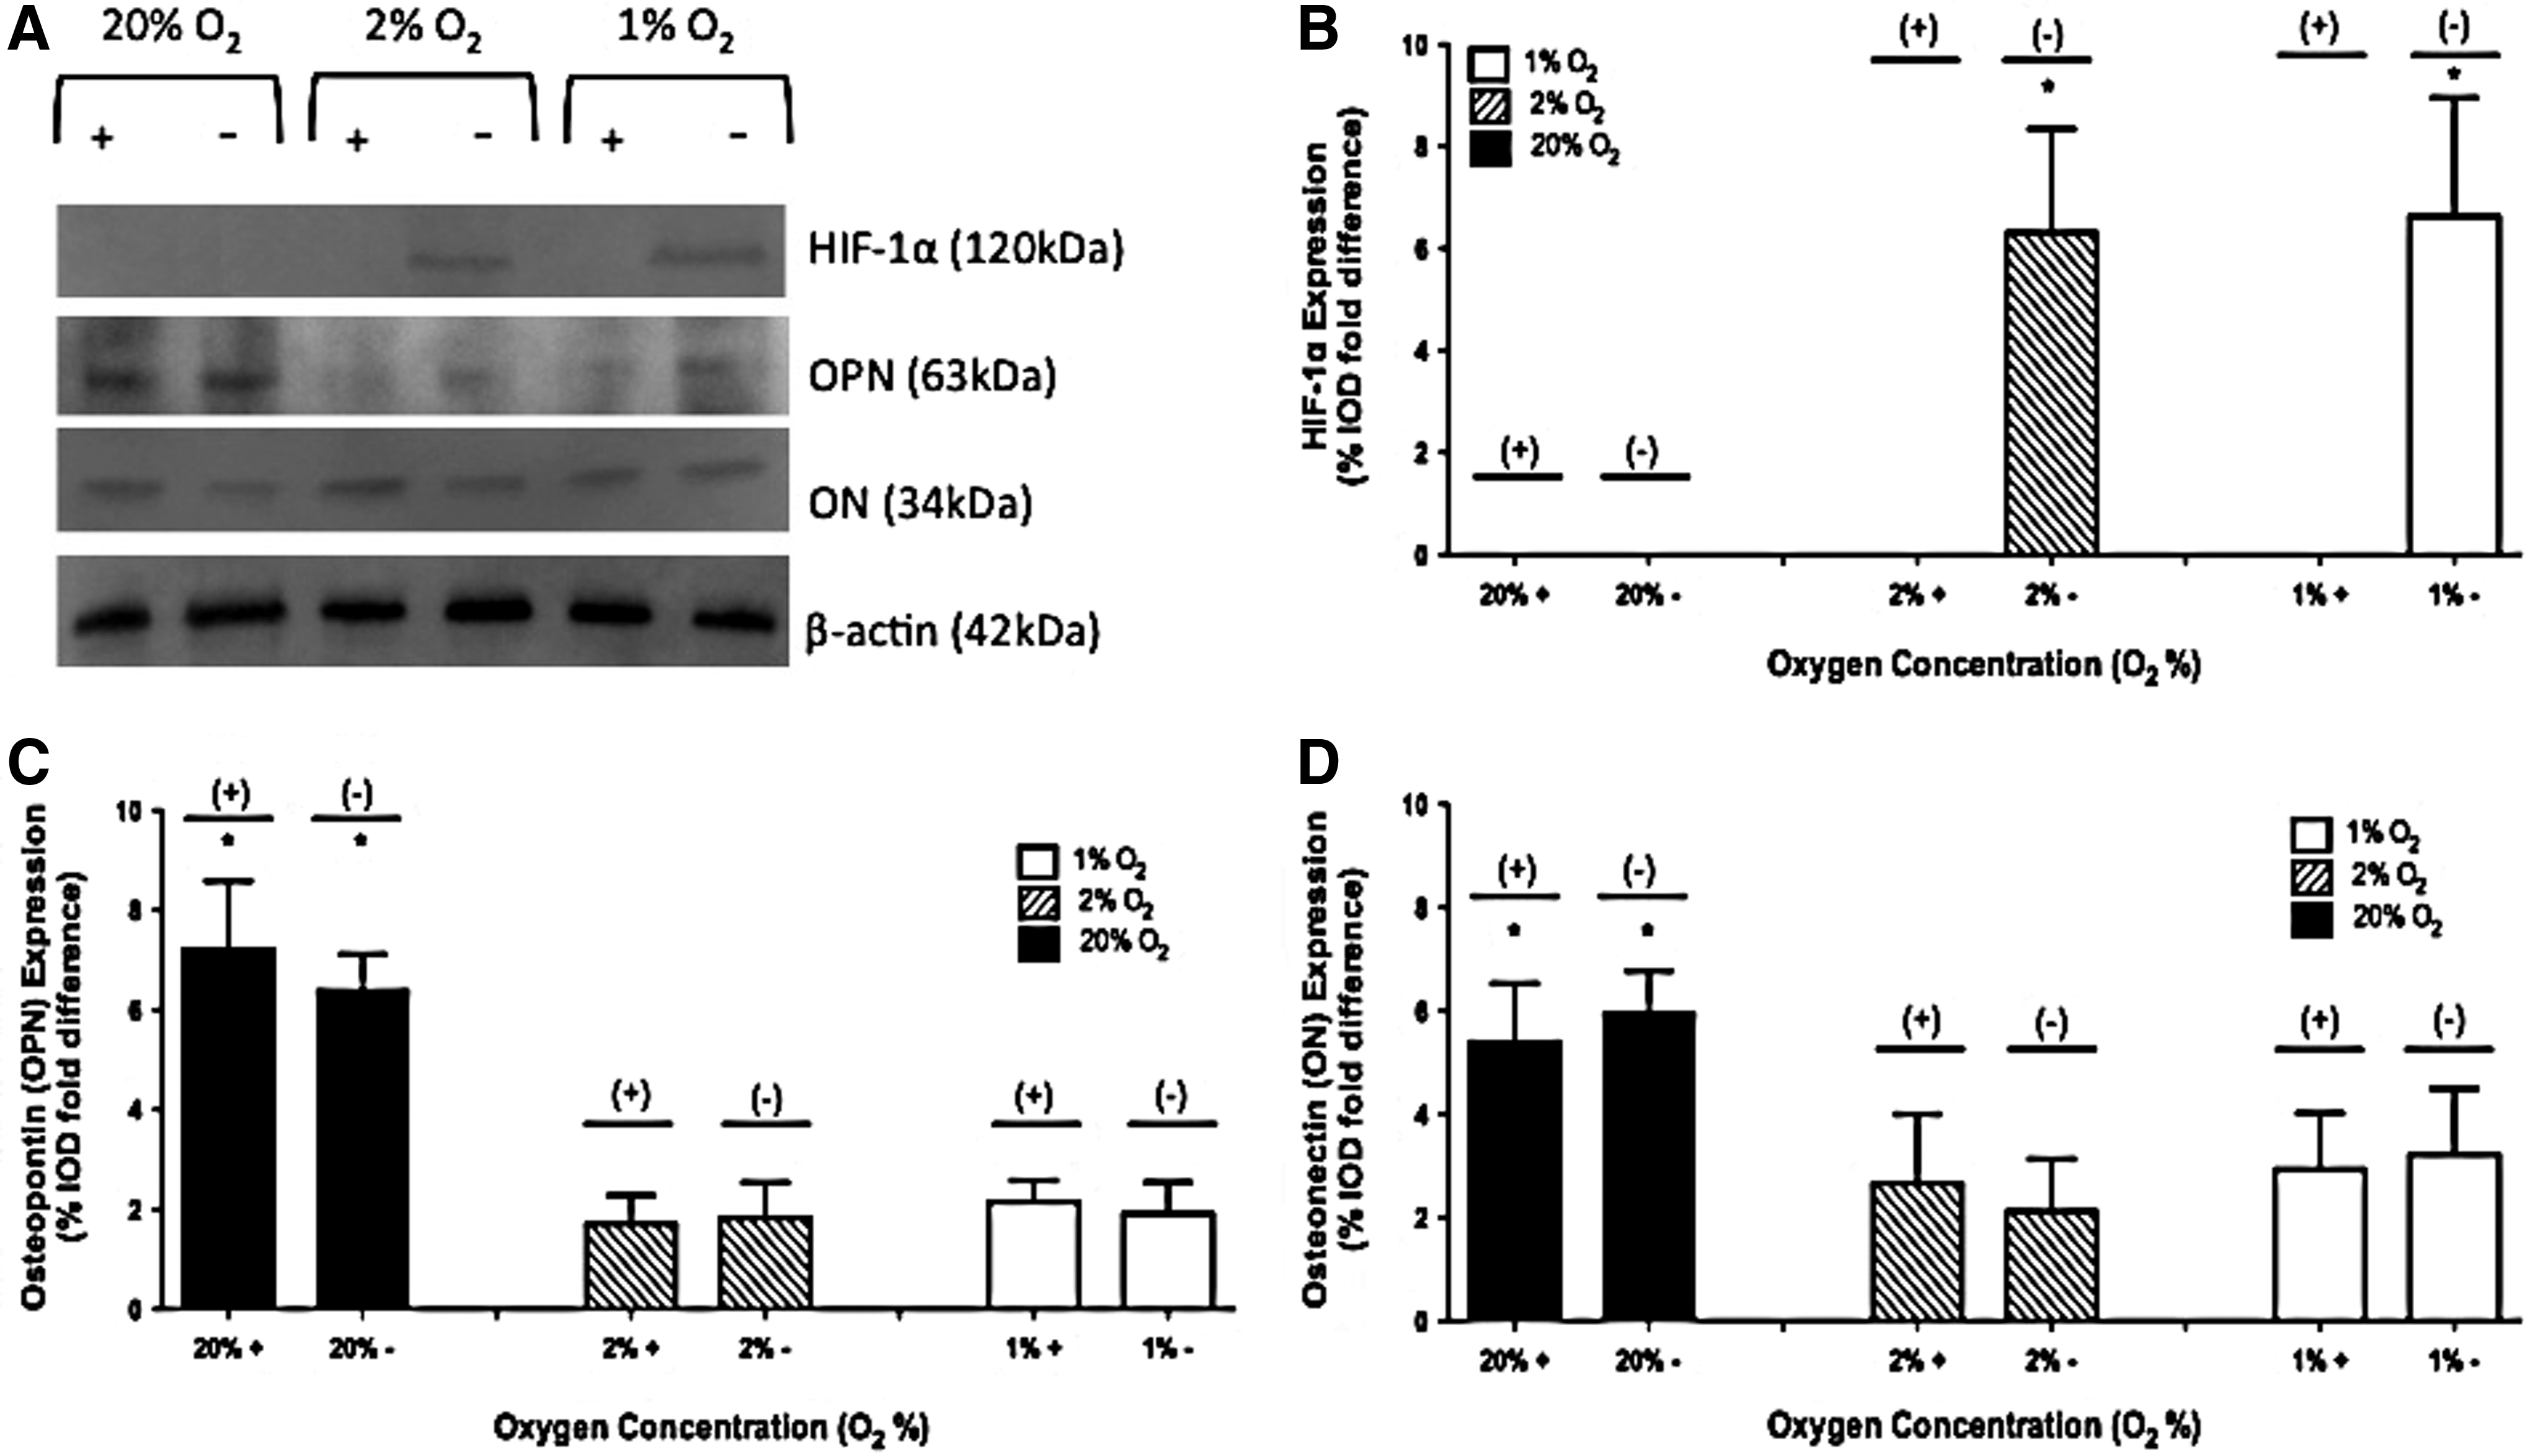
Protein expression of hypoxia-inducible factor-1α (HIF-1α), osteopontin (OPN), and osteonectin (ON) on day 28 at 1%, 2%, and 20% O2 with and without the HIF-1 inhibitor in 2-D culture. A representative gel is shown in
No HIF-1α protein was observed in 3-D studies when the inhibitor was present. In the absence of the inhibitor, HIF-1α expression of 1.14±0.34, 5.12±1.63, and 6.47±1.91 %IOD fold difference was observed in 20%, 2%, and 1% O2 environments, respectively. A representative image of a gel and the collective results are shown in Figure 4A and B.
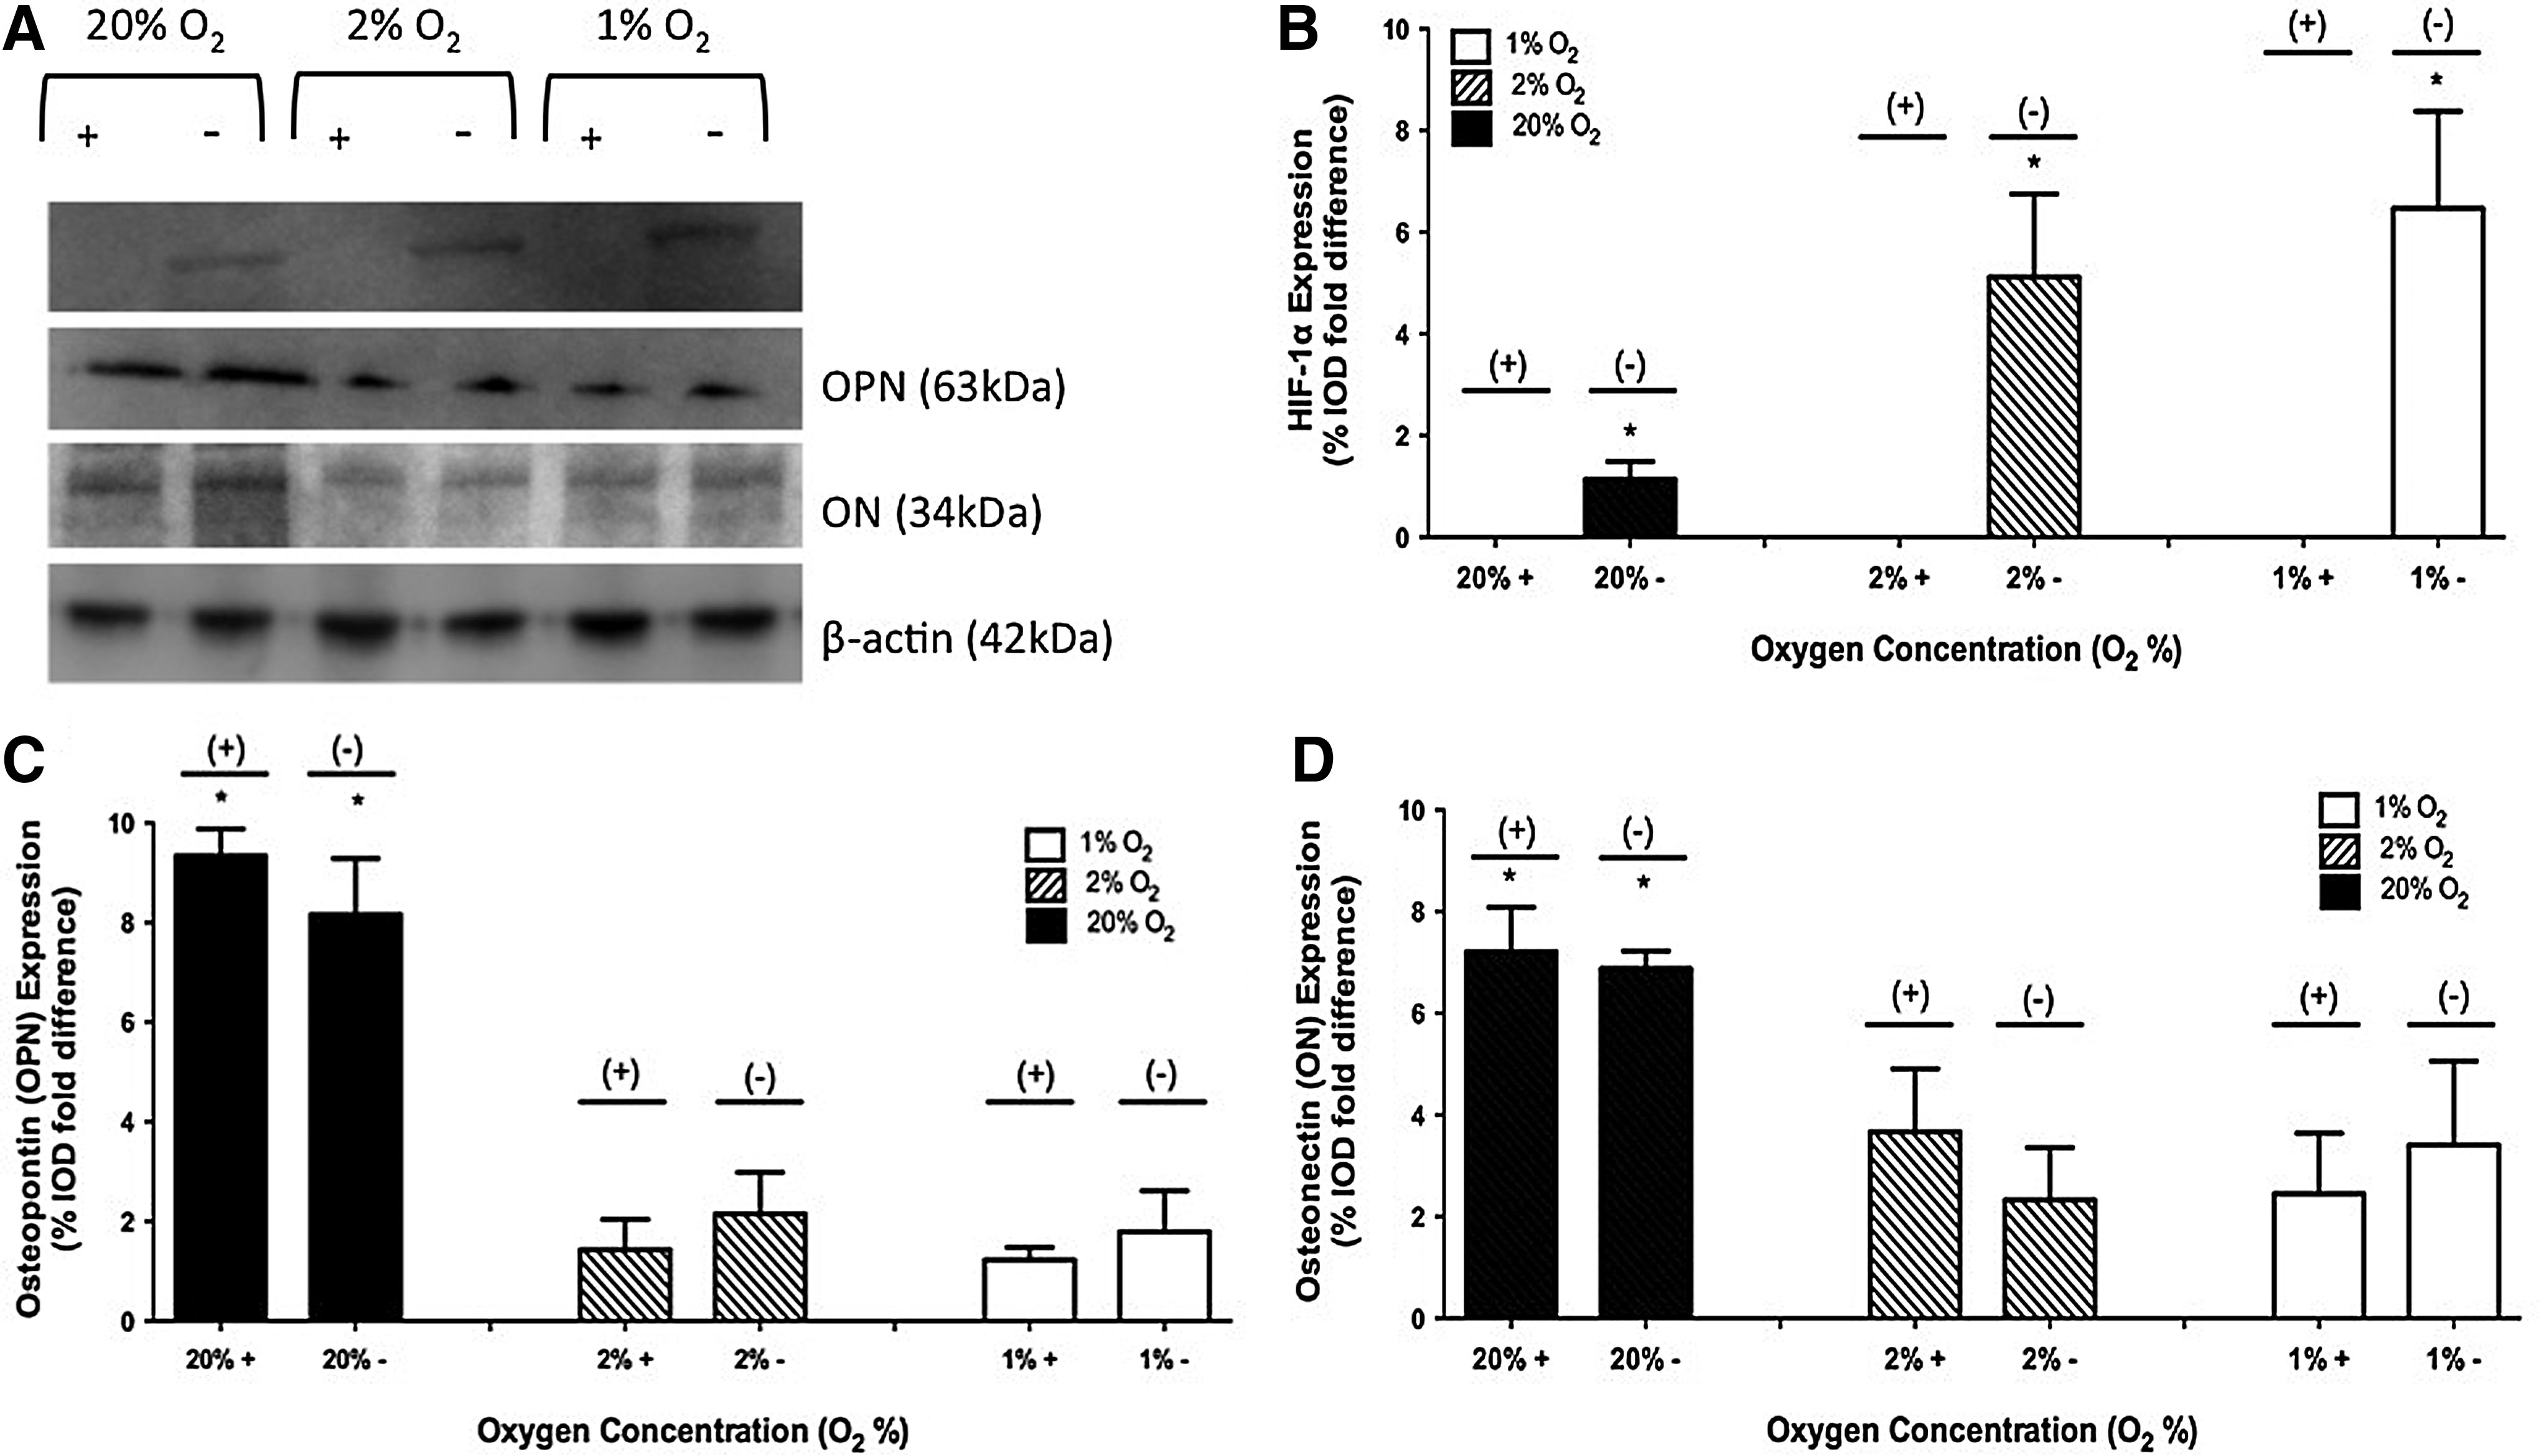
Protein expression of HIF-1α, OPN, and ON on day 28 at 1%, 2%, and 20% O2 with and without the HIF-1 inhibitor in 3-D culture. A representative gel is shown in
OPN protein expression
For 2-D studies in the absence of the inhibitor, OPN expression of 6.38±0.73, 1.82±0.72, and 1.92±0.61 %IOD fold difference was observed in 20%, 2%, and 1% O2 environments, respectively. When the inhibitor was present, OPN expression of 7.21±1.37, 1.71±0.57, and 2.15±0.43 %IOD fold difference was observed in 20%, 2%, and 1% O2 environments, respectively. A representative image of a gel and the collective results are shown in Figure 3A and C.
For 3-D studies in the absence of the inhibitor, OPN expression of 8.16±1.12, 2.15±0.83, and 1.79±0.82 %IOD fold difference was observed in 20%, 2%, and 1% O2 environments, respectively. When the inhibitor was present, OPN expression of 9.34±0.54, 1.43±0.61, and 1.23±0.25 %IOD fold difference was observed in 20%, 2%, and 1% O2 environments, respectively. A representative image of a gel and the collective results are shown in Figure 4A and C.
Osteonectin protein expression
For 2-D studies in the absence of the inhibitor, osteonectin (ON) expression of 5.97±0.81, 2.13±1.01, and 3.23±1.27 %IOD fold difference was observed in 20%, 2%, and 1% O2 environments, respectively. When the inhibitor was present, ON expression of 5.41±1.13, 2.67±1.34, and 2.93±1.09 %IOD fold difference was observed in 20%, 2%, and 1% O2 environments, respectively. A representative image of a gel and the collective results are shown in Figure 3A and D.
For 3-D studies in the absence of the inhibitor, ON expression of 6.88±0.34, 2.33±1.03, and 3.41±1.65 %IOD fold difference was observed in 20%, 2%, and 1% O2 environments, respectively. When the inhibitor was present, ON expression of 7.21±0.87, 3.67±1.24, and 2.45±1.19 %IOD fold difference was observed in 20%, 2%, and 1% O2 environments, respectively. A representative image of a gel and the collective results are shown in Figure 4A and D.
VEGF release
For 2-D studies at 20% O2 in the absence of the inhibitor, VEGF secretion was 1.52±0.21, 1.39±0.12, 1.63±0.16, and 1.78±0.23 fg/cell on days 1, 4, 7, and 28, respectively. With the HIF inhibitor, VEGF secretion was 1.81±0.55, 1.09±0.30, 1.61±0.25, and 2.08±0.15 fg/cell on days 1, 4, 7, and 28, respectively. At 2% O2 in the absence of the inhibitor, VEGF secretion was 23.51±2.13, 15.07±1.29, 12.82±0.84, and 5.21±0.94 fg/cell on days 1, 4, 7, and 28, respectively. With the HIF inhibitor, VEGF secretion was 4.51±1.38, 1.77±0.28, 1.64±0.08, and 1.88±0.30 fg/cell on days 1, 4, 7, and 28, respectively. At 1% O2 in the absence of the inhibitor, VEGF secretion was 31.26±1.24, 15.14±1.13, 12.55±0.92, and 7.57±0.48 fg/cell on days 1, 4, 7, and 28, respectively. With the HIF inhibitor, VEGF secretion was 5.78±0.82, 2.30±0.31, 2.48±0.47, and 1.67±0.25 fg/cell on days 1, 4, 7, and 28, respectively. The VEGF release results for 2-D studies are shown in Figure 5A.
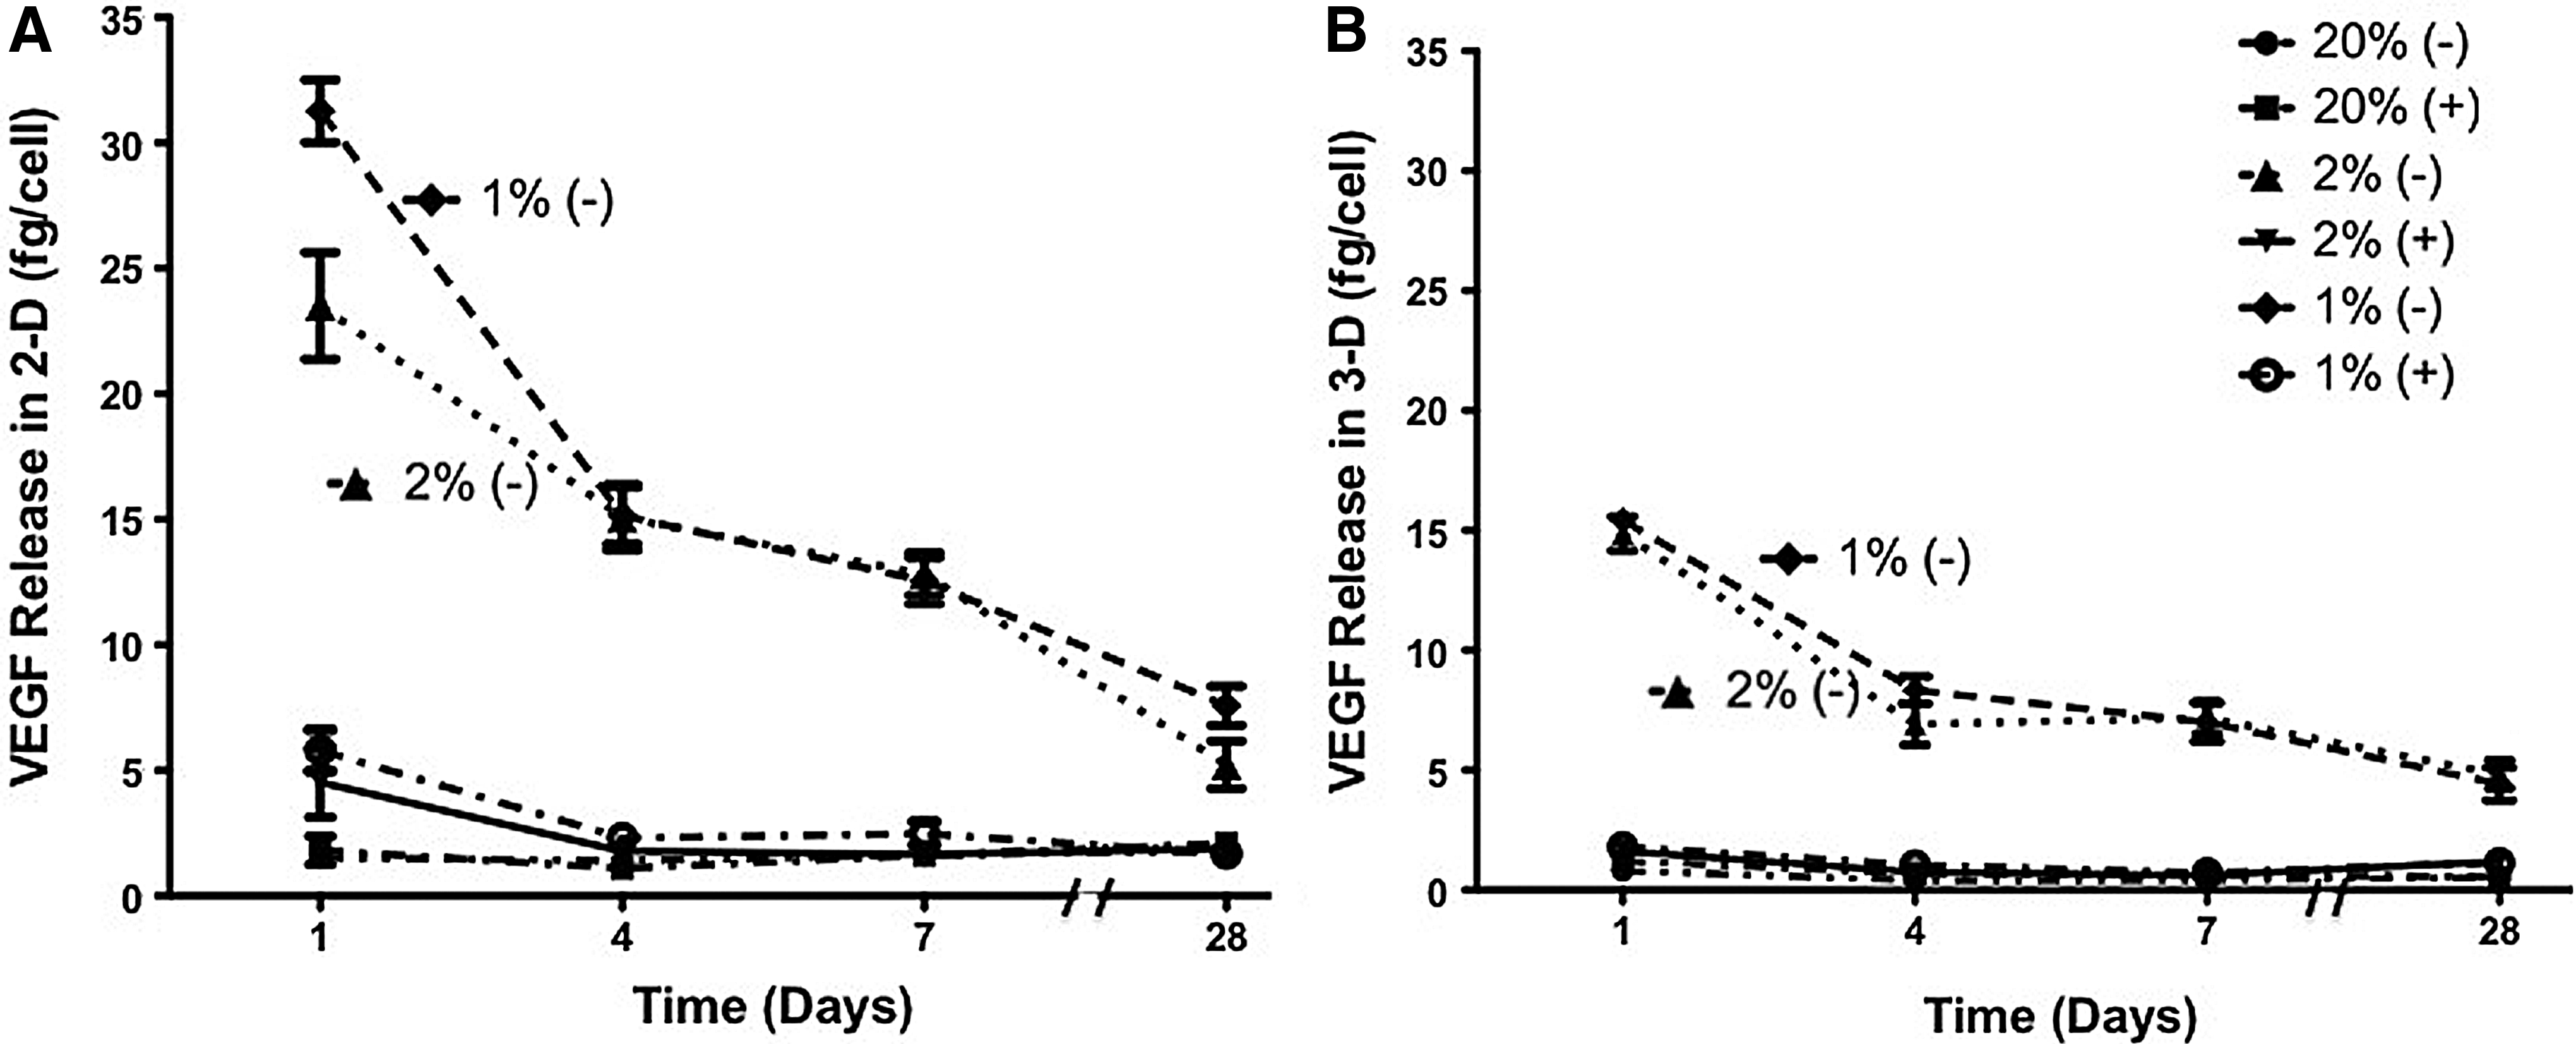
Vascular endothelial growth factor (VEGF) release of adipose-derived, mesenchymal stem cells at 1%, 2%, and 20% O2 with and without the HIF-1 inhibitor in
For 3-D studies at 20% O2 in the absence of the inhibitor, VEGF secretion was 0.80±0.33, 0.40±0.23, 0.41±0.10, and 0.51±0.22 fg/cell on days 1, 4, 7, and 28, respectively. With the HIF inhibitor, VEGF secretion was 1.2±0.18, 0.68±0.10, 0.60±0.08, and 0.54±0.12 fg/cell on days 1, 4, 7, and 28, respectively. At 2% O2 in the absence of the inhibitor, VEGF secretion was 14.86±0.71, 6.91±0.46, 7.18±0.36, and 4.82±0.23 fg/cell on days 1, 4, 7, and 28, respectively. With the HIF inhibitor, VEGF secretion was 1.61±0.11, 0.74±0.065, 0.61±0.23, and 1.19±0.06 fg/cell on days 1, 4, 7, and 28, respectively. At 1% O2 in the absence of the inhibitor, VEGF secretion was 15.43±0.41, 8.32±0.26, 7.00±0.41, and 4.42±0.28 fg/cell on days 1, 4, 7, and 28, respectively. With the HIF inhibitor, VEGF secretion was 1.80±0.15, 1.04±0.16, 0.71±0.08, and 1.13±0.20 fg/cell on days 1, 4, 7, and 28, respectively. The VEGF release results for 3-D studies are shown in Figure 5B.
ADSC viability
In 2-D, at 20% O2 and without the inhibitor, the percent viability was 99%±1%, 97%±1%, 91%±2%, 84%±4%, and 81%±6% on days 1, 7, 14, 21, and 28, respectively. With the HIF inhibitor, the percent viability was 99%±1%, 98%±1%, 93%±2%, 85%±6%, and 78%±4% on days 1, 7, 14, 21, and 28, respectively. At 2% O2, the percent viability without the inhibitor were 99%±1%, 96%±2%, 84%±5%, 72%±3%, and 64%±5% on days 1, 7, 14, 21, and 28, respectively. With the inhibitor, the percent viability was 99%±1%, 98%±1%, 82%±3%, 64%±7%, and 59%±5% with the inhibitor on days 1, 7, 14, 21, and 28, respectively. At 1% O2, percent viability with the inhibitor was 99%±1%, 96%±2%, 84%±3%, 69%±4%, and 66%±4% on days 1, 7, 14, 21, and 28, respectively. With the inhibitor, the percent viability was 99%±1%, 98%±1%, 85%±7%, 73%±5%, and 61%±7% on days 1, 7, 14, 21, and 28, respectively. These results are shown in Figure 6A.
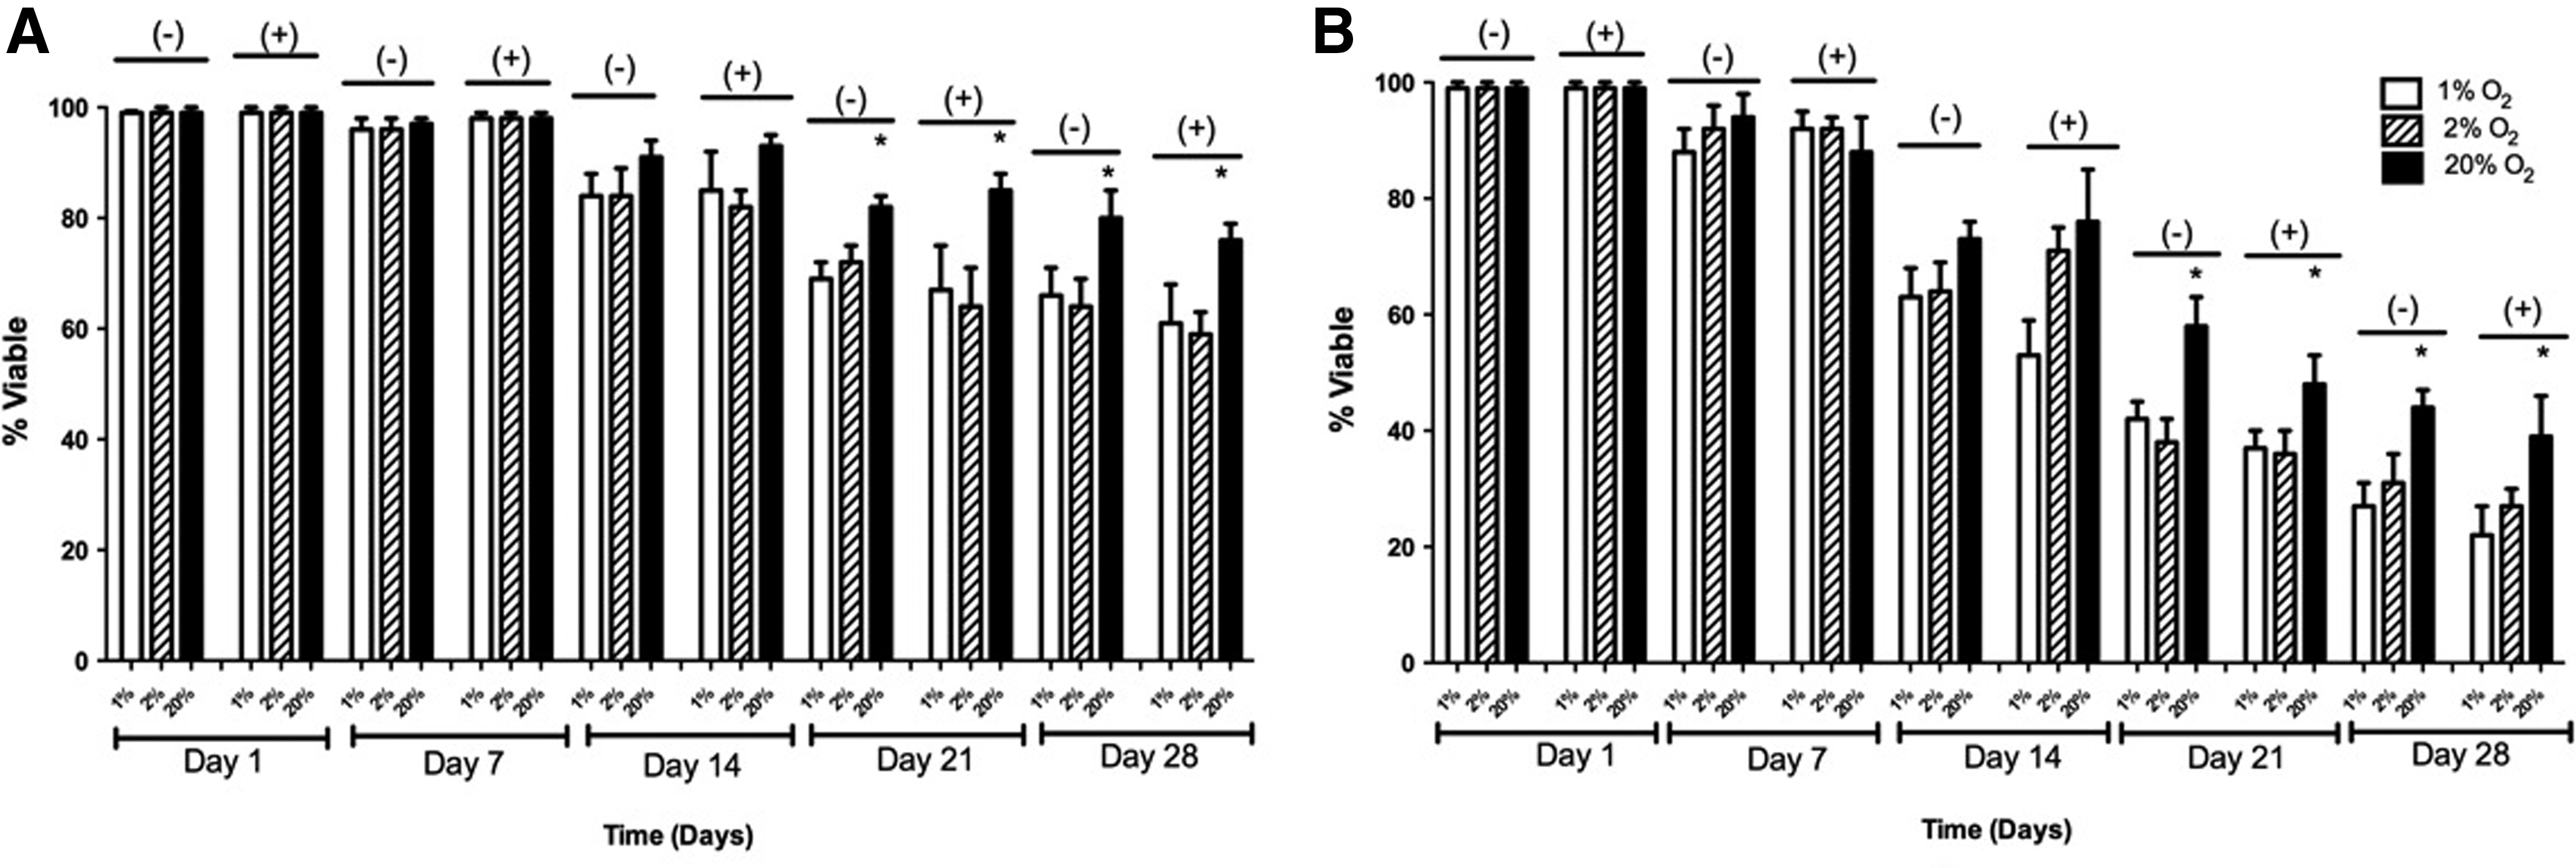
Viability of adipose-derived, mesenchymal stem cells in 1%, 2%, and 20% O2 with and without the HIF-1 inhibitor in
In 3-D culture, at 20% O2 and without the inhibitor, percent viability was 99%±1%, 94%±4%, 75%±4%, 61%±4%, and 47%±6% on days 1, 7, 14, 21, and 28, respectively. With the HIF inhibitor, the percent viability was 99%±1%, 89%±6%, 76%±7%, 58%±6%, and 44%±3% on days 1, 7, 14, 21, and 28, respectively. At 2% O2, percent viability without the inhibitor was 99%±1%, 92%±4%, 66%±5%, 46%±3%, and 33%±5% on days 1, 7, 14, 21, and 28, respectively. With the inhibitor, the percent viability was 99%±1%, 89%±3%, 71%±4%, 43%±7%, and 36%±6% with the inhibitor on days 1, 7, 14, 21, and 28, respectively. At 1% O2, percent viability without the inhibitor was 99%±1%, 88%±5%, 63%±6%, 42%±3%, and 29%±5% on days 1, 7, 14, 21, and 28, respectively. With the inhibitor, the percent viability was 99%±1%, 92%±3%, 55%±4%, 38%±6%, and 27%±3% on days 1, 7, 14, 21, and 28, respectively. These results are shown in Figure 6B.
Discussion
Our results demonstrate a reduced capacity for ADSCs to differentiate into osteoblasts in hypoxic conditions when compared with atmospheric conditions. ADSCs in 1% and 2% O2 environments displayed a reduced ALP activity, mineralization, and expression of ON and OPN in 2-D and 3-D culture geometries compared with ADSCs in 20% O2 environments. The HIF-1 activity does not appear to be an essential component of the varied response of ADSCs in hypoxic conditions. For all O2 concentrations and in both 2-D and 3-D cultures, pharmacologically induced inhibition of HIF-1α had no impact on any of these markers of osteogenesis.
Viability of ADSCs dropped over the course of our differentiation experiment, but our data are normalized to total DNA or β-actin to account for this. The viability decrease in 3-D was more pronounced than for 2-D cultures and this was probably a result of using an unmodified PEG gel. Previous work has shown that integrating integrin-binding sequences into the scaffold or genetic modification of cells can extend survival of mesenchymal stem cells (MSCs) in these materials by preventing anoikis. 43 We utilized a blank PEG gel to remove the impact of peptide modification on osteogenic differentiation, but future studies could evaluate peptide-modified PEG gels in combination with varied O2 concentrations.
As mentioned earlier, the literature shows mixed results concerning the impact of hypoxic conditions on osteogenesis and healing of CSDs. Given the large number of variables in play, this is not surprising. Different research groups utilize a range of cell types and hypoxic conditions vary across the entire range from below 1% up to 5% O2. When 3-D studies are conducted, O2 levels and the state of hypoxic signaling can vary widely for cells depending on experimental conditions (size of scaffolds, scaffold material(s), and cell density within scaffolds, for example). All of these factors make it difficult to draw definitive conclusions regarding the impact of hypoxia on bone formation that will hold regardless of the cell type employed and O2 concentration used.
Previous studies that have examined the role of HIF-1 through genetic engineering, have demonstrated how changes in the experimental procedure can impact the results. Three factors stand out in addition to those mentioned above. First, the role of HIF-1 may be impacted by whether the studies are investigating intramembranous or endochondral bone formation. Our studies are an in vitro model of intramembranous bone formation as mesenchymal stem cells are directly differentiated into osteoblasts. Our results are in agreement with a previous study that showed no impact on HIF-1α deletion on osteogenic differentiation of ADSCs. 29 Mice lacking HIF-1α showed impaired formation of long bones (endochondral), but no impact on bone formation in the skull (intramembranous). 24 The HIF-1 activity has been linked to chondrogenesis so whether this step is necessary could explain the varied results.30,44
Second, the HIF-1 activity has also been shown to impact angiogenesis.22,23 Our in vitro work included studies to look at VEGF release, which correlated with the O2 concentrations. Inhibition of HIF-1 also inhibited the release profile of VEGF. Release of VEGF at 1% and 2% O2 was significantly higher than at 20% or when the inhibitor was used for all time points (p<0.01). Our studies are in agreement with previous studies that have shown that VEGF is HIF-1 regulated.22,26,27,45–48 Our in vitro analysis does not include studies looking at the role of HIF-1 in vascularizing bone, but this is a critical process that would need to occur in vivo. Blocking vascular growth and maturation will lead to formation of thin, weak bone and this has been demonstrated by previous studies.24,25 Bone formation in vivo requires a coupling of osteogenesis and angiogenesis, making it difficult to evaluate the impact of HIF-1 on each process individually.
Finally, the timing of hypoxic exposure to cells plays a role in this process. A recent study showed the impact of conditioning human MSCs in 2% O2 before osteogenic differentiation in such an environment. 39 The inhibitory effect of low O2 on osteogenic differentiation (relative to culture in 20% O2) was mitigated when the cells were conditioned to this environment before differentiation.
Our results indicate that low O2 culture reduces osteogenic differentiation of ADSCs compared with atmospheric conditions in a HIF-1-independent manner. However, differentiation will never occur in atmospheric conditions if this event is to take place in vivo. Efforts to accelerate bone formation at CSD sites could potentially look at HIF-1 as a therapeutic target, but for modification of processes other than osteogenic differentiation of ADSCs. There are numerous strategies to track the HIF-1 activity at the cellular level.49,50 These systems show how the cells respond to their local O2 environment and can guide future work that targets HIF-1. In general, the HIF-1 activity should be beneficial for repair of CSDs, but this effect is not necessarily observed for all processes involved in bone formation.
Footnotes
Acknowledgment
The authors would like to acknowledge support for this work provided by grants P20GM103499 and R03AR062816 from the National Institutes of Health.
Disclosure Statement
No competing financial interests exist.
References
Supplementary Material
Please find the following supplemental material available below.
For Open Access articles published under a Creative Commons License, all supplemental material carries the same license as the article it is associated with.
For non-Open Access articles published, all supplemental material carries a non-exclusive license, and permission requests for re-use of supplemental material or any part of supplemental material shall be sent directly to the copyright owner as specified in the copyright notice associated with the article.