
Abstract
Although adult stem cell transplantation has been implemented as a therapy for tissue repair, it is limited by the availability of functional adult stem cells. A potential approach to generate stem and progenitor cells may be to modulate the differentiated status of somatic cells. Therefore, there is a need for a better understanding of how the differentiated phenotype of mature cells is regulated. We hypothesize that bioelectric signaling plays an important role in the maintenance of the differentiated state, as it is a functional regulator of the differentiation process in various cells and tissues. In this study, we asked whether the mature phenotype of osteoblasts and adipocytes derived from human mesenchymal stem cells (hMSCs) could be altered by modulation of their membrane potential. hMSC-derived osteoblasts and adipocytes were depolarized by treatment with ouabain, a Na+/K+ ATPase inhibitor, or by treatment with high concentrations of extracellular K+. To characterize the effect of voltage modulation on the differentiated state, the depolarized cells were evaluated for (1) the loss of differentiation markers; (2) the up-regulation of stemness markers and stem properties; and (3) differences in gene expression profiles in response to voltage modulation. hMSC-derived osteoblasts and adipocytes exhibited significant down-regulation of bone and fat tissue markers in response to depolarization, despite the presence of differentiation-inducing soluble factors, suggesting that bioelectric signaling overrides biochemical signaling in the maintenance of cell state. Suppression of the osteoblast or adipocyte phenotype was not accompanied by up-regulation of genes associated with the stem state. Thus, depolarization does not activate the stem cell genetic signature and, therefore, does not induce a full reprogramming event. However, after transdifferentiating the depolarized cells to evaluate for multi-lineage potential, depolarized osteoblasts demonstrated improved ability to achieve correct adipocyte morphology compared with nondepolarized osteoblasts. The present study thus demonstrates that depolarization reduces the differentiated phenotype of hMSC-derived cells and improves their transdifferentiation capacity, but does not restore a stem-like genetic profile. Through global transcript profiling of depolarized osteoblasts, we identified pathways that may mediate the effects of voltage signaling on cell state, which will require a detailed mechanistic inquiry in future studies.
Introduction
An alternative strategy for regenerating injured tissues may be to induce dedifferentiation of mature cells in the wound environment, producing a local supply of stem-like cells that can participate in healing. Such dedifferentiation occurs naturally in zebrafish heart and fin regeneration, urodele limb regeneration, and Schwann cell dedifferentiation after nerve injury.11–18 Dedifferentiation has been studied to a limited extent in MSCs. In hMSC-derived osteoblasts and adipocytes, simple withdrawal of the biochemical inducers of ostoegenic and adipogenic differentiation is sufficient to induce down-regulation of mature tissue markers. 19 Similarly, in MSC-derived neural cells, withdrawal of extrinsic induction factors reverted cells back to a mesenchymal morphology and suppressed neural markers. 20 These dedifferentiation strategies, while successful, may not be practical for achieving cell dedifferentiation in a wound environment, where the contents of the microenvironment cannot be easily eliminated. Thus, there is a need for novel methods to modulate the terminal differentiated status of cells, which may enable us to implement dedifferentiation as a therapeutic strategy for improving tissue regeneration.
One currently unexplored strategy for modulating the differentiated state of cells is the control of endogenous bioelectric signaling. Bioelectrical signaling regulates many biological functions from the cell level to the organ level (reviewed in21–26 ), and it has been shown to be necessary and sufficient for the regeneration and patterning of large structures (limb, tail, head, and eye) in a range of vertebrate and invertebrate model organisms.27–33 Bioelectric signaling has also been shown to regulate the behavior of mammalian stem and progenitor cells. For example, in human myoblasts, differentiation is triggered by Vmem hyperpolarization through the Kir2.1 channel. Hyperpolarization stimulates Ca2+ influx and calcineurin activation, resulting in myocyte fusion.34–38 Hyperpolarization also induces differentiation in cardiomyocyte progenitor cells via increased intracellular Ca2+ and NFAT activity. 39 Similarly, late-stage maturation of neural crest cells is characterized by Vmem hyperpolarization and expression of K+ and Na+ currents.40–43 In mouse embryonic stem cells, Vmem depolarization by blockade of Kv channels results in decreased proliferation, loss of pluripotency markers, and increased expression of early germ layer markers. 44 Thus, in both excitable and nonexcitable cells, hyperpolarization of the transmembrane potential (Vmem) accompanies, and, in some cases, is required for progenitor cell differentiation and lineage restriction. In previous studies, we have shown that the resting Vmem level in hMSCs regulates their capacity to undergo osteogenic and adipogenic differentiation. 45 Vmem hyperpolarization occurs spontaneously during hMSC differentiation toward both lineages and is necessary for differentiation. Artificial induction of Vmem depolarization or hyperpolarization can inhibit or augment, respectively, the differentiation process. Thus, hMSC differentiation toward osteoblasts and adipocytes is functionally regulated by voltage. What is still unknown is whether this relationship holds in the reverse process: the dedifferentiation of osteoblasts and adipocytes derived from hMSCs. If bioelectric signaling, indeed, plays a role in dedifferentiation, it would be a novel and valuable tool for controlling cell plasticity for therapeutic purposes.
The goal of the present study was to determine whether voltage modulation alters the differentiated state of predifferentiated hMSCs and to identify potential mechanisms through which this effect may occur. We therefore depolarized the Vmem of predifferentiated hMSCs and asked (1) whether differentiation markers were down-regulated; (2) whether stemness markers were up-regulated; and (3) how the global transcriptional profile of the cells was differentially regulated in response to voltage modulation. For bone markers, we quantified gene expression of alkaline phosphatase (ALPL) and bone sialoprotein (IBSP); quantified matrix calcification; and stained samples for ALPL expression and calcium deposition. For fat markers, we quantified gene expression of peroxisome proliferator-activated receptor gamma (PPARG) and lipoprotein lipase (LPL); and stained for lipid accumulation with Oil Red O. There is currently no known stemness marker that is specific to hMSCs. However, recent reports have identified some genes that may function in maintenance of adult stem cell multipotency, lineage specific commitment, and initiation of transdifferentiation.19,46–48 We quantified the expression of a panel of these genes to determine whether depolarized cells acquired a more stem-like transcript profile. We also examined a functional marker of stem-like behavior, the capacity for multilineage differentiation, by evaluating the ability of depolarized predifferentiated cells to differentiate along a different lineage (transdifferentiation). Finally, we profiled the global transcriptional activity of the depolarized cells to understand the mechanisms underlying the observed response to Vmem changes. Unlike previous microarray studies of cell response to applied electric fields and electric stimulation,49–52 our study examines cell response to targeted manipulation of endogenous Vmem, providing the first comprehensive analysis of transcriptional activity triggered by directed Vmem changes. Using the metrics described earlier to characterize voltage-induced changes, we report that depolarization induces differentiated cells to down-regulate differentiation markers and enables them to develop a better transdifferentiated phenotype, without up-regulating any stem-associated gene transcripts. Based on the transcript profile of the depolarized cells, we also identify several voltage-responding signaling pathways of interest for further detailed study.
Materials and Methods
hMSC cultivation
Whole bone marrow aspirate from a 25 year-old healthy man was purchased from Lonza through their Research Bone Marrow Donor Program, following approved guidelines of informed consent. Aspirate was plated at a density of 10 μL of aspirate per cm2 in control medium (DMEM with 10% fetal bovine serum (FBS), penicillin (100 U/mL), streptomycin (100 μg/mL), and 0.1 mM nonessential amino acids) supplemented with basic fibroblast growth factor (1 ng/mL) (Invitrogen). Cells were maintained in a humidified incubator at 37°C with 5% CO2. hMSCs were isolated on the basis of their adherence to tissue culture plastic and were used for experiments between passages two and four.
Differentiation
Undifferentiated hMSCs were cultured in control medium. AD differentiation medium consisted of control medium supplemented with 0.5 mM 3-isobutyl-1-methyl-xanthine, 1 μM dexamethasone, 5 μg/mL insulin, and 50 μM indomethacin. OS differentiation medium consisted of αMEM medium supplemented with 10% FBS, penicillin (100 U/mL), streptomycin (100 μg/mL), 10 mM β-glycerophosphate, 0.05 mM L-ascorbic acid-2-phosphate, and 100 nM dexamethasone (Sigma-Aldrich). Transdifferentiation of predifferentiated osteoblasts was achieved by switching cells from OS differentiation medium to AD differentiation medium.
Depolarization of membrane potential
Vmem was depolarized by (1) addition of Na+/K+-ATPase-inhibitor ouabain (OB, 10 nM; Sigma-Aldrich) to differentiation medium or (2) elevation of extracellular K+ by adding potassium gluconate (High K+, HK, 40 or 80 mM; Sigma-Aldrich) to differentiation medium. Depolarization induced by these concentrations of OB and K+ has been confirmed using voltage-sensitive dyes and/or sharp intracellular recordings (45and unpublished data). These depolarizers were added at the time points indicated in the text and replenished in subsequent media changes, for the indicated durations (Figs. 1A and 3A). Briefly, OS cells were predifferentiated for 2 or 3 weeks before the addition of OB or HK for an additional 1 or 3 weeks. AD cells were predifferentiated for 2 weeks before the addition of OB or HK for an additional 1 week. In transdifferentiation studies, OB or HK were added to OS differentiation medium during Weeks 1–6 or Weeks 4–6 (constant or late depolarization, respectively), before cells were switched to AD differentiation medium during Weeks 7–8.

Depolarization of predifferentiated hMSCs causes loss of osteoblast and adipocyte phenotypes.
RNA isolation, purification, and real-time RT-PCR
RNA was isolated using Trizol (Invitrogen) following the single-step acid-phenol guanidinium method, and purified (Qiagen RNEasy kit). Reverse transcription was performed using the High-Capacity cDNA Archive kit (Applied Biosystems). Real-time RT-PCR was performed using a Stratagene Mx3000P QPCR System (Stratagene) to track differentiation markers. Osteoblast differentiation markers include ALPL, collagen I α1 (COL1A1), IBSP, and matrix gla protein (MGP). Adipogenic differentiation markers include PPARG, LPL, and fatty acid binding protein 4 (FABP4). Stemness markers examined include brain-derived neurotrophic factor (BDNF), integrin α11 (ITGA11), (never in mitosis gene a)-related kinase 7 (NEK7), neurotrimin (NTM), tropomyosin 1 α (TPM1), UDP-glucose ceramide glucosyltransferase (UGCG), and vascular cell adhesion molecule-1 (VCAM1). Primers and probes for these genes were obtained from TaqMan® Gene Expression Assay kits (Applied Biosystems). Expression levels were normalized to the housekeeping gene glyceraldehyde 3-phosphate dehydrogenase (GAPDH). We have previously reported PCR reaction conditions and primers.53–55
Calcium assay
Total calcium content was determined using the Calcium (CPC) Liquicolor Test (Stanbio Laboratory). Calcium was dissociated with trichloroacetic acid, reacted with assay solution, and measured spectrophotometrically at 575 nm (VersaMax; Molecular Devices).
ALPL assay
ALPL activity was assessed by detecting the hydrolysis of p-nitrophenyl phosphate to p-nitrophenol. Cultured cells were lysed with 0.2% v/v Triton X-100 in 5 mM MgCl2, and incubated with substrate in 2-amino-2-methyl-1-propanol buffer (Sigma-Aldrich). The hydrolysis reaction was stopped by 0.2 M NaOH and measured spectrophotometrically at 405 nm.
Oil Red O staining
Cells were fixed in 10% formalin for 1 h, washed with 60% isopropanol, and air dried. Oil Red O working solution (60%) was prepared from a stock solution (0.7 g Oil Red O in 200 mL isopropanol) and filtered. Cells were stained for 45 min, washed five times with distilled water, and imaged at room temperature with an inverted microscope (Axiovert S100; Carl Zeiss, Inc.) equipped with Zeiss A-Plan 10×(NA 0.25) and LD A-Plan 32×(0.40) objectives. Images captured by a Sony Exwave HAD CCD camera were acquired using ImageJ software (NIH). Photoshop software (Adobe Systems, Inc.) was used to adjust brightness and contrast levels over the entire image. Oil Red O was eluted with isopropanol for 1 h and measured spectrophotometrically at 500 nm.
ALPL and Alizarin Red staining
Cells were fixed in 1% formaldehyde and stained for ALPL using the Leukocyte ALP assay kit (Sigma-Aldrich). Cells were then stained with Alizarin Red to visualize calcified mineral deposition and imaged as above.
Statistics
Data are reported as means±standard error. One-way ANOVA statistical analysis was performed in experiments with more than two groups, followed by the Tukey–Kramer post-hoc test. In bar graphs, means labeled with the same letter are not significantly different from one another (Tukey–Kramer, p>0.05). Student's t-test analysis was performed in experiments comparing two groups, with results considered significant if p<0.05.
Microarray
RNA was isolated as described earlier with the addition of an on-column DNase treatment performed during RNA purification. RNA quality was evaluated on an Agilent Bioanalyzer. cDNA reverse transcription; cDNA purification; in vitro transcription of cRNA; and microarray hybridization, staining, and scanning were performed by the Yale Center for Genomic Analysis. Illumina Human WG6 v3 Expression BeadChips were used. OB-treated, HK-treated, and untreated OS groups: n=3. UN group: n=2.
Microarray data analysis
Bioconductor software packages were used to perform data analysis. Variance stabilizing transformation and quantile normalization were performed using the lumi package.56,57 Hierarchical clustering was performed with the Ward method, using the Pearson correlation as the distance metric. Principal component analysis (PCA) was performed, and genes of interest were ranked according to loading values. Linear modeling was performed for differential expression analysis using the limma package. 58 Log2-fold gene expression changes were plotted as heatmaps using the packages gplots and RColorBrewer. p-Values were adjusted according to the Benjamini–Hochberg method and considered significant if p-value<0.01. The GOstats package was used to perform hypergeometric testing on Gene Ontology (GO) terms. 59 p-Values were adjusted for multiple testing and considered significant if p<0.01. The online tool REVIGO was used to reduce redundancy of GO terms and display results. 60 Gene set enrichment analysis (GSEA) was used to evaluate whether the canonical pathways gene sets from the Molecular Signatures Database were statistically different between groups.61,62 Results were ranked by Normalized Enrichment Score and were considered significant if false discovery rate <0.05.
Results
HK suppresses mature phenotype of predifferentiated osteoblasts and adipocytes
Previous studies indicate that Vmem depolarization affects the differentiation process of hMSCs. 45 In the present study, we investigated whether Vmem depolarization affects the differentiated state of hMSC-derived cells after they have been predifferentiated to osteoblasts or adipocytes. Depolarized cells were compared with predifferentiated cells switched to control medium (CON) (Fig. 1A), which is the standard method that is currently employed to induce dedifferentiation.19,20,63 In our predifferentiated hMSCs, CON treatment resulted in a decreased osteoblast or adipocyte phenotype (Fig. 1B–L), although cells did not completely revert to the undifferentiated state.
To investigate the effect of depolarization on the osteoblast phenotype, hMSCs were predifferentiated toward the osteoblast lineage for 2 weeks and subsequently treated for 1 week with either 10 nM OB or 80 mM HK, which were added to the osteogenic medium. IBSP expression was reduced in OB- and HK-treated cells (11.3-fold, p<0.001; 6.3-fold, p<0.01, respectively) compared with untreated osteoblasts, and was not statistically different from CON-treated or undifferentiated cells (Fig. 1C). ALPL activity levels in OB- and HK-treated cells were reduced 2.1-fold (p<0.001) and 1.5-fold (p<0.01), respectively, compared with untreated osteoblasts, and was not statistically different from osteoblasts that were de-differentiated by CON medium (Fig. 1B). While OB treatment did not affect total calcium, HK treatment significantly down-regulated calcification compared with untreated osteoblasts (4.7±0.9 μg vs. 25.0±0.9 μg, p<0.001) (Fig. 1D). Calcium levels were reduced more effectively by HK depolarization than by CON medium (p<0.05), and calcium levels of HK-treated cells were similar to undifferentiated cells. hMSCs subjected to longer periods of osteogenic predifferentiation and depolarization (3 weeks of differentiation, 3 weeks of depolarization with 40 mM HK, Fig. 1A) exhibited similar behavior. HK and CON treatments suppressed calcium levels compared with untreated osteoblasts (213.7±29.2 μg and 210.1±16.9 μg, respectively, vs. 365.3±11.7 μg, p<0.001, Fig. 1M). Alizarin Red staining also showed lower mineral deposition in both HK- and CON-treated groups (Fig. 1O, Q, respectively) compared with untreated osteoblasts (Fig. 1P). OB, however, did not significantly reduce calcium levels (342.9±8.3 μg vs. 365.3±11.7 μg, p>0.05, Fig. 1M, N). Depolarization by HK can, therefore, reduce bone markers despite the presence of osteogenic factors and can do so more effectively than withdrawal of these osteogenic factors.
To examine whether adipocytes exhibit the same sensitivity to depolarization, hMSCs were predifferentiated toward adipocytes for 2 weeks and subsequently treated for 1 week with HK in AD differentiation medium. Compared with untreated adipocytes, HK treatment down-regulated expression of PPARG (5.8-fold, p<0.001) and LPL (374.8-fold, p<0.001), which are early and late markers of AD differentiation, respectively (Fig. 1E, F). Oil Red O staining confirmed that HK treatment reduced lipid accumulation (Fig. 1G, H). Depolarization, therefore, suppresses, but does not completely eliminate the mature adipocyte phenotype.
Depolarization does not induce re-expression of genes associated with stem state
Since HK treatment caused predifferentiated osteoblasts and adipocytes to lose expression of mature tissue markers, we then asked whether the depolarized cells had reverted to a more stem-like phenotype. We quantified expression of a panel of genes related to maintenance of stem cell multipotency, lineage commitment, and initiation of transdifferentiation in our depolarized cells.19,46–48 All but one of the genes (protein tyrosine phosphatase receptor F, not shown) behaved as a stem marker (Fig. 2A–N). HK depolarization did not up-regulate expression of the stem-associated genes during either OS or AD differentiation (Fig. 2A–N). HK treatment, therefore, did not cause cells to re-express genes associated with the stem state, despite the loss of osteoblast and adipocyte markers.
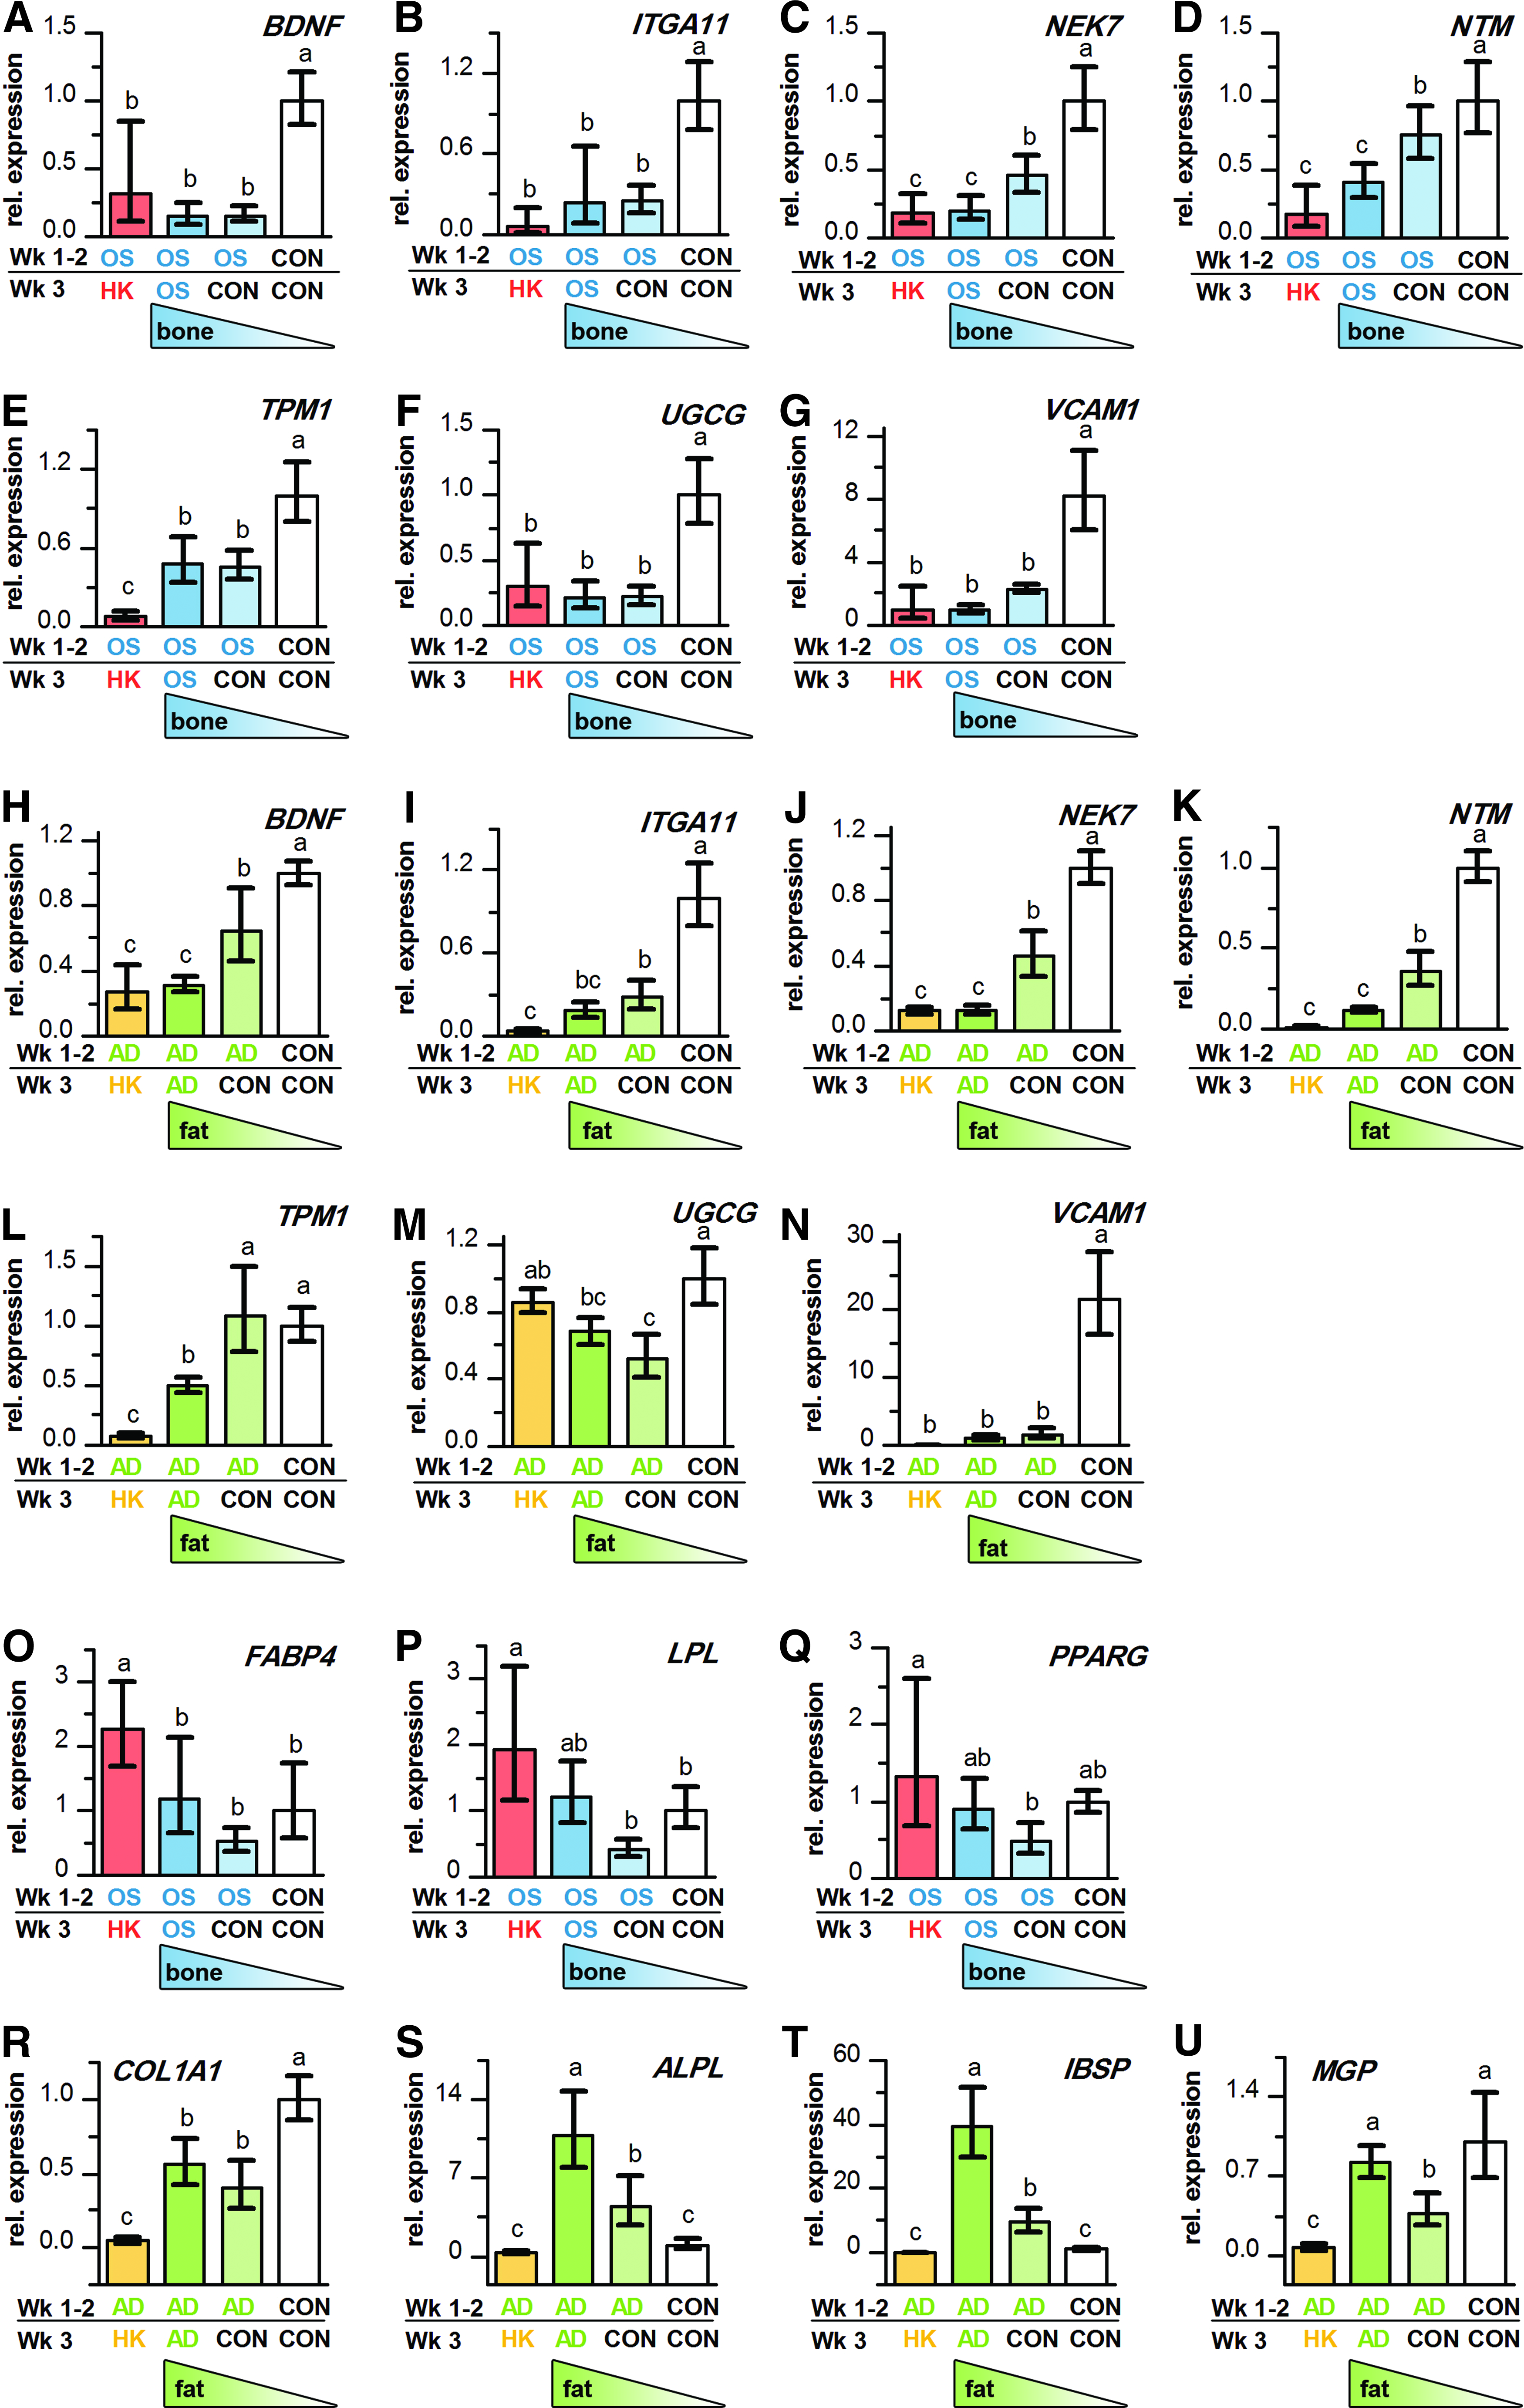
HK-depolarization does not induce re-expression of stem-associated markers, but may prime predifferentiated osteoblasts for transdifferentiation to adipocytes. Gene expression of brain-derived neurotrophic factor (BDNF), integrin α11 (ITGA11), (never in mitosis gene a)-related kinase 7 (NEK7), neurotrimin (NTM), tropomyosin 1 α (TPM1), UDP-glucose ceramide glucosyltransferase (UGCG), and vascular cell adhesion molecule-1 (VCAM1) in predifferentiated osteoblasts
Depolarization may prime osteoblasts, but not adipocytes, for transdifferentiation
Since depolarization did not cause the cells to re-express genes associated with the stem state, we asked whether the treatment might instead prime the cells for differentiation along a different lineage (transdifferentiation). We quantified expression of adipogenic markers in the depolarized osteoblasts, as well as osteogenic markers in the depolarized adipocytes (Fig. 2O–U). In HK-treated osteoblasts, expression of the adipogenic marker FABP4 was 1.9-fold higher than untreated osteoblasts (p<0.05, Fig. 2O); while expression of PPARG and LPL showed higher trends, though not statistically significant (p>0.05, Fig. 2P, Q). In contrast, HK-treated adipocytes demonstrated an overall suppression of the osteogenic direction: 31.6-fold decreased ALPL, 12.5-fold decreased COL1A1, 310.8-fold decreased IBSP, and 11.1-fold decreased MGP expression compared with untreated adipocytes (p<0.001, Fig. 2R–U). Depolarized adipocytes, therefore, down-regulate osteogenic gene expression, while depolarized osteoblasts exhibit adipogenic gene expression trends that are potentially favorable for transdifferentiation.
Depolarized osteoblasts retain the capacity to transdifferentiate to adipocytes
Since depolarized osteoblasts showed potential to transdifferentiate, we asked whether these cells could indeed transdifferentiate when stimulated with adipogenic medium. We differentiated hMSCs toward osteoblasts for 6 weeks before transdifferentiating them toward adipocytes for 2 weeks (Fig. 3A). Before transdifferentiation, cells were subjected to constant depolarization (40 mM HK, Weeks 1–6), late depolarization (40 mM HK, Weeks 4–6), or CON treatment (Weeks 4–6).

Osteoblasts treated with constant or late HK depolarization are capable of adipogenic transdifferentiation, and thus retain lineage plasticity in the adipogenic direction.
Under normal conditions, hMSC-derived osteoblasts maintained the ability to differentiate along the adipogenic lineage despite having already progressed down the osteoblastic lineage. Transdifferentiated cells decreased calcification between Weeks 6 and 8 (37.6±1.4 μg vs. 53.6±0.3 μg, p<0.01, Fig. 3B), expressed several adipogenic transcripts (PPARG, LPL, FABP4, Fig. 3D–F), and accumulated a similar amount of lipid as untreated adipogenic cells (Fig. 3C). Many adipocytes had an elongated, spindle-like morphology that was more reminiscent of undifferentiated hMSCs than adipocytes (Fig. 3I). After CON pretreatment, transdifferentiated cells also expressed PPARG, LPL, and FABP4 (Fig. 3D–F); adopted a typical rounded morphology (Fig. 3H); and accumulated more lipid than the transdifferentiated group and the untreated adipogenic group (p<0.001, Fig. 3C).
Depolarized cells did not exhibit a statistically significant decrease in total calcium content on transdifferentiation between Week 6 and Week 8 (Fig. 3B), which may be because HK had already significantly lowered the amount of total calcium at Week 6. PPARG, LPL, and FABP4 gene expression in HK-treated cells was similar to that of directly transdifferentiated cells (Fig. 3D–F). Oil Red O staining of lipid droplets showed similar lipid accumulation in late-depolarized cells and directly transdifferentiated cells (Fig. 3C). In contrast to the spindle-like morphology obtained with directly transdifferentiated cells, adipocytes produced from both depolarized populations adopted a rounded morphology (Fig. 3J–K) that was more typical of normal hMSC-derived adipocytes (Fig. 3G). Altogether, these results show that depolarized hMSC-derived cells retain their lineage plasticity and achieve better morphological outcomes after transdifferentiation than nondepolarized cells.
Microarray analysis of hMSCs depolarized after predifferentiation
To better understand the mechanisms mediating voltage signaling, we performed microarray analysis on osteoblasts depolarized after predifferentiation. Osteoblasts were predifferentiated for 3 weeks and subsequently treated with 10 nM OB or 40 mM HK in differentiation medium for an additional 3 weeks. For comparison, other samples were maintained in osteogenic medium (OS) or kept undifferentiated (UN) for the entire 6 weeks. Hierarchical clustering of the data (Fig. 4A) revealed that depolarized groups (OB and HK) were the most similar, despite their different effects on the differentiated state of the hMSC-derived osteoblasts. Furthermore, both the depolarized groups were more similar to the OS group than to the UN group.

Genome-wide expression analysis results summarized by clustering, principal component analysis (PCA), and hypergeometric testing of Gene Ontology (GO) terms.
For further data analysis, we chose to focus on the differences between the OB, HK, and OS groups. From PCA, the first two principal components (PC) best represented the inter-group variance while minimizing intra-group variance among replicates (Fig. 4B). Projection onto PC 1 exhibits a clustering pattern that is similar to hierarchical clustering. Projection onto PC 2 separates the HK group from the others. Genes with the highest loading values in PC1 and 2 were largely related to mitochondria, metabolism, cell structure, adhesion, migration, and remodeling (Table 1).
Genes related to metabolism and mitochondria.
Genes related to cell structure, adhesion, migration, and remodeling.
Using a linear modeling approach, we quantified log-fold differences in gene expression between the OS group and the depolarized groups. Table 2 shows the top differentially expressed genes, ranked according to their moderated F-statistic, and Figure 5A shows a clustered heatmap of these genes. We performed hypergeometric testing on the GO terms associated with the genes to understand the biological processes that they represent, and used the tool ReVIGO to visualize the results (Fig. 4C). 60 Similar to the PCA results, a number of genes related to metabolism and cell migration, adhesion, and remodeling are highly differentially expressed. In addition, the data implicate the participation of major signaling pathways, including Rho (ARHGDIB), G-protein (RGS), TNF (C1QTNF), Wnt (SFRP2, SFRP4), platelet-derived growth factor (PDGFRL), and interleukin (IL8) signaling pathways.

Heatmaps of differentially expressed genes in OB- and HK-treated groups compared with the untreated OS group.
Linear modeling was used to analyze differential expression. Log-fold changes are presented relative to untreated OS samples. Up-regulation is denoted by positive values, while down-regulation is denoted by negative values. Genes are ranked according to F-statistic. p-Values were adjusted as described in Materials and Methods section.
Genes related to cell structure, adhesion, migration, and remodeling.
Genes related to metabolism and mitochondria.
OS, untreated osteogenic; OB, ouabain-treated (10 nM); HK, high-K+-treated (40 mM K+).
We sought to identify genes that could be responsible for the opposite effects of OB and HK on osteoblast differentiated state by filtering for genes responding in opposite directions to OB versus HK treatment (Table 3 and Fig. 5B). Hypergeometric testing revealed several overrepresented GO terms, including translational elongation; translation; muscle organ development; cardiac muscle tissue development; and antigen processing and presentation of peptide antigen via MHC class I.
Linear modeling was used to analyze differential expression, and results were filtered for opposing responses in OB samples compared with HK samples. Log-fold changes are presented relative to untreated OS samples. Up-regulation is denoted by positive values, while down-regulation is denoted by negative values. Genes are ranked according to F-statistic. p-Values were adjusted as described in Materials and Methods section.
Genes related to cell structure, adhesion, migration, and remodeling.
Genes related to muscle cells and muscle functions.
OB, ouabain-treated (10 nM); HK, high-K+-treated (40 mM K+).
To identify pathways, rather than individual genes, enriched by depolarization, we performed GSEA on OB and HK groups versus OS group (Table 4). Of the top HK-enriched pathways, most are involved in cell cycle regulation; protein degradation and proteasome function; mRNA processing; and metabolism. Many of the pathways enriched in the HK group are also enriched in the OB group. The OB group also is enriched for insulin-related pathways. The Wnt pathway, identified by differential-expression analysis as a potential pathway of interest, is enriched in both groups. Comparing the HK and OB groups with one another yielded enriched pathways that are associated with muscle function; semaphorin and Rho signaling; and extracellular matrix and integrin interactions (Table 5). We also identified the leading edge genes that are most responsible for the enrichment results. Most leading edge genes in the OB versus OS and HK versus OS comparisons are related to proteasome, splicing, and ribosome functions (Table 6). The leading edge genes in the OB versus HK comparison are largely related to cell structure and adhesion (Table 7).
Pathway enrichment was analyzed using the curated canonical pathways (CP) gene sets from Molecular Signatures Database. The source of each pathway is indicated. Size indicates the number of genes comprising the pathway. Pathways are ranked according to Normalized Enrichment Score (NES) within each category.
HK, high-K+-treated (40 mM K+); GSEA, gene set enrichment analysis; KEGG, kyoto encyclopedia of genes and genomes.
Pathway enrichment was analyzed using the curated canonical pathways (CP) gene sets from Molecular Signatures Database. The source of each pathway is indicated. Size indicates the number of genes comprising the pathway. Pathways are ranked according to Normalized Enrichment Score (NES) within each category.
OB, ouabain-treated (10 nM); HK, high-K+-treated (40 mM K+).
Leading edge genes from top HK- and OB-enriched pathways (Table 4) are ranked according to their frequency of appearance in the enriched pathways. Leading edge genes are those that contribute most to a pathway's enrichment score.
OB, ouabain-treated (10 nM); HK, high-K+-treated (40 mM K+).
Leading edge genes from top enriched pathways in HK versus OB (Table 5) are ranked according to their frequency of appearance in the enriched pathways. Leading edge genes are those that contribute most to a pathway's enrichment score.
OB, ouabain-treated (10 nM); HK, high-K+-treated (40 mM K+).
Discussion
Bioelectric signaling regulates differentiation in a number of excitable and nonexcitable stem and progenitor cells, but its effects on the differentiated state of mature, nonexcitable somatic cells has not yet been well characterized. The goal of this study was to determine how predifferentiated hMSCs respond to modulation of their Vmem, in particular (1) whether their differentiated state changes on stimulation; (2) whether their lineage plasticity is affected by stimulation; and (3) which signaling pathways mediate their Vmem response.
In this study, depolarization of hMSC-derived osteoblasts and adipocytes by treatment with HK reduced expression of markers of the mature phenotype. Osteoblasts and adipocytes derived from hMSCs have been previously shown to dedifferentiate on withdrawal of osteogenic or adipogenic stimulants from their media. 19 In our studies, depolarization induced reversal of the mature phenotype even in the presence of differentiation stimulants in the media, suggesting that Vmem signals may override the biochemical signals that promote differentiation. This depolarization-induced phenotype suppression was confirmed in follow-up studies using hMSCs from two additional bone marrow donors (data not shown). Although hMSCs from all three bone marrow sources demonstrated donor-dependent variability in baseline differentiation levels, as has been previously reported for bone marrow-derived hMSCs,64,65 all donors exhibited the same response to voltage modulation: decreased osteogenic and adipogenic markers compared with untreated cells from their respective donors. This consistency of response confirms that hMSC response to voltage modulation is a reproducible phenomenon among donors. Vmem, therefore, plays a functional role in the maintenance of differentiated state, and it may be a novel control point for fine tuning the status of mature cells.
Although markers of the osteoblast and adipocyte phenotypes were reduced on depolarization, they were not lost completely. For example, ALPL activity and calcification in predifferentiated osteoblasts was reduced on depolarization compared with untreated osteoblasts, but was still greater than that of undifferentiated hMSCs. Gene expression in depolarized, predifferentiated adipocytes was significantly reduced, but cells still accumulated small lipid droplets. These data indicate that depolarized cells did not completely revert to the undifferentiated state. It is possible that cells in this partially differentiated state resemble hMSCs which are at more immature stages along the path of differentiation toward bone and fat. This would need to be clarified with further studies comparing depolarized cells with hMSCs differentiated for different periods of time.
We also sought to determine whether depolarized cells re-expressed any markers of the stem phenotype of hMSCs. Currently, hMSCs are identified by their expression of a panel of cell surface markers. However, it is generally unclear whether these markers are specific to the undifferentiated, stem state. One group reports that high VCAM1 expression is characteristic of the undifferentiated, but not differentiated, hMSC state. 48 Others have exploited microarray technology to identify genes associated with maintenance of adult stem cell multipotency, lineage-specific commitment, and initiation of transdifferentiation.19,46,47 Many of these genes also behaved as stemness markers in our system. When predifferentiated hMSCs were depolarized, they did not significantly up-regulate expression of any of these putative stem-associated genes, despite reduction of the mature phenotype.
Depolarized osteoblasts were, however, capable of adipogenic transdifferentiation, indicating that lineage plasticity in the OS-to-AD direction is preserved during Vmem modulation. Moreover, depolarized cells had a rounded morphology that was more similar to normal hMSC-derived adipocytes, as opposed to the elongated morphology of the directly transdifferentiated cells. Interestingly, osteogenic cells treated with control medium exhibited better adipogenic potential than undifferentiated cells. Osteogenesis and adipogenesis are usually reported to be mutually inhibitory.66–73 However, we hypothesize that exposing cells to a period of osteogenic predifferentiation may activate signaling pathways or may initiate secretion of cytokines that have both pro-osteogenic and pro-adipogenic effects. For example, bone morphogenetic proteins,74–79 fibroblast growth factors,80–83 and insulin-like growth factor-184–86 can positively regulate both bone and fat lineages. In addition, Smad and p38-MAPK signaling events promote both osteogenesis and adipogenesis.87–89 Cytokine secretion or pathway activation may play a pro-osteogenic role during predifferentiation, but may switch to a pro-adipogenic role upon subsequent transdifferentiation. Related evidence suggests that osteogenic and adipogenic differentiation may not be exclusively reciprocal, but instead may occur in parallel until late stages of differentiation. 90 Committed osteoblasts express adipogenic markers to a greater extent than uncommitted cells, and osteogenic differentiation is accompanied by up-regulation of adipogenic markers in addition to osteogenic markers. 90 Our cells may similarly up-regulate both osteogenic and adipogenic markers during the predifferentiation stage, thus setting the stage for improved transdifferentiation when given appropriate adipogenic stimuli. Inserting an intermediate phase of dedifferentiation, whether by control medium or by depolarization, could serve to down-regulate expression of mature tissue markers before transdifferentiation. These data suggest that transdifferentiation may be improved by pre-exposure to treatments that reduce the mature osteoblastic phenotype. In situations in which it may not be feasible to remove biochemical inducers from the local cell environment (e.g., in vivo), an alternative strategy for transdifferentiation may be to prime cells by Vmem depolarization.
Collectively, these data raise an interesting question with regard to the exact state of depolarized differentiated hMSCs. Depolarization causes the cells to reduce their expression of mature tissue markers and to improve their transdifferentiation capacity, which might suggest a degree of reprogramming, as they lose their differentiated phenotype and gain stem cell-like behavior. However, the depolarized cells possess an overall genetic signature that is more similar to differentiated than undifferentiated cells and do not up-regulate stem-associated markers. Since the depolarized phenotype does not completely recapture the stem cell phenotype, depolarization does not appear to trigger a full reprogramming event. Instead, we hypothesize that the depolarized cells have been rolled back to an intermediate point along the differentiation path, where they are committed to differentiate, as evidenced by the expression of some differentiated tissue markers, but they also possess more inter-lineage plasticity, allowing them to switch lineages more easily than nontreated cells. In this intermediate state, the cells increase their multi-lineage differentiation capacity, which is a property of their parent MSCs that persists late into the differentiation process, 90 but do not reacquire the stem-associated transcript profile, which may be a stem feature that is lost early in the differentiation process.
We profiled the transcriptional state of predifferentiated osteoblasts treated with OB and HK to identify potential mechanisms that mediate voltage signaling. Several cell cycle-related pathways were identified by GSEA analysis, which is consistent with previous reports that Vmem can regulate proliferation and cell cycle progression in various cell types.23,24 Metabolism-related pathways were also identified by PCA, differential expression analysis, and GSEA. One potential mediator of metabolic-electric coupling is the ATP-sensitive K+ channel (KATP)91–93 : KATP channel expression levels change on hMSC differentiation, and pharmacologic targeting of the channel can augment differentiation.45,94 The cytoskeleton has also been identified by microarray analysis as a possible mediator of the depolarization response. This is supported by previous work demonstrating that Vmem depolarization and hyperpolarization affect actin and tubulin cytoskeleton organization95–97 and that ion transport proteins and cytoskeletal proteins can interact directly to regulate each other's functions.98–100 GSEA also implicated mRNA processing and protein degradation, both of which have been shown to be regulated by depolarization in neurons.101–103
Finally, a number of intracellular signaling pathways were also identified by differential gene expression analysis, including Rho, G-protein-coupled receptor (GPCR), inflammatory, and Wnt signaling. The Rho pathway has been shown to link transmembrane activity to cell adhesion and migration in neurons. 104 GPCRs can be activated by Vmem depolarization in muscle, and their voltage sensitivity may be due to voltage-dependent charge movements.105,106 Inflammatory cytokines can be modulated by and can also induce depolarization.107–109 The Wnt pathway, a critical regulator of many osteoblast functions, including bone differentiation, maturation, homeostasis, and repair, has been shown to be required for establishing an electrical gradient across the developing heart.110–112
The present study has shown that voltage modulation in osteoblasts and adipocytes can induce changes in cell phenotype, which is reminiscent of dedifferentiation events seen in wound healing in vivo. Depolarized cells do not completely revert back to the stem state, but in the case of osteoblasts, they retain their multipotentiality. Several mechanisms have been identified by microarray analysis, but further studies are necessary to determine whether these pathways, indeed, functionally participate in transducing voltage signals into cellular behaviors. Also of interest is whether the depolarization response recruits similar pathways as in vivo dedifferentiation events during regeneration. 15 Data mining using publicly available microarray data from wound healing and regeneration experiments may facilitate such a comparative analysis.
Future studies may employ in vitro and in vivo wound healing models to explore how bioelectric events may direct regeneration-related cell functions in the context of the wound environment. It will be interesting to test whether bioelectric signaling can trigger events that recapitulate other aspects of in vivo regeneration, such as formation of a blastema at the injury site, or establishment of correct tissue patterning. A better understanding of how bioelectric signaling affects the healing process would be a step forward in developing alternative tissue regeneration strategies that complement current adult stem cell transplantation approaches.
Footnotes
Acknowledgments
The authors thank the Tufts Center for Neuroscience Research (P30 NS047243) and the Yale Center for Genome Analysis for assistance with microarray experiments. S.S. thanks the NSF for funding through the Graduate Research Fellowship Program. The authors also thank the NIH for support through the Tissue Engineering Resource Center (P41 EB002520), R01 AR005593, and R01 AR061988.
Disclosure Statement
No competing financial interests exist.