
Abstract
Neovascularization plays an important role in adipose tissue transplantation, because survival of implanted cells strongly relies on sufficient oxygen and nutrient supply. Vascular endothelial growth factor (VEGF) is known as the master regulator of angiogenesis. It is capable of starting the complex cascade of events leading to endothelial cell activation, assembly of new vascular structures, mural cell recruitment, and vessel stabilization. However, consensus is lacking regarding safe and efficient methods for applying VEGF in free fat transplantation in the clinical setting. We investigated whether chitosan nanospheres, a biocompatible high-molecular-weight material, safely improve the efficiency of VEGF application in free fat transplantation. Immunologically compromised nude mice were used as adipose tissue transplantation receptors. Nanospheres loaded with VEGF were mixed with adipocytes and injected subcutaneously to the dorsa of mice. Grafts were harvested at weeks 3, 6, and 12. We found that treated-graft weight and vascularization were significantly higher than controls in a time-dependent manner. We demonstrated that chitosan nanospheres loaded with VEGF significantly promote the fat graft neovascularization and improve adipocyte survival.
Introduction
E
Vascular endothelial growth factor (VEGF) has long been known as the master regulator of angiogenesis.5,6 It is capable of starting the complex cascade of events leading to endothelial cell activation, assembly of new vascular structures, mural cell recruitment, and vessel stabilization. 6 However, incorporation of angiogenic growth factors is difficult due to their short half-life of only several minutes in circulation. 7 Free VEGF can barely exert its biological function when applied directly, as it tends to diffuse, become diluted, and degrade, resulting in very low bioavailability.
We applied chitosan nanospheres as drug carriers to achieve a controlled release of VEGF. Chitosan is a D-glucosamine polysaccharide polymerized by β-1,4 linkages and is easily obtained by deacetylation of chitin. Its derivatives are biodegradable, biocompatible, less toxic than chitin, 8 and have long been used in drug delivery systems.8–11 In our setup, we constructed chitosan nanospheres encapsuled with VEGF using the modified Berthold's method. 12
We investigated in vitro and in vivo release kinetics of human VEGF from chitosan nanospheres and evaluated the cytotoxicity of the controlled release system. In our animal experiment, adipocytes were mixed with the nanospheres and transplanted subcutaneously into the dorsa of immunologically compromised nude mice. The in vivo angiogenic response to the controlled release system was measured by evaluating the density of the newly formed blood vessels, using the CD34 immunohistochemical technique.
Materials and Methods
Preparation of chitosan nanospheres
Chitosan nanospheres were made using the modified Berthold's method. Two hundred milligrams of chitosan (deacetylation ≥90.0%, viscosity <100 mPa·s; Sigma-Aldrich) was dissolved in 80 mL of aqueous solution of glacial acetic acid (2% v/v) containing 1 mL of Tween-80, stirred for 2 h, and sonicated until the solution became colorless. Twenty milliliters of sodium polyphosphate (2.5 mg/mL) was added dropwise (5 mL min−1) during stirring. After the addition of sodium polyphosphate, stirring was extended for another 2 h. The formed nanospheres were collected by centrifugation and washed using purified water three times before lyophilization.
Size determination and morphological characteristics
Lyophilized chitosan nanospheres were suspended in normal saline (containing 0.2% of Tween-80). Then, the size, shape, and distribution of the nanospheres were observed by an atomic force microscope (Dimension 3000; Digital instruments Co.).
For scanning electron microscopy (SEM) analysis, the nanospheres were spread on double-faced adhesive tapes and ion sputter coated with gold. Nanospheres were then examined by SEM (S-3700; Hitachi) for their size, shape, and surface characteristics.
Preparation of chitosan nanospheres loaded with VEGF
Twenty milligrams of lyophilized chitosan nanospheres was dissolved in a 0.9 mL aqueous solution of glacial acetic acid (2% v/v). About 0.1 mL of human VEGF 121 (Peprotech) containing 0.4 μg of VEGF was added to the solution. The mixture was sonicated until it became colorless.
Drug loading rate and entrapment efficiency
The solution of chitosan nanospheres loaded with VEGF was shaken for 6 h at 4°C and centrifuged for 15 min at 10, 000 rpm. The supernatant was preserved and the pellet was resuspended in pure water. This wash procedure was repeated three times; the supernatant at each repeat was preserved. The amount of VEGF in the supernatant (free VEGF) was measured by ELISA, according to the manufacturer's instructions. The drug loading rate (DL) and entrapment efficiency (EE) were calculated as follows:
In vitro release studies
Twenty micrograms of VEGF-loaded chitosan nanospheres was dissolved in 1 mL of phosphate-buffered saline (PBS) under 37°C. Centrifugation (15,000 rpm) was applied at 1 h, 5 h, 10 h, 1 day, 2 days, 3 days, 5 days, and 7 days. After each centrifugation, 15 μL of supernatant was removed and replaced with 15 μL of PBS. The VEGF concentration in the supernatant was measured by enzyme-linked immunosorbent assay (ELISA) and the drug release rate was evaluated.
Cytotoxicity of chitosan nanospheres on 3T3-L1 cells: Cell Counting Kit-8 assay
The 3T3-L1 cells are preadipocytes purchased from the cell bank of the Chinese Academy of Science. About 5×10³ cells were dispensed in each well. Cells were treated with different concentrations of chitosan nanospheres (25, 50, and 100 mg/mL) and incubated in the presence of 5% CO2 with 95% humidity at 37°C. Cytoactivity was measured at 3, 5, and 7 days with a Cell Counting Kit-8 (Dojindo).
Adipose tissue transplantation
A liposuction needle (2.5 mm caliber) was connected to a 20-mL syringe. Adipose tissue was suctioned subcutaneously from the abdomen of a healthy young female patient. Collagenase I (Invitrogen) was dissolved with the Dulbecco's modified Eagle's medium (DMEM; Gibco), in a 37°C thermostatic water bath and filled into 16 centrifuge tubes, each containing 4 mL of collagenase (1.0 g/L). Two milliliters of adipose tissue (32 mL in total) was placed into each centrifuge tube. The tubes were sealed and the adipose tissue was digested for 1 h. After removing the seals, each tube was filled with 6 mL of DMEM with 10% fetal bovine serum to terminate the digestion. The mixture was centrifuged at 1200 rpm for 10 min. The mixture appeared as four layers from top to bottom: lipid, adipocytes, supernatant, and pellet (Fig. 1). The lipid, supernatant, and the pellet were removed; adipocytes were carefully preserved for the subsequent procedure.
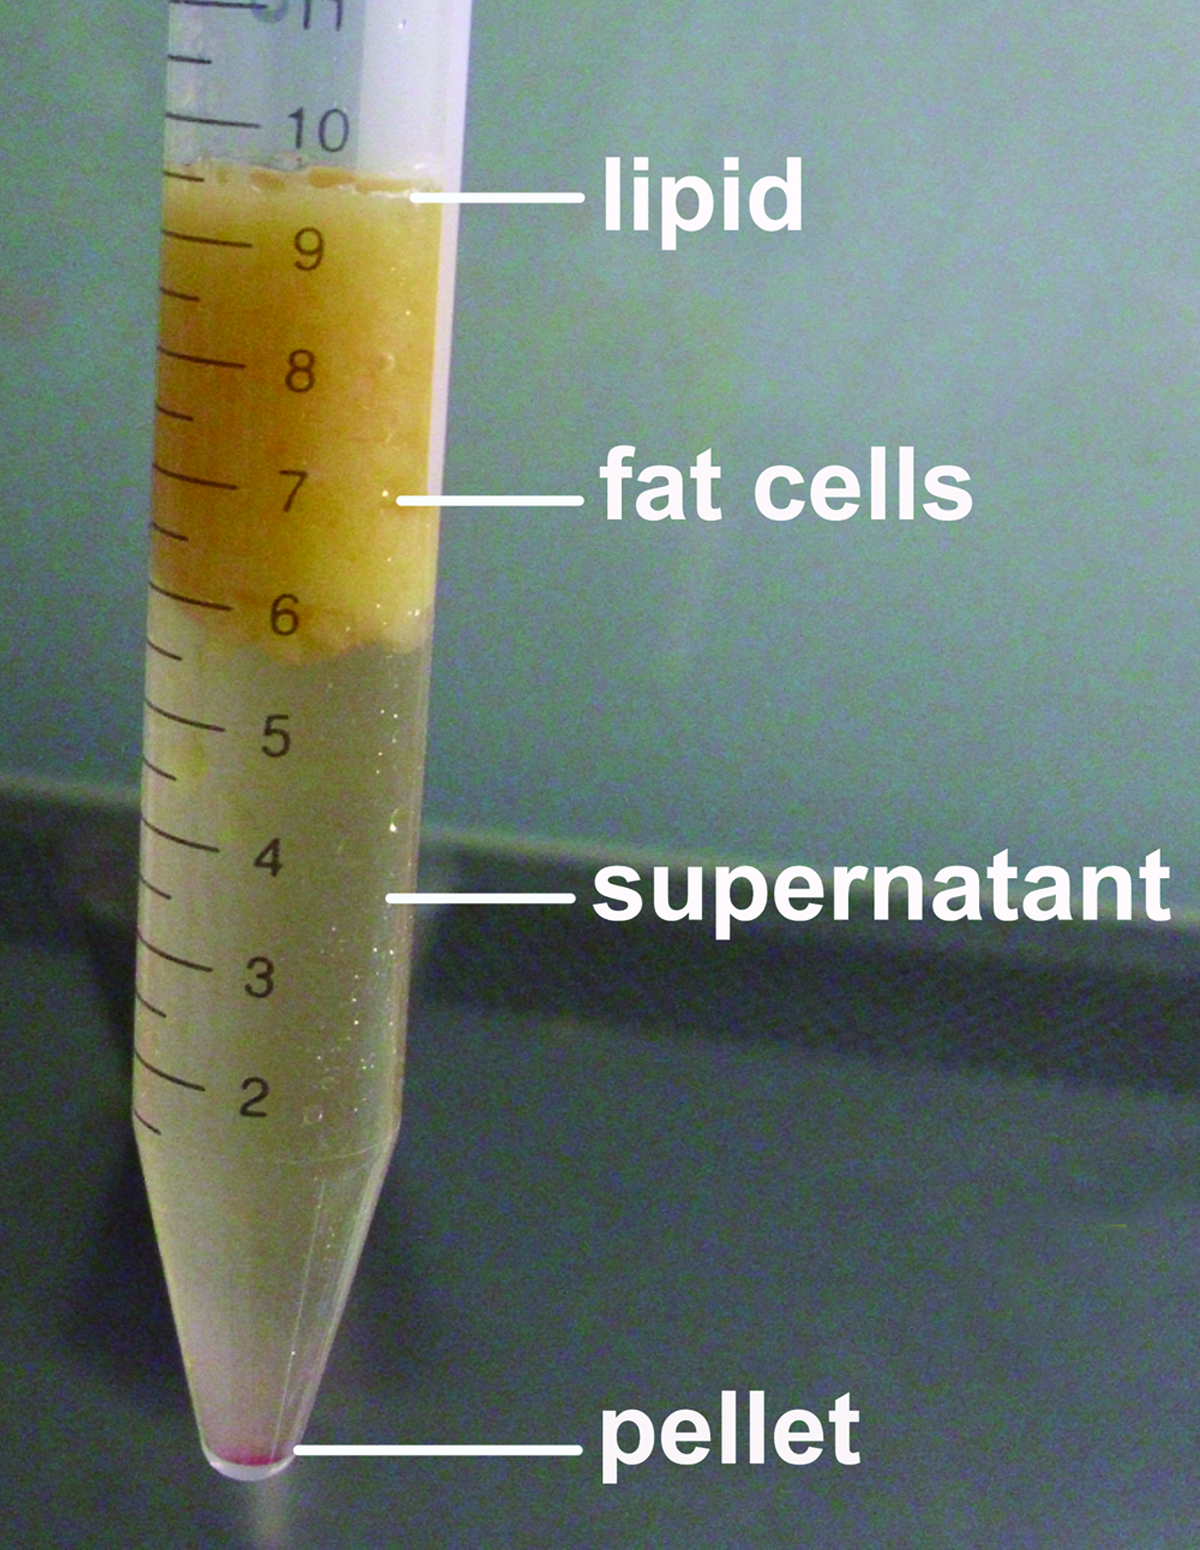
Preparation of adipocytes. The digested adipose tissue appeared as four layers after centrifugation, from top to bottom: lipid, fat cells, supernatant, and pellet. The lipid, supernatant, and the pellet were removed; adipocytes were carefully preserved for the subsequent procedure. Color images available online at www.liebertpub.com/tea
About 4.5 mL of adipocytes was mixed with 1.5 mL of the following materials, respectively, before transplantation: chitosan nanospheres loaded with VEGF (50 mg of chitosan nanospheres containing 1 μg of VEGF per milliliter), empty chitosan nanospheres (50 mg of chitosan nanospheres per milliliter), VEGF (1 μg of VEGF per milliliter), and DMEM.
BALB/c nude mice were provided by the experimental animal center of Zhejiang University. Six- to 8-week old BALB/c nude mice (n=28) weighing 20–25 g each were selected regardless of gender. The mice were divided equally into four cages at random.
Adipose grafts described above were implanted subcutaneously into the mice dorsa at four points with a sharp 12-gauge needle attached to a 1-mL syringe. Each point was injected with 0.2 mL of graft; the adipocyte amount was 3×10⁵ per site. The grafts of different composition were assigned with the following groups: experimental group (adipocytes and chitosan nanospheres loaded with VEGF), nanospheres control group (adipocytes and empty chitosan nanospheres), VEGF control group (adipocytes and free VEGF), and blank control group (adipocytes only). The injection points were well isolated to avoid merging (Fig. 2). Each mouse carried four different grafts, with locations randomized to eliminate potential skewing of results. Mice in the same cage received the same pattern of injection.
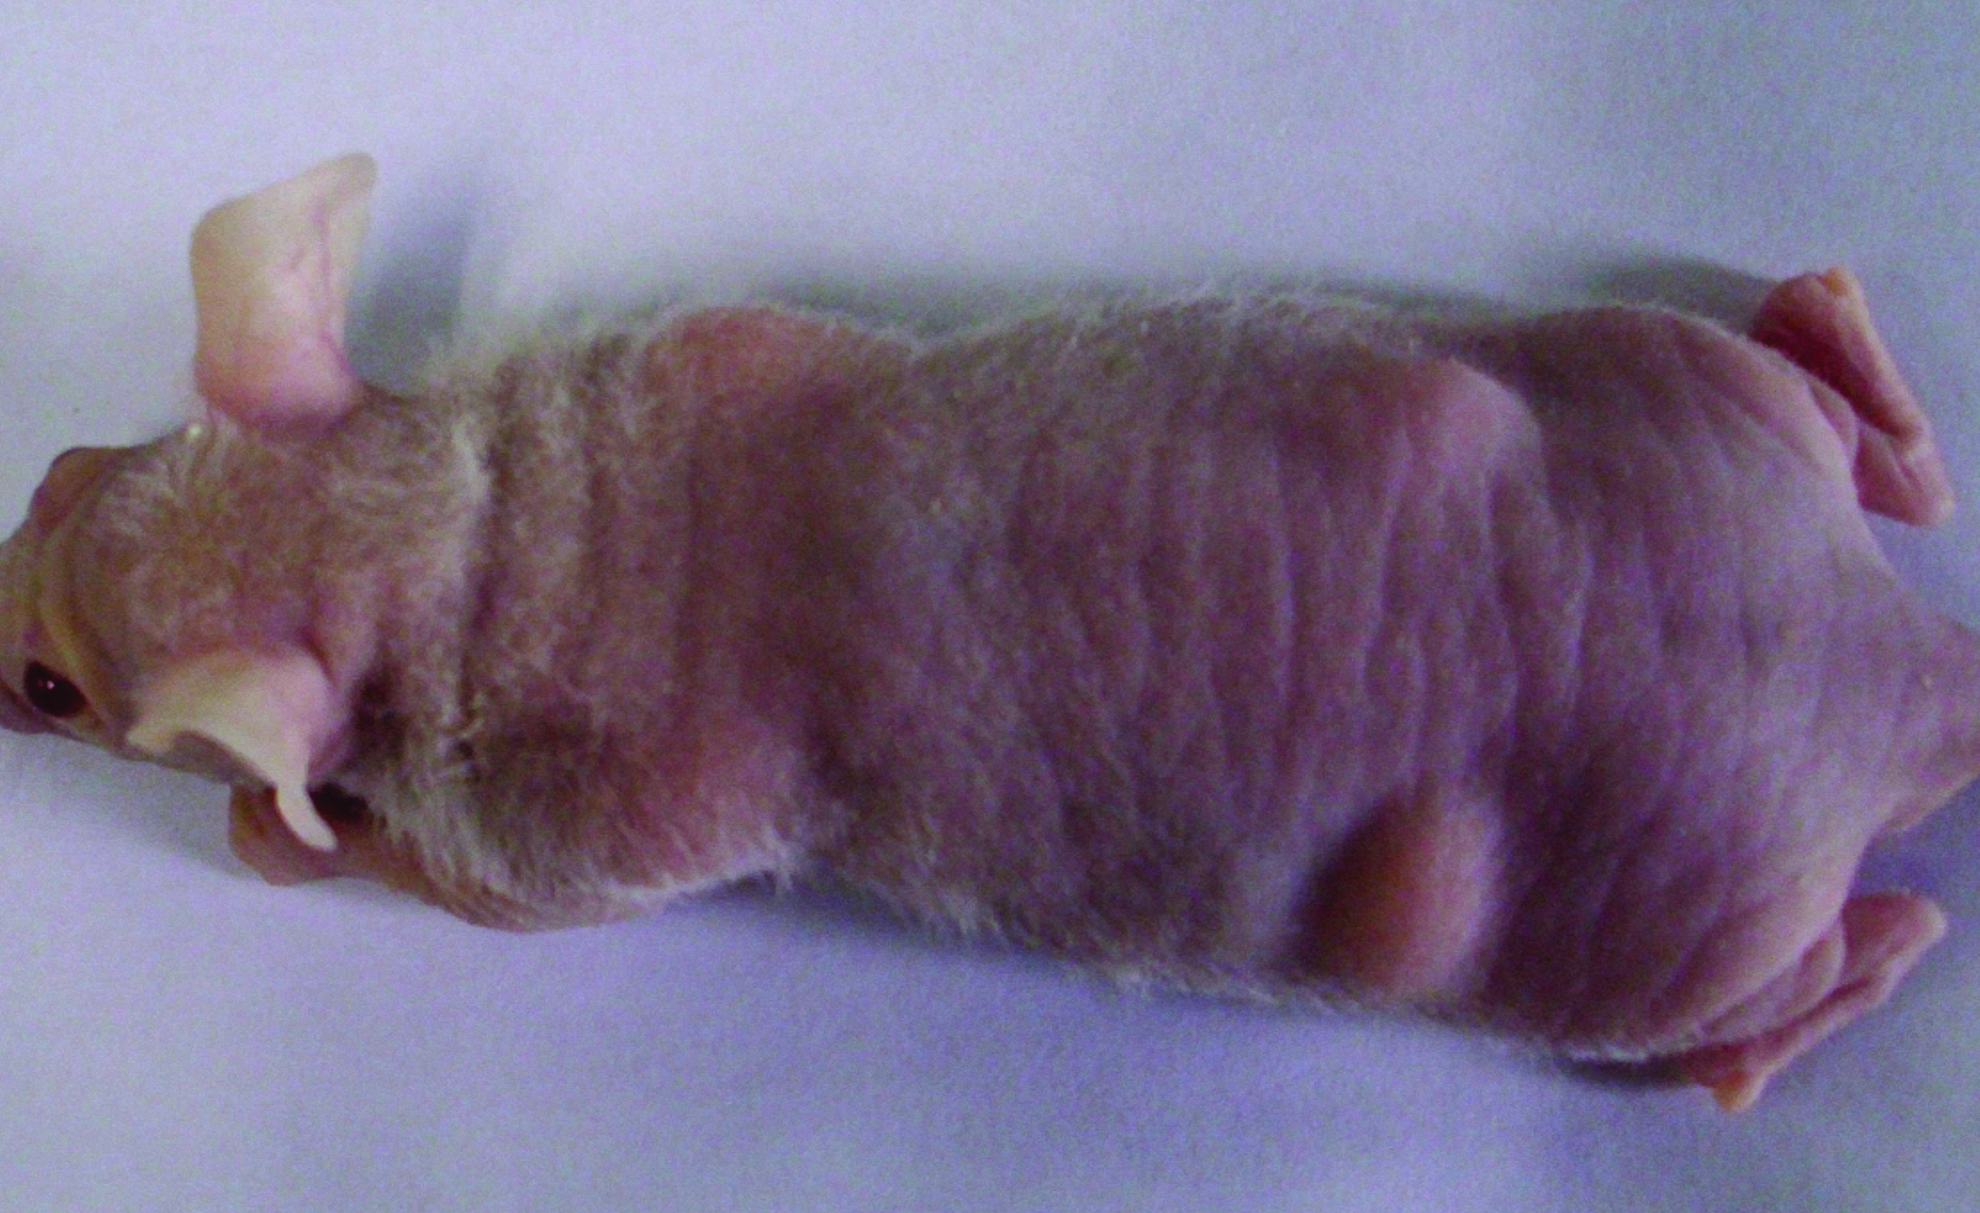
Adipose grafts were implanted subcutaneously into the mice dorsa at four points. Each point was injected with 0.2 mL of graft. The grafts of different compositions were assigned with the following groups: experimental group (adipocytes and chitosan nanospheres loaded with vascular endothelial growth factor [VEGF]), nanospheres control group (adipocytes and empty chitosan nanospheres), VEGF control group (adipocytes and free VEGF), and blank control group (adipocytes only). The injection points were well isolated to avoid merging. Each mouse carried four different grafts, with locations randomized to eliminate potential skewing of results. Color images available online at www.liebertpub.com/tea
ELISA of VEGF in vivo
Four mice (one from each cage) were sacrificed at day 7 after transplantation. A human VEGF ELISA kit (R&D Systems) was used to measure the VEGF amount of the grafts.
Sample collection and histopathological measurements
Two mice in each cage were sacrificed at week 3, 6, and 12 after the transplantation. The fat grafts were carefully isolated and weighed. Sections of grafts were stained with hematoxylin and eosin and observed under a light microscope (Eclipse 80i; Nikon). Observation of adipocytes and the degree of inflammation and fibrosis were recorded. Grafts harvested at week 3 were observed by SEM and transmission electron microscopy.
Microvascular density determination
Samples were paraffin embedded and cut into 4-μm-thick sections. Immunohistochemical staining of CD34 was performed. Neovessels among the adipocytes were observed under a microscope (Eclipse 80i; Nikon) at low magnification (100×). The area of the highest vascular density was located. Then, three fields of fixed magnification (400×) were chosen randomly and images were saved. The relative area of stained neovessels in each image was calculated by Image-Pro Plus 6.0 software (Media Cybernetics) as previously described. 13
Statistical analysis
Data are presented in terms of mean±standard deviation. All data were analyzed with the SPSS 13.0 software. A value of p<0.05 was considered statistically significant. Comparisons of means of several groups were performed with the one-way ANOVA. Comparisons of survival between every two groups at different time were performed with the LSD method. A value of p<0.05 was considered significant.
Results
Grain size distribution and morphological characteristics of chitosan nanospheres
The atomic force microscope and scanning electron microscope observation showed a comparatively homogeneous distribution of nanospheres. The shape of the particles was close to spherical, with diameters ranging from 200 to 300 nm. The surface of the particles was smooth (Fig. 3).

Morphological evaluation of chitosan nanospheres. Atomic force microscopy
Drug loading, EE, and drug release characteristics in vitro
The DL was measured to be 15 μg/g; EE was 74.99% (Table 1). In vitro drug release was comparatively fast in the early stages, especially in the first 24 h (Fig. 4), at 29%; a steady state was reached thereafter. The total amount of released drug was 51% in the first 7 days.
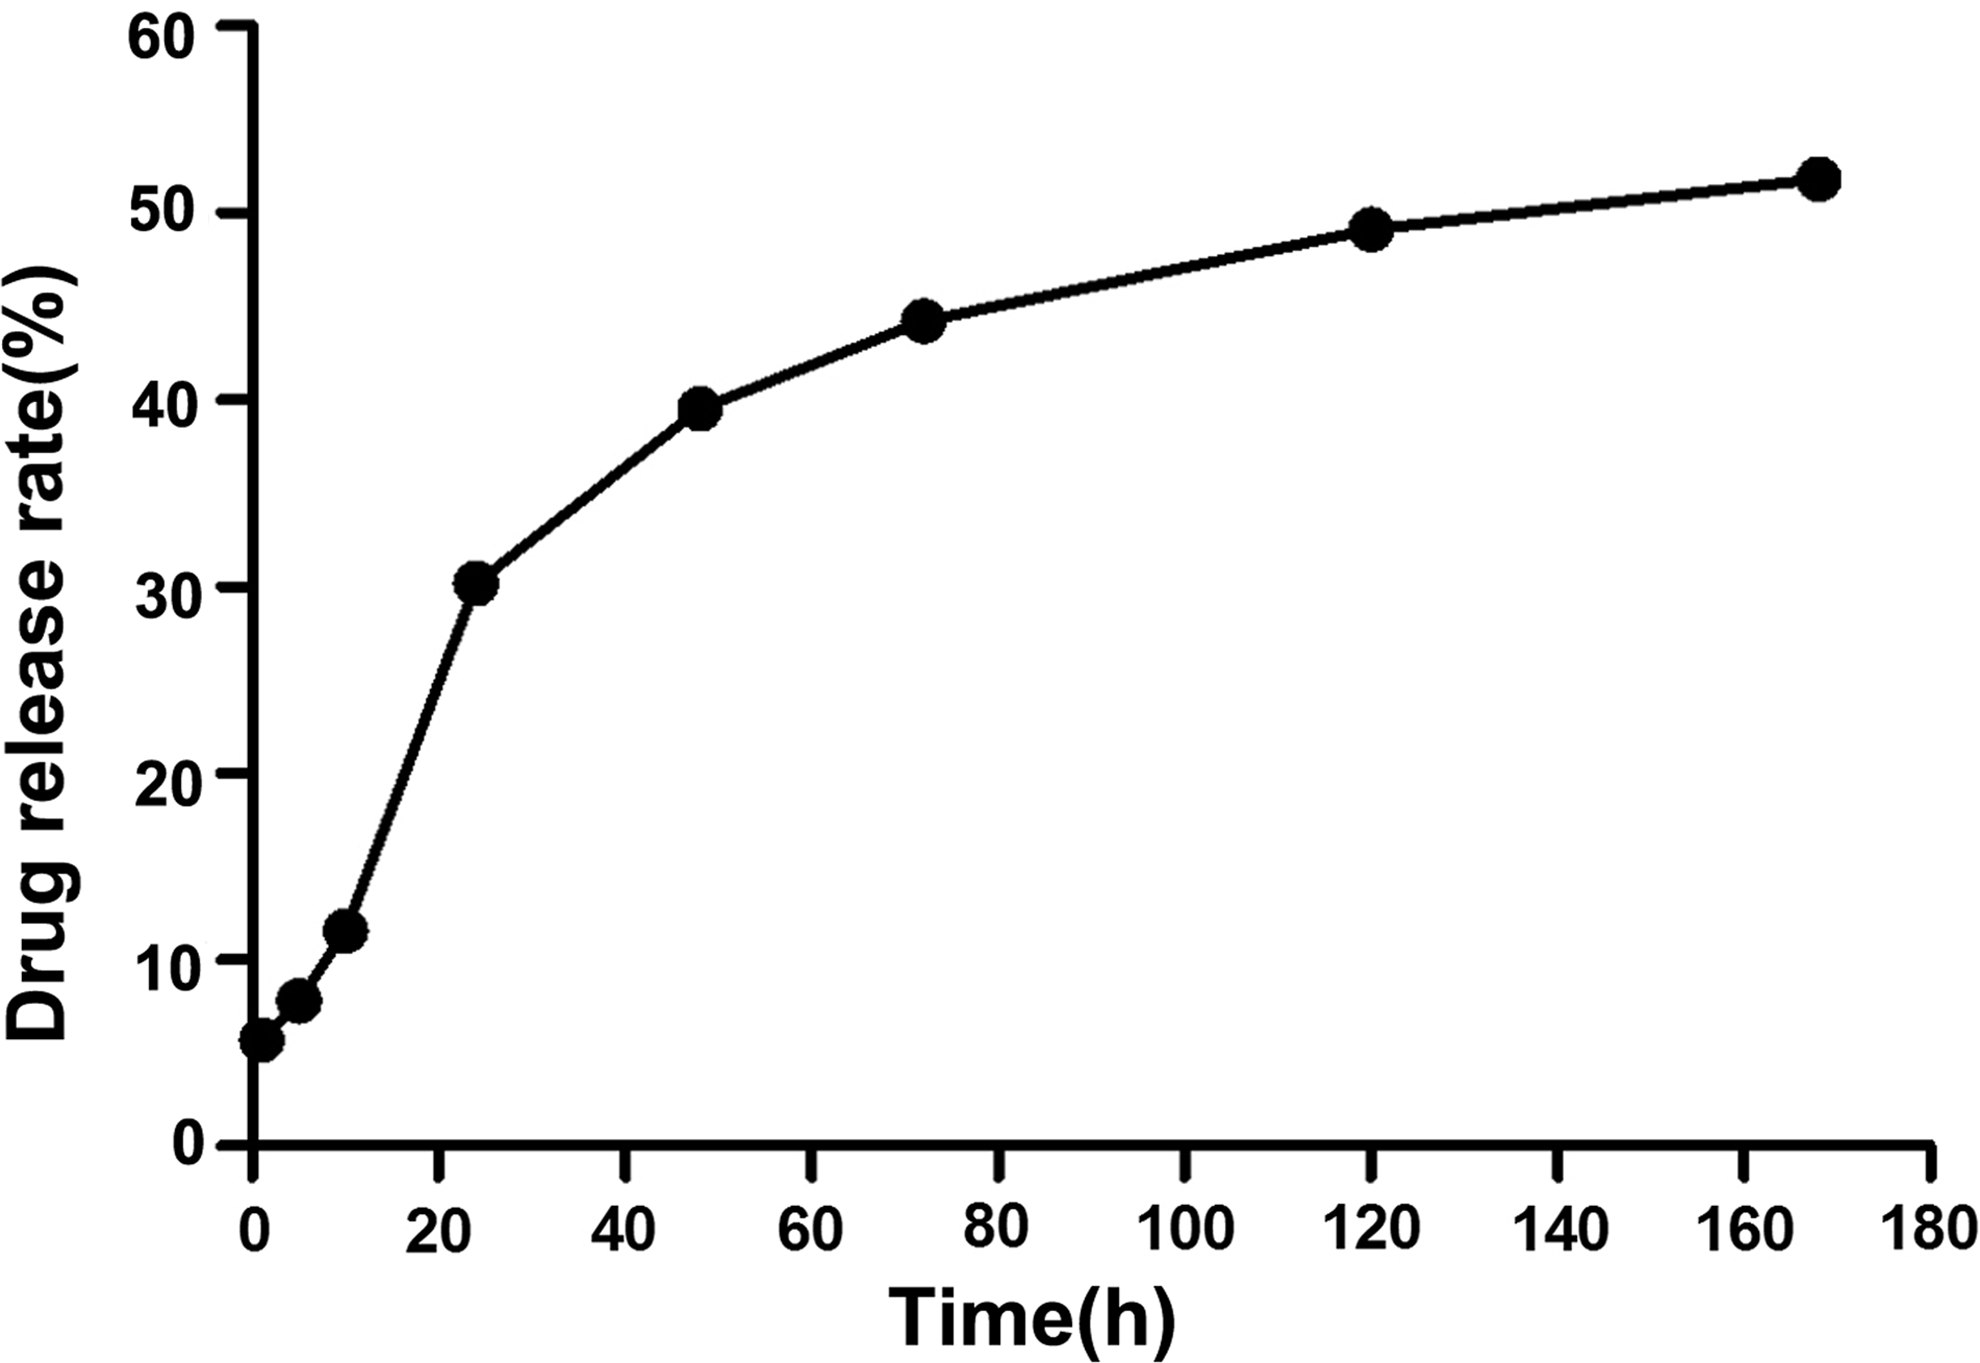
Drug release in vitro. In vitro drug release was comparatively fast in the early stages, especially in the first 24 h, at 29%; a steady state was reached thereafter. The total amount of released drug was 51% in the first 7 days.
VEGF, vascular endothelial growth factor.
Cytotoxicity of chitosan nanospheres of different concentrations
The impact of chitosan nanospheres on the cytoactivity of preadipocytes appeared in a dose-dependent manner (Fig. 5). Chitosan nanospheres of low concentration (25–50 mg/mL) have little impact on cytoactivity. There was no significant difference between groups with concentrations of 25 mg/mL and 50 mg/mL (p>0.05). Cell viability was significantly suppressed by chitosan nanospheres with a concentration of 100 mg/mL compared with 25 and 50 mg/mL (p<0.05).
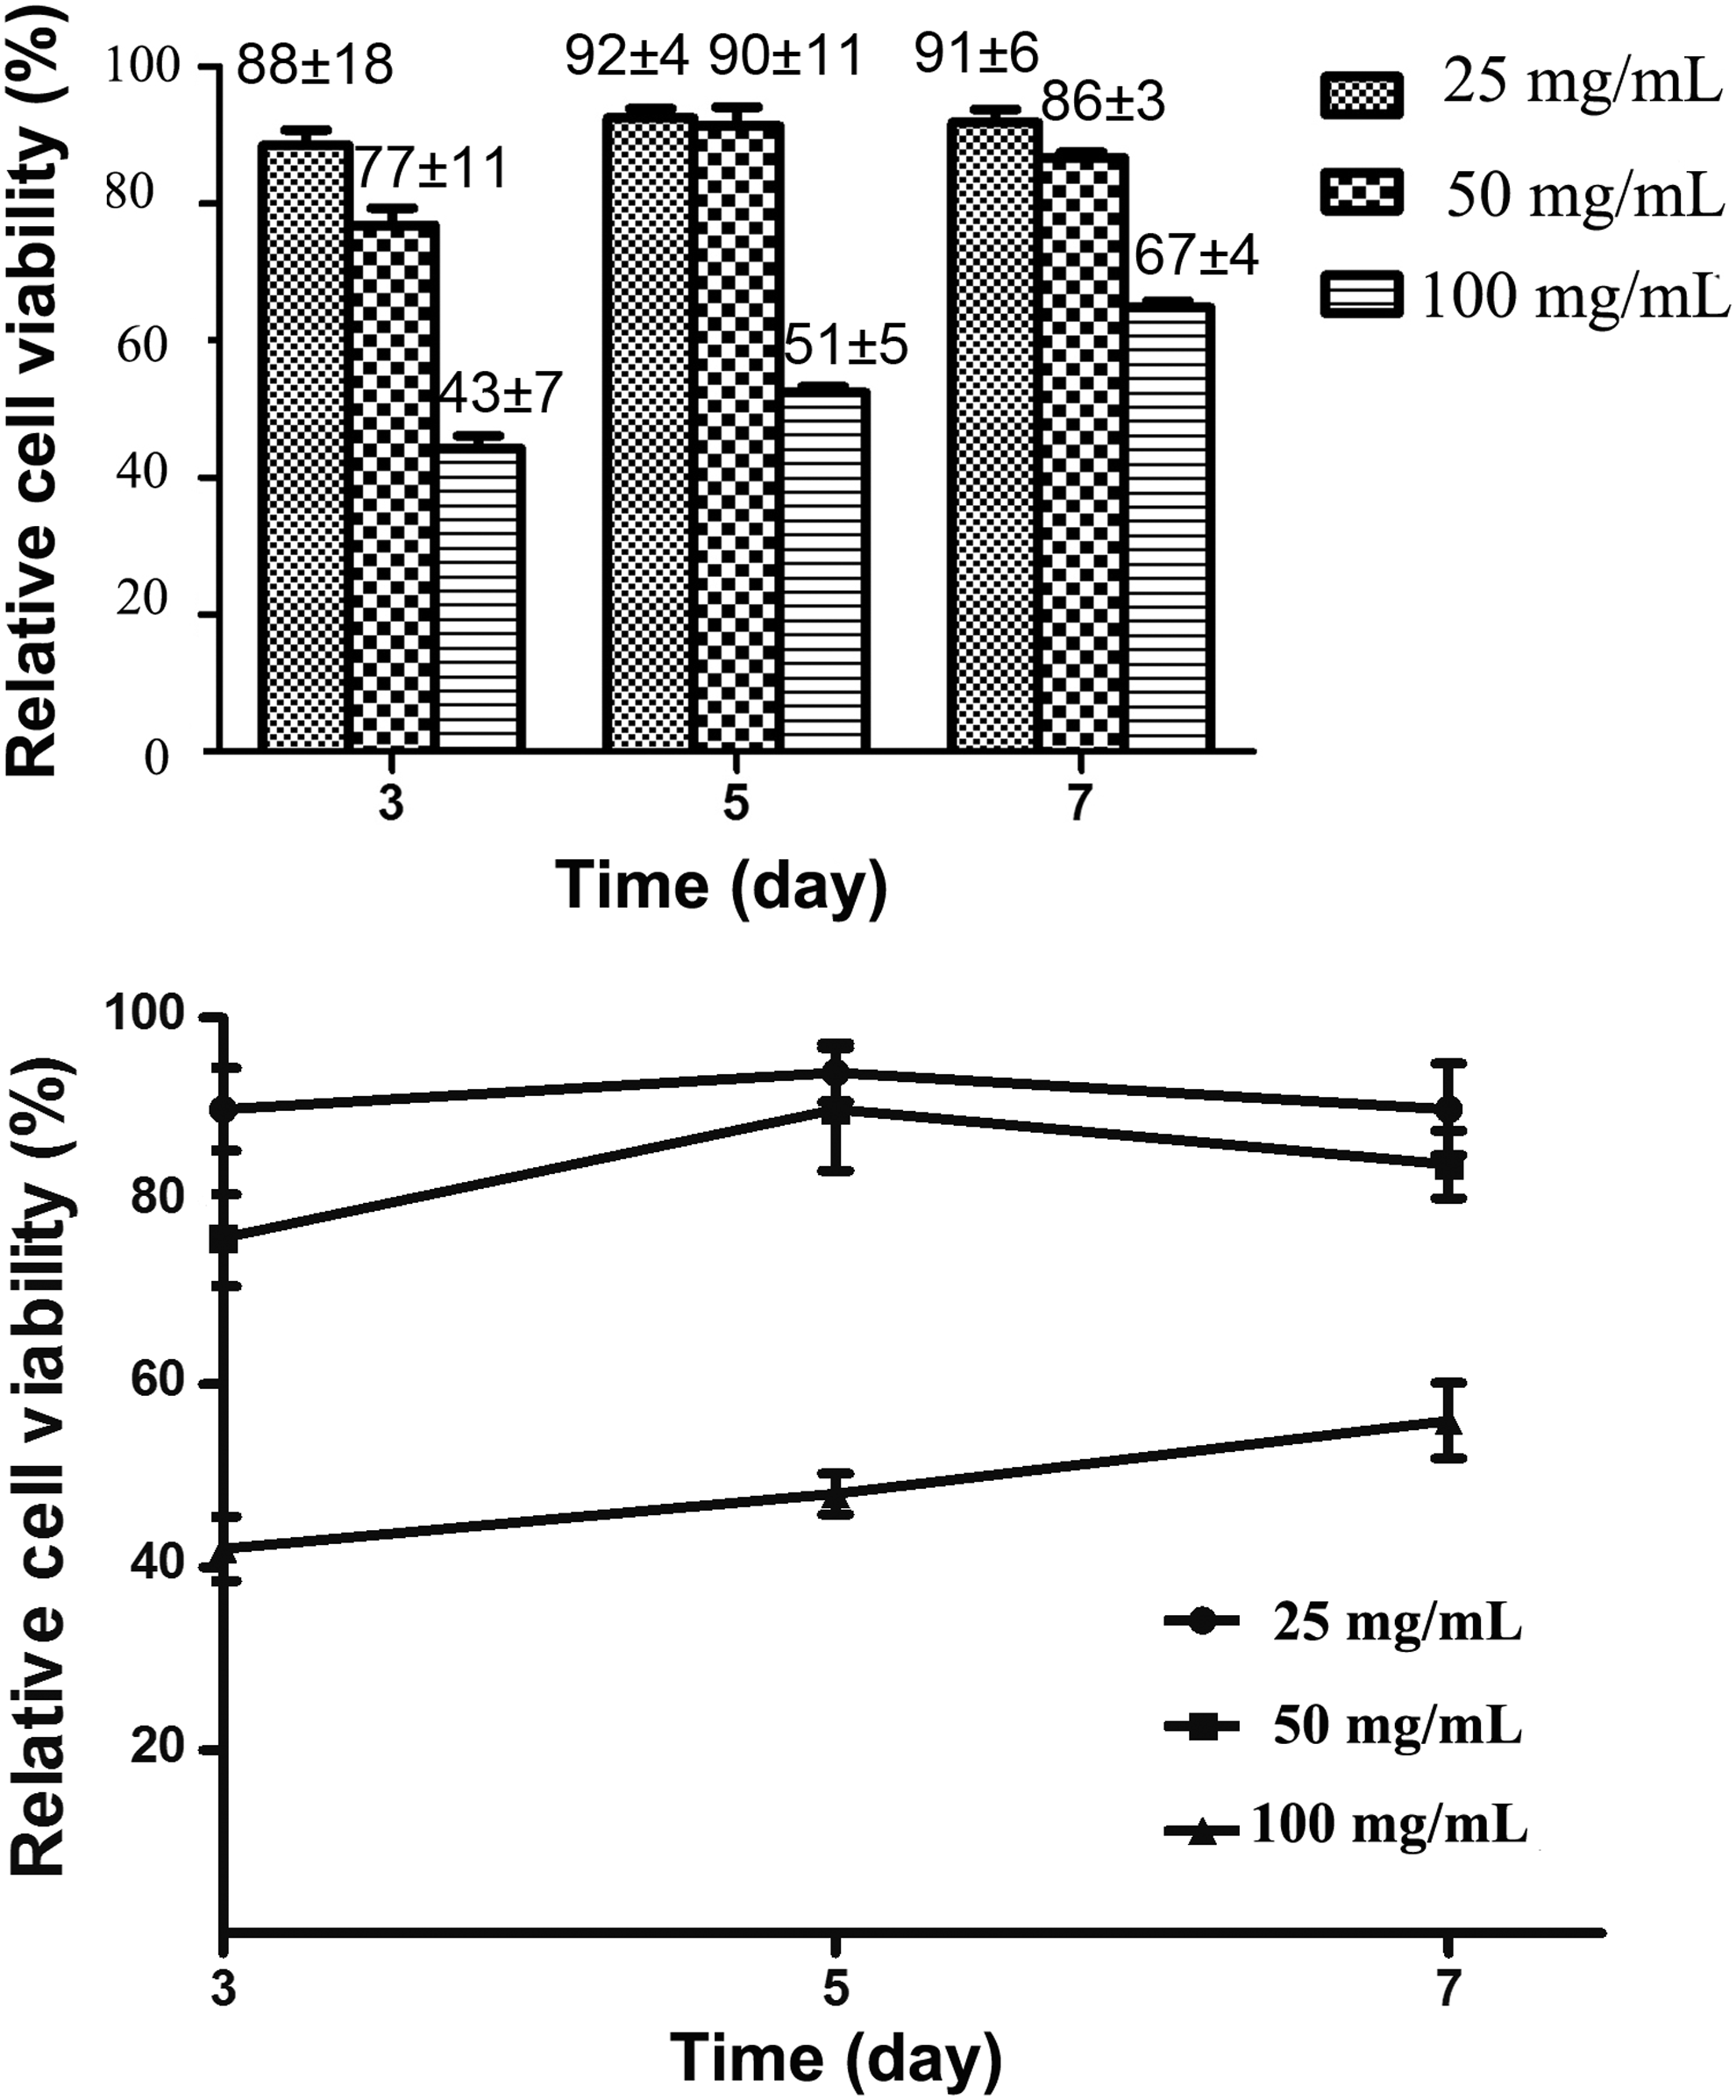
The impact of chitosan nanospheres on the cytoactivity of preadipocytes appeared in a dose-dependent manner. Chitosan nanospheres of low concentration (25–50 mg/mL) have little impact on cytoactivity. There was no significant difference between groups with concentrations of 25 and 50 mg/mL (p>0.05). Cell viability was significantly suppressed by chitosan nanospheres with concentration of 100 mg/mL compared with 25 and 50 mg/mL (p<0.05).
ELISA of VEGF in vivo
The VEGF concentrations of grafts in the four groups at day 7 post-transplantation are shown in Figure 6. The concentration of VEGF in the experimental group was significantly higher than the controls (p<0.01). The difference between the control groups was not statistically significant (p>0.05).
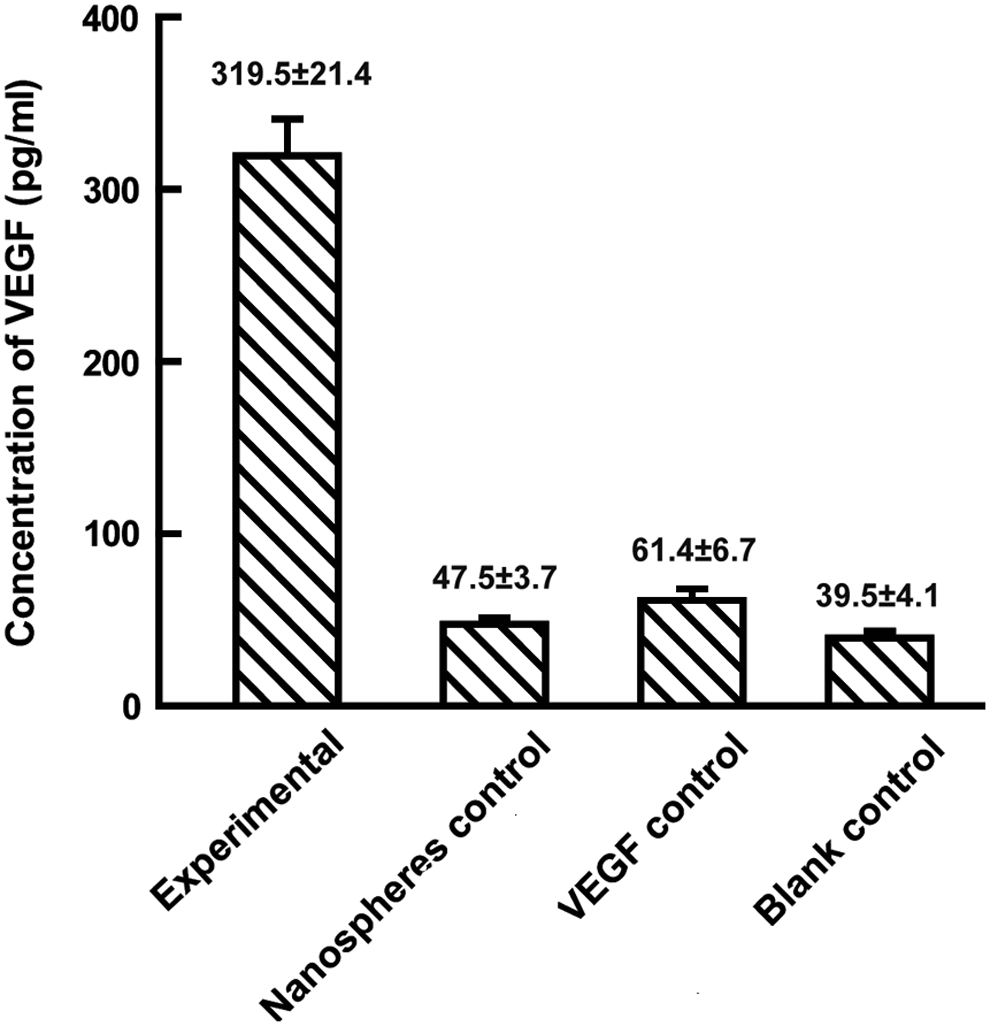
The VEGF concentrations of grafts in the four groups at day 7 post-transplantation. The concentration of VEGF in the experimental group was significantly higher than the controls (p<0.01). The difference between the control groups was not statistically significant (p>0.05).
General observation of adipose grafts
All experimental animals survived. No ulceration or infection occurred at the injection points. Grafts were yellow and soft, and easy to isolate. The envelope was smooth and intact with vessels visible on the graft surfaces (Fig. 7).
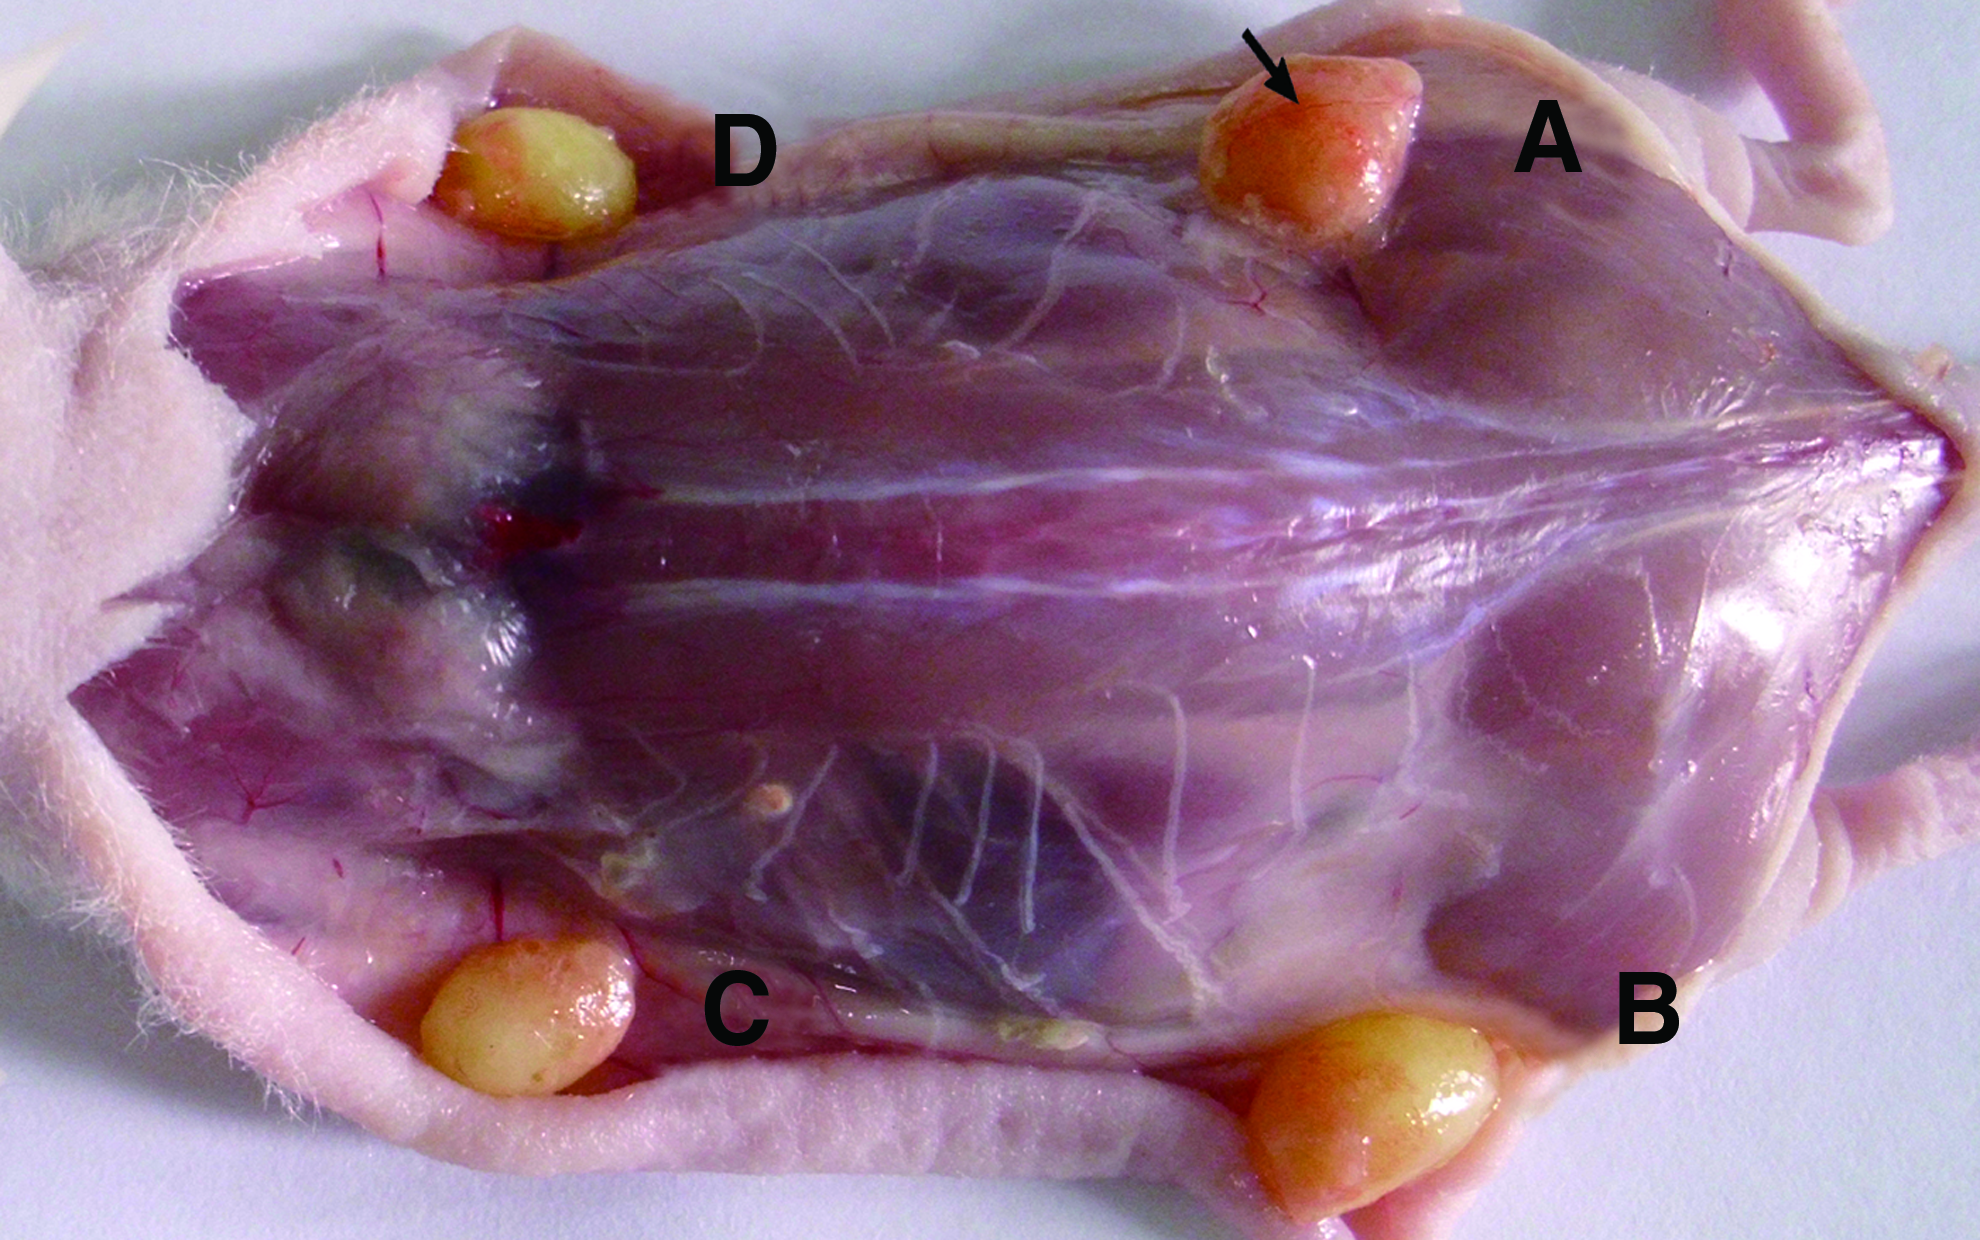
General observation of adipose grafts. Grafts were yellow and soft, and easy to isolate. The envelope was smooth and intact with vessels visible on the graft surfaces. The arrows indicated the graft neovessels.
Graft mass
The masses of grafts in each group at different time points are shown in Table 2; with calibration, the original starting masses in the four groups were normalized to 0.191 g, equivalent to the blank control group. For each group, the same normalization was also applied to the actual residual transplant mass. Calibrated mass=Original mass×(0.191 g/Starting mass of this group). No significant difference was found among groups (p>0.05) at weeks 3 and 6. However, at week 12, mean graft mass in the experimental group was higher than for controls (p<0.05). In addition, there was no significant difference among the three control groups (p>0.05). The mass time curve (Fig. 8) shows that the mass decrease in the experimental group was slower than for controls.
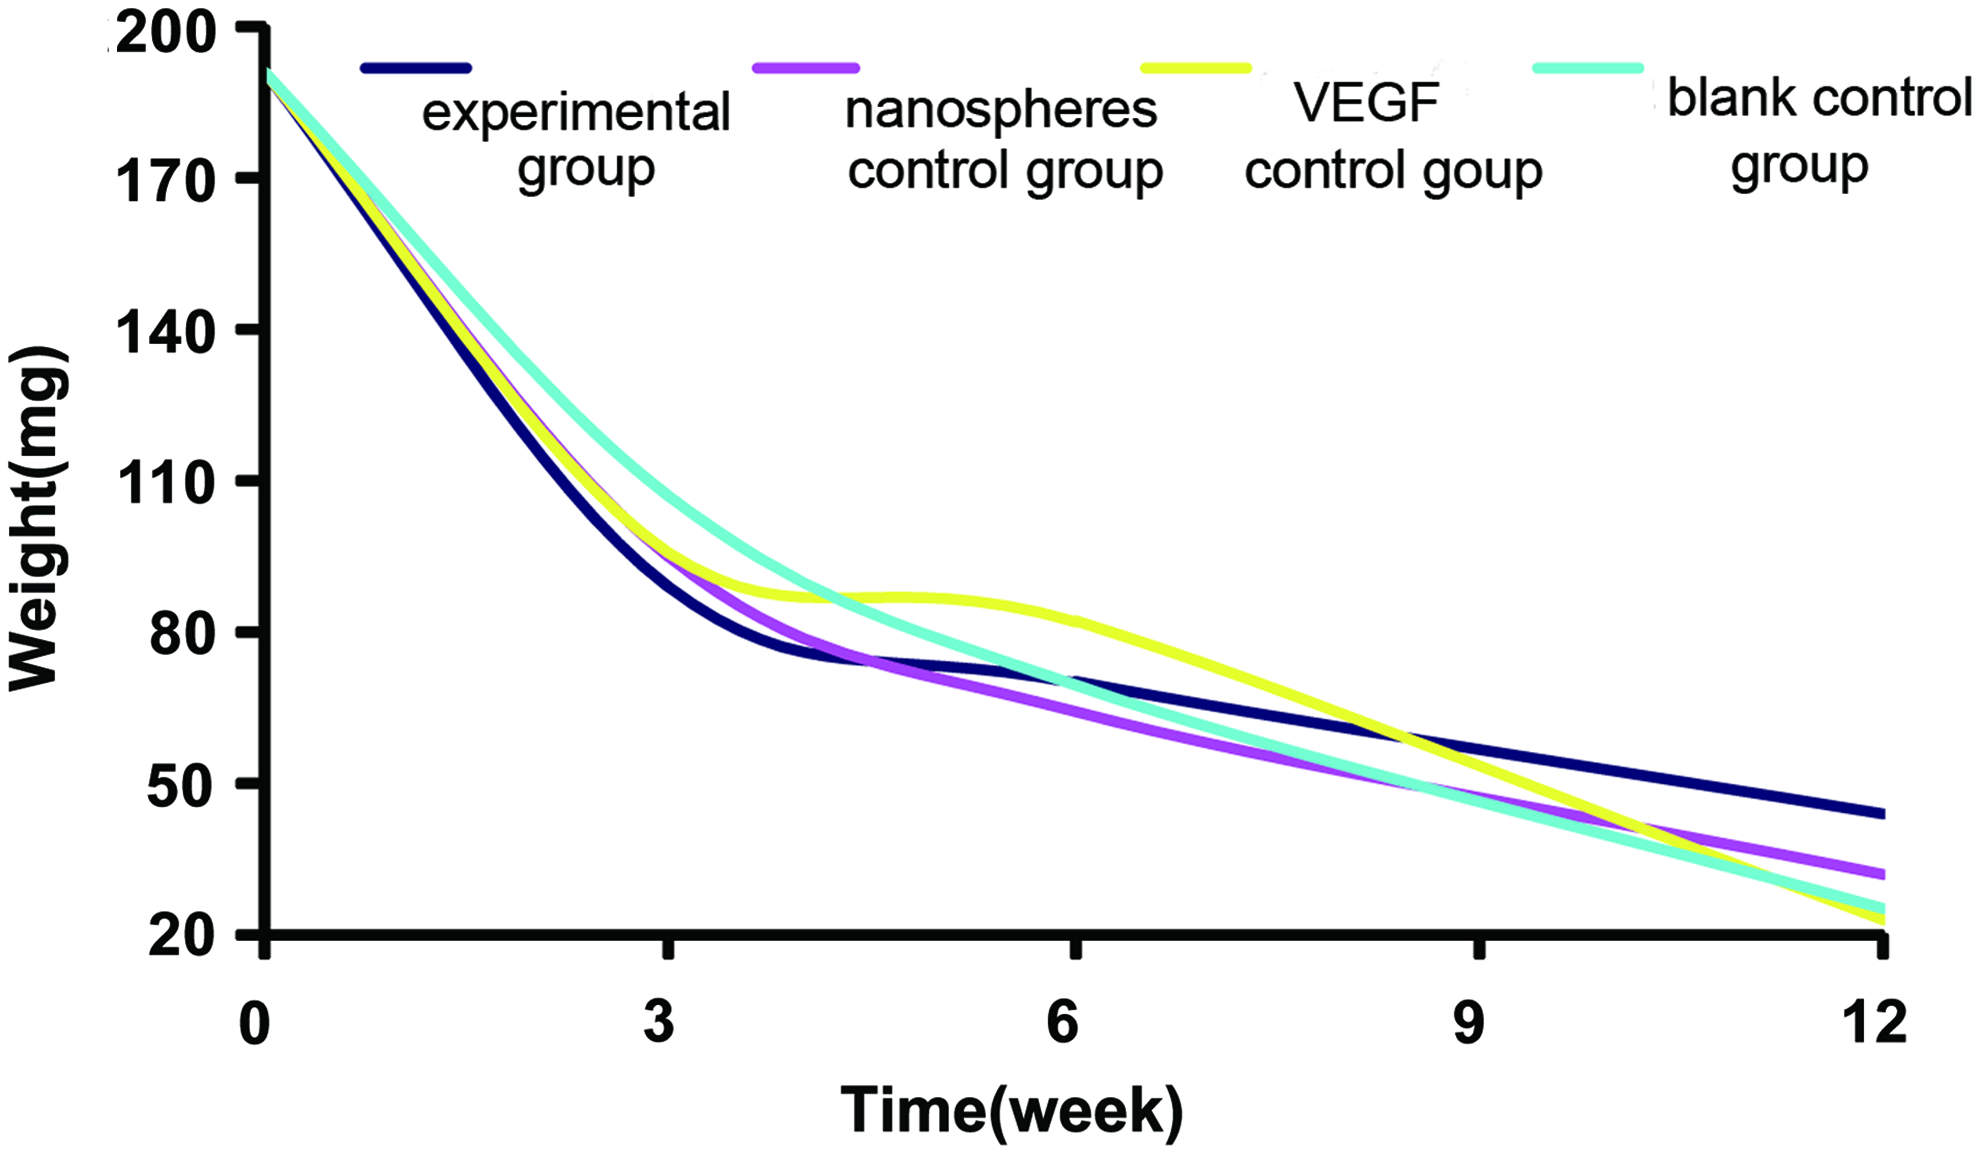
The mass–time curve of grafts in different groups. No significant difference was found among groups (p>0.05) at weeks 3 and 6. However, at week 12, mean graft mass in the experimental group was higher than for controls (p<0.05). In addition, there was no significant difference among the three control groups (p>0.05). The mass–time curve shows that the weight decrease in the experimental group was slower than in controls. Color images available online at www.liebertpub.com/tea
With calibration, the original weights in the four groups were normalized to 0.191 g, equivalent to the blank control group. For each group, the same normalization factor was also applied to the actual residual transplant weights listed in the table.
Histological evaluation
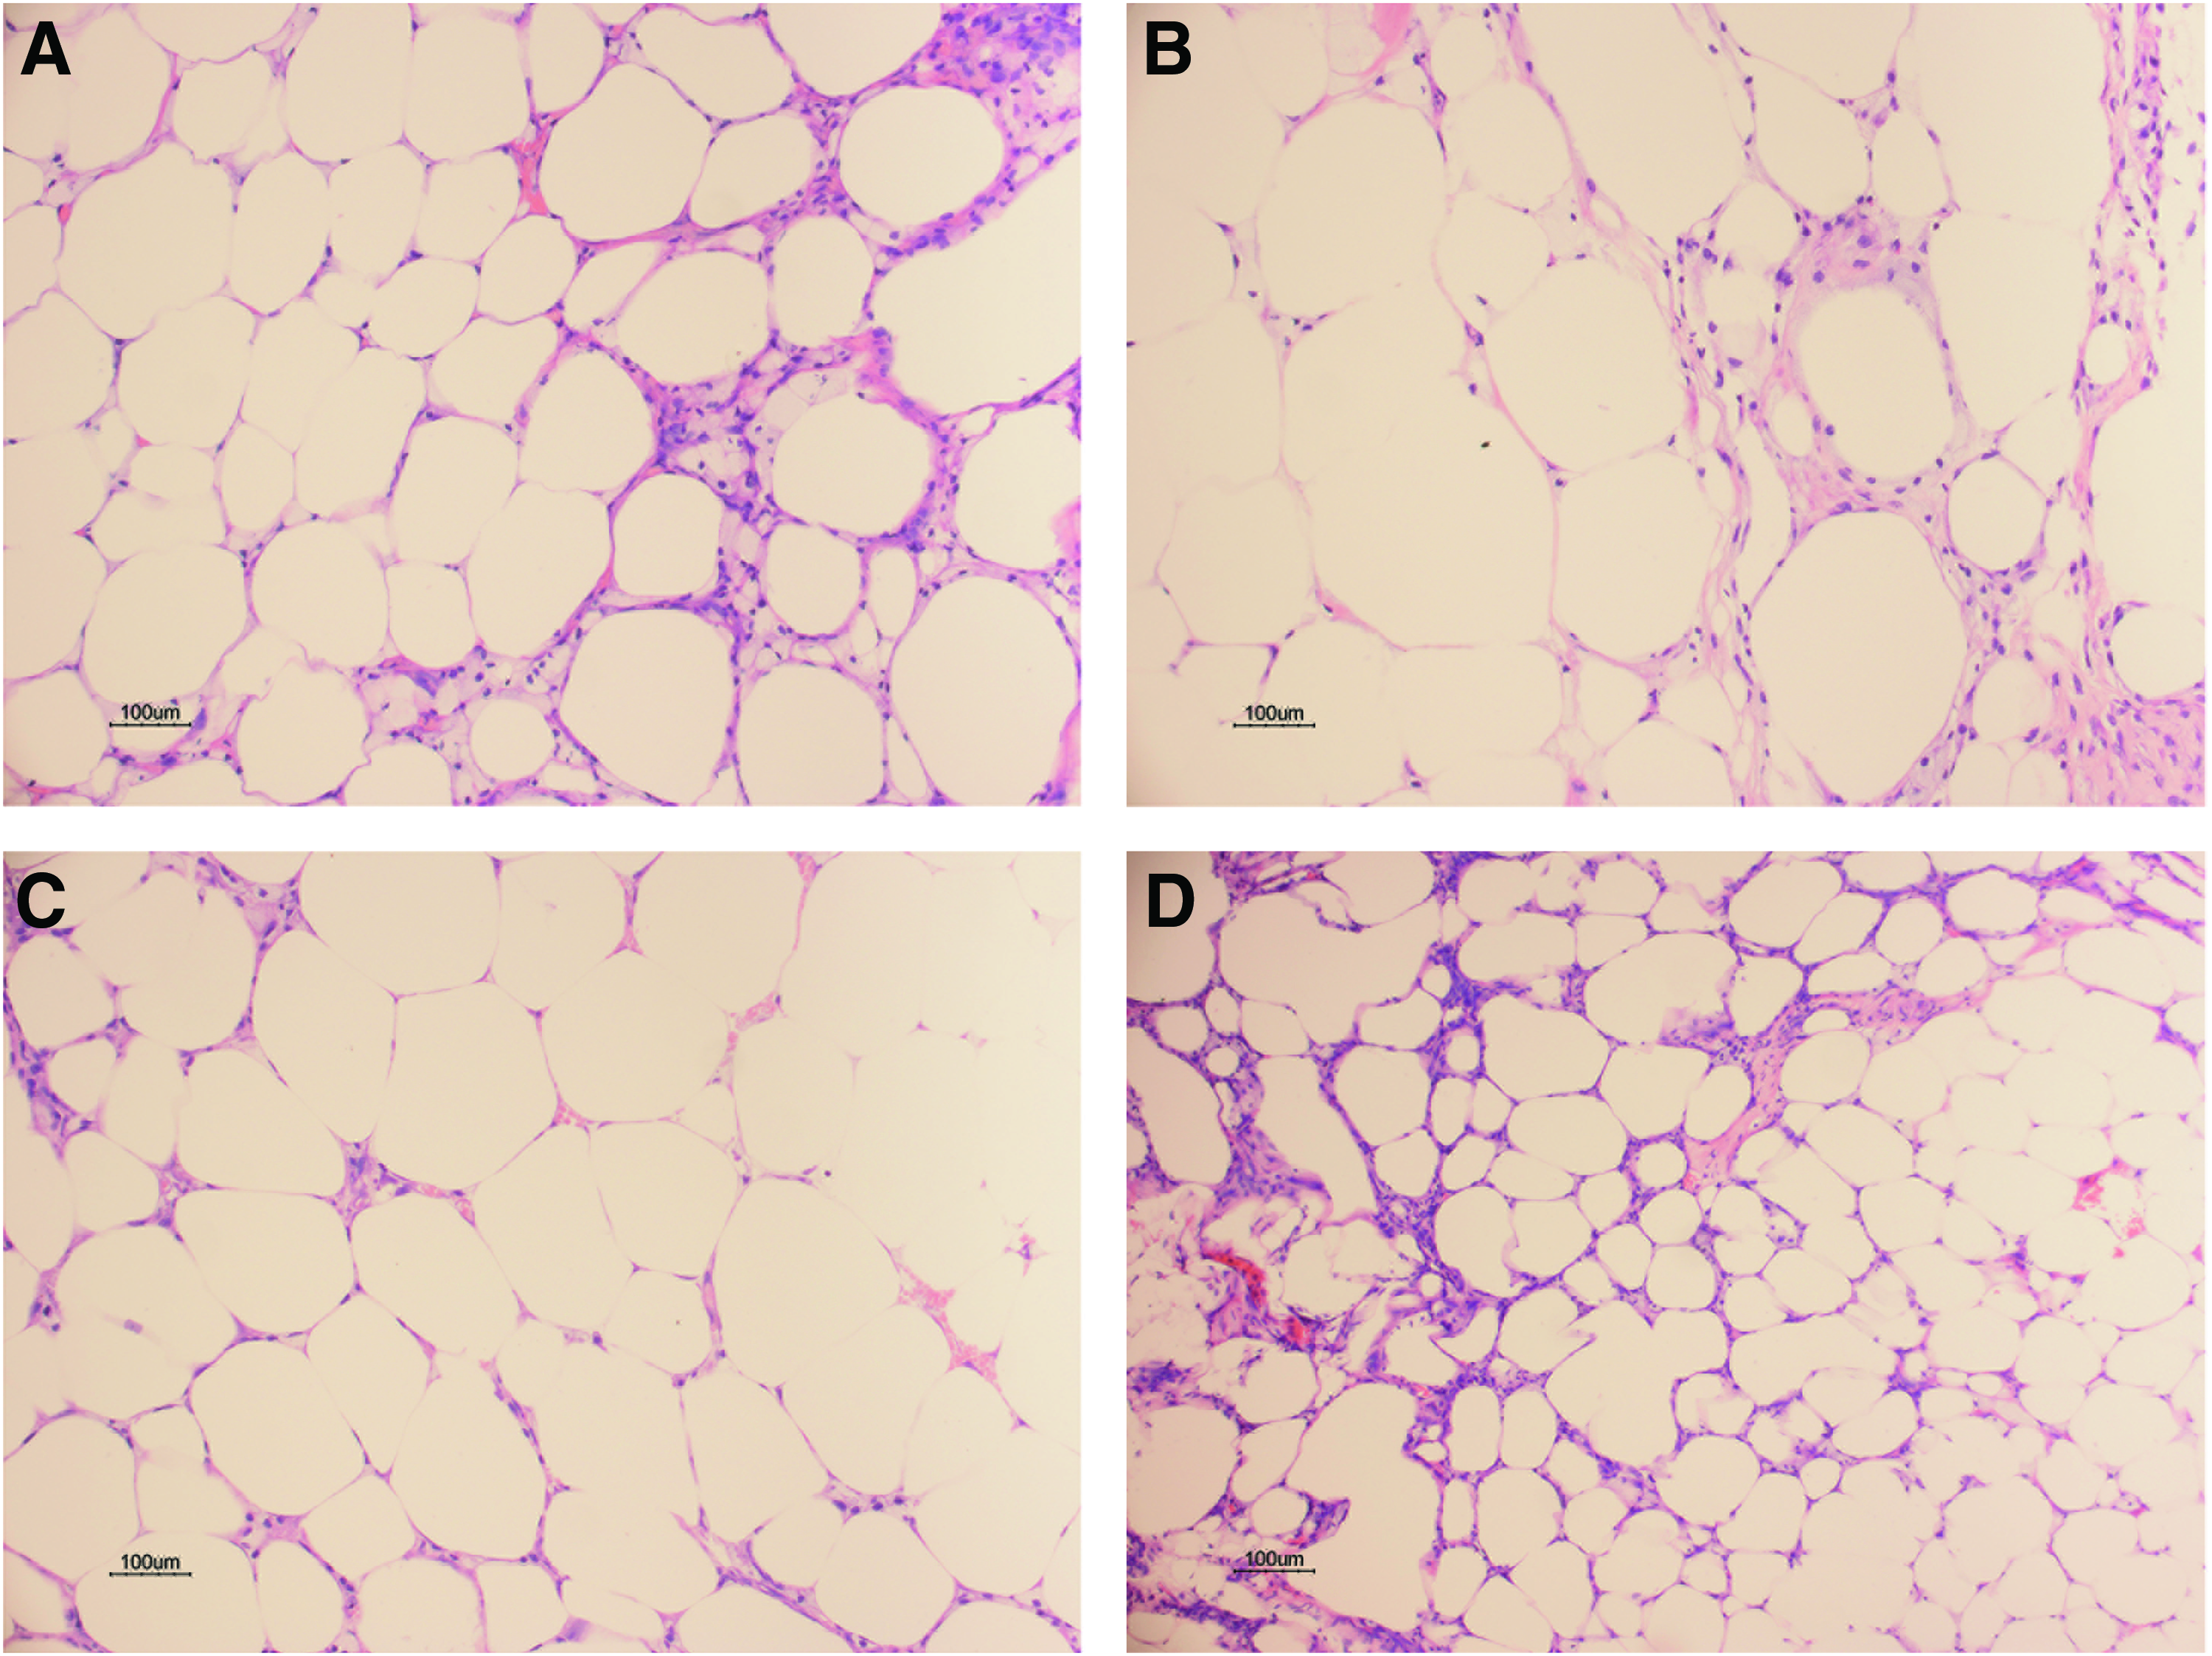
At week 3, thin envelopes formed around the grafts. Necrotic adipocytes were observed in the center of the sections. Inflammatory cells were scattered among the adipocytes, especially in the experimental group and the nanospheres control group. A small number of neovessels were observed in all sections (Fig. 9). Grafts harvested at week 6 showed formation of continuous envelopes and connective tissue. There were more adipocytes observed in the experimental group than in the control groups. The adipocytes in the experimental group were closer in morphology to normal adipocytes, and more uniform in size, compared with other groups. In grafts obtained at week 12, a large amount of normally shaped and sized adipocytes were observed in the experimental group. Severe fibrosis was found in the control groups with a few lipid droplets of varying sizes (Fig. 10).
Histological images of grafts obtained at week 3 (hematoxylin and eosin [HE] staining, original magnification: 200×). Thin envelopes formed around the grafts. Necrotic adipocytes were observed in the center of the sections. Inflammatory cells were scattered among adipocytes, especially in the experimental group and the nanospheres control group. A small number of neovessels were observed in all sections.
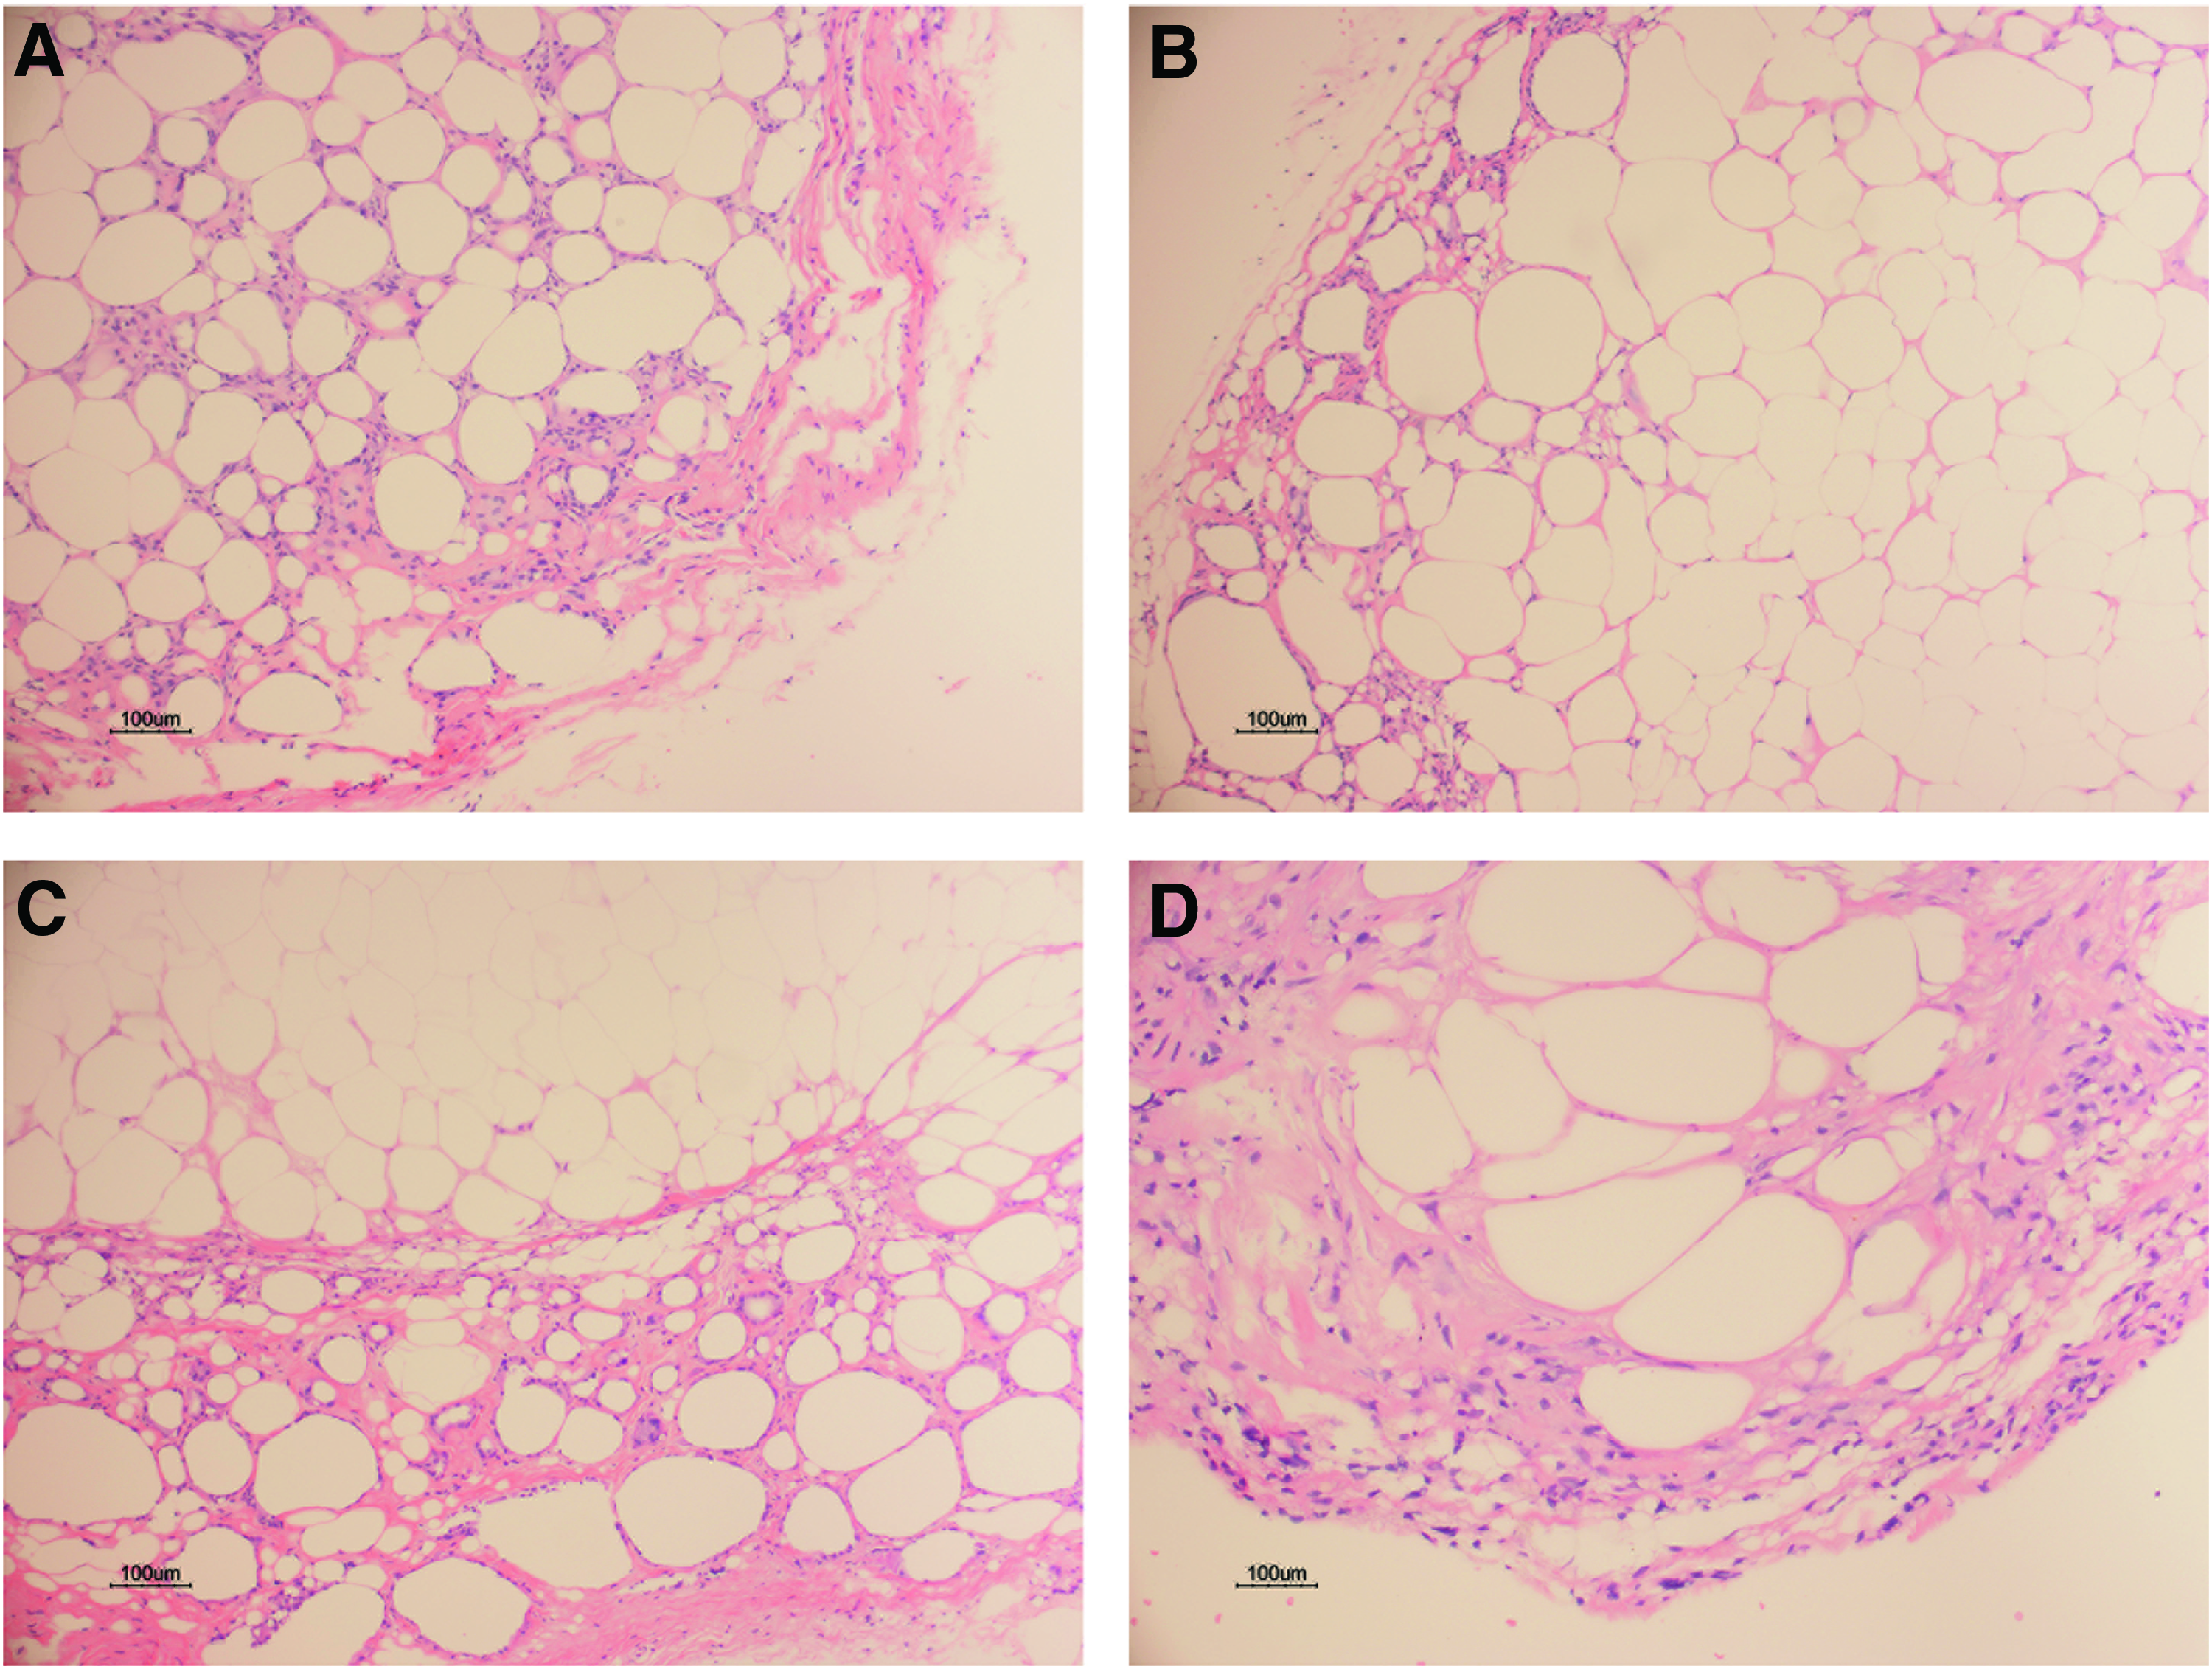
Histological images of grafts obtained at week 12 (HE staining, original magnification: 100×). A large amount of normally shaped and sized adipocytes were observed in the experimental group. Severe fibrosis was found in the control groups with a few lipid droplets of varying sizes.
Electron microscopy observation
Small and round nanospheres were found both inside and outside the adipocytes when observed under a transmission electron microscope (Fig. 11). Many nanospheres were adhered to the surface of the cells under a scanning electron microscope. Some of these nanospheres were deformed and had merged with cell membranes (Fig. 12).

Transmission electron microscopy of the grafts. Arrows indicate the nanospheres. Small and round nanospheres were found both inside the adipocytes
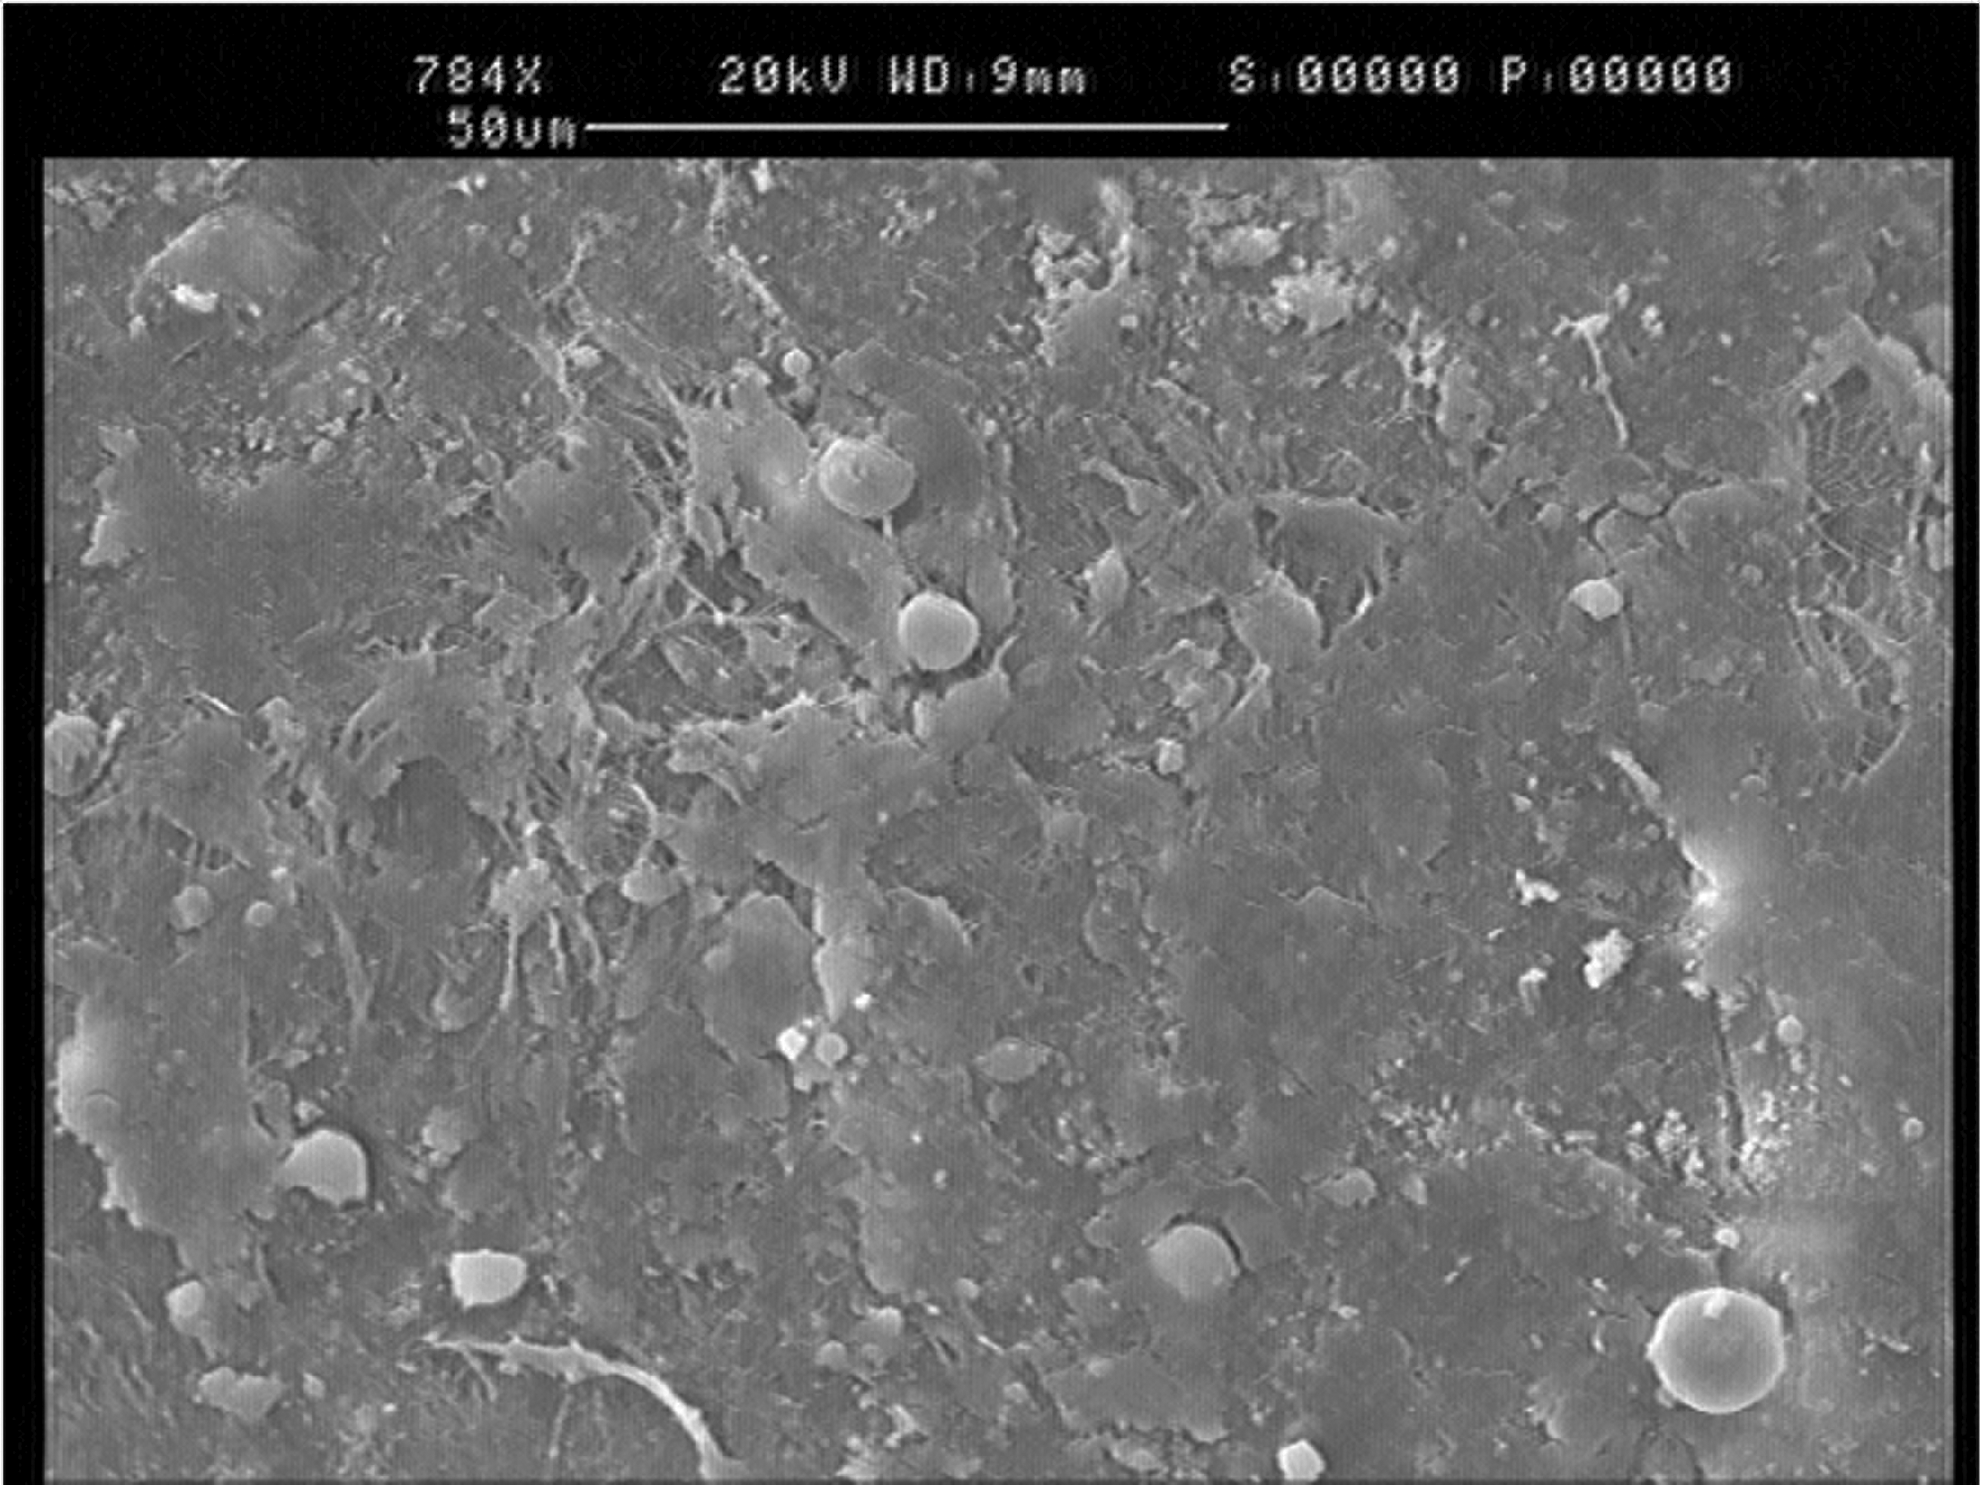
Scanning electron microscope images of the grafts. Many nanospheres were adhered to the surface of the cells. Some of these nanospheres were deformed and had merged with cell membranes.
Vascular density
Endothelial cells appeared brown by CD34 immunohistochemical staining, as seen on light microscopy (Eclipse 80i; Nikon). Neovessels appeared as masses or streaks in the graft. Typical vascular lumens containing red blood cells were also seen (Figs. 13 and 14). Table 3 lists neovessel density as measured by image software (relative area), where the experimental group had a rising trend, while other groups showed a steady or declining trend in a time-dependent manner (Fig. 15). There was no statistically significant difference in neovessel density between groups at week 3 (p>0.05). At week 6, the graft vascular density in the experimental group was higher than controls (p<0.05). No significant difference existed within the three control groups (p>0.05). Similar results were found in grafts obtained at week 12.

Images of grafts obtained at week 3, immunohistochemically stained by CD34. Images were taken at a 400× magnification. Neovessels appeared as masses or streaks in the graft. Typical vascular lumens containing red blood cells were also seen. Arrows indicated the neovessels.
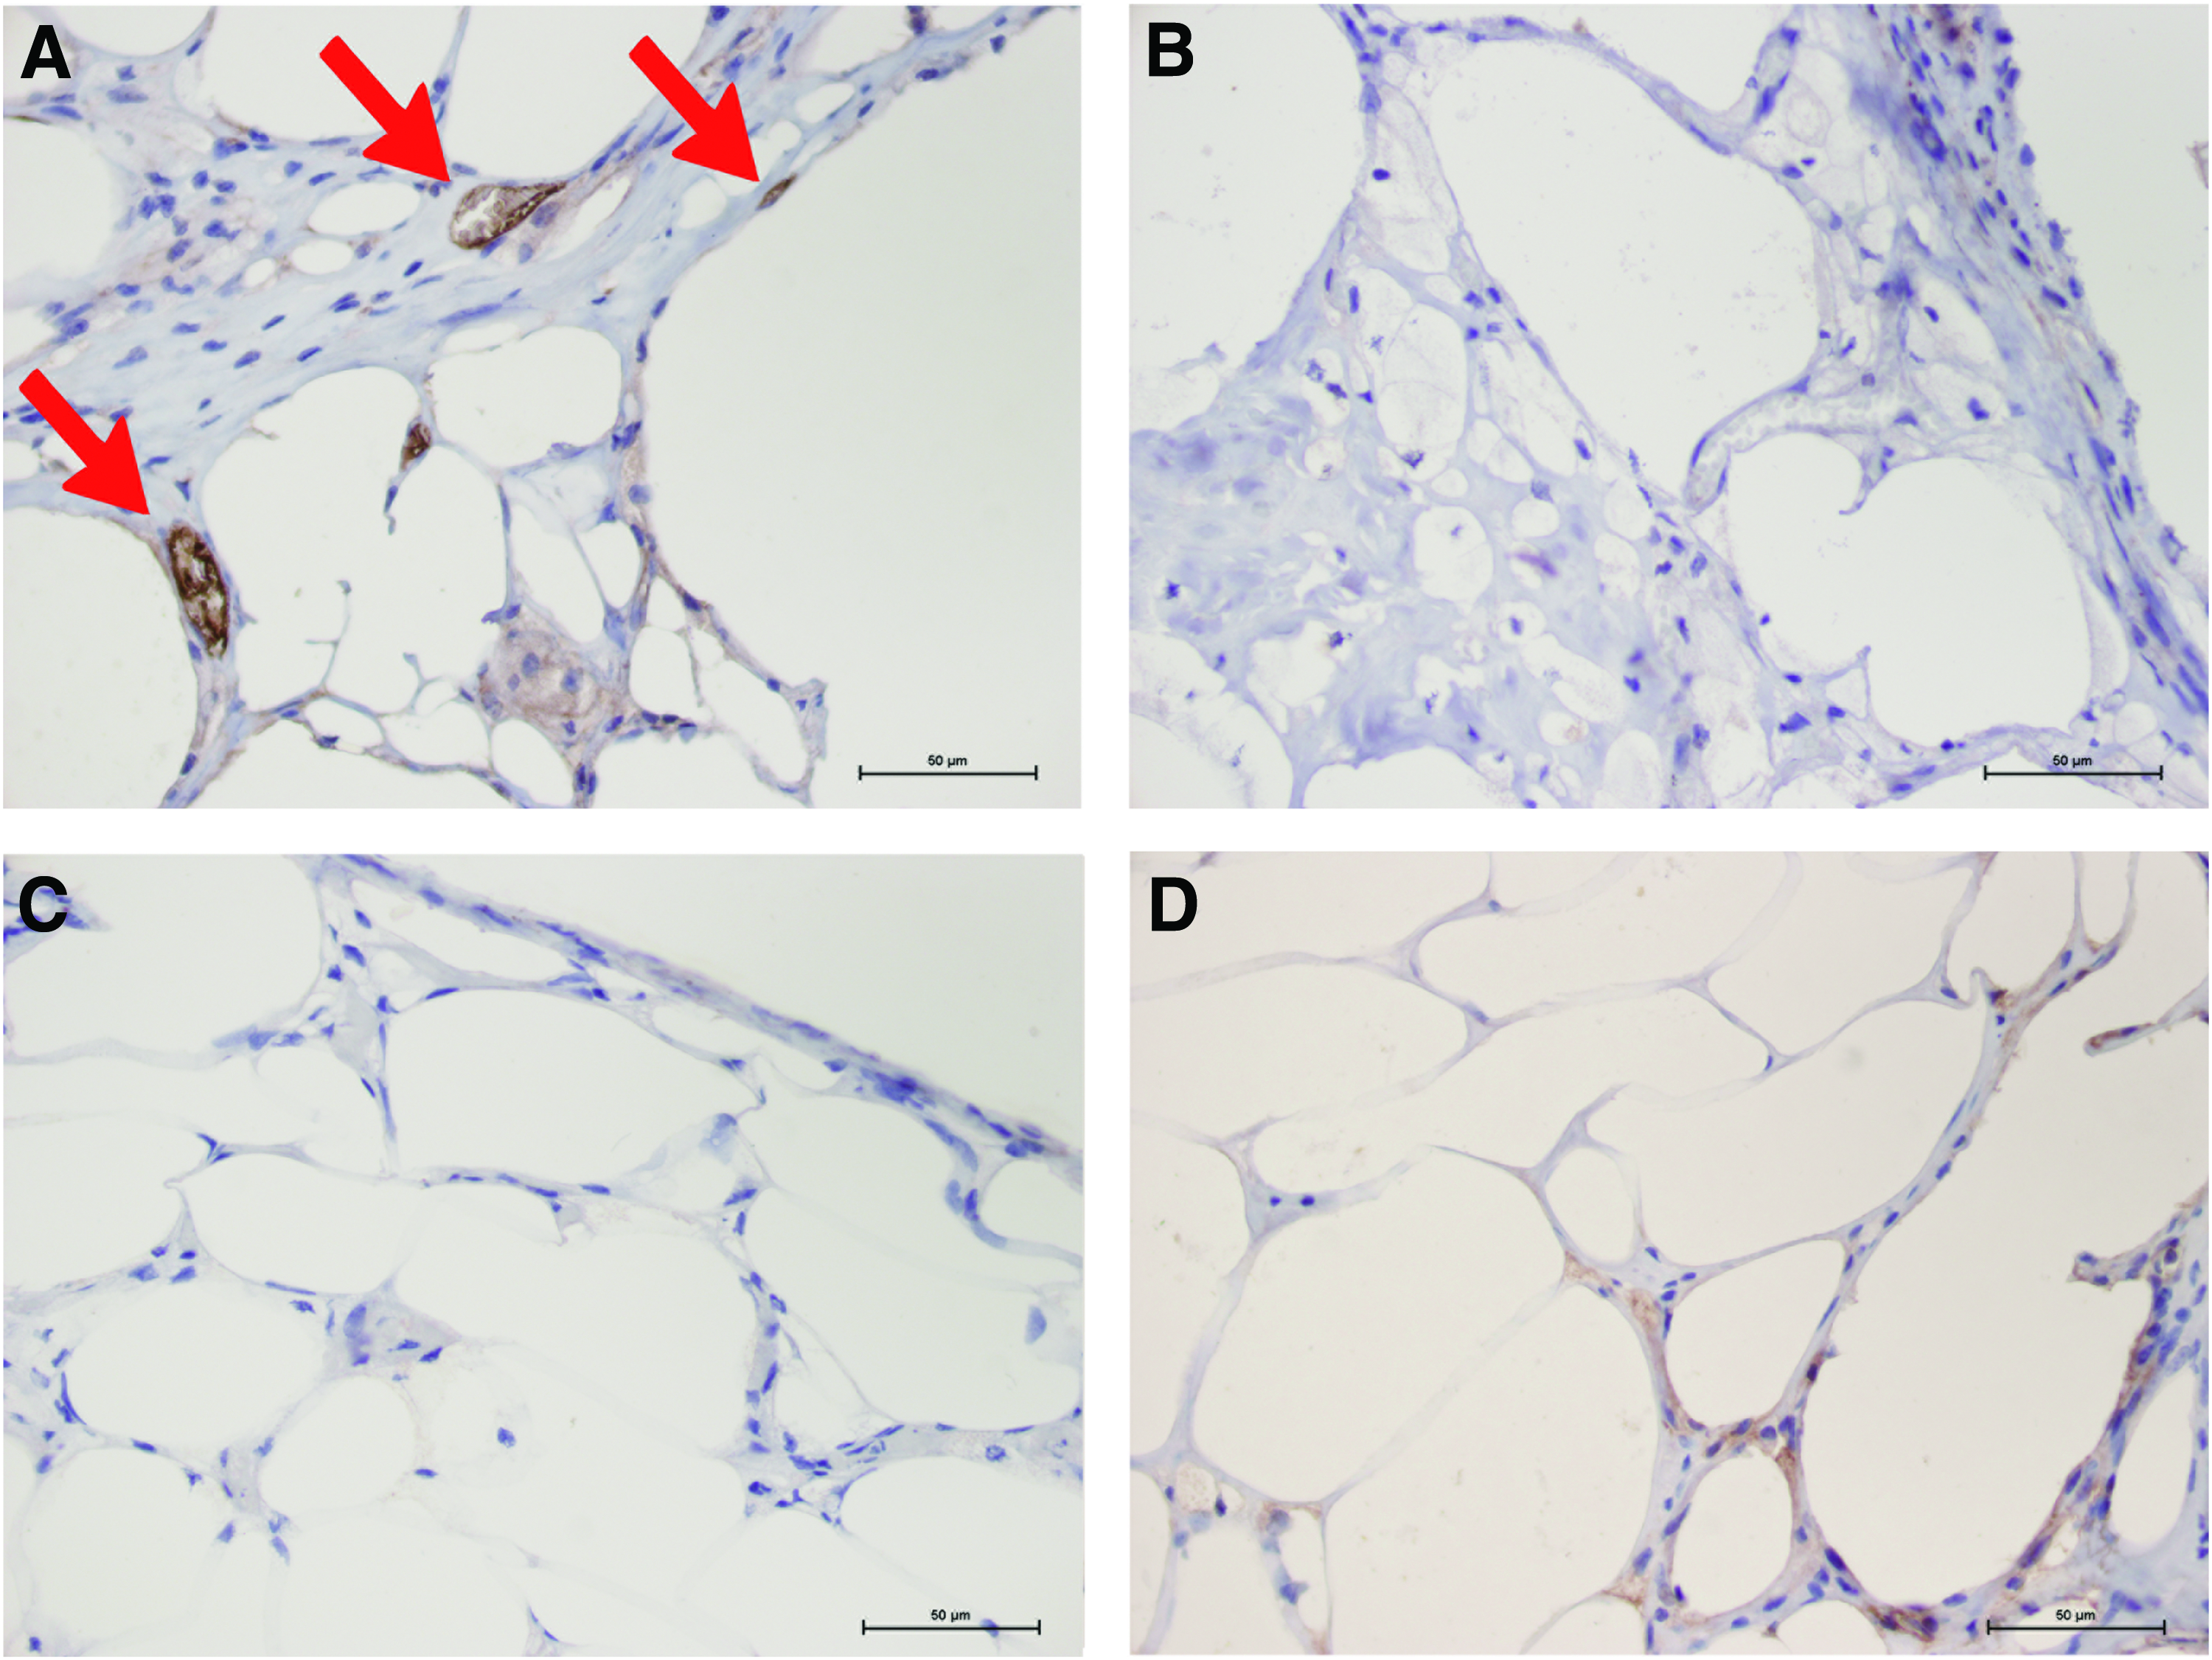
Images of grafts obtained at week 12, immunohistochemically stained by CD34. Images were taken at a 400× magnification. Arrows indicated the neovessels.
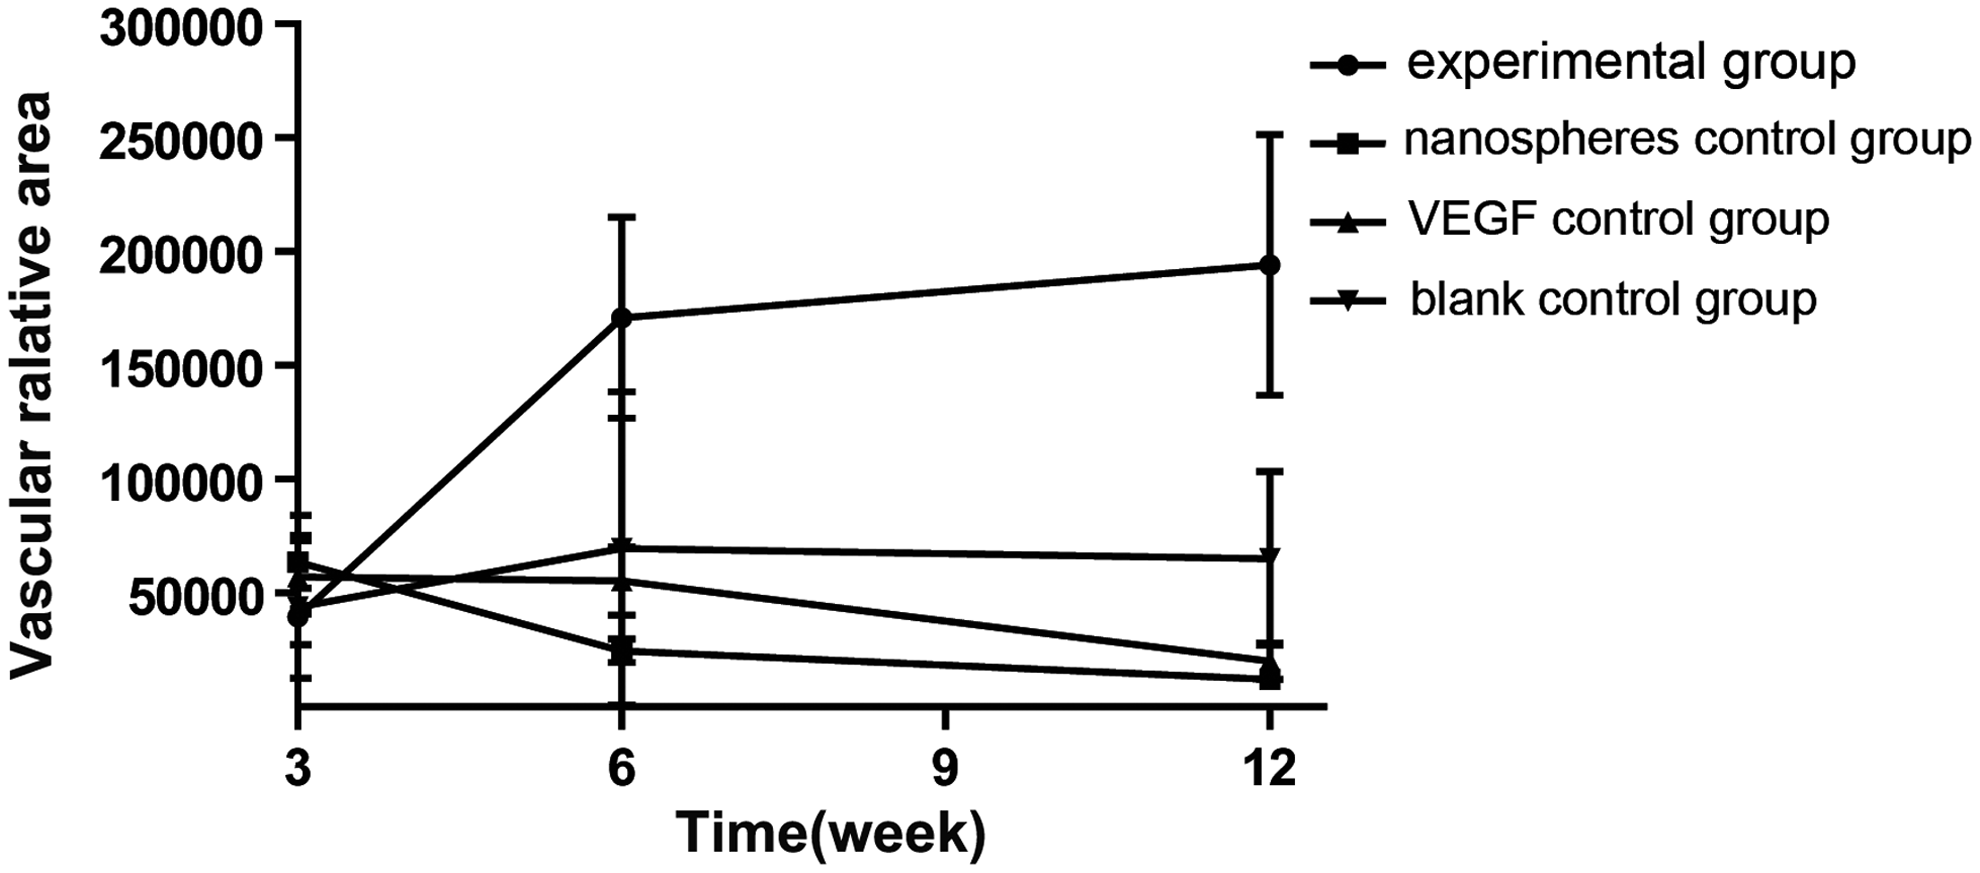
The neovessel density–time curve of the grafts. The experimental group had a rising trend, while other groups showed a steady or declining trend in a time-dependent manner. There was no statistically significant difference in the neovessel density between groups at week 3 (p>0.05). At week 6, graft vascular density in the experimental group was higher than controls (p<0.05). No significant difference existed within the three control groups (p>0.05). Similar results were found in grafts obtained at week 12.
Discussion
With absorption of 25% to 80%, 1 autologous free fat transplantation rarely achieves sufficient augmentation, probably due to a combination of reasons: reduced adipocyte viability from suctioning, low tolerance of adipocytes to ischemia, and ischemia after cell transplantation, which leads to cell necrosis, fibrosis, and graft volume shrinkage. 14 Many factors can affect the survival of free fat grafts, including the graft size, the method of fat harvesting, and fat metabolism.
Regarding the theories of survival of adipose tissue transplants, some investigators believe that all of the fat cells in an adipose graft fail to survive and that the host histocytes take on lipids released from the broken down fat cells and become the new adipose cells (host cell replacement theory). Others maintain that some adipocytes within a free transplant survive as living entities and that these cells collectively represent the adipose tissue ultimately remaining in the transplantation site (cell survival theory). 15 Recent studies have advocated both opinions based on the observed interactions between the fat graft and host tissue.16–19 However, there is no evidence demonstrating which of the two responses predominant. 20 In Peer's investigation of fat graft survival, 15 all the cellular responses mentioned in both the theories were observed. It was thought that the initial revascularization played a key role in adipocyte survival, which started as early as 4 days after transplantation. The importance of revascularization was accepted by many investigators.
VEGF is considered the most powerful promoter of vascularization. However, free VEGF can barely exert its biological function when applied directly, as VEGF is rapidly degraded when administrated by uncontrolled and nonspecific methods. 20 The application of chitosan nanospheres loaded with drugs has been tested in many in vivo models, providing evidence that drug release can be controlled and long lasting in vivo.21–28 We prepared chitosan nanospheres loaded with VEGF according to the method developed by Berthold. 12
In vitro studies showed a satisfactory DL (15 μg/g) and EE (74.99%). According to the in vitro release test, after the application of chitosan nanospheres loaded with VEGF, the amount of released VEGF reached 50% by the end of the first week. In addition, in our in vivo experiment, the detected concentration of VEGF in the experimental group at day 7 was significantly higher than the controls (p<0.01), demonstrating that VEGF can be released in a controlled fashion when loaded by chitosan nanospheres.
Many studies have shown that chitosan has very good biocompatibility. In vivo and in vitro studies by Sun et al. suggested that the chitosan particles are nontoxic in nature and have an improved photodynamic efficacy when used at concentrations of less than 100 μM. 29 Chitosan nanospheres do not alter the viability of conjunctival epithelial cells. In vitro studies on IOBA-NHC (human conjunctival epithelial cells) indicated no difference in cell viability when they were incubated either in the presence or absence of chitosan nanoparticles. 28 However, according to the Cell Counting-8 Kit assay in this study, chitosan nanospheres at a concentration higher than 50 mg/mL decreased preadipocyte viability. We suggest that the toxicity is mainly due to residual additives present from chitosan nanospheres manufacturing. This cytotoxic effect on preadipocytes decreased over time, as these additives were dispersed and degraded.
During in vivo experiments, fat tissue was suctioned by a syringe, using a needle caliber of 2.5 mm to minimize the trauma to adipocytes. Although not routinely applied in the clinical setting, in our experiment, fat granules were treated with collagenase, in order that the clumped adipocytes dispersed and became evenly distributed. As a result, each injection contained a same amount of adipocytes. We found that at week 6, the neovessel density of the free fat graft in the experimental group surpassed controls. At week 12, the residual transplant mass surpassed that of the control groups.
Although faster neovascularization minimized the duration of adipocytes in the ischemic state, necrosis of some cells was almost inevitable during the transplantation phase. This is confirmed with the declining graft mass in all four groups, although the cytotoxicity from chitosan nanospheres may be partly responsible for the sharp decrease in graft mass in the early stages after the transplantation in the experimental group and the nanospheres control group. However, at week 6, microvascular density in the experimental group significantly exceeded the controls, illustrating that VEGF-loaded chitosan nanospheres display the superior angiogenesis effect among all four groups. With neovascularization, adipocyte destruction decreased, as reflected by the less steep descent of the graft mass time curve for all four groups at later time points. Among the four groups, the mass loss in the experimental group was the slowest; the residual mass was significantly higher compared with control groups at week 12, confirming that VEGF-loaded chitosan nanospheres promote superior neovascularization.
Conclusion
In conclusion, we successfully demonstrated that using chitosan nanospheres to control VEGF release improves efficiency of VEGF application, facilitates better neovascularization, and improves adipocyte survival in adipose tissue transplantation. With further investigation, we believe that this method may be used therapeutically in the clinical setting to improve VEGF application in free fat transplantation.
Footnotes
Acknowledgments
This work was supported by funding from the National Natural Science Foundation of China (No. 81372072 and 31270950), Zhejiang Provincial Natural Science Foundation of China (No. LY12H15006), Zhejiang Provincial Medical and Healthy Science Foundation of China (No. 2013RCB004), and the American Heart Association (13BGIA14680069 for Shen XZ).
Disclosure Statement
No competing financial interests exist.