
Abstract
Human-induced pluripotent stem cell (hiPSC)-derived hepatocytes are anticipated as important surrogates for primary human hepatocytes in applications ranging from basic research to drug discovery and regenerative medicine. Although methods for differentiating hepatocyte-like cells (HLCs) from hiPSCs have developed remarkably, the limited yield of fully functional HLCs is still a major obstacle to their utility. A three-dimensional (3D) culture environment could improve the in vitro hepatic maturation of HLCs. Here we compare 3D hydrogel models of hiPSC-derived HLCs in agarose microwells (3D Petri Dish; 3DPD), nanofibrillar cellulose hydrogels (Growdex; 3DNFC), or animal extracellular matrix-based hydrogels (3D Matrigel; 3DMG). In all the tested 3D biomaterial systems, HLCs formed aggregates. In comparison with two-dimensional monolayer culture, 3DPD and 3DMG models showed both phenotypic and functional enhancement in HLCs over 2.5 weeks of 3D culture. Specifically, we found higher hepatocyte-specific gene expression levels and enhanced cytochrome P450 functions. Our work suggests that transferring HLCs into 3D hydrogel systems can expedite the hepatic maturation of HLCs irrespective of the biochemical nature of the 3D hydrogel. Both plant-based nonembedding and animal-based embedding 3D hydrogel models enhanced the maturation.
Introduction
L
Despite the effective differentiation protocols reported for hPSC-HLC production in vitro, the generated HLCs represent an immature fetal phenotype and can only be used in limited applications such as gene correction studies, modeling host interactions with hepatitis B and C viruses, and modeling certain inherited metabolic disorders, such as familial hypercholesterolemia.9–11 In general, the current hPSC-HLCs are not suitable for drug metabolism and excretion studies. The immature hepatocyte phenotype can be a result of low cellular polarization, which is especially important for metabolic functions of the hepatocytes. 12
There have been several approaches to establish liver structural characters into in vitro liver models. A promising approach is enhancement of culture dimensions. The importance of the three-dimensional (3D) architecture for maintaining hepatocyte phenotype, both in vivo and in vitro, has been shown.12–16 The 3D cell cultures can result in more mature phenotypes in both hepatoma and primary cells.17–19 Three-dimensional hanging-drop methods and biomaterial scaffolds and hydrogels allow formation of multicellular aggregates with improved viability and cellular polarization and enhanced secretion of urea, albumin, and bile acids.20–22 A limited number of studies have applied 3D techniques for hPSC-HLCs.13,14,23,24 Those studies utilized 3D hydrogel, 3D porous scaffold, cell sheet technology, bioreactor, or combinations of these techniques. All of the reported 3D models improved the hepatic differentiation from various cell types.13,16,23,25,26
Here, we compared the potential of three different types of 3D hydrogels, Matrigel (3DMG), agarose-patterned microcompartments (Petri Dish®, 3DPD), and nanofibrillar cellulose (3DNFC), on hPSC-HLC maturation with comparison to standard two-dimensional (2D) monolayer cultures. These 3D systems were selected due to the promising findings with hepatocytes or hepatoma cells. Furthermore, the hydrogels allow cell cultures without harsh treatments, such as exposure to toxic crosslinking agents, low pH, or high shear stress. Another selection criterion for the 3D hydrogels was that there is no need for special instruments for 3D cell cultures.
Matrigel is regularly used as a coating material in 2D hepatic differentiation from hPSCs,11,27–29 as in this study. It is an animal-derived extracellular matrix (ECM) hydrogel that contains a variety of ECM proteins.30,31 This ECM-rich hydrogel has enhanced the morphology of cells and their responses to xenobiotics, and it has maintained the mature phenotype of rat and human primary hepatocytes in vitro.32–36 In addition, it has been shown to support viability of hPSC-HLCs in 3D culture format together with fibroblasts.37,38
In contrast to adhesion signal-rich animal ECM, we investigated agarose-casted microcompartments with 400 and 800 μm of opening diameters. Microfabrication has proven to be an effective technique for spheroid formation with well-controlled size and geometry.39,40 Microcasted agarose hydrogels have been shown to promote self-assembly of rat hepatocytes and generation of complex cell structures. 40 Suitability of microcompartments in hiPSC hepatic maturation is still undefined. The third 3D hydrogel system in the study was nanofibrillar cellulose (3DNFC), which is a biochemically inert hydrogel formed of nanofibrillar network of anhydrated glucose unit chains. 41 3DNFC hydrogel has enhanced hepatic differentiation of HepaRG cells.21,42
In this study, we first differentiated hiPSCs to HLCs in 2D cultures, by adapting the existing differentiation strategies. 28 These differentiated cells were transferred in 3DMG, 3DPD, and 3DNFC hydrogels either by mixing or dispensing to form 3D liver models. We then characterized the performance of these models, in terms of hepatocyte phenotype by examining the expression of hepatocyte-related genes and proteins, albumin secretion, CYP enzyme activity, drug metabolism capacity, and bile canaliculi formation.
Materials and Methods
Ethical aspects
The generation of hiPSC line was approved by the Ethics Committees of the Helsinki and Uusimaa Hospital District.
Maintenance of cell lines and PHHs
The hiPSC line HEL47.2, generated in our laboratory from skin fibroblasts of a healthy male donor, 43 was cultured on Matrigel (BD Biosciences)-coated dishes in Essential 8 (E8) medium (Life Technologies) as described previously. 44 The culture medium was changed daily and the cells were passaged with EDTA (Life Technologies) once a week on fresh Matrigel.
Cryopreserved PHHs (HEP187; Biopredic International) were thawed and cultured for 2–3 days on collagen type I-coated 96-well plates, according to distributor's instructions. HepG2 line was cultured in 24-well plates as previously described. 45 All the cells in this study were cultured in +37°C in an atmosphere containing 5% CO2. Culture medium samples were collected and stored at −80°C until further analysis.
Hepatocyte differentiation protocols
2D Matrigel cultures
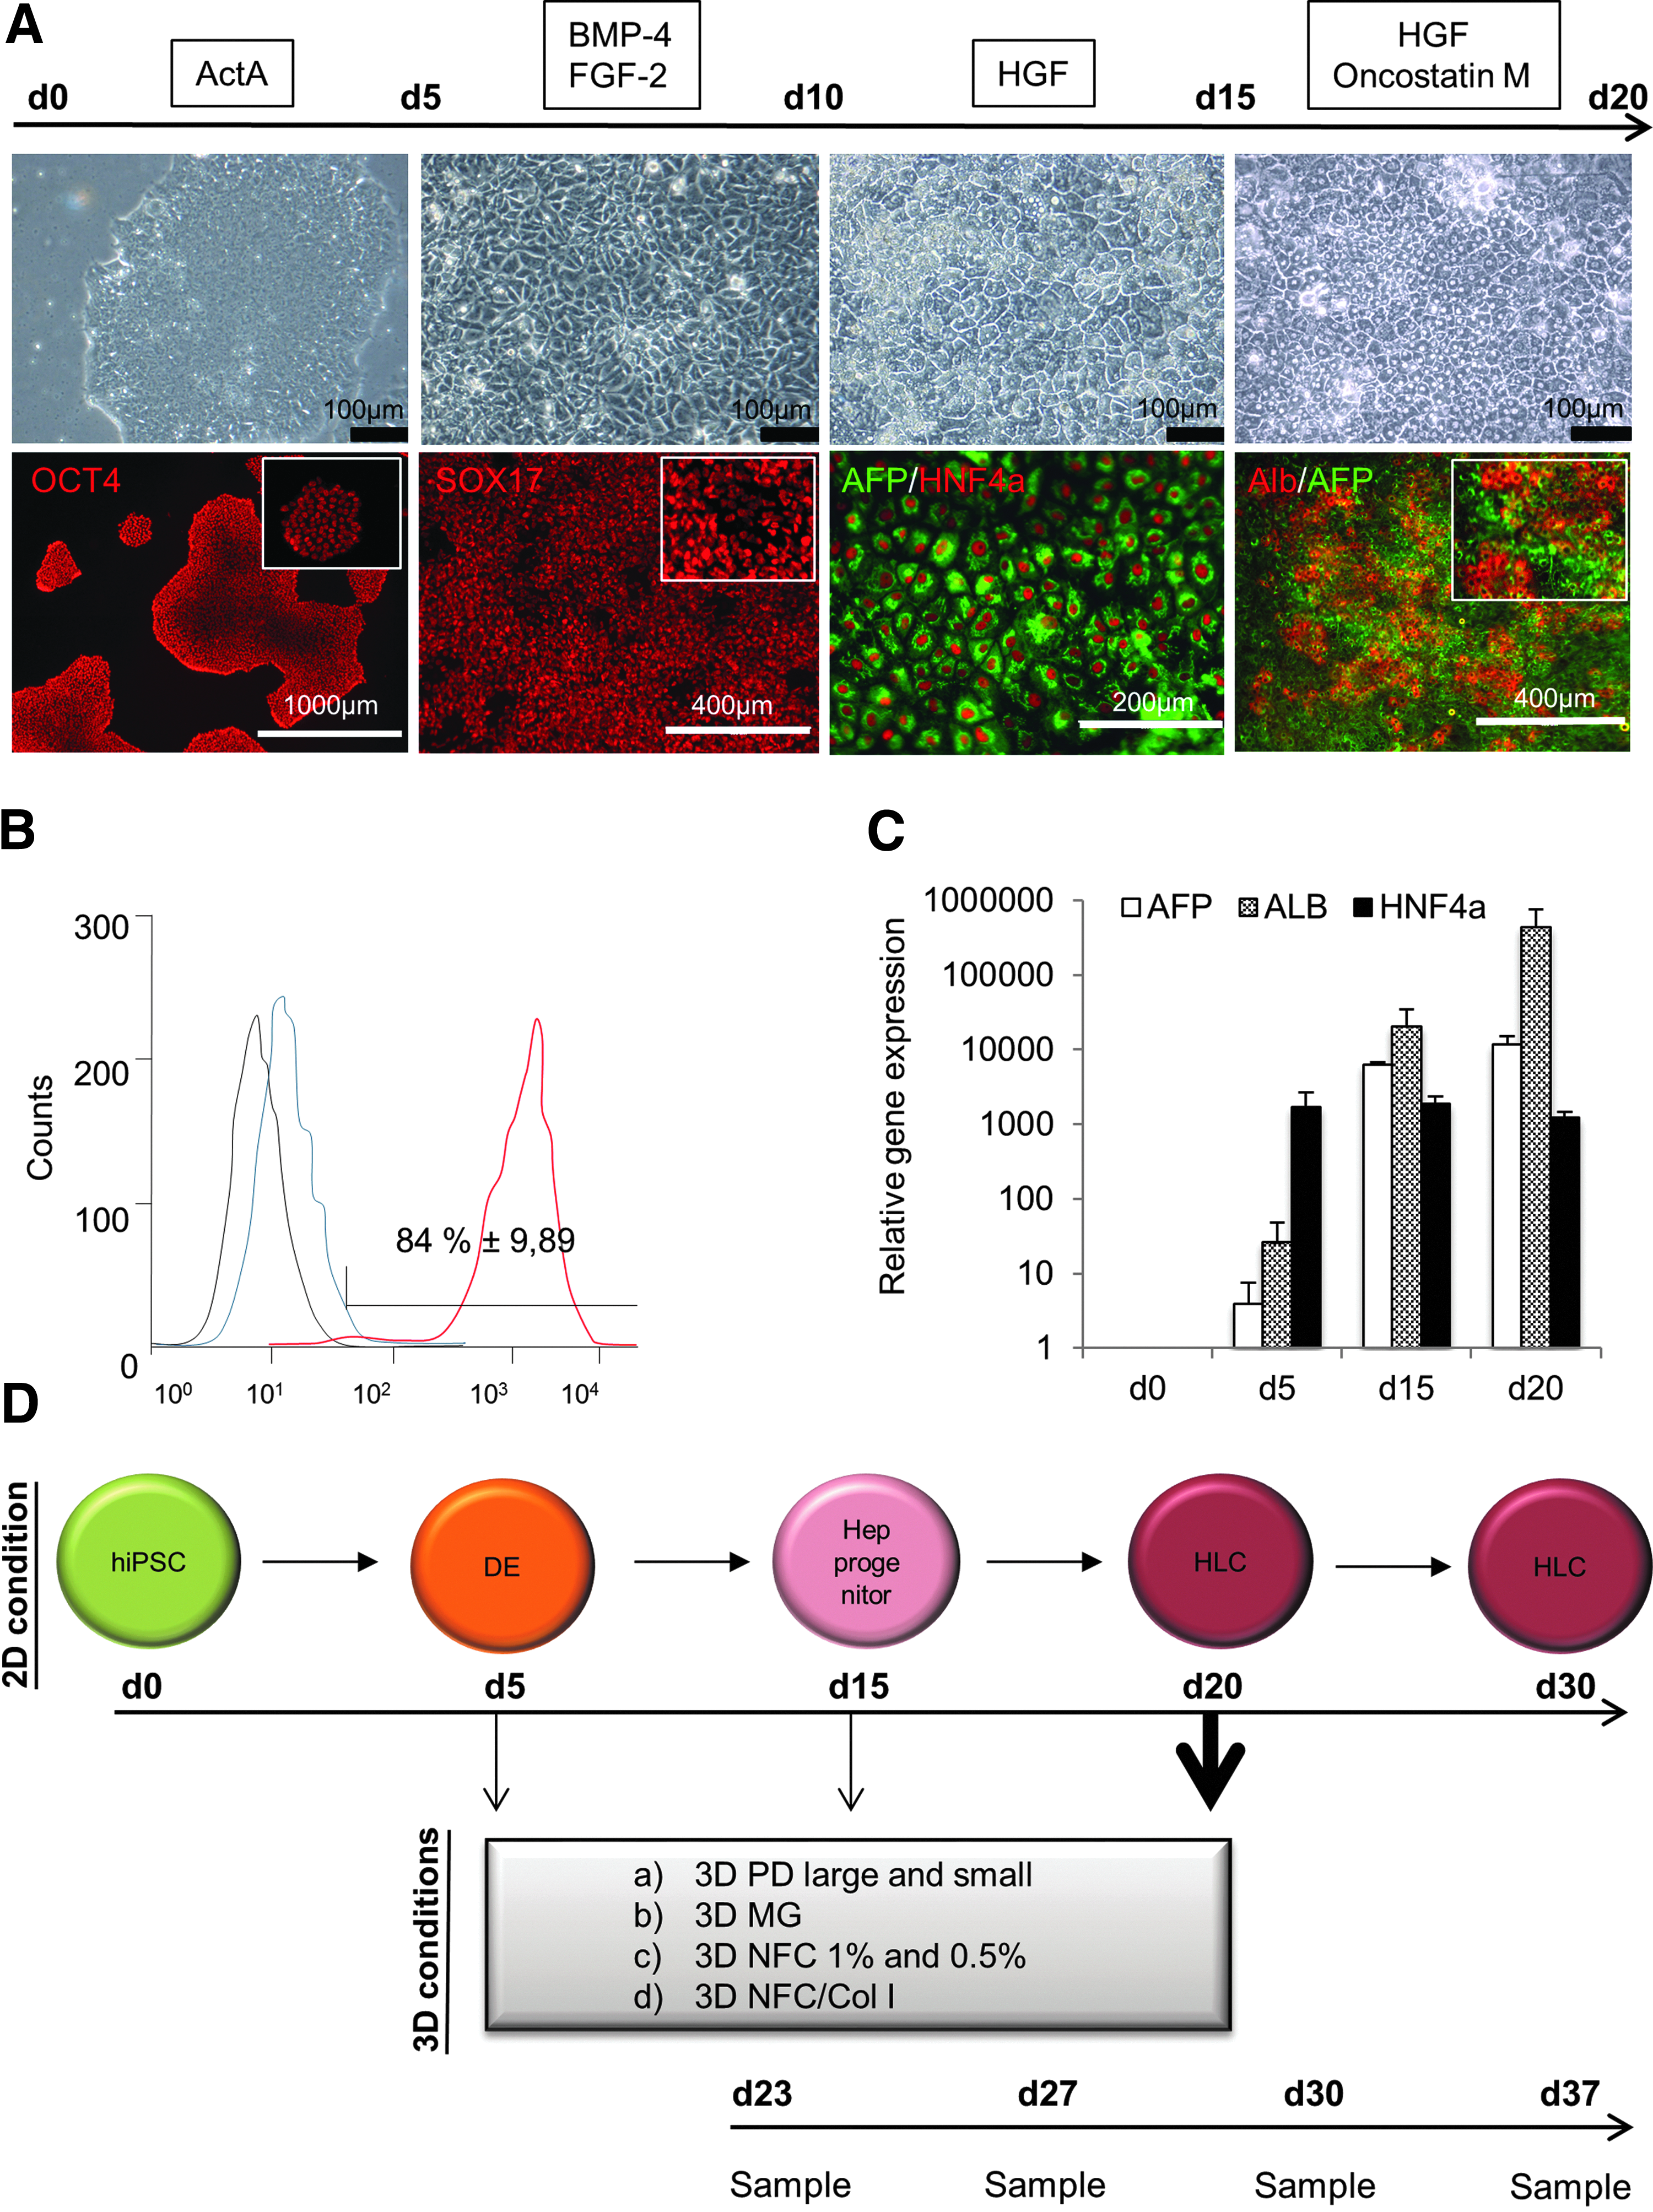
hiPSCs were cultured on Matrigel in E8 medium until they reached 80–90% confluence. The cells were washed twice with phosphate-buffered saline (PBS) and cultured for 24 h in RPMI-1640+glutamax medium supplemented with 2% of B27 (both from Life Technologies), 100 ng/mL Activin A (from Dr. Marko Hyvönen, University of Cambridge, UK), 3 μM CHIR99021 (Stemgent), and 1 mM sodium butyrate (Sigma-Aldrich). After 24 h from the onset of differentiation, sodium butyrate concentration was decreased to 0.5 mM and after 48 h, GSK-3β inhibitor CHIR99021 was removed from the medium. The cells were cultured in this medium for the following 3 days with a daily medium change. Differentiation from definitive endoderm (DE) stage cells into hepatocyte progenitors was performed essentially as described previously. 28 In brief, the DE cells were washed with PBS and cultured for 5 days in RPMI-1640+glutamax medium supplemented with 2% B27, 10 ng/mL FGF2, and 20 ng/mL BMP4 (both from Peprotech). Subsequent five days the cells were cultured in RPMI1640+Glutamax medium supplemented with 2% B27 and 20 ng/mL hepatocyte growth factor (HGF; Peprotech). For hepatocyte maturation, the cells were washed with PBS and cultured for 5 days in HCM™ SingleQuots® without epidermal growth factor 46 and gentamicin–amphotericin mixture (Lonza)-supplemented 50 ng/mL HGF (Peprotech) and 20 ng/mL Oncostatin M (Peprotech). The culture medium was changed daily throughout the differentiation. After 5, 10, or 20 days of differentiation, the cell cultures were either continued or hiPSC-Hep cells were detached with Gentle Cell Dissociation Reagent (STEMCELL Technologies, Inc.) for 20 min incubation at +37°C and transferred either onto fresh 2D Matrigel or 3D culture systems as described hereunder and cultured in selected materials until day 30 or day 37.
3D Matrigel cultures
After 5, 10, or 20 days of 2D differentiation, 3DMG cultures were formed by mixing 200,000 cells within 200 μL of ice-cold Matrigel, which was dispensed into 50 μL droplets in 48-well plates (one drop/well). Cell–Matrigel droplets were let to solidify at +37°C for 30 min, after which 400 μL of culture medium was added in the wells. Composition of the medium was determined by the differentiation phase at the seeding date (Fig. 1). The culture medium was replaced every third day and medium samples were collected and stored at −80°C until further analysis.
3DNFC hydrogel cultures
After 5, 10, or 20 days of 2D differentiation, the hiPS-derived cells were seeded in NFC hydrogel (Growdex®; UPM Biochemicals) to establish 3D culture environment (Fig. 1). Cell suspension (3.1 × 10⁶ cells/mL) was mixed with 1.47% (w/v) NFC hydrogel to achieve 1% (w/v) hydrogels with desired cell density (106 cell/mL hydrogel). The mixing and dispensing of 65 μL NFC–cell mixture into ultra-low attachment 96-well plates (Corning) were done with a Finnpipette stepper pipette (Thermo Fischer Scientific). After 30 min incubation at +37°C, 100 μL culture medium was added to the top of the hydrogel. The composition of the medium was dictated by the differentiation phase at the seeding date (Fig. 1).
NFC–collagen hydrogel cultures were established by adding collagen solution to ice-cold NFC hydrogel. Shortly, ice-cold 10× PBS, 1 N sodium hydroxide, sterile water, and collagen type I stock solution (354236; BD Biosciences) were mixed in a tube on ice by following the manufacturer's instructions. Then ice-cold NFC hydrogel and cell suspension (3.1 × 10⁶ cells/mL) were mixed with the collagen solution by pipetting up and down with a Finnpipette stepper pipette to achieve hydrogels of 1% (w/v) NCF, 1 mg/mL collagen, and 106 cells/mL. A total of 65 μL of the mixture were distributed into the ultra-low attachment 96-well plates and incubated for 30 min at +37°C. After gelification, 100 μL of culture medium was dispensed into each well. The composition of the medium was determined by the differentiation phase at the seeding date (Fig. 1). The culture medium was replaced every third day (2/3 of the medium volume), and medium samples were collected and stored at −80°C until further analysis.
3D agarose-patterned microwell cultures
Microwells were formed by distributing 330 μL of warm, sterile agarose solution (1 g of agarose in 50 mL of 0.9% NaCl) into the micromolds (3DPD; Microtissues, Inc., Sigma-Aldrich). Both small spheroids molds (96 microwells, diameter of 1 well is ∼400 μm) and large spheroids molds (35 microwells, diameter of 1 well is ∼800 μm) were used in this study. After gel formation, the microwell casts were placed into a well of a 24-well plate, and 500 μL of PBS was added into the wells. The plates were stored at +4°C until cell seeding.
At hiPSC differentiation days 5, 10, and 20, the cells were detached (see 3D Matrigel Cultures section) and seeded into the cell-seeding chamber of the microwell casts (Fig. 1). A total of 75 μL of cell suspension (0.5 million cells/mL) were pipetted into the 3DPD. Cell suspension was allowed to settle into the microwells for 15–30 min at +37°C before 500 μL of medium was carefully added to the wells. The composition of the medium was determined by the differentiation phase at the seeding date (Fig. 1). The culture medium was replaced every second day and medium samples were collected and stored at −80°C until further analysis.
Quantitative polymerase chain reaction analysis
Total RNA was extracted using NucleoSpin RNA II kit (Macherey-Nagel) according to manufacturer's instructions with separate DNase treatment. After DNase treatment, isolated RNA was cleaned using NucleoSpin RNA Clean-up kit (Macherey-Nagel). RNA samples were reverse transcribed into cDNA by M-MLV Reverse Transcriptase in Real Time reaction containing Oligo(dT)15 primers, random hexamers, dNTPs, and rRNAsin (all from Promega). The amplification reactions, run in duplicates, contained 4 μL 5× HOT FIREPol EvaGreen® qPCR Mix (Solis BioDyne), 10 μL nuclease-free water, and 1 μL RT reaction as a cDNA template. The reactions for the quantitative polymerase chain reaction (qPCR) were prepared with a Corbett CAS-1200 liquid handling system and the qPCR was performed using Corbett Rotor-Gene 6000 (Corbett Life Science). Relative quantification of gene expression was performed following the ΔΔCt method 47 with housekeeping gene Cyclophilin G as endogenous control. Data were plotted as fold change to the corresponding gene expression in HepG2 cells set as 1. Primer sequences used are listed in Supplementary Table S1 (Supplementary Data are available online at www.liebertpub.com/tea).
Immunocytochemical analysis
Cells growing in 2D conditions were fixed with 4% paraformaldehyde (PFA) (20 min, RT), washed with PBS and permeabilized (0.1% Triton X-100, 10 min), followed by several PBS washes. Samples were blocked with Large Ultravision V Block (Thermo Fischer Scientific) for 8 min. Samples were incubated with primary antibodies diluted in 0.1% Tween in PBS at +4°C overnight and were washed with PBS. Secondary antibodies were diluted in 0.1% Tween in PBS (1:500) and introduced to the samples (45 min, RT) followed by several washes with PBS. Primary and secondary antibodies used are listed in Supplementary Table S2. Stainings were mounted in Vectashield mounting medium for fluorescence with DAPI (Vector Laboratories, Inc.).
Cell cultures in 3DMG or in 3DPD were pelleted in PBS and fixed with 4% PFA. The fixed cell aggregates were embedded in a small amount of 2% of agarose gel to enable dehydration procedure before embedding in paraffin. The processing was done as reported previously. 42 In brief, the samples were passed through increasing alcohol concentrations followed by xylene treatment and embedding in hot paraffin. Paraffin blocks were processed and cut into 4 μm sections on glass slides. Deparaffinized and rehydrated sections were microwaved in 1 mM EDTA first for 3 min at 900 W and then 5 min at 300 W. Cooled sections were blocked with Ultra V Block before incubating overnight at +4°C with primary antibodies (Supplementary Table S2). After incubation with primary antibodies, sections were washed and subsequently incubated with secondary antibodies for 30 min followed by several PBS washes. Fluorescent-labeled samples were protected with Vectashield mounting medium with DAPI.
Microscopy analysis of cell architecture and growth
Cell cultures were monitored and imaged by phase contrast microscopy (Leica DM IL LED). The average diameter of spheroids was defined from the phase contrast images with LAS EZ software (Leica Microsystems) using the distance line facility. A minimum of 10 spheroids from at least 3 independent experiments were measured to attain the average size and SEM.
Cell viability
Cell viability was analyzed using LIVE/DEAD
DNA quantification
For genomic DNA (gDNA) measurements, aliquots of cell lysates (in RA1 buffer; Macherey-Nagel) were diluted in ultrapure water (1:400) and treated with a fluorescent DNA-binding dye (Quant-iT PicoGreen dsDNA assay kit; Life Technologies) as previously published. 42 The fluorescent intensity was measured using FLUOstar Omega microplate reader (excitation and emission wavelengths were set at 485 nm and 520 nm, respectively) and converted to DNA concentration by a standard curve for lambda DNA with concentrations ranging from 1 to 500 ng/mL. The cell proliferation at HLC stage was calculated by normalizing the gDNA content of each sample to the corresponding gDNA content on day 23.
Albumin secretion
The functionality of HLCs was characterized by following albumin secretion in medium. Media from differentiation cultures were collected at days 23, 27, and 30 and stored at −20°C until assayed. The concentration of secreted human albumin was determined using the human albumin ELISA quantitation kit (Bethyl Laboratory), according to the manufacturer's instructions. Each sample was measured in duplicate and diluted (1:1–1:30) to fit into the standard curve. The plate was read at 450 nm using a SpectraMax 190 Absorbance Microplate Reader (Molecular Devices, LLC). The difference in number of cells between culture systems was normalized to the amount of gDNA in the corresponding sample, and the difference in culture medium renewal between culture systems was considered by calculating the albumin amount per day.
Drug metabolism activities
Drug metabolism activity of HLCs was analyzed at day 27 of differentiation, PHHs at day 3 of cultures, and HepG2 cells at day 4 when the cultures reached 80% confluence. After medium removal, the cultures were washed with 1 × PBS followed by subsequent addition of specific CYP substrates: 5 μM midazolam (CYP3A4), 20 μM melatonin (CYP1A2), 100 μM bupropion (CYP2B6), 20 μM diclofenac (CYP2C9), and 10 μM dextromethorphan (CYP2D6). 48 The 3DPD microwell cultures (10 wells pooled) were transferred to 15 mL conical tubes to enable the analysis practice. Substrate solutions (in dimethyl sulfoxide) were diluted 1:1000 in HBSS–HEPES buffer for 2D cultures and 3DPD cultures, and 1:600 for the 3DMG cultures, to achieve the desired final concentrations by considering the dilution effect of the 3DMG hydrogels. To ensure proper mixing of drugs into the culture, the plates/tubes were shaken gently (150 rpm; Celltron, Infors AG) during the incubation at +37°C. After 60 min incubation, a metabolite sample from each culture system was collected into a 1.5 mL tube by pooling the supernatant from 10 wells of 3DPD HLCs in 24-well plates (pooled already before substrate dosing), 6 wells of 3DMG HLCs in 48-well plates, 2 wells of HepG2 in 24-well plates, and 8 wells of PHHs in a 96-well plate. The 2D HLC cultures in 12-well plates were not pooled. This way, each sample represented the activity of ≥300,000 cells. The supernatant samples were mixed with ice-cold acetonitrile and stored at −80°C until analyzed. The samples were thawed at room temperature, centrifuged, and transferred to 96-well plates (Agilent Technologies) for LC/MS-MS analysis. Standard and quality control (QC) samples were prepared in the incubation buffer within range of 0.0625–4000 nM (standards) and 1–2000 nM (QC). The amount of specific metabolites 6-hydroxymelatonin (CYP1A2), (2S,3S)-hydroxybupropion (CYP2B6), 4-hydroxydiclofenac (CYP2C9), dextromethorphan (CYP2D6), and 1-hydroxymidazolam (CYP3A4) formed was quantitated using an Agilent 1200 Series Rapid Resolution LC System together with an Agilent 6410 Triple Quadrupole Mass Spectrometer (Agilent Technologies) as previously described. 49 The activity was normalized to the gDNA content of each sample, and to the activity of PHH cultures.
The activity of CYP3A4 was studied with P450-Glo™, CYP3A4, assay (Promega) containing luciferin isopropryl acetate (luciferin IPA) as previously described. 42 In short, the cell cultures were exposed in 3 μM luciferin in IPA for 60 min at +37°C in 5% CO2 and the luminescence was recorded with a plate reader. The luminescence intensity and hereby the CYP3A4 activity were normalized to the gDNA content of each culture. Then the activity of HLCs and HepG2 (luminescence/gDNA) was compared with the activity of PHH cultures (luminescence/gDNA), which was set to 100%.
Functional bile canaliculi formation
The formation of functional bile canaliculi structures was investigated with fluorescein diacetate, a marker of canalicular efflux transport in hepatocytes as previously described. 42 In brief, the cell cultures were exposed to fluorescein diacetate for 5 min, washed with HBSS buffer, and treated with cell-permeable DNA probe Draq5™ (Biostatus Limited). The localization of fluorescent signals was observed with a Leica confocal microscope. In addition, a component of live/dead kit, calcein-AM, functioned as a second efflux transporter marker. Bile canaliculi were further confirmed with actin filament staining with phalloidin-alexa 594 as described earlier. 42
Statistical analysis
Statistical testing between different culture environments was done using GraphPad Prism software and Šidák's multiple comparison test as a follow-up to one-way ANOVA. Significance is * < 0.05, ** < 0.01, and *** < 0.001. All the data are reported as mean ± SEM.
Results
Hepatocyte differentiation from hiPSCs in 2D cultures
The standard 20-day differentiation protocol on 2D Matrigel was done as described earlier (Fig. 1A). 28 At the DE stage (day 5), 74% ± 5% of the cells were positive for C-X-C chemokine receptor type 4 (CXCR4), a cell surface protein highly expressed in DE cells (Fig. 1B). Immunocytochemical analysis revealed nearly 100% SOX17 positivity at day 5 of differentiation, further confirming the efficiency of the DE induction step (Fig. 1A). Between the days 10 and 15, the cells started to express alphafetoprotein (AFP) and hepatocyte nuclear factor 4 alpha (HNF4α) proteins, indicating hepatic commitment (Fig. 1A). After 20 days of differentiation, the cells were strongly positive for albumin, a hepatocyte marker. However, AFP-positive cells were still abundant, suggesting immature hepatic phenotype (Fig. 1A). HNF4a mRNA expression was fairly consistent over the differentiation process from days 5 to 20. AFP and albumin mRNA levels were constantly increasing during the differentiation (Fig. 1C) in accordance with the immunocytochemical results (Fig. 1A).
Cell viability and spheroid formation in 3D cultures
After 20 days of 2D differentiation, the HLCs were transferred into 3D hydrogel models. Transfer of the cells to fresh 2D Matrigel was also tested. HLCs seeded in 3DPD and 3DMG formed spherical aggregates with smooth surface (Fig. 2A, B), whereas the aggregates formed in 3DNFC were heterogeneous in structure (Fig. 2C). The spheroids in 3DPD were significantly larger than the spheroidsin 3DMG or in 3DNFC at all time points (Fig. 2D), and they increased in size during the whole culture time.
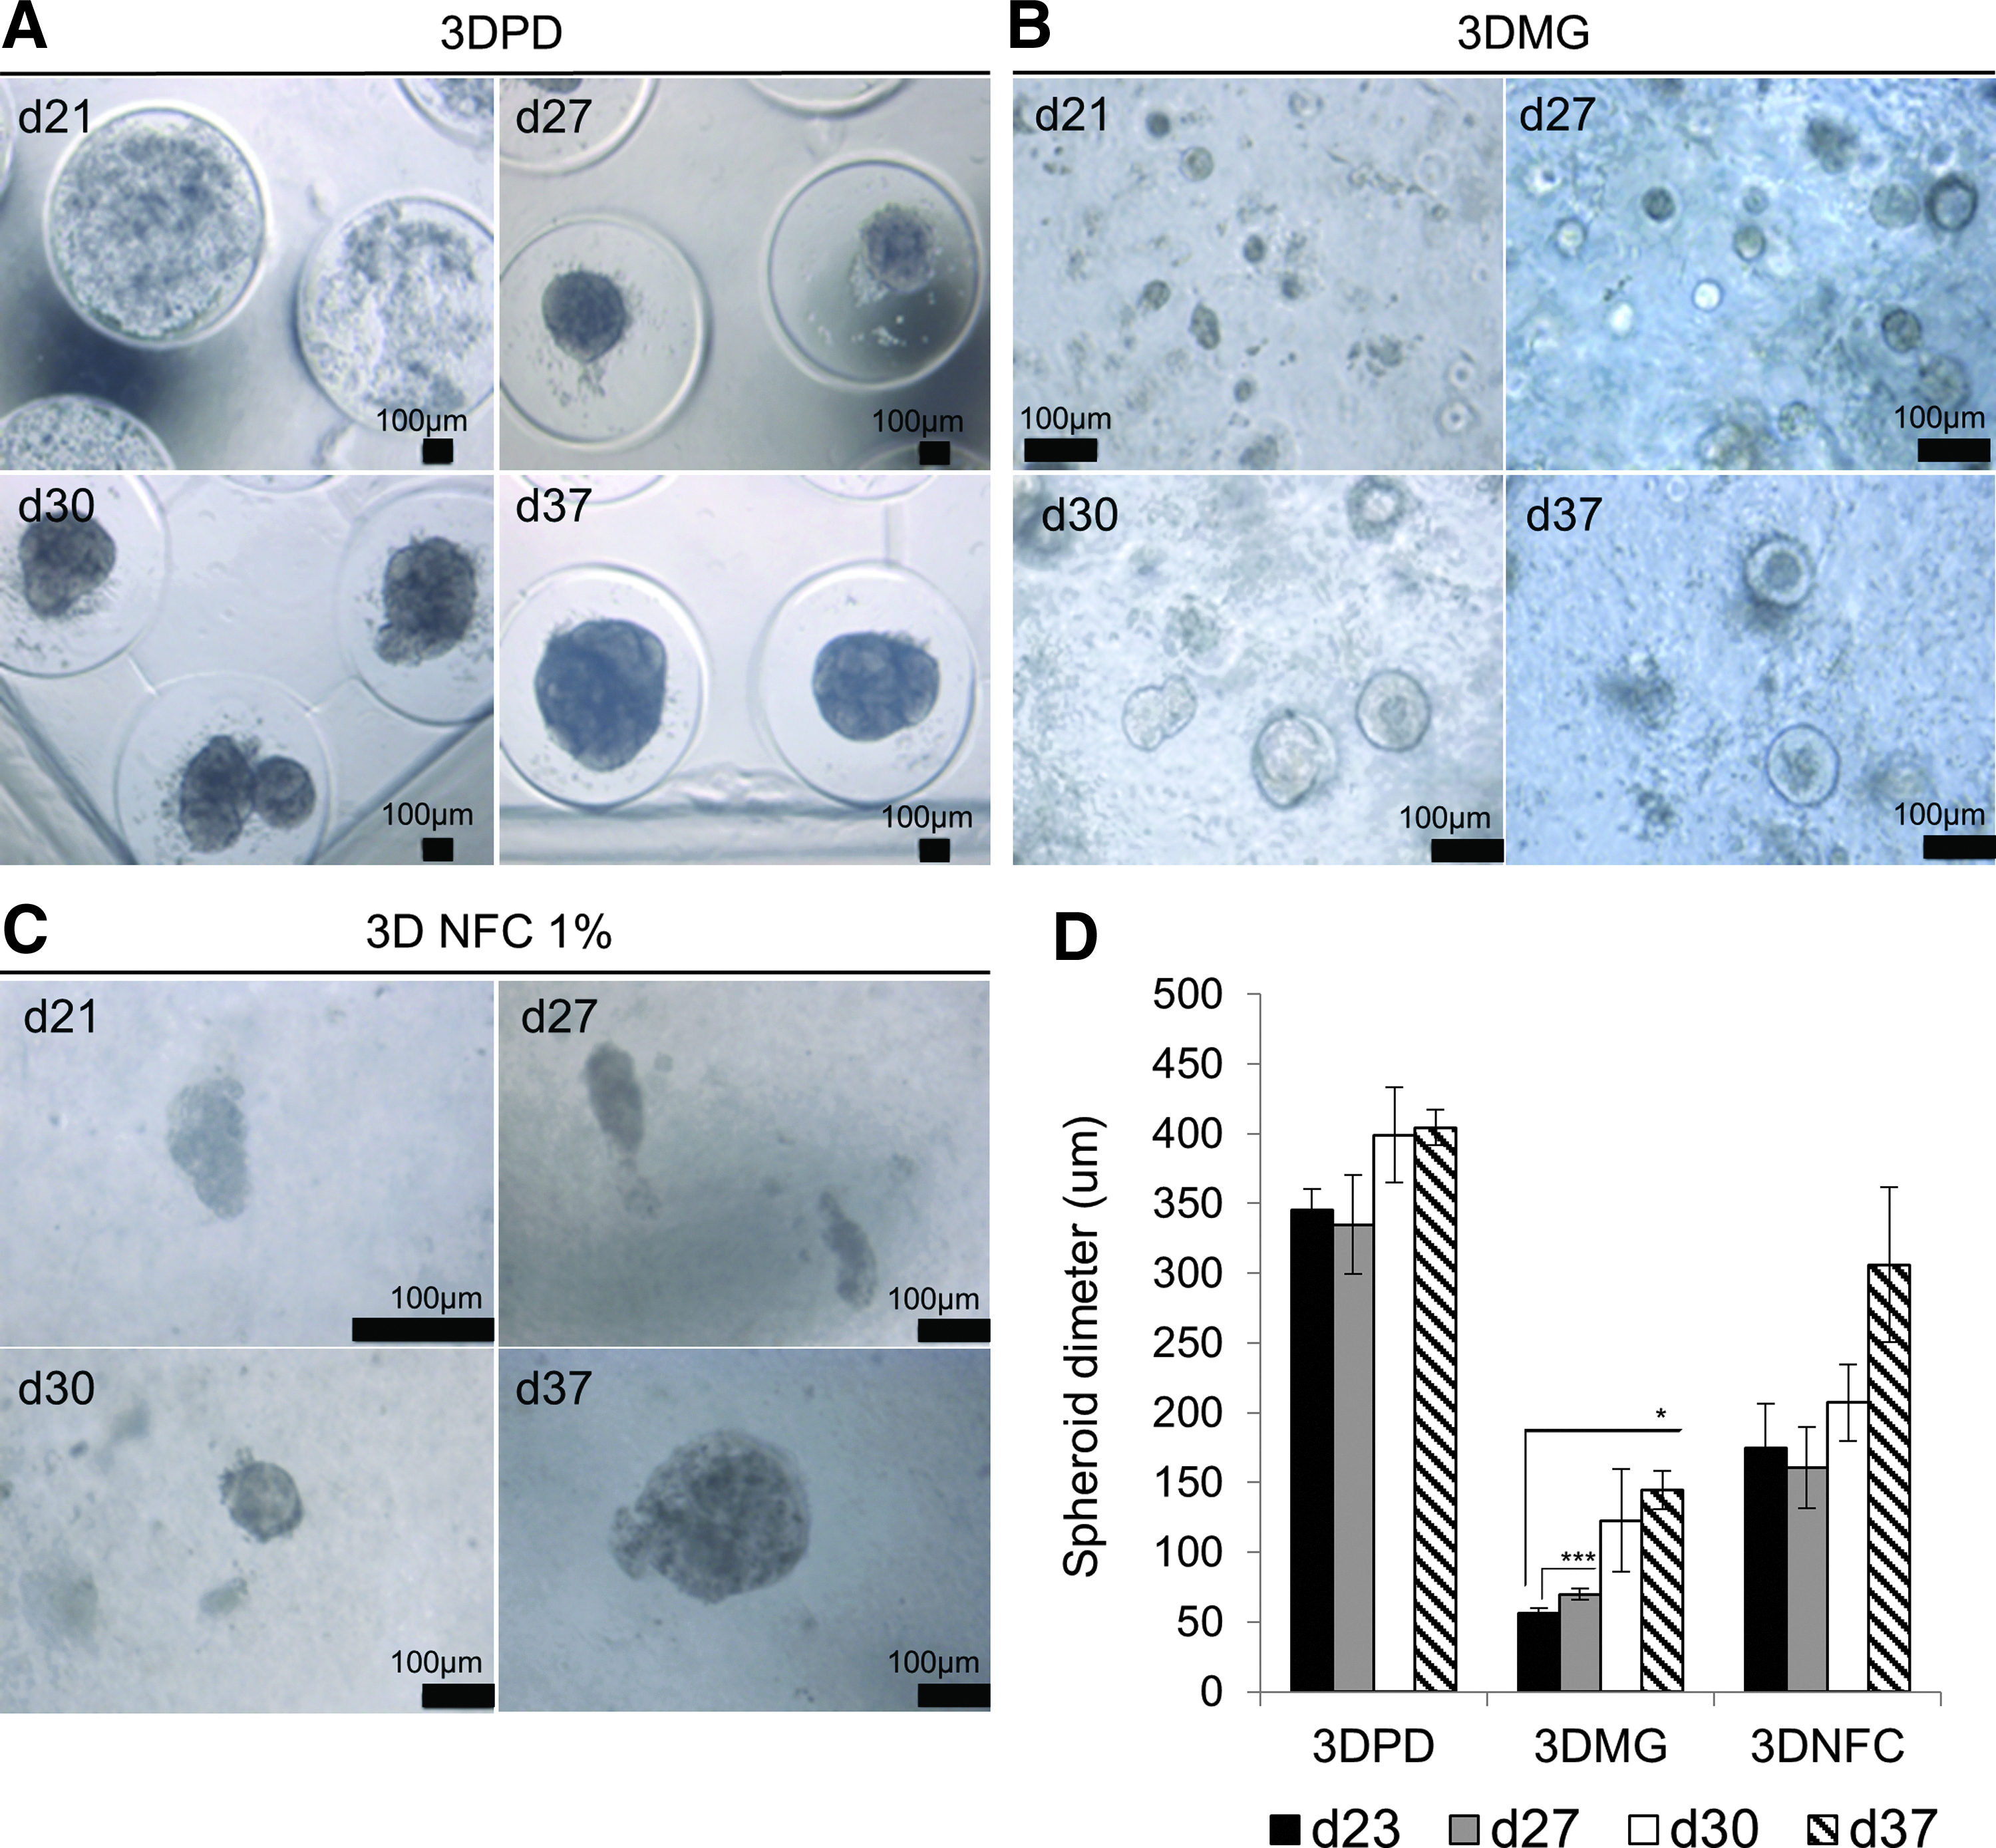
Cellular architecture in the 3D hydrogel models. Phase contrast images of the cells in
The cells did not form spheroids and/or did not proliferate in the other tested conditions: “small spheroids” agarose microcompartments with wells of 400 μm diameter (3DPD small), 1% 3DNFC mixed with type I collagen (3DNFC 1%-Col I), and 0.5% 3DNFC (Supplementary Fig. S1). In addition, we studied the effect of cell differentiation stage on the cell proliferation and aggregation in 3D hydrogel models. The differentiated cells were transferred from 2D to 3D models at days 5, 10, and 20. Transfer at earlier phase of differentiation (days 5 and 10) did not support cell proliferation at HLC stage in the 3DMG and 3DPD based on microscopy (data not shown) and quantification of gDNA (Supplementary Fig. S2).
Live/dead assay was conducted on culture day 30 to confirm the viability of the cells in the hydrogels (Fig. 3A). The cells showed high viability in all the hydrogels. The single cells, which were not in the aggregates, were dead. The cell mass increased significantly over culture in 3DMG and 3DPD as measured by gDNA content (Fig. 3B). Transfer of the cells on 2D hydrogel made the cells to proliferate at first, but they started to loose viability after 27 days as judged from decreasing amounts of gDNA. This suggests that the 3D format supports cell survival at this stage (Fig. 3B). Cell proliferation in 3DPD and 3DMG systems was confirmed with the increase of spheroid diameter (Fig. 2D). Both gDNA content and spheroid diameter increased between days 27 and 30 (Figs. 2D and 3B). Only the change in gDNA was statistically significant, but it should be noticed that even a small increase in spheroid diameter results in a marked increase in spheroid volume due to the spherical geometry of the aggregates (V = 4πr3).
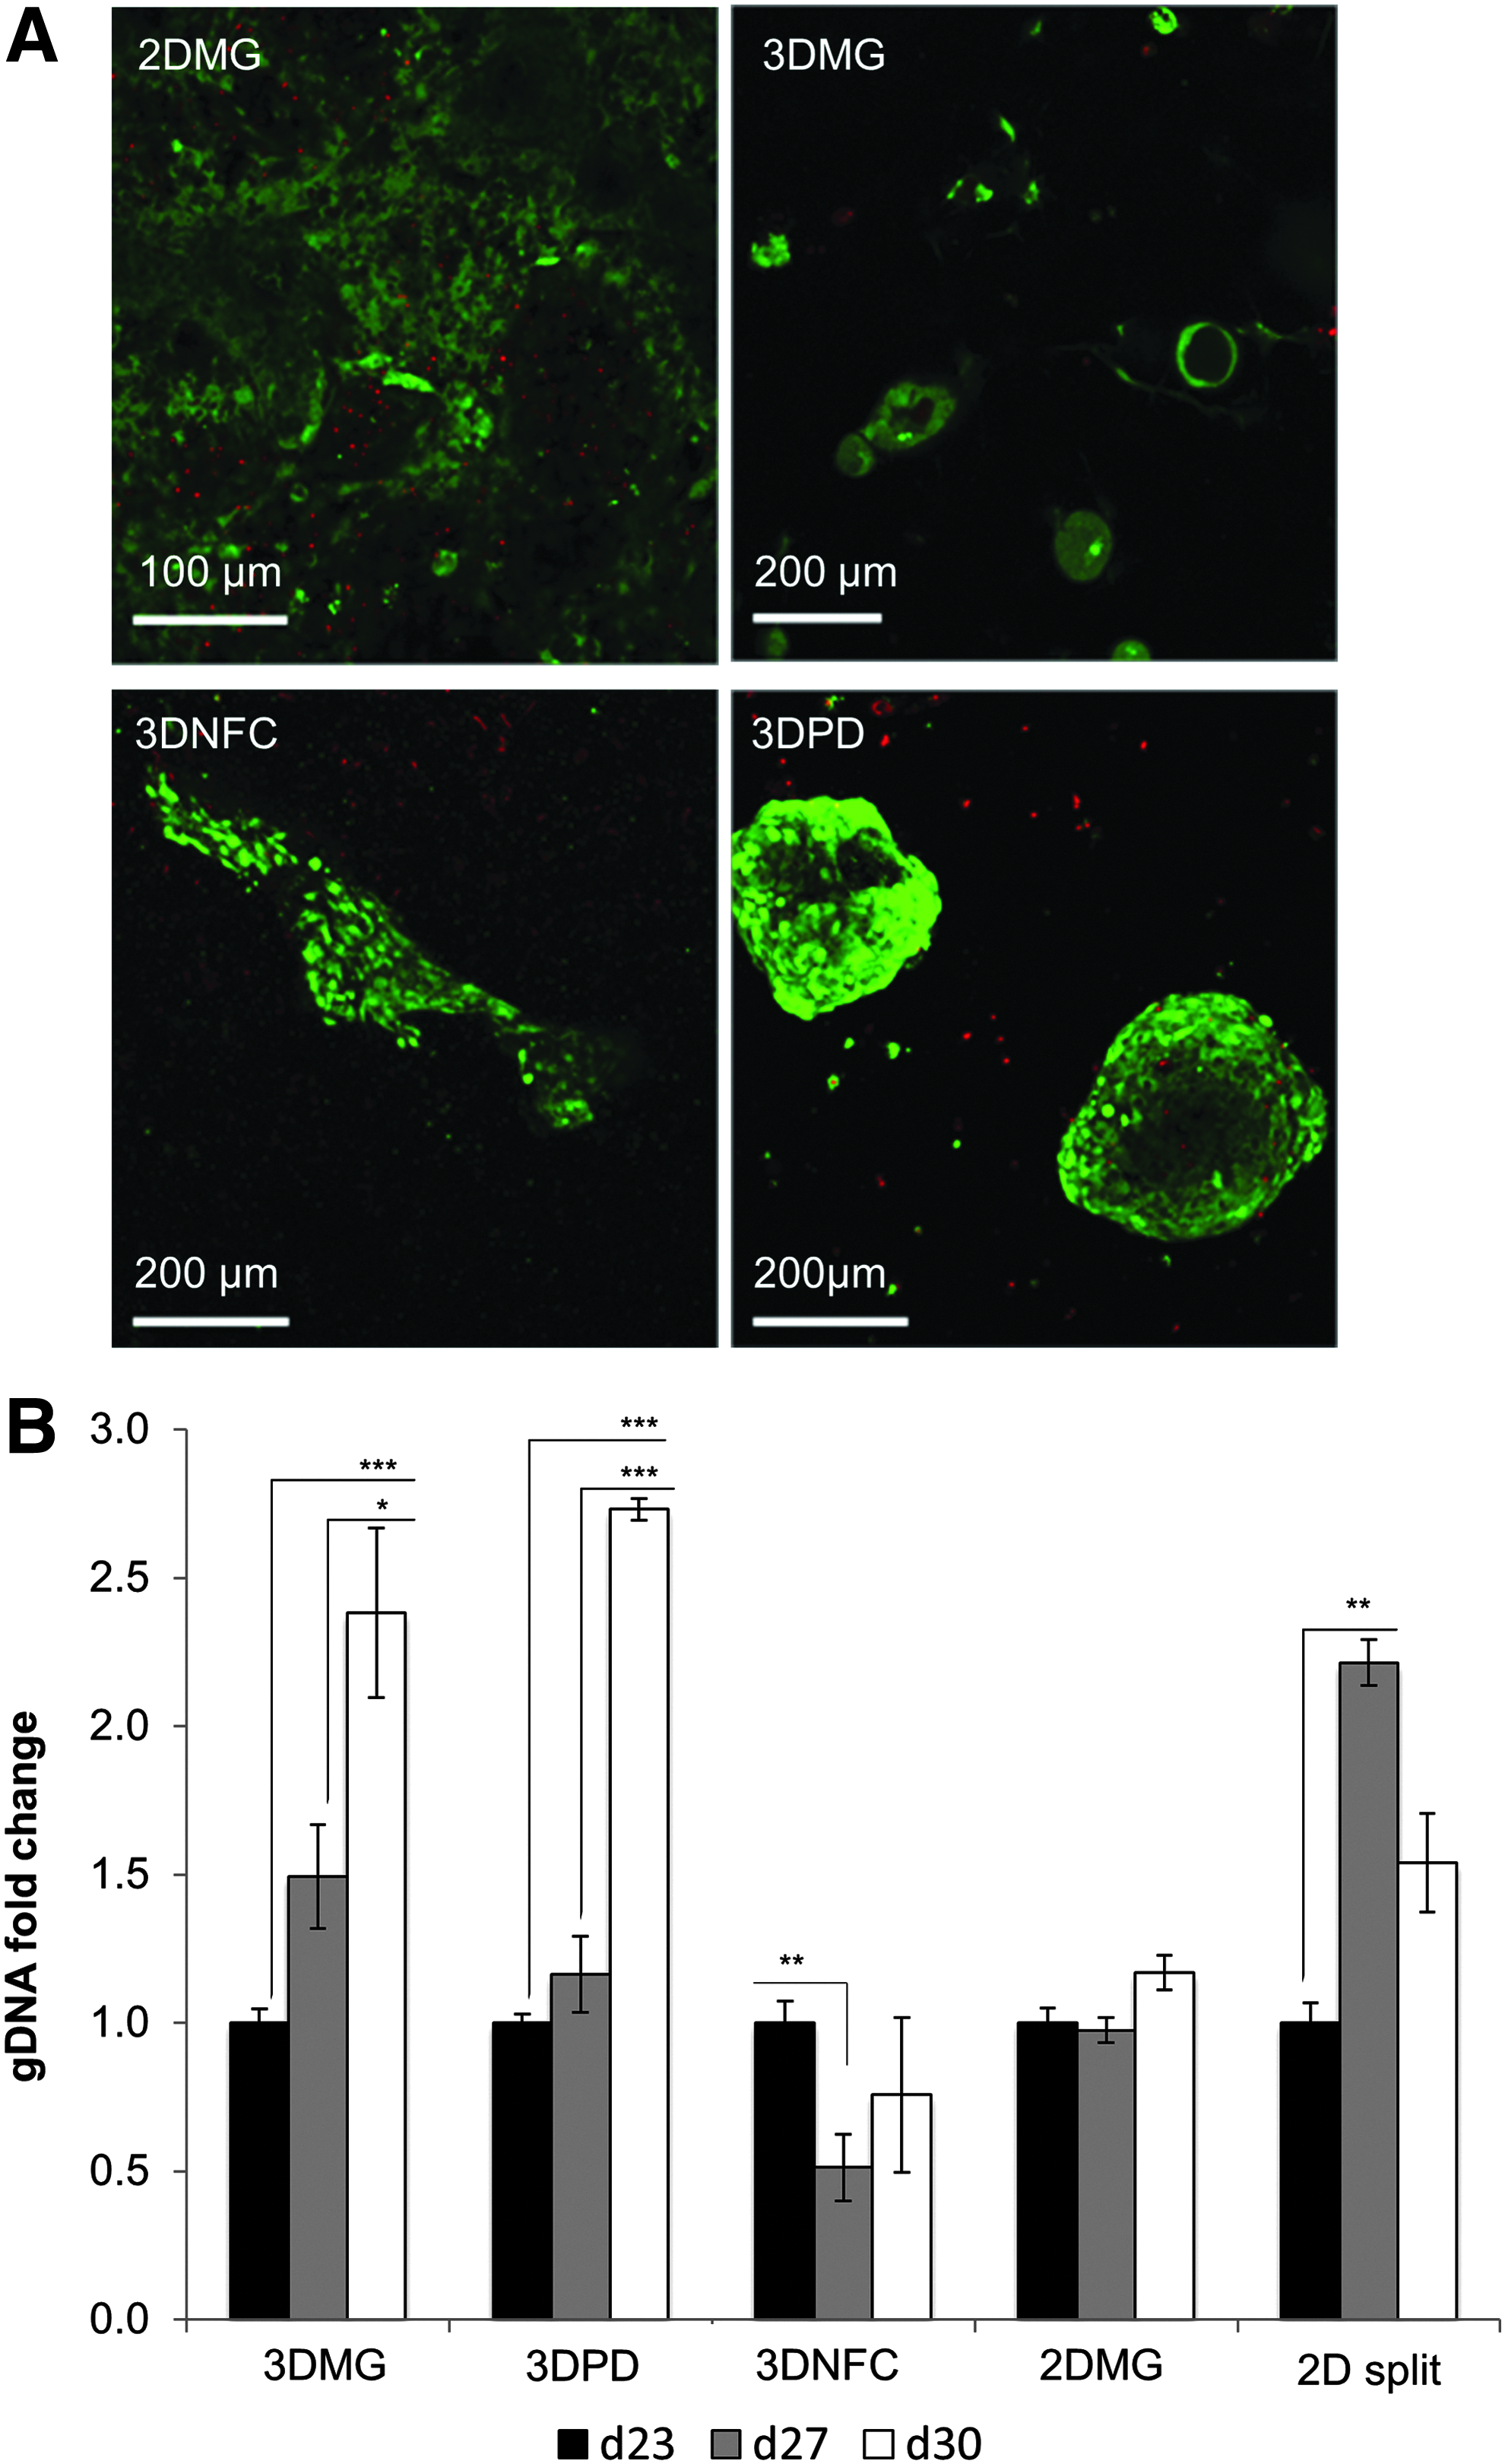
Viability and proliferation of the cells in different 2D and 3D models.
Ki-67 immunostaining further confirmed the higher presence of proliferating cells in the 3D cultures than in the 2D cultures (Fig. 4).
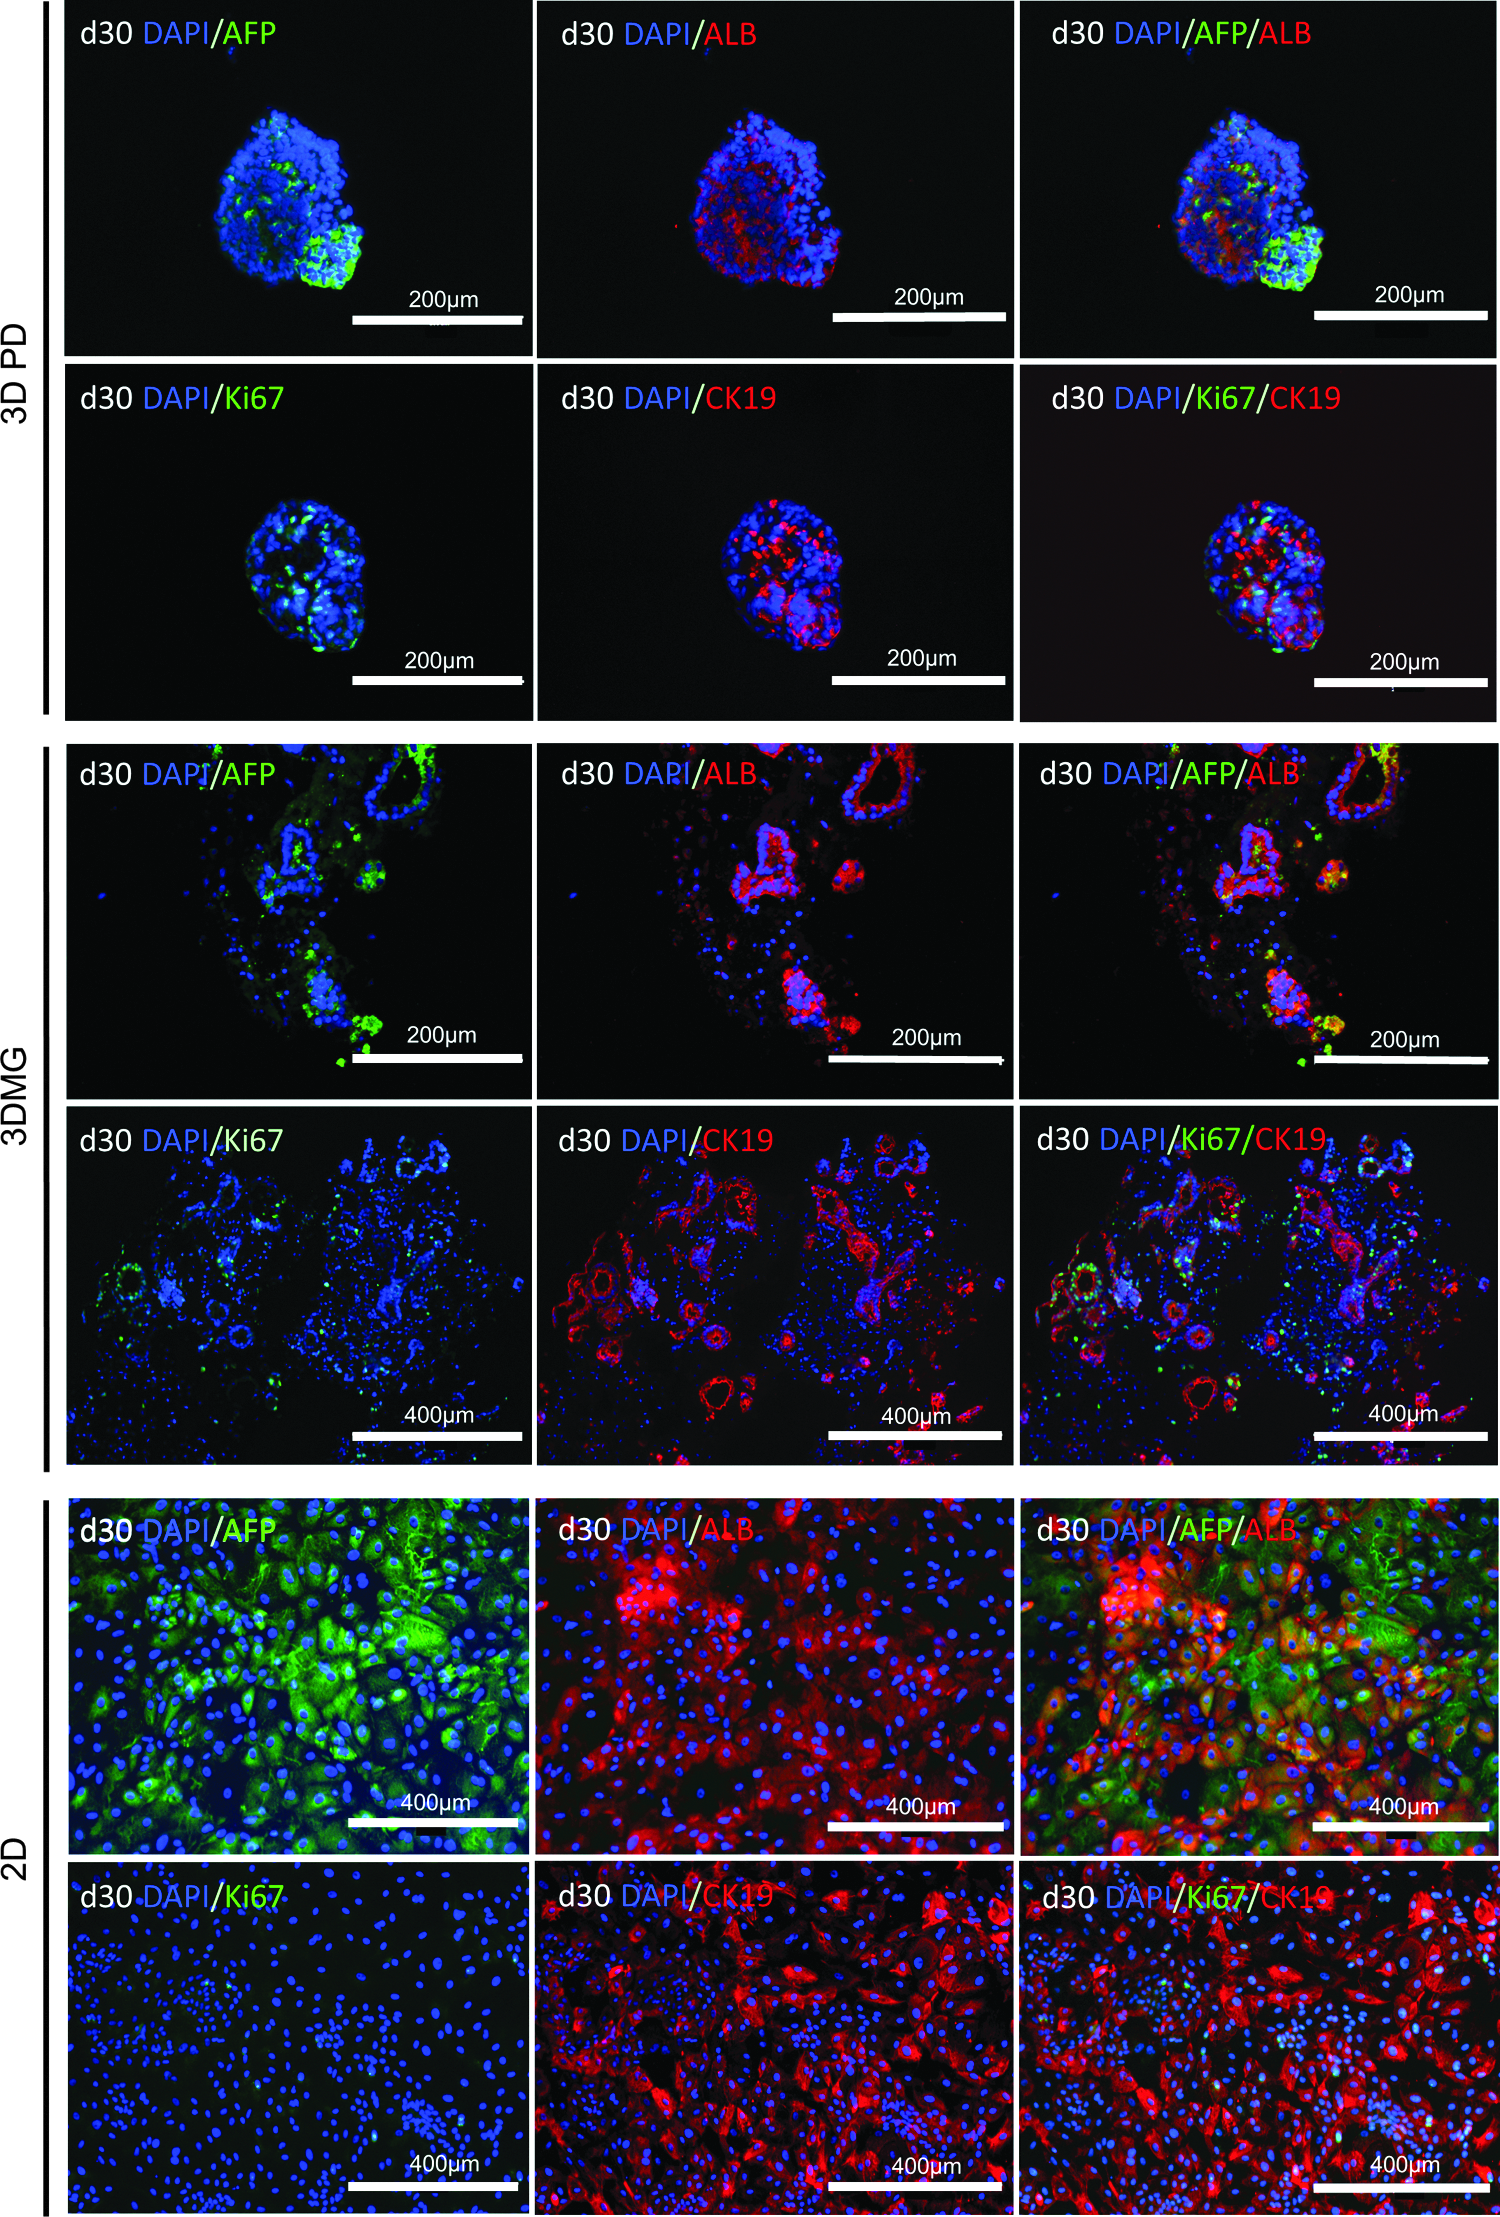
Immunocytochemistry of HLCs after 30 culture days. Albumin (ALB), AFP, HNF4a, and cytokeratin-19 (CK19) are hepatocyte markers. Ki-67 indicates proliferating cells. Scale bars are 200 μM. Color images available online at www.liebertpub.com/tea
The high viability, capability to proliferate, spheroid formation, and relatively homogeneous spheroid sizes encouraged us to continue the studies with 3DMG and 3DPD systems and transfer the cells from 2D to 3D hydrogel models at differentiation day 20.
Expression of hepatic markers in 2D- and 3D-cultured HLCs
To investigate whether or not 3D hydrogel models could promote hepatocyte maturation of the hPSC-HLCs, gene expression of the 3D HLCs was compared with those of the 2D-cultured HLCs. The mRNA levels were normalized against the levels in HepG2 cells (Fig. 5). The gene expression levels of AFP were significantly decreased when the cells were transferred from 2D to the 3D hydrogels. Monolayer cultures did not reach similar low AFP levels until day 30. Immunocytochemistry confirmed the presence of AFP at day 30 (Fig. 4). Albumin gene expression was highly variable between independent experiments. The highest levels were measured in 3DMG and 2D cultures. The low albumin levels of 3DPD cultures somewhat increased toward the end of the culture time. Immunocytochemistry at day 30 showed identical results, revealing stronger albumin staining in 3DMG and 2D models than in 3DPD (Fig. 4). HNF4a expression was higher in the 3D hydrogel models than in 2D monolayers. At day 37 of differentiation, HNF4a expression peaked and was significantly higher in 3DMG and 3DPD environments than in 2D (Fig. 5).
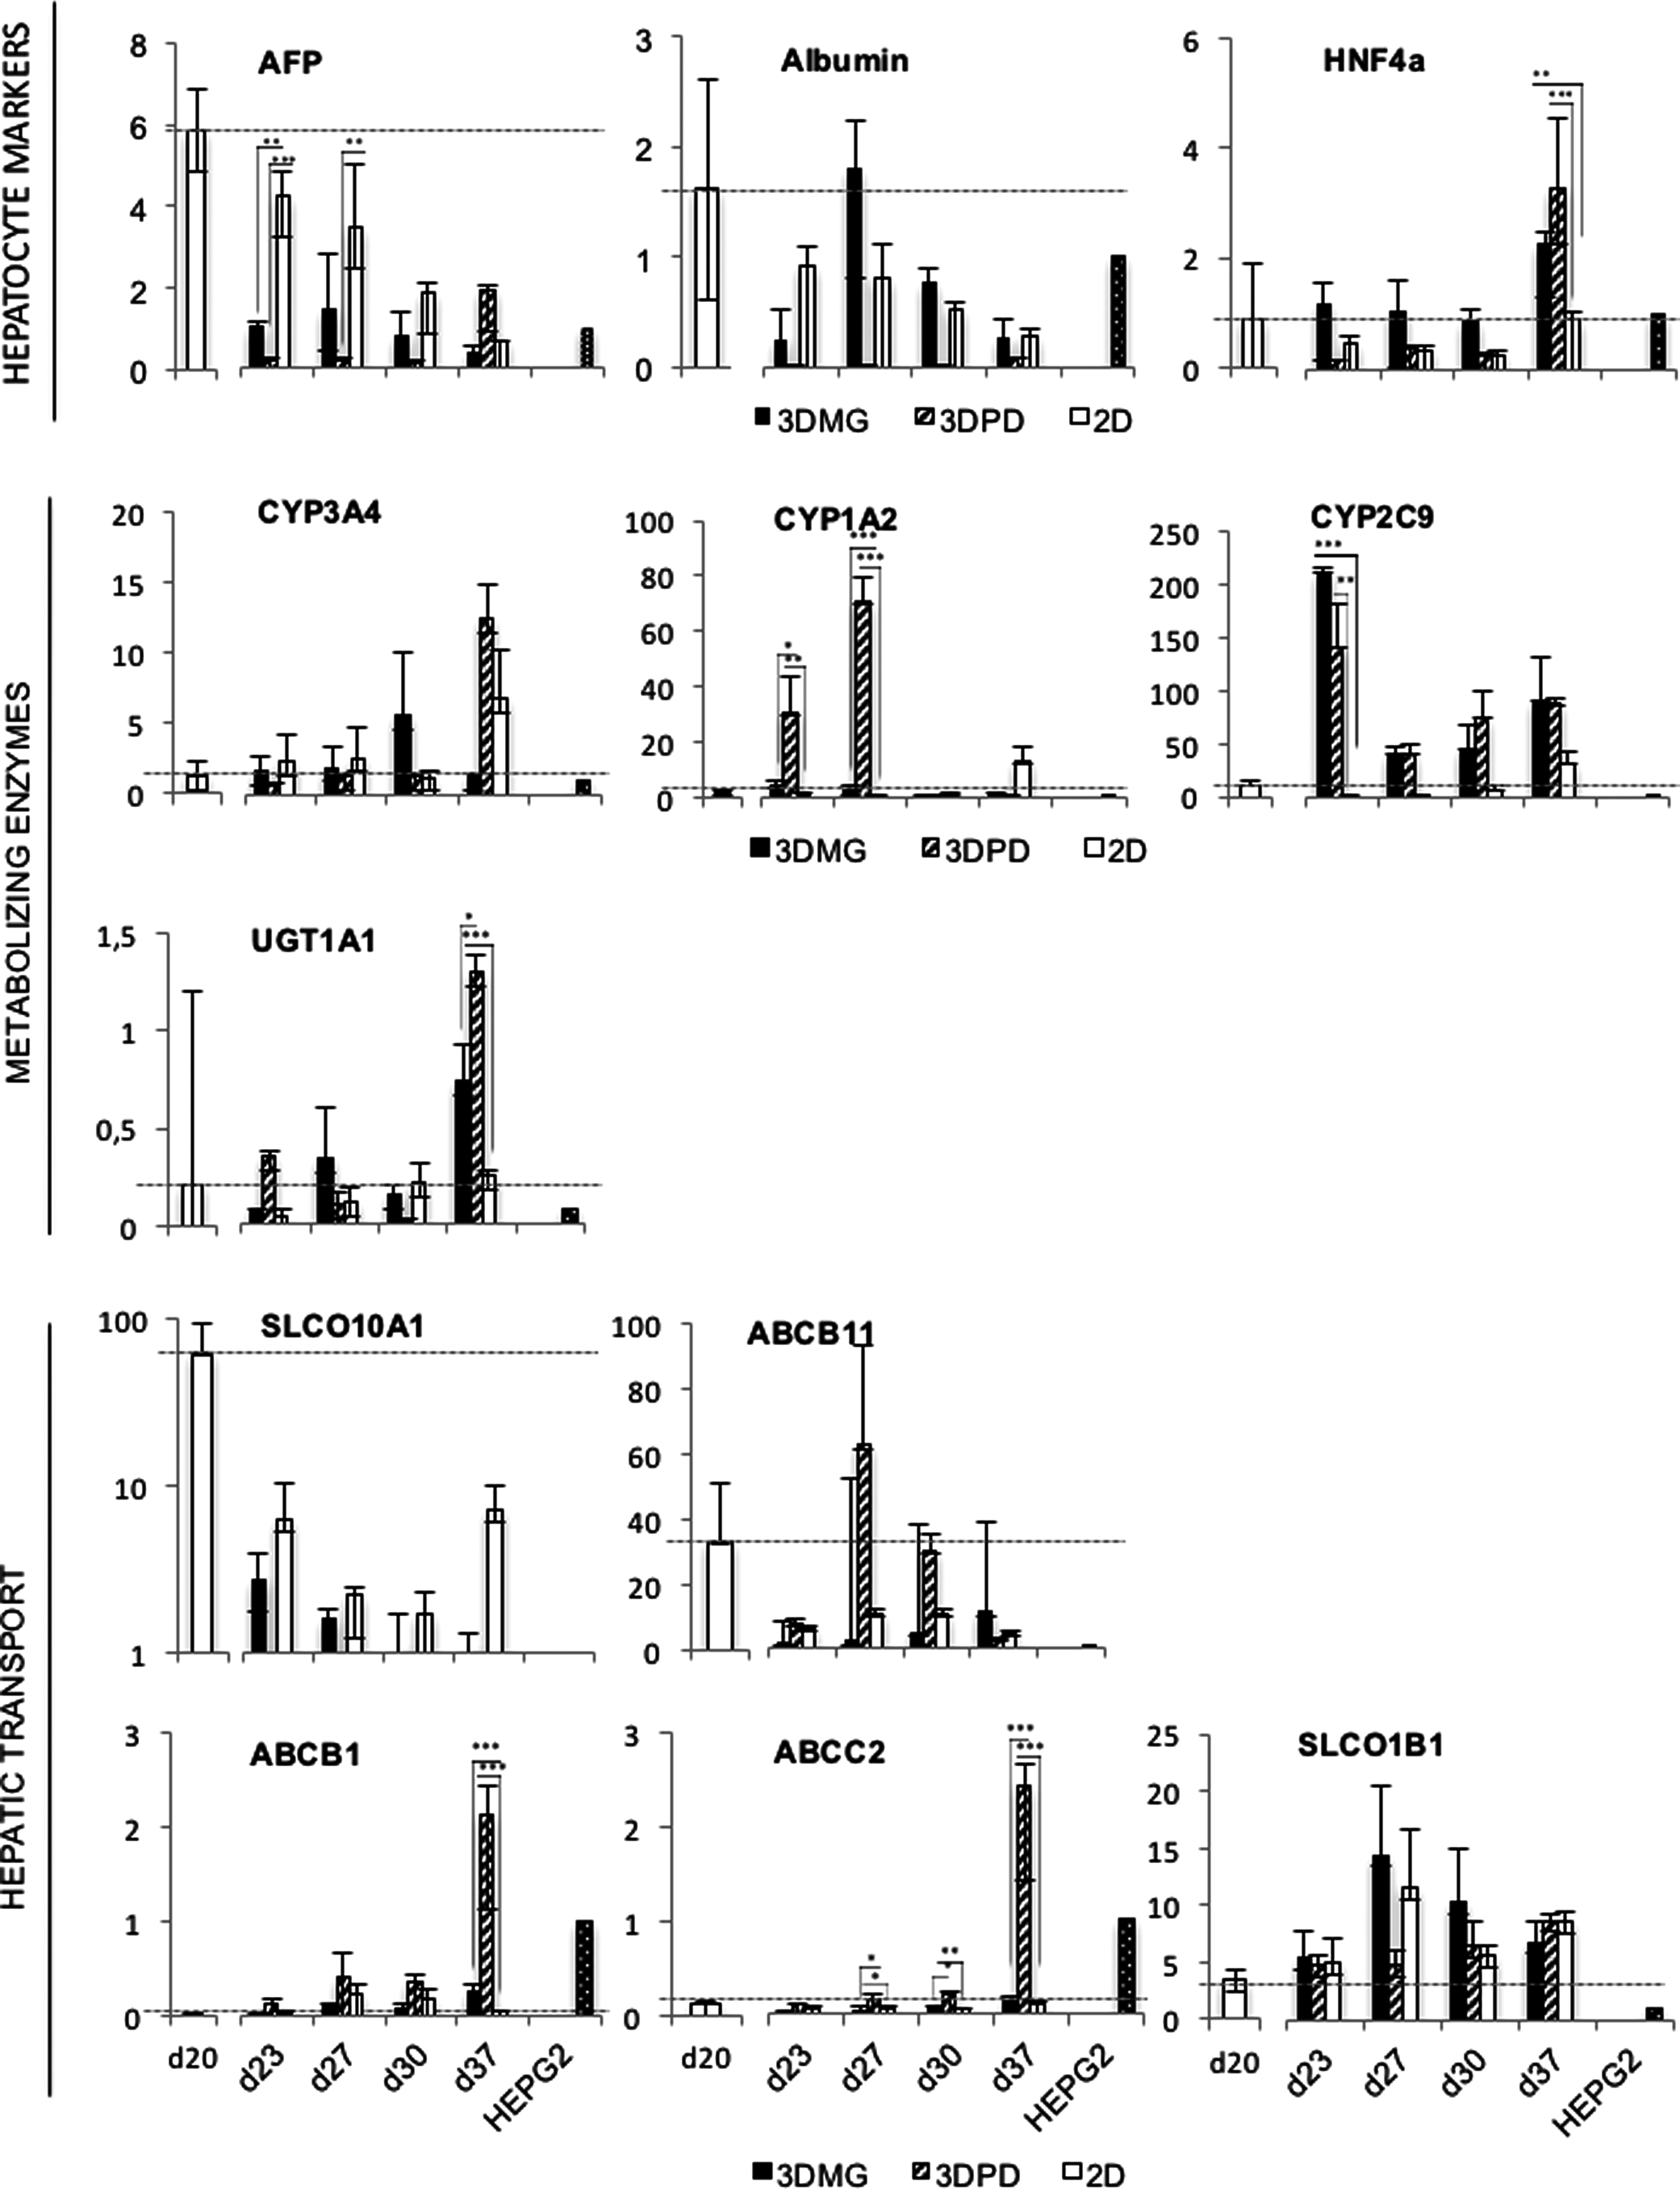
Relative gene expression of the cell cultures in 2D, 3DMG, or 3DPD. Cells were analyzed over the differentiation at 5 culture days (days 20, 23, 27, 30, and 37). The sample from day 20 is prepared from 2D conditions before transfer to 3D hydrogels. The samples from days 23, 27, 30, and 37 are isolated from the 3D cultures. The expression level of each gene was normalized to the expression of corresponding gene in HepG2 cell cultures. The data represent the mean of three independent differentiation experiments. Statistical testing between different 3D culture environments was done using GraphPad Prism software and Šidák's multiple comparison test as a follow-up to one-way ANOVA. Significance * < 0.05, ** < 0.01, and *** < 0.001.
The genes of phase I CYP metabolizing enzymes, CYP1A2, CYP2C9, and CYP3A4, were upregulated in the 3D hydrogel models in comparison with monolayer models (Fig. 5). HLCs expressed significantly higher levels of CYP1A2 until day 27 in 3DMG and 3DPD than in 2D, whereas CYP2C9 was significantly higher at day 23 in 3DMG and 3DPD than in 2D. CYP3A4 expression peaked later in the differentiation (day 37) than CYP1A2 and CYP2C9 (days 27 and 23). The expression of uridine 5′-diphospho-glucuronosyltransferase-1 (UGT1A1), encoding a phase II glucuronidation enzyme, was significantly higher in the 3DMG and 3DPD than in 2D at day 37.
Hepatic bile acid transporter genes, SLCO1B1, SLCO10A1, and ABCB11 were expressed at higher levels in all the HLC cultures than in the HepG2 cells (Fig. 5). However, the expression of ABCB11 was highly variable between the experiments. The 3D hydrogels enhanced only the expression of ABC transporters from which ABCB1 and ABCC2 were significantly higher expressed in 3DPD models than in 3DMG or 2D at day 37. The other studied transporters were at similar levels with 2D monolayers.
Hepatic functions in 2D- and 3D-cultured HLCs
To verify the hepatic functionality of HLCs in the 3DMG, 3DPD, and 2D models, we measured albumin secretion, functions of CYP1A2, CYP2B6, CYP2C9, CYP2D6, and CYP3A4 metabolizing enzymes, and formation and function of bile canaliculi structures.
HLCs in 3DMG and 3DPD hydrogel showed an increasing trend of albumin secretion over the 37 days of culture (Fig. 6A). In contrast, the secretion was stable in the 2D cultures for 30 days. Overall, albumin was secreted at lower level from HLCs in 3D than in 2D when comparing the gDNA normalized values. Albumin secretion from HepG2 was significantly higher than from any HLC model (p < 0.01; Fig. 6A).
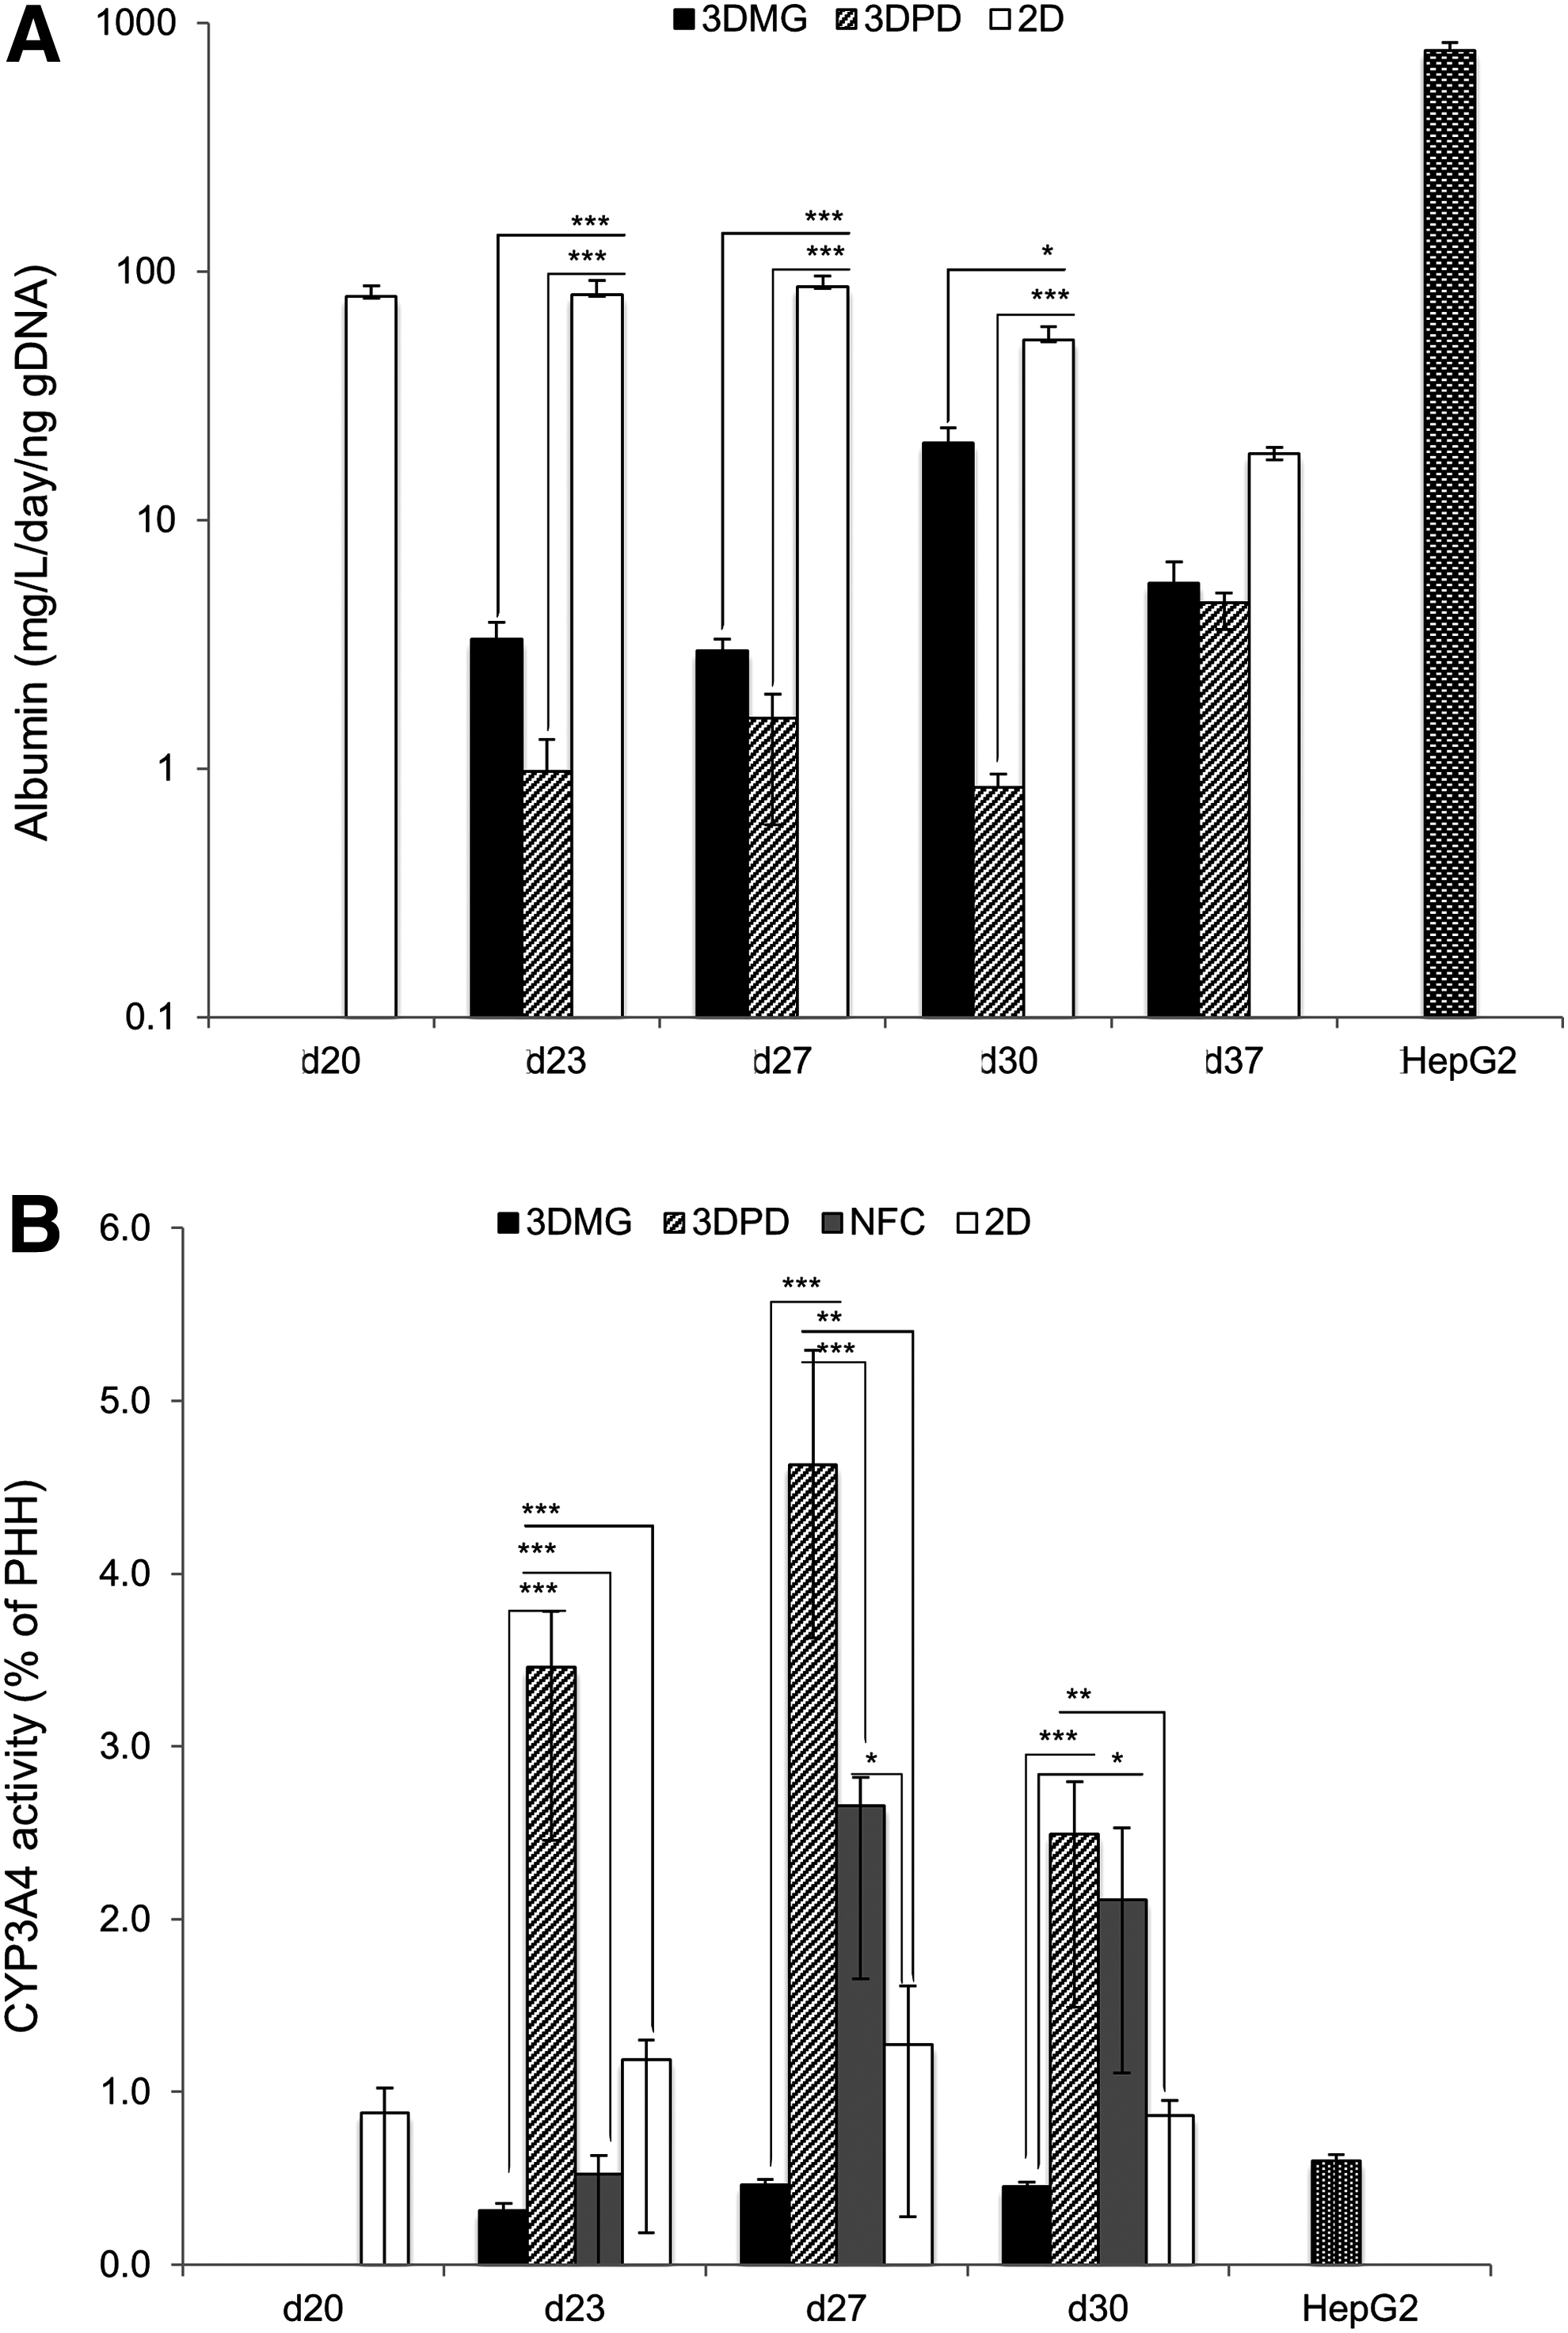
All the HLC cultures showed CYP1A2 enzyme activity (Table 1). CYP1A2 activity was increased 19-fold in 3DMG when compared with the 2D cultures, being ∼70% of the activity in PHHs and twice as high as in HepG2 cells. Instead, CYP2B6 activity was remarkably lower in HLCs than in PHHs but it was more than fivefold higher in 3DMG than in 2D monolayers or the HepG2 cells. The concentrations of CYP2C9, 2D6, and 3A4 metabolites were below the detection limit (Table 1), although peaks (less than 0.5% of the PHH peak area) were detected from HLC 3DMG samples (data not shown). When CYP3A4 activity was tested by luminescence-based assay, the 3DPD HLCs models had significanty higher CYP3A4 activity than HepG2 or other HLC models (Fig. 6B).
The results are presented as percentages compared with PHH cultures (mean ± SD [n = 3]). The metabolic activity of PHHs as fmol/ng(gDNA)*min is presented in parentheses.
2D, two-dimensional; 3D, three-dimensional; gDNA, genomic DNA; MG, Matrigel hydrogel; n.d., not detected, below the limit of quantitation; PD, Petri Dish; PHHs, primary human hepatocytes.
Bile canaliculi functions were tested with fluorescein diacetate and calcein-AM (a component of live/dead kit), both of which are hydrolyzed by cellular esterases to fluorescent molecules, fluorescein, or calcein, respectively. Fluorescein and calcein are substrates for canalicular transporter proteins, MRP2 (ABCC2) and MDR1 (ABCB1), respectively, and are accumulated in the bile canaliculi-like structures. Fluorescein-positive intercellular vesicles, that is, bile pockets were detected only in the 2D HLC cultures (Supplementary Fig. S3A), whereas fluorescent calcein containing vesicles were detected in 3DMG-cultured HLC spheroids (Supplementary Fig. S3B). The formation of bile canaliculi-like structures in 3DMG HLCs was confirmed by actin filament accumulation in the core of the dense spheroids (Supplementary Fig. S4).
Discussion
A lot of effort has been invested on finding reproducible and effective hepatocyte differentiation protocols for hPSCs. Various studies have reported on the differentiation of hPSCs to hepatic cells by exploiting stepwise addition of growth factors and cytokines, mimicking the signaling pathways active during embryonic development of the liver.18,28,50 These methods produce cells, which express fetal stage markers, and do not represent adult hepatocytes in all of their functions, such as drug metabolism and biliary excretion processes. The purpose of this study was to develop a 3D liver model that supports 3D cellular organization and cellular interactions and to investigate whether the animal- or plant-derived 3D hydrogel models can promote hPSC-HLCs maturation and functional preservation in the in vitro settings.
We chose 3DNFC and 3DPD hydrogels in the study because they are well-defined plant-derived systems without animal components. This should reduce batch-to batch variation and thus enhance reproducibility. Notably, 3DNFC and 3DPD have not been studied in hepatic differentiation of hiPSCs before. The third hydrogel in this study, 3DMG, represented an animal-derived hydrogel rich in mammalian ECM cues. To our knowledge, 3DMG has been previously utilized for hPSC-HLCs in only one study. Cheng et al. developed stable hPSC-derived DE cell lines that could be passaged for multiple times and further differentiated into hepatocytes in 3DMG. 38 They supplemented the culture with mouse embryonic fibroblasts and high concentrations of growth factors. Here, we used 3DMG without additional feeder cells. The selected hydrogel systems represent a range of physical properties. Stiffness (storage modulus, G′) ranged from ∼2 Pa of 3DPD microwells to ∼10 Pa of 0.5% 3DNFC, ∼55 Pa of 100% 3DMG, and ∼100 Pa of 1% 3DNFC. 51
The use of hepatic cells from proper differentiation stages is very important to the success of an in vitro liver model. The hepatic differentiation protocol used in our study is similar to that reported by Mallanna and Duncan. 52 We controlled the quality and purity of hPSC-HLCs at each differentiation stage and before transferring the cells to the 3D hydrogels. Our characterization results by immunocytochemistry, flow cytometry, and qPCR show that the expression of key lineage markers was within the ranges of those observed in previous studies, suggesting that the differentiation process was successful.
When assessing the best cellular differentiation stage for 3D hydrogel transfer, the higher appearance of spheroids, higher cell growth, and higher albumin secretion of the cells at differentiation day 20 (HLCs) than the cells at day 5 (DE) or the cells at day 10 (between DE and hepatoblasts) supported day 20 as the best stage for further 3D maturation. It is likely that the earlier DE cells do not have the self-assembling properties, characteristic for hepatic cells.16,53 We tested the 3DPD microcompartments engineered to generate both “small and large spheroids” and found that the opening size of the compartments determines cellular aggregation and proliferation. The “small spheroids” cast with 400 μm of diameter microcompartments did not support cell–cell adherence of hPSC-HLCs (day 20 cells). The same phenomenon was seen with PHHs (data not shown). Instead, the 800 μm “large spheroids” cast promoted cellular aggregation and proliferation and was selected for further study.
Characterization of cell viability showed that the great majority of cells transferred into 3DMG and 3DPD remained viable. The zonation in fluorescent intensity reflects to diffusion gradient of calcein-AM in the 3DPD spheroids. The spheroids generated in 3DPD (“large spheroids” cast, 1000 cells/microwell in seeding) had compact uniform structure throughout the spheroids, resembling the structure and size of the hepatic spheroids initiated with the same number of cells in agarose-coated wells. 54 The large spheroid entails mass transport limitations, but risk of necrotic core formation with diameter under 400 μm is still low.54,55 The spheroids in 3DMG were significantly smaller than in 3DPD and consisted of two morphology types resembling the finding made in suspension culture of HLCs. 56 The dense spheroids with small cavities are similar to the hepatocyte spheroids,42,45,54 whereas the morphology of the cystic spheroids resembles immature DE spheroids (high FOXA2 and SOX17, and low ALB) formed in stirred bioreactor, 56 but also cholangiocyte-type spheroids formed in 3DMG. 57
The highest proliferation of the cells was reached in 3DPD, which represented the lowest stiffness of the tested culture systems since the cells grow as suspension in microwells. The poor proliferation of the cells in 1% 3DNFC hydrogels is in line with earlier studies done with HepG2 and HepaRG cells,21,42 and can be explained by the relatively high stiffness (G′ ∼100 Pa).21,51,58,59 The low proliferation rate is anyhow a typical phenomenon in 3D hydrogels.60,61 The low number of viable cell aggregates and rapidly decreasing cell mass in 3DNFC models made us to discontinue the studies with 3DNFC. The combination with collagen type I (3DNFC 1%–Col I) did not improve the outcome. It is likely that the NFC systems would have required further optimization and possibly preaggregation of the cells before embedding in the hydrogel.
HLCs cultured in 3DMG and 3DPD showed increased gene expression of drug metabolizing enzymes compared with 2D conditions, particularly in 3DPD. The increased CYP expression is consistent with the increasing HNF4a expression. HNF4a is known to regulate the P450 enzymes in hepatic cells.12,62 The upregulation of CYP1A2 and CYP2C9 in HLCs by 3D culture has been detected previously by a 3D coculture system. 23 In addition, CYP2C9 induction has also been reported by 3D HLCs in bioreactor culture. 25
Interestingly, genes for bile acid transporters, SLCO10A1, SLCO1B1, and ABCB11, were upregulated, whereas ABCB1 and ABCC2 were downregulated in HLCs when compared with HepG2 cells. This profile resembles the situation in the human liver, where SLCO10A1, SLCO1, and ABCB11 transporters represent 55%, and ABCB1 together with ABCC2 only 11% of all hepatobiliary transporters. 63 The upregulated expression of bile acid transporters together with upregulated bile acid metabolizing enzyme, UGT1A1, in all HLC cultures suggests active bile acid synthesis, which is a specific function of mature hepatocytes. The upregulation of ABCB1 and ABCC2 transporters in 3DPD is promising since a previous study showed equal expression in 2D and 3D HLC cultures. 25
Albumin mRNA expression of HLCs was at the same or lower level than HepG2, which is in agreement with a previous finding with HLCs. 64 Genes coding metabolically important hepatocyte enzymes, CYP1A2, CYP2C9, CYP3A4, and UGT1A1, were highly expressed in 3DPD cells, although their albumin expression was low. This resembles the findings made with HepG2. 19 When HepG2 cells were transferred from 2D to 3D environment, their P450 expression increased but albumin decreased. 19 Gene clustering analysis has revealed that hepatocyte markers, for example, ALB and CYP3A4, distribute to adjacent clusters, suggesting divergent regulation networks. 65 This may explain the different gene expression profiles of hepatocyte markers observed by us.
Cell cultures in 3DMG did not reach the same metabolizing enzyme and ABC transporter gene expression levels as the cells in 3DPD, which may be due to the presence of immature phenotype in 3DMG. It is possible that laminin 111- and type IV collagen-rich MG do not provide correct biochemical signals for hepatic maturation. A recent study by Cameron et al. underlined the importance of correct ECM proteins for hepatocyte differentiation from hiPSCs. 66 In the liver, laminins and type III and IV collagens, the components of MG, are enriched in the periportal site. This site accommodates hepatocytes expressing gluconeogenesis and cholesterol synthesis, the characteristics reached in the earlier phase of hepatic maturation. 67 Metabolically active hepatocytes (P450 drug metabolizing enzymes) locate to the pericentral area of the liver lobule enriched in fibronectin, types I and VI collagens. In vitro studies have confirmed that the pericentral protein, collagen type I, supports the phenotype of mature hepatocytes, whereas the periportal proteins support fetal hepatocytes. 67
The overall low albumin secretion of HLCs reflects the immaturity of the cells. The comparison between 3D HLCs, 2D HLCs, and 2D HepG2 may not be completely fair. It is not trivial to compare HLC functions across different culture formats. Because of practical reasons, we decided to normalize the functional data to gDNA instead of the commonly used seeded number of cells. This normalization is perhaps not the most optimal way to compare albumin secretion from the cells in 3D and 2D, since it does not take into account the differences in secreting surfaces. The same number of cells has approximately half of the plasma membrane area in 3D spheroidal geometry than in 2D monolayer culture.
Our data indicate that hPSC-HLCs grown in 3DMG respond to melatonin (a substrate of CYP1A2) at the level of ∼70% of PHHs, whereas 2D cultures exhibited only ∼4% activity of PHHs. The high CYP1A2 activity is a promising finding, since in humans it is expressed only in the liver. 68 The lack of CYP3A4 metabolism of midazolam on day 27 is in line with the mRNA levels on the same day. Instead, when CYP3A4 activity was measured with luminescent substrate on day 30, a significant activity was detected from 3DPD HLCs. The enhanced but relatively low activity level (4% of PHHs) agrees with previous studies (∼1.5–4%), where the metabolism of luminescent CYP3A4 substrate was compared between iPSC-HLCs and PHHs.14,50,69 The divergent activities among the enzymes of CYP family are most probably a consequence of different regulation pathways. CYP1A2 is regulated by aryl hydrocarbon receptor, whereas CYP3A4 is regulated by liver-enriched transcription factors C/EBPα, C/EBPβ, HNF1α, HNF3γ, HNF4α, USF, and PPARα. 68 Also CYP2C9 has a complex regulation by HNF4α, HNF3γ, C/EBPα, and GATA-4. Transcriptional regulation of CYP2B6 and CYP2D6 is not studied throughout but it is known that HNF3β, HNF4α, and C/EBPα are involved in constitutive expression of CYP2B6, 70 and CYP2D6 is regulated by HNF4α. 68
Culture in 3DMG hydrogel resulted in the presence of bile canaliculi-like intercellular vesicles. The vesicles formed in the dense 3DMG spheroids (∼10–30 μm in length) resemble the bile canaliculi structures of HepaRG spheroids 42 and primary hepatocyte cultures, 71 both in size and shape. The vesicles were smaller in 2D cultures (∼3 μm in diameter) and they correspond with the vesicle size detected in 2D HepaRG and HepG2 cultures.42,45
Although HLCs in 3D hydrogel models show significantly higher levels of hepatocyte markers than in conventional 2D cultures, they still express AFP and lack some key functions. Additional molecular cues will be needed to further promote the differentiation of hPSC-HLCs toward the adult PHH phenotype. Some small molecules have been identified that are able to enhance hepatic maturation, proliferation, or both. 50 Careful selection of hiPSC lines with favorable genetic background could furthermore result in enhanced hepatic maturation72–74 Combining these approaches with 3D culture microenvironments may lead to enhanced maturation of HLCs.
Conclusions
We demonstrate the potential of two plant-based 3D hydrogels in hepatic maturation of hPSC-HLCs in comparison with widely used animal ECM hydrogel, Matrigel. The 3D animal ECM (3DMG) and 3D microcompartmental (3DPD) hydrogel models extended the viability, promoted the growth of HLCs, and promoted hepatic maturation of hiPSC-HLCs. Although further studies are needed to generate fully functional human hepatocytes from hiPSCs, our work yields novel information for the development of 3D in vitro models for drug screening and modeling of liver diseases.
Footnotes
Acknowledgments
This study was funded by the Finnish funding agency for innovation (TEKES) 3D-liver project (2246/31/2011) and the UEF Stem Consortium (931051). We gratefully thank Eila Korhonen and Heli Grym for excellent technical support. We would like to thank Jere Weltner and Diego Balboa for fruitful discussions and advices.
Disclosure Statement
No competing financial interests exist.
References
Supplementary Material
Please find the following supplemental material available below.
For Open Access articles published under a Creative Commons License, all supplemental material carries the same license as the article it is associated with.
For non-Open Access articles published, all supplemental material carries a non-exclusive license, and permission requests for re-use of supplemental material or any part of supplemental material shall be sent directly to the copyright owner as specified in the copyright notice associated with the article.