
Abstract
Articular cartilage has a limited capacity to heal after damage from injury or degenerative disease. Tissue engineering constructs that more closely mimic the native cartilage microenvironment can be utilized to promote repair. Glycosaminoglycans (GAGs), a major component of the cartilage extracellular matrix, have the ability to sequester growth factors due to their level and spatial distribution of sulfate groups. This study evaluated the use of a GAG mimetic, cellulose sulfate, as a scaffolding material for cartilage tissue engineering. Cellulose sulfate can be synthesized to have a similar level and spatial distribution of sulfates as chondroitin sulfate C (CSC), the naturally occurring GAG. This partially sulfated cellulose (pSC) was incorporated into a fibrous gelatin construct by the electrospinning process. Scaffolds were characterized for fiber morphology and overall stability over time in an aqueous environment, growth factor interaction, and for supporting mesenchymal stem cell (MSC) chondrogenesis in vitro. All scaffold groups had micron-sized fibers and maintained overall stability in aqueous environments. Increasing concentrations of the transforming growth factor-beta 3 (TGF-β3) were detected on scaffolds with increasing pSC. MSC chondrogenesis was enhanced on the scaffold with the highest pSC concentration as seen with the highest collagen type II production, collagen type II immunostaining, expression of cartilage-specific genes, and ratio of collagen type II to collagen type I production. These studies demonstrated the potential of pSC sulfate as a scaffolding material for cartilage tissue engineering.
Introduction
O
An approach to promoting articular cartilage repair would be the use of tissue engineering constructs that more closely mimic the native cartilage microenvironment. Growth factors and other bioactive molecules are critical for cartilage tissue development. The regulation of activity and availability of growth factors are mediated, in large part, by matrix molecules such as proteoglycans, which are composed of glycosaminoglycans (GAGs). 6 GAGs are a major component of the cartilage extracellular matrix. Studies have shown that different GAGs have the ability to sequester and maintain the bioactivity of growth factors due to their level and spatial distribution of sulfate groups. 7 Previous work has demonstrated the capability of varying levels of sulfation to regulate cell activity through sequestration of growth factors in serum and supplemented media conditions. 8
Chondroitin sulfate C (CSC) or chondroitin-6-sulfate is one of the most abundant GAGs found in the developing embryo 9 and specifically in developing cartilage tissue. 10 CSC has one sulfate group per repeating unit on the sixth carbon of the N-acetylgalactosamine sugar (Fig. 1a). However, like many naturally occurring GAGs, CSC is isolated and purified from mammalian tissue 11 and may not be ideal for use in a cost-effective treatment. With increasing demand, low-cost alternative sources and biomimetic materials that can be tailored are being sought. 12

Structure of CSC or chondroitin-6-sulfate
Cellulose sulfate, a semisynthetic polysaccharide derived from cellulose, can be synthesized to have up to three sulfate groups per glucose unit (Fig. 1b). The level of sulfation and position of the sulfate group on the glucose unit can be tailored to more closely mimic the structure of naturally occurring GAGs, specifically CSC, where the sulfate group is on the sixth position of the glucose unit. Cellulose is one of the most abundant materials in nature and can be readily tailored for the degree of sulfation. In addition, cellulose sulfate is biocompatible13,14 and, unlike cellulose, is soluble in water. Furthermore, studies have observed that GAG-like molecules have a similar effect on growth factor interactions. 15
In this first study, we investigated partially sulfated cellulose (pSC) combined with gelatin (Gel) as a scaffold to support mesenchymal stem cell (MSC) chondrogenesis. The partial sulfation of cellulose favors the sulfation of the sixth position of the glucose unit. The scaffolds were evaluated for fiber morphology and overall stability over time in an aqueous environment, growth factor interaction, and supporting human MSC chondrogenesis in vitro. The effect of varying the concentration of pSC in the scaffold on MSC chondrogenesis was evaluated. Since pSC is a GAG mimetic, we hypothesized that pSC containing scaffolds would enhance the chondrogenesis of MSCs over gelatin scaffolds alone.
Materials and Methods
Materials
All reagents were purchased from Sigma-Aldrich (St. Louis, MO), unless otherwise mentioned.
Synthesis of pSC
pSC was prepared by modifying a previously published protocol. 16 Briefly, a sulfating reagent was prepared by adding chlorosulfonic acid dropwise to anhydrous dimethylformamide (DMF) at 0°C while stirring under dry nitrogen purging. Vacuum-dried microcrystalline cellulose was added to anhydrous DMF and heavily agitated for 24 h to properly wet the cellulose. The sulfating agent was added dropwise to the swelled cellulose while stirring and nitrogen purging to form crude cellulose sulfate. After 5 h, sodium acetate was added to quench the reaction and then vacuum filtered. The precipitate was swelled in ethanol and titrated to pH 7 using a 0.5 M sodium hydroxide (NaOH) solution. The resulting salt of cellulose sulfate was dialyzed (molecular weight cut-off [MWCO] 3.5–14 kDa; Fisher Scientific, Hampton, NH) against distilled water for 24 h. Excess water and ethanol were flashed off using a rotary evaporator.
Degree of sulfation depends on the concentration of the sulfation agent and is favored primarily on the sixth carbon, 16 which was confirmed by Fourier transform infrared spectroscopy (FTIR). pSC used in this study had 0.76 sulfates per glucose unit of cellulose, as determined by elemental analysis (Galbraith Laboratories, Inc., Knoxville, TN). Using size exclusion chromatography with refractive index detection (SEC-IR; Polymer Solutions, Inc., Christiansburg, VA), the weight average molecular weight of the pSC was determined to be 290,000 g/mol.
Scaffold fabrication
Fibrous scaffolds of gelatin and pSC were fabricated using the electrospinning process. Briefly, all electrospinning solutions were 24% w/w mixture of bovine gelatin type B and pSC in deionized water and ethanol. Gelatin was mixed in 50/50 (v/v) water/ethanol. pSC was added at 0.1% and 5% of gelatin in 70/30 (v/v) water/ethanol. For each solution, the water component and pSC, if applicable, were mixed at 60°C. Solutions containing pSC were sonicated (Branson Digital Sonifier 450, Danbury, CT) at 22% amplitude for 12 s (0.1% pSC) and 2 min (5% pSC). After sonication, ethanol was added and stirred. Gelatin was added to the warm mixture and stirred for an hour until all gelatin dissolved. With a 14-gauge needle, a solution-filled syringe was enclosed in a chamber that maintained the temperature of the solution at 60°C during electrospinning. Other parameters of electrospinning include a 35 kV voltage, needle-to-collector-plate distance of 30 cm, and a flow rate of 7 mL/h. Ambient temperature and humidity were ∼25°C and 10%, respectively.
Mats were crosslinked postelectrospinning using N-(3-dimethylaminopropyl)-N′-ethyl carbodiimide (EDC; EMD Millipore, Billerica, MA) with N-hydroxysulfosuccinimide (NHS). Modifications were made to previously described protocols and adapted for gelatin.17,18 Briefly, uncrosslinked mats were immersed in a 200 mM EDC/40 mM NHS solution in 100% ethanol for 96 h. The mat was rinsed in 0.1 M sodium phosphate for 2 h, then rinsed in deionized water, and air-dried. All scaffolds used for characterization and in vitro cell culture studies had a thickness of 0.25 ± 0.05 mm.
Scaffold characterization
Fiber morphology, average fiber diameter, and interfiber spacing of the scaffolds after crosslinking were determined using scanning electron microscopy (SEM; LEO 1530 Gemini). Samples were sputter coated with gold palladium. Average fiber diameter and interfiber spacing, the largest distance over a void created by at least three intersecting fibers, were determined from the SEM images by averaging 80 measurements from each group. 19 All measurements were made in ImageJ software (National Institutes of Health).
To confirm the position of the sulfate group in pSC and the presence of pSC on the surface of the scaffolds, FTIR was performed on the raw pSC and cellulose in powder form, and electrospun scaffolds of gelatin and pSC after crosslinking using the Perkin Elmer FTIR-ATR 100 series. Representative spectra of three different samples are reported. Data were collected in the 500–4000 cm−1 range with a spectral resolution of 4 cm−1 and a total of 10 scans.
Crosslinked scaffolds (n = 10 per group) were immersed in phosphate-buffered saline (PBS; Thermo Fisher Scientific, Waltham, MA) for 10 min or 14 days at 37°C for mechanical testing to evaluate initial and long-term changes in mechanical properties due to hydration. Uncrosslinked samples were not tested since they dissolved in an aqueous environment. Tensile testing was performed using an Instron Model 3342 (Instron, Norwood, MA) following previously described methods.18,20 Briefly, hydrated samples were cut into rectangular strips 5 mm wide, 15 mm long, and 0.2–0.3 mm thick (VWR Traceable digital caliper, Radnor, PA). 21 Samples were loaded onto a custom holder to prevent slipping or damage from the grips. The holder was constructed of parchment paper and contained a rectangular cutout over which the sample was carefully mounted with tape. The holder was loaded into the grips and cut so that only that sample spanned the space between the grips with a gauge length of 5 mm. Tensile testing was performed with a crosshead speed of 5 mm/min at room temperature. 22 Young's moduli and ultimate tensile stress (UTS) were determined.
Growth factor interaction with pSC containing scaffolds
Scaffolds (n = 4, 6 mm diameter) were immersed in a 10 ng/mL solution of recombinant human transforming growth factor-beta 3 (TGF-β3; ProSpec), the inductive growth factor in chondrogenic induction media, at 37°C. After an overnight incubation, the amount of TGF-β3 on the scaffold was measured using previously published methods. 23 Briefly, the scaffolds were rinsed with PBS three times for 10 min each to remove TGF-β3 not bound to the scaffold. The scaffolds were homogenized in a Tris/CHAPS buffer (50 mM Tris-HCl, 0.5% CHAPS, 150 mM NaCl at pH 7.2) and incubated overnight on a shaker at 4°C. DuoSet Development enzyme-linked immunosorbent assay (ELISA) for TGF-β3 (R&D Systems, Minneapolis, MN) was used to measure the amount of TGF-β3 extracted from the scaffolds. Samples in the Tris/CHAPS solution were diluted 1:5 in 1% bovine albumin serum for use with the ELISA.
In vitro cell studies on pSC/gelatin scaffolds
Human MSCs were obtained from human bone marrow aspirates (Lonza, Walkersville, MD), four donors, male and female, aged 18–30 years, according to previous published protocols and cryopreserved before use.
24
Cryopreserved MSCs were thawed and expanded on tissue culture polystyrene flasks (NunC, Rochester, NY) in general media comprising Dulbecco's modified Eagle's medium (DMEM; Gibco, Carlsbad, CA), 10% fetal bovine serum (Hyclone, Logan, UT), and 1% 1× antibiotic–antimycotic (Gibco) until 70–80% confluent. MSCs, at passage 3, were seeded on different pSC/gelatin scaffold formulations. Scaffold disks were cut with a 6 mm biopsy punch (Miltex, York, PA), unless otherwise mentioned. Disks were sterilized in 100% ethanol for 20 min and air-dried in polypropylene 96-well plates (Fisher Scientific) in a sterile culture hood overnight. Cells were seeded at 1.76 × 10⁵ cells/cm2 (50,000 cells per scaffold) at 37°C and cultured in chondrogenic induction media (CCM). CCM consisted of DMEM high-glucose containing 4 mM
Cell number (n = 3 per group per time point) was measured by the Quant-iT dsDNA PicoGreen Assay Kit (Molecular Probes, Eugene, OR), using 100 μL of each sample from the guanidine hydrochloride step during collagen solubilization at days 28 and 56. PicoGreen reagent was added to an equal volume of the cell lysates. The mixture was measured for fluorescent intensity using a microplate reader (FLX800; BioTek Instruments, Winooski, VT) at 480 nm excitation and 520 nm emission. The cell number of the unknown samples was determined by correlating the fluorescent values to a standard curve of known cell numbers.
Samples were evaluated for the total production of collagen type II and collagen type I using a sandwich ELISA (Chondrex, Redmond, WA). Samples (n = 3 per group per time point, 12 mm in diameter) and cell-free controls were treated individually to solubilize collagen as per the manufacturer's protocol, which includes guanidine hydrochloride treatment and pepsin digestion. On completion of collagen solubilization, samples were stored at −20°C until time of ELISA. The lysate collected from the solubilization was used for both the collagen type II and type I ELISA using a spectrophotometer (Emax; Molecular Devices, Sunnyvale, CA) at 490 nm with a reference wavelength of 630 nm. Values for collagen type II and type I production are reported as total collagen per sample and as collagen production normalized to the cell number from the PicoGreen results for each sample.
Cell morphology and immunostaining of collagen type II were evaluated by confocal microscopy (C1si; Nikon). Samples were fixed with 4% paraformaldehyde. Samples were stained with primary antibody, monoclonal mouse anti-human collagen type II antibody (EMD Millipore), secondary antibody, donkey anti-mouse immunoglobulin G (IgG; EMD Millipore) conjugated with Northern Lights 493, and rhodamine phalloidin (Molecular Probes) for the F-actin of the cytoskeleton. The nucleus was stained with 4′,6-diamidino-2-phenylindole (DAPI; Molecular Probes). Images of cells on scaffolds were taken at 14, 28, and 56 days at 40× magnification.
Evaluation of gene expression was performed with quantitative reverse transcriptase-polymerase chain reaction (qRT-PCR) using the QuantiTect SYBR Green RT-PCR Kit (Qiagen, Valencia, CA) according to the manufacturer's instructions. All primers were obtained from Qiagen. Since Qiagen primer sequences are proprietary, their catalog numbers are included for each primer. Relative gene expression of collagen type II (QT00049518), aggrecan (QT00001365), SOX9 (QT00001498), chondroadherin (QT00016275), collagen type I (QT00037793), and collagen type X (QT00096348) was evaluated and normalized to the housekeeping gene, ribosomal protein, large, P0 (RPLP0, QT00075012). Since gene expression for chondrogenic markers during MSC chondrogenesis in vitro reaches the highest levels around days 14 and 28,19,25,26 gene expression was evaluated at earlier time points of days 7, 14, and 28. RNA was isolated from the samples using the RNeasy Micro Kit (Qiagen) that includes homogenization of the sample (QIAshredder; Qiagen) and DNA digestion step (RNase Free DNase Set; Qiagen). Each sample was tested in triplicate. MSC pellet cultures were used as controls. The reverse transcription was performed using previously published protocols 19 using the MX4000 detection system (Stratagene, Santa Clara, CA).
Statistical analysis
Analysis of variance (ANOVA) was used to determine statistical significance (p < 0.05). Normality was determined by the Shapiro–Wilk test and Levene's equal variance test. Tukey's post hoc test was used for statistical differences at p < 0.05. All statistics were performed in SPSS Statistics Version 21 (IBM, Armonk, NY). Values are reported as mean ± standard deviation, unless otherwise mentioned.
Results
Scaffold characterization
Figure 2 shows the fiber morphology of the fibrous scaffolds after crosslinking with EDC/NHS. All groups maintained a fiber structure after crosslinking. Average fiber diameter and interfiber spacing are shown in Table 1. The fiber diameter for Gel was significantly different from the other groups (p < 0.05). No significant differences were detected in interfiber spacing between groups.
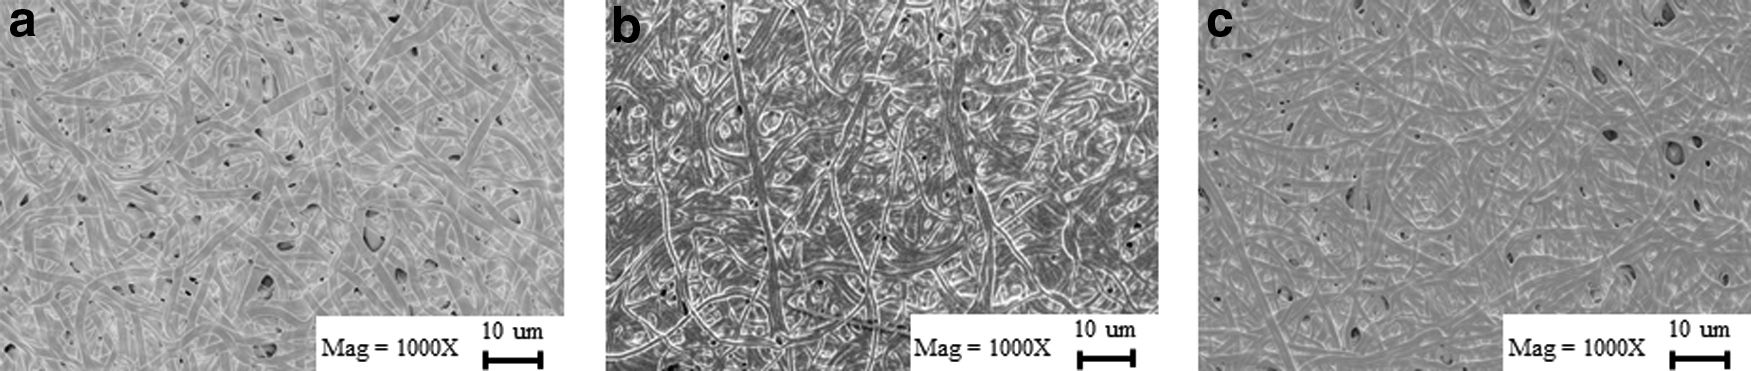
SEM images of electrospun gelatin
Values represent mean ± SD.
Significantly different from all groups (p < 0.05).
Gel, gelatin; pSC, partially sulfated cellulose; SD, standard deviation.
FTIR spectra of pSC show the presence of a peak located at 1222 cm−1 (Fig. 3a), which has been reported as the presence of S = O stretching.27,28 The spectrum of pure cellulose does not have a peak at this wavenumber. The pSC FTIR further shows the peak at 822 cm−1 and shoulder at 1000 cm−1, which correspond to vibrations of sulfate groups on the sixth position on the glucose unit. 29 pSC had no detectable peaks at 730 cm−1 and 853 cm−1, which are associated with sulfate groups on the fourth position. 29 Both the Gel and 5% pSC/Gel scaffolds have a peak near 1245 cm−1 (Fig. 3b) that corresponds to the amine III bond. 30 The spectra of the mat with pSC exhibit the loss of a minimum near 1222 cm−1, suggesting the emergence of a sulfate peak (Fig. 3b, c).

FTIR spectra of cellulose and pSC powder
All samples were tested after 10-min hydration in PBS and after a 14-day incubation in PBS at 37°C. UTS and elastic modulus were calculated and reported, as shown in Figure 4. No significant difference detected between any of the groups for UTS or elastic modulus after 10 min or 14 days in PBS. No significant difference detected in UTS over time for each group. The modulus at day 14 was significantly >10-min hydration for Gel (p < 0.05). No significant differences determined in the elastic moduli for the pSC-containing scaffolds over time.

Ultimate tensile stress
Growth factor interaction with pSC containing scaffolds
Scaffolds with varying concentrations of pSC were evaluated for binding of TGF-β3. After overnight incubation in TGF-β3, 0.1% pSC/Gel and 5% pSC/Gel scaffolds had significantly more TGF-β3 than Gel alone (p < 0.05) (Fig. 5). No statistical differences detected between the amount of TGF-β3 on 0.1% pSC/Gel and 5% pSC/Gel scaffolds.

Amount of TGF-β3 extracted from scaffolds after 24-h incubation in 10 ng/mL TGF-β3 solution. *Significantly greater than gelatin (p < 0.05). TGF-β3, transforming growth factor-beta 3.
In vitro cell studies on pSC/gelatin scaffolds
Scaffolds containing pSC had significantly more cells at days 28 and 56 than Gel scaffolds (p < 0.05) (Fig. 6). No significant differences in cell number detected between pSC containing scaffolds. Cells on 5% pSC/Gel were the only group that produced detectable levels of collagen type II at day 28 and had the highest amount of collagen type II at day 56 compared to cells on 0.1% pCS/Gel and Gel (p < 0.05) (Fig. 7a). For collagen type II production per cell, cells on 5% pSC/Gel had a greater production than 0.1% pSC/Gel (p < 0.05) (Fig. 7b), but not statistically significant from Gel at day 56. The ratio of collagen type II/collagen type I at day 28 was greatest for cells on 5% pSC/Gel (p < 0.05) (Fig. 7c). At day 56, cells on 5% pSC/Gel had a greater ratio of collagen type II/collagen type I than 0.1% pSC/Gel (p < 0.05), but was not statistically significant from Gel. At day 28, cells on 0.1% pSC/Gel had more total collagen type I than Gel and 5% pSC/Gel (p < 0.05) (Fig. 7d). By day 56, cells on both pSC containing scaffolds had more total collagen type I than Gel (p < 0.05). When the total collagen type I was normalized to cell number, cells on 5% pSC/Gel scaffolds had the lowest production of collagen type I per cell at days 28 and 56 (p < 0.05) (Fig. 7e). Using confocal microscopy, by day 28, cells on 5% pSC/Gel stained for collagen type II and by day 56, appeared to have more collagen type II than the other groups (Fig. 8).

Cell numbers on Gel, 0.1% pSC/Gel, and 5% pSC/Gel scaffolds in chondrogenic induction media (CCM) after 28 and 56 days in culture. *Significantly greater than gelatin at time point (p < 0.05).
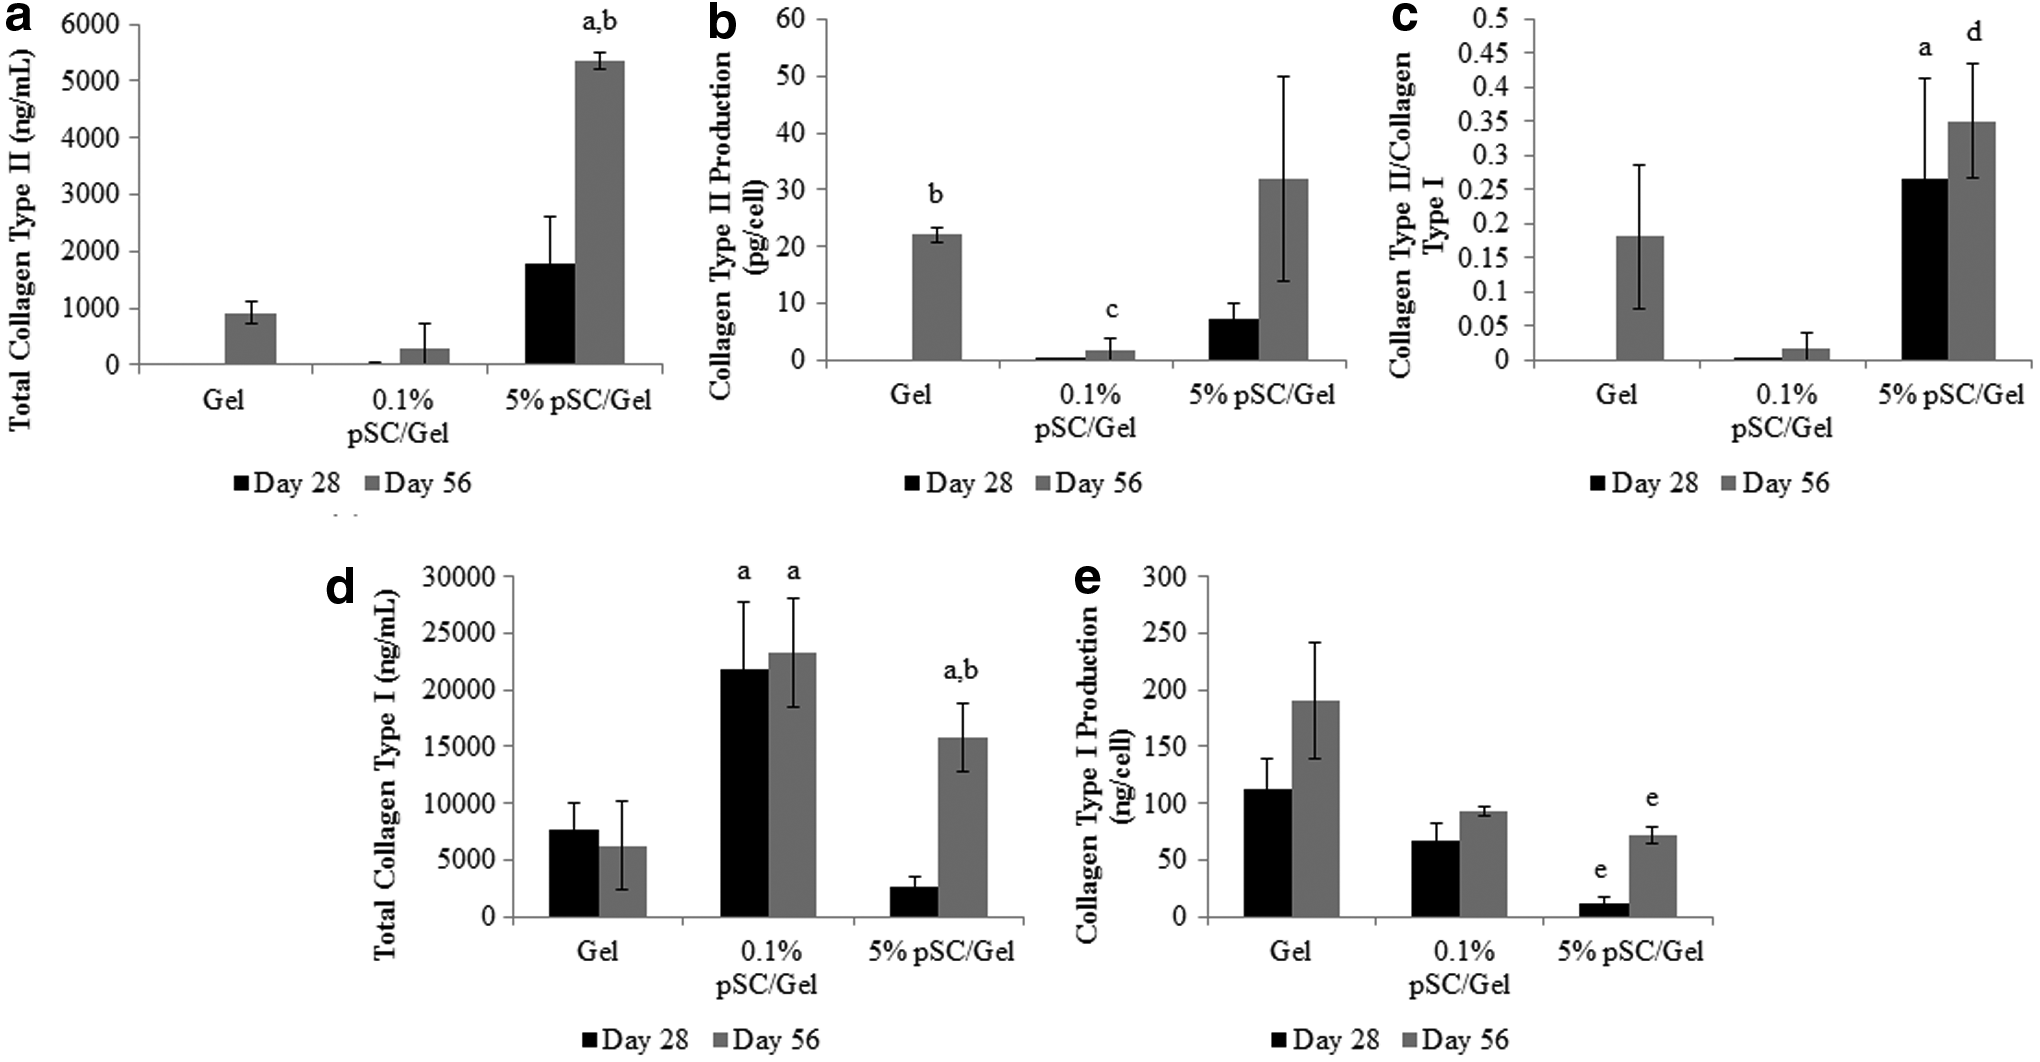
Total production of collagen type II of cells on pSC/Gel scaffolds after 28 and 56 days in CCM
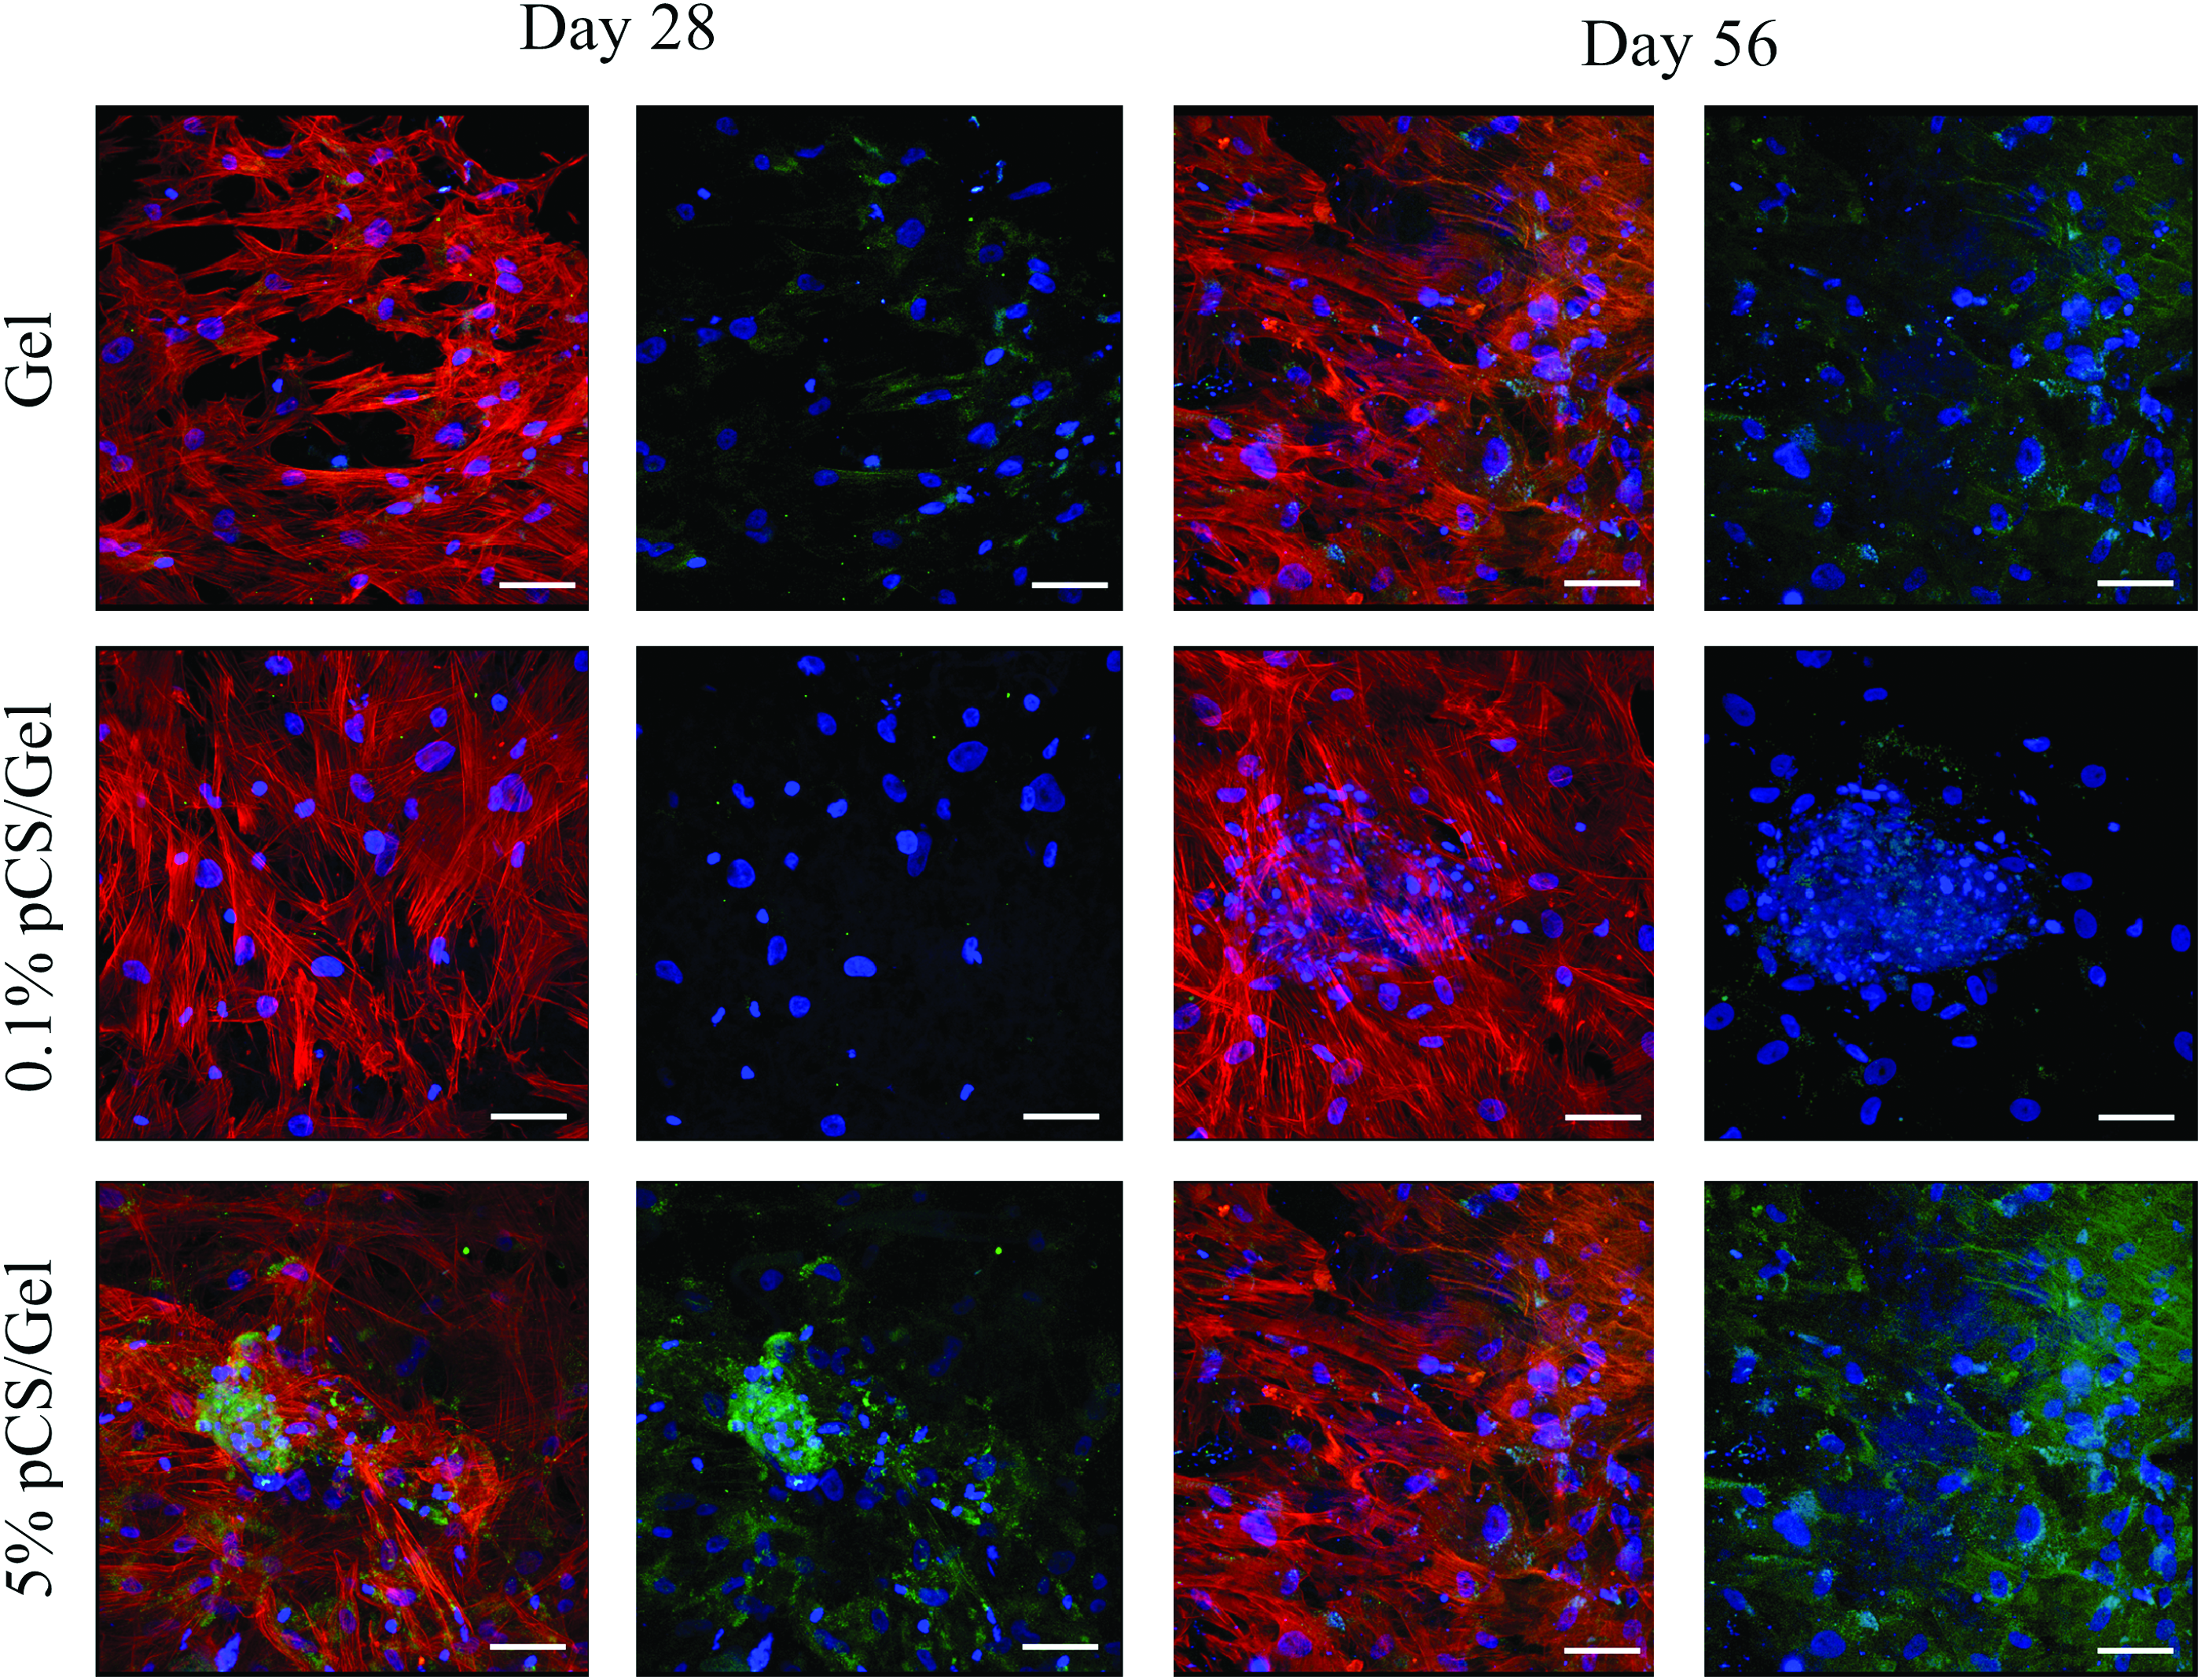
Confocal images of cells on Gel, 0.1% pSC/Gel, and 5% pSC/Gel in CCM at days 28 and 56. Red stains for F-actin, blue stains for the nucleus, and green stains for collagen type II. Merged image showing all three stains is on the left and the same image showing nucleus (blue) and collagen type II (green) staining is on the right for each group at each time point. Magnification = 40 × . Scale bar = 50 μm. Color images available online at www.liebertpub.com/tea
Gene expression for cells on scaffolds is represented as fold change of the gene expression relative to day 2 (Fig. 9). Cells on 5% pSC/Gel had the highest expression of aggrecan of all groups at day 28 (p < 0.05). Aggrecan expression for cells on 0.1% pSC/Gel was significantly different from Gel at day 14 (p < 0.05). For the pSC containing scaffolds, aggrecan expression significantly increased over time (p < 0.05), while expression on Gel significantly increased with time by day 28 (p < 0.05). The greatest gene expression for collagen type II was found for cells on 5% pSC/Gel at day 28 (p < 0.05). No significant differences detected for collagen type II for cells on Gel and 0.1% pSC/Gel. Gene expression for SOX9 was highest for cells on 5% pSC/Gel scaffolds compared to other groups at all time points (p < 0.05) with the highest expression at day 14 (p < 0.05). The expression of SOX9 for cells on 0.1% pSC/Gel decreased significantly by day 28 (p < 0.05). By day 28, chondroadherin expression of cells on 5% pSC/Gel had the greatest fold change over all groups at all time points (p < 0.05). No significant differences detected for collagen type I expression between the scaffold groups at all time points. Cells on Gel and 5% pSC/Gel at day 28 had significantly greater expression of collagen type I than day 7 (p < 0.05). For collagen type X, the highest expression was seen for cells on 5% pSC/Gel at day 28 (p < 0.05). At day 14, the expression of collagen type X was greater on 5% pSC/Gel than Gel scaffolds (p < 0.05). Cells on Gel had a significant increase in expression compared to other time points by day 28 (p < 0.05).

Fold change of relative gene expression compared to day 2 for aggrecan, collagen type II, SOX9, chondroadherin, collagen type I, and collagen type X for cells on pSC/Gel scaffold in CCM up to 28 days. aSignificantly greater than other groups at time point (p < 0.05). bSignificantly different from other groups at time point (p < 0.05). cSignificantly different from other time points within group (p < 0.05). dSignificantly greater than Gel at time point (p < 0.05). eSignificantly greater than day 7 (p < 0.05). Values are mean ± standard error.
Discussion
Cellulose is one of the most abundant materials in nature and can be readily tailored for the degree of sulfation. Cellulose sulfate is water soluble and has been previously investigated for its structural similarity to heparin.13,14 The current study investigated pSC, having the position of sulfation similar to the naturally occurring CSC, for MSC chondrogenesis. CSC is a GAG that has been investigated for various tissue engineering applications,8,31–33 including cartilage. 32 These GAGs have shown to interact with bioactive molecules and affect cellular behavior.7,8,15,34 GAG mimetics have also gained interest since their chemistry can be more readily tailored for the degree of sulfation and can have similar effects on growth factor interactions as naturally occurring GAGs. 15 Thus, pSC serves as an attractive scaffolding material for cartilage tissue engineering applications.
Previous studies incorporate sulfated polysaccharides or GAGs in a collagen-based or poly ethylene glycol (PEG)-based systems.33,35–38 However, few studies investigate GAGs in electrospun fibers.33,37 The current study was able to electrospin pSC and gelatin from water and ethanol. The use of relatively benign or less environmentally harsh solvents is desirable for use in the electrospinning process. 39 The pSC/Gel fibers were able to maintain their fiber structure after crosslinking and pSC was detected on the fiber through FTIR analysis. The pSC spectra demonstrated peaks associated with sulfate on the sixth carbon similar to the sulfate position on CSC. 29
The mechanical properties of the scaffolds were examined in a hydrated state to simulate conditions during culture. The purpose of this testing was to evaluate changes, if any, in the mechanical properties of the scaffold due to hydration to establish overall hydrolytic stability of the scaffold. Direct comparisons to the mechanical properties of native cartilage tissue would be difficult since the electrospun scaffold represents a mimic of the fibrous component of cartilage tissue. The Young's modulus of native cartilage is approximately 0.45–0.80 MPa. 40 Therefore, comparisons can be made with other collagen-based constructs. The mechanical properties were comparable to the values reported for hydrated electrospun collagen nanofiber samples 41 and 10 times greater than those for freeze-dried collagen scaffolds. 42 The pSC/Gel scaffolds also had similar mechanical properties to gelatin scaffolds and the properties were stable over time allowing for less variability during cell culturing.
GAGs have been shown to interact with bioactive molecules such as growth factors,7,14,34 where the degree of sulfation can affect growth factor affinity. The current study demonstrated that pSC scaffolds were able to bind TGF-β3 to a greater extent than gelatin scaffolds alone. Studies further demonstrate that growth factors interact with GAGs based on different sulfation patterns rather than charge density.7,34 Gama et al. used chondroitin sulfate with different sulfation patterns and demonstrated growth factors interact with GAGs based on the different sulfation patterns. 7 Improved growth factor binding may be a result of the level and spatial distribution of sulfates in the cellulose sulfate. Others report changes in cellular function on sulfated material and attribute this change to the distribution of sulfates.7,34 It is possible that the increase in chondrogenic behavior of MSCs is a result of cellulose sulfate interactions with the growth factor TGF-β3 present in the induction media.
In the current study, TGF-β3 was not adsorbed to the scaffolds before cell seeding but was present in the media, which could have impacted its level of interaction with the scaffold and cells. Although TGF-β3 binding studies demonstrated that comparable levels of TGF-β3 can bind to both pSC containing scaffolds, in cell culture experiments, the lower concentration of pSC did not enhance chondrogenesis to the same extent as the higher concentration of pSC. Various studies have shown differences in cell behavior when growth factors are added exogenously versus adsorbed on the scaffold before cell adhesion on the same scaffold formulations.43–45 In those studies, cell behavior was affected by sulfation of the scaffold and growth factor presentation. Future studies will investigate the effect of the presentation of TGF-β3 on the scaffold before cell seeding on chondrogenesis.
Gelatin scaffolds containing pSC were able to stimulate production of collagen type II and cell growth greater than cells on the gelatin control during chondrogenesis. Similar findings were also seen in studies using chondroitin sulfate. A significant increase in cell proliferation of rabbit conjunctive fibroblast occurred on electrospun collagen type I containing CSC compared to collagen alone. 33 Chen et al. used various types of chondroitin sulfates in media to stimulate the chondrogenesis of MSCs on collagen type II scaffolds and compared it to the effect of chondroitin sulfate crosslinked to the collagen type II scaffold. 43 Findings demonstrated that the presence of chondroitin sulfate was able to enhance chondrogenesis whether it was in media or bound on the scaffold when TGF-β3 was present. The results of the current study demonstrate that, like chondroitin sulfate, the presence of pSC in gelatin scaffolds enhanced the chondrogenesis of MSCs over gelatin alone.
The ratio of collagen type II to collagen type I production was measured as an indicator of differentiation into mature chondrocytes,46,47 where higher ratios indicate a more homogeneous cartilage-like matrix. Our studies determined the highest ratio at day 14 for the 5% pSC/Gel group and it remained unchanged by day 28. Marlovits et al. report that the decrease in this ratio, particularly in gene expression, correlated to the dedifferentiation of chondrocytes in a two-dimensional culture. 46 In the current study, cells on 5% pSC/Gel had significantly higher gene expression and protein production of collagen type II and the ratio of collagen types II to I compared to cells on gelatin alone. However, cells on all scaffold types in the current study also produced collagen type I with collagen types II to I ratios below 1, which indicates that MSCs may not have fully differentiated in culture.48,49 Unlike chondrocytes, MSCs in standard pellet cultures that have undergone chondrogenesis still produce collagen type I.25,50–52 Moreover, studies investigating MSC chondrogenesis on scaffolds that quantify collagen production measure total collagen content,53–56 which does not distinguish between collagen types II and I.
MSC chondrogenic differentiation was promoted on gelatin scaffolds containing pSC as indicated by the increased production of collagen type II compared to cells on gelatin alone. The presence of collagen type I indicates that a mixed population of progenitors and/or mature cells exist. However, when the total collagen type I production was normalized to cell number, there was significantly less collagen type I per cell on the 5% pSC/Gel scaffolds compared to the gelatin scaffolds, suggesting that the 5% pSC/Gel scaffold may be promoting a more homogeneous chondrocyte phenotype over gelatin alone. GAG content in the extracellular matrix would have been useful to measure as another indicator of chondrogenic differentiation. However, the GAG mimetic, pSC, in the scaffold is readily detected by standard GAG assays and can prevent accurate measurement of GAG content in the extracellular matrix.
Cells on 5% pSC containing gelatin scaffolds exhibited greater gene expression of chondrogenic markers compared to gelatin alone by day 28. Extracellular matrix-associated gene expression, aggrecan and collagen type II, was the highest on 5% pSC/Gel. Collagen type II expression for the 5% pSC group was an order of magnitude greater than all other groups and time points by day 28. This correlates with observed protein expression on 5% pSC/Gel scaffolds. Studies have reported an increase in collagen type II expression with an increase with collagen type II production.43,57,58 The increase in expression of aggrecan and collagen type II indicates chondrogenesis is being promoted. SOX9 is a transcription factor that is associated with initiating chondrogenesis.59,60 Expression of SOX9 was greatest for cells on 5% pSC/Gel at all time points. Although SOX9 is associated with initiation of chondrogenesis, studies have shown that SOX9 also maintains the chondrocyte phenotype61,62 and inhibits hypertrophy. 61
Chondroadherin is a mature cartilage marker that regulates chondrocyte growth.19,63,64 Cells on 5% pSC/Gel had the greatest expression of chondroadherin at day 28, suggesting the presence of a mature population of cells. Cells on all scaffold groups expressed collagen type I. Studies have used the ratio of collagen type II to collagen type I gene expression as a marker for differentiation.46,47 For 5% pSC/Gel, this ratio is an order of magnitude greater than all other groups. Along with chondroadherin expression, findings suggest that 5% pSC/Gel is promoting chondrogenic differentiation. Expression of collagen type X, which is used as a marker for hypertrophy, was also seen on cells of 5% pSC/Gel. There are many reports of MSCs that consider collagen type X expression as a marker for hypertrophy.62,65–68 Other reports observe the expression of collagen type X at day 16 in MSC pellet cultures undergoing chondrogenesis, suggesting that expression of collagen type X may not be a clear indicator of hypertrophy. 69
Conclusion
Cellulose sulfate, a GAG mimetic, is an attractive candidate as a scaffolding material for cartilage tissue engineering. The partial sulfation of cellulose sulfate, which has structural similarity to chondroitin sulfate, promoted both MSC chondrogenesis and growth demonstrating its potential as scaffold to support MSC/cell-based tissue engineering approaches for cartilage repair. In addition, TGF-β3 bound to a greater extent on the pSC containing scaffolds over gelatin alone, indicating the material may be suitable for complexing growth factors. These studies demonstrate the potential of pSC sulfate as a scaffolding material for cartilage tissue engineering.
Footnotes
Acknowledgments
The authors thank the National Science Foundation No. 1207173 and the Musculoskeletal Transplant Foundation for funding.
Disclosure Statement
No competing financial interests exist.