
Abstract
This study investigates the effect of incorporation of one- or two-dimensional nanoparticles with distinct composition and morphology on the bioactivity of biodegradable, biocompatible polymer matrices. 0.2 wt% multiwalled carbon nanotubes, multiwalled graphene nanoribbons, graphene oxide nanoplatelets (GONPs), molybdenum disulfide nanoplatelets (MSNPs), or tungsten disulfide nanotubes (WSNTs) were uniformly dispersed in poly(lactic-co-glycolic acid) (PLGA) polymer. PLGA or nanoparticle-incorporated PLGA were then incubated with simulated body fluid (SBF) under physiological conditions for 1, 3, 7, or 14 days. Apatite collection on control and incorporated scaffolds was assessed. All groups showed apatite precipitate on the surface after 1 day of SBF incubation. After 14 days of SBF incubation, scaffolds incorporated with GONPs, MSNPs, or WSNTs showed significantly higher phosphate accumulation compared to PLGA scaffolds. Scaffolds incorporated with GONPs, MSNPs, or WSNTs should be studied in vivo to further investigate potential bioactivity, leading to enhanced integration and tissue repair at the bone–implant interface.
Introduction
T
Various 1D and 2D carbon and inorganic nanoparticles such as carbon nanotubes, tungsten disulfide nanotubes (WSNTs), graphene nanoribbons, graphene nanoplatelets (GONPs), and molybdenum disulfide nanoplatelets (MSNPs) incorporated in polymers such as poly(lactic-co-glycolic acid) (PLGA), polypropylene fumarate, or polycaprolactone (PCL) have been examined.2–6 A large number of these studies have characterized the improvement in bulk mechanical properties of these polymers upon reinforcement with 1D or 2D nanoparticles.2,3,6–8 Studies have also investigated the surface properties of the nanoparticle-incorporated porous polymeric scaffolds through in vitro cytocompatibility or in vivo small animal biocompatibility studies.9–12
For orthopedic biomaterials, bioactivity is defined as their ability to stimulate bone growth through formation of a bone-bonding layer of apatite on the surface, which, in turn, can influence osteogenic cellular attachment and differentiation. 13 This attribute is different from osteoinductivity, where a material will induce mesenchymal stem cells or osteoprogenitors to differentiate into osteoblasts. 14 In vitro, bioactivity is commonly investigated by soaking a tissue engineering construct in simulated body fluid (SBF) with ion concentrations nearly equal to those of human blood serum, whereby apatite crystals selectively precipitate on the surface of a bioactive material.15–17
The surface properties of nanoparticle-incorporated polymeric scaffolds may induce bioactivity into a hitherto osteoconductive polymeric scaffold. The addition of nanoparticles to the polymer matrix creates more surface area and nanotopographies that could serve as nuclei for formation of apatite crystals. 15 This observation has been demonstrated for a variety of inorganic nanoparticles (hydroxyapatite, 18 bioactive glass, 19 titanium dioxide, 20 and magnetite 21 ) individually, 22 or when incorporated into biodegradable polymers.
However, few studies have investigated the influence of 1D and 2D carbon nanostructures4,23,24 on bioactivity of biodegradable polymer nanocomposites without the concurrent addition of hydroxyapatite nanoparticles. Zawadzak et al. employed polyurethane foams with multiwalled carbon nanotubes (MWCNTs) electrophoretically deposited on the surface and investigated the apatite formation after soaking in 1.5x concentrated SBF for 14 or 28 days. 24 Wan et al. examined the bioactivity of electrospun poly(caprolactone) or gelatin nanocomposites containing 0.3 wt% graphene oxide nanoplatelets (GONPs, prepared using the modified Hummer's method) after soaking in 10x concentrated SBF for 24 h.4,23 Furthermore, no studies have reported the bioactivity of 1D or 2D dichalcogenide nanostructures. In addition, studies that characterize and compare the bioactivity of 1D and 2D nanoparticle-incorporated polymeric scaffolds are warranted. 1D and 2D carbon nanostructures exhibit different morphologies, topographies, and chemical properties depending on synthesis method. These differences could influence the bioactivity of the biodegradable polymer nanocomposite scaffolds.
In this study, we have assessed and compared the in vitro bioactivity of 1D and 2D carbon and inorganic nanostructures upon incorporation into a known osteoconductive polymer matrix. MWCNTs, multiwalled graphene nanoribbons (MWGONRs), GONPs, MSNPs, or WSNTs were uniformly mixed at 0.2 weight percent in PLGA polymer. Porous scaffolds with 90% porosity were fabricated, and soaked in SBF for 1, 3, 7, or 14 days. The structural, chemical, and bioactivity properties were characterized by scanning electron microscopy (SEM), confocal Raman spectroscopy, total reflection X-ray fluorescence (TXRF), and calcium and phosphate assays.
Materials and Methods
Nanoparticle synthesis and characterization
MWCNTs possessing outer diameters between 20 and 30 nm were purchased from Sigma-Aldrich (Cat. No. 636487; St. Louis, MO). MWGONRs were synthesized from the MWCNTs using a modified longitudinal unzipping method. 25 GONPs were synthesized from graphite flakes using a modified Hummer's method. 26 MSNPs were synthesized through a high-temperature reaction between MoO3 and sulfur powder (Sigma-Aldrich). 27 WSNTs were purchased from APNano (Avenel, NJ).
All particles were characterized by high-resolution transmission electron microscopy (HRTEM) and Raman spectroscopy. For HRTEM, nanoparticles were dispersed in a solution of equal parts water and ethanol by sonication. Dispersion was followed by ultracentrifugation and the supernatant was drop cast on a lacey carbon grid (300 mesh size, copper support; Ted Pella, Redding, CA). HRTEM imaging was performed using a JOEL 2100F high-resolution analytical transmission electron microscope (Peabody, MA) with an accelerating voltage of 200 kV at the Center for Functional Nanomaterials, Brookhaven National Laboratory (Upton, NY). Raman spectra were recorded between 50 and 3750 cm−1 at room temperature using WITec alpha300R Microimaging Raman Spectrometer (Ulm, DE) equipped with a 532 nm Nd-YAG excitation laser.
Scaffold synthesis
PLGA (50:50 polylactic:glycolic acid; Polysciences, Warrington, PA) was dissolved in chloroform (Sigma-Aldrich). Nanoparticles (MWCNTs, MWGONRs, GONPs, MSNPs, and WSNTs) were dispersed in the solution by heating to 60°C for 1 h followed by sonication for 30 min to achieve loading of 0.2 wt%. PLGA with no added particles was used as control. Once well dispersed, scaffolds were prepared by adding polymer/nanoparticle solution to NaCl porogen (size range: 200–500 μm) at a ratio leading to 90% porosity in the final scaffolds and mixed thoroughly to create a paste. Scaffold porosity was calculated using the following equation
2
:
Where ɛ is the apparent porosity of the scaffold, VNaCl is the volume of NaCl porogen, and VNC is the volume of the nanocomposite. Volumes were calculated based on the theoretical density of NaCl = 2.16 g/cm3 and PLGA nanocomposites = 1.34 g/cm3.
The composite-porogen paste was pressed into cylindrical Teflon molds with a diameter of 6.5 mm and depth of 14 mm, and left for 72 h to evaporate off residual chloroform. Once dry, samples were pressed out of the molds and cut into thirds, creating three scaffolds with dimensions of 6.5 × ∼4.5 mm3. The porogen was removed by submersion in agitated deionized water for 1 week followed by vacuum drying.
SBF submersion
Six scaffolds from each group were sterilized by submersion in 70% ethanol for 30 min followed by 30 min exposure to ultraviolet light. Samples were placed in individual 20 mL scintillation vials and submerged in 20 mL SBF (composition compared to human blood plasma found in Table 115,16). Samples in SBF were placed under vacuum for 10 min to force the SBF within the pores of the scaffold and incubated at 37°C and 5% CO2 for 1, 3, 7, or 14 days with the SBF changed every 2 days. Each time the SBF was changed, the vacuum process was repeated.
SBF, simulated body fluid.
Scaffold structural analysis
Representative SBF soaked and nonsoaked scaffolds from each group and time point were selected for SEM analysis. Samples were imaged using a high-resolution analytical scanning electron microscope (JEOL 7600F) at the Center for Functional Nanomaterials. Samples were imaged using accelerating voltages between 5 and 10 kV and a secondary electron imaging detector.
Confocal Raman
For confocal Raman analysis, scaffolds were cut into 2 mm sections and pressed between two glass slides to flatten. Scaffolds were analyzed on a Renishaw inVia Confocal Raman Microscope (Wotton-under-Edge, UK) with a 20x objective and a 785 nm laser at 50% power, with a pin hole inserted for 180 s. Analysis was carried out in three separate areas of each scaffold and the characteristic peak for apatite (960 nm) was observed.
Total reflection X-ray fluorescence
After each time point, three scaffolds from each group were dissolved in 66% acetic acid. For TXRF, 1% gallium standard (10 mg/L) was added to each sample and 10 μL of solution was drop cast onto freshly cleaned quartz glass sample carriers coated with silicone solution (SERVA Electrophoresis GmbH, Heidelberg, DE). TXRF was carried out using an S2 PICOFOX (Bruker, Berlin, DE) with an exposure time of 250 s. Incident radiation from the instrument ejected electrons from nuclear orbit in the sample leading to a fluorescence event where X-rays characteristic of the elements within the sample were emitted. The fluorescence events for phosphorus and calcium were detected and used to calculate the concentrations of elements. Molar concentrations of calcium and phosphorus were used to calculate Ca/P ratios.
Calcium and phosphate assays
For calcium and phosphate assays, four samples from each group and time point were dissolved in 66% acetic acid. Calcium assay was performed by adding 20 μL of sample or calcium chloride standard to a 96-well plate in triplicates and adding 280 μL of Arsenazo III assay reagent (Thermo Fisher Scientific, Waltham, MA). Absorbance was measured at 650 nm on a SpectraMax M2E Microplate Reader (Molecular Devices, Sunnyvale, CA). For the phosphate assay, 100 μL of sample or potassium phosphate standard in acetic acid was added to a 96-well plate in triplicates and 50 μL of ammonium molybdate (Sigma-Aldrich) was added. Plates were incubated for 10 min and the absorbance was measured at 400 nm.
Statistics
A Kruskal–Wallis test with Dunn's post hoc was performed to assess significant differences in levels of calcium, phosphorus, and phosphate accumulation as measured by TXRF or calcium/phosphate assays with p < 0.05 being considered significant.
Results
Nanoparticle characterization
Representative HRTEM images of the nanoparticles are presented in Figure 1A–E. MWCNTs (Fig. 1A) were smooth cylindrical structures with diameters in the manufacturer-specified range of 20–30 nm and lengths in the range of 500–1500 nm. MWGONRs (Fig. 1B) were multilayered and have a ribbon-like appearance with widths of about 60–90 nm and similar lengths to the MWCNTs from which they were synthesized. GONPs (Fig. 1C) were disk-shaped particles with diameters in the range of 500–1500 nm. MSNPs (Fig. 1D) were platelet-shaped particles with diameters ranging from 40 to 90 nm. WSNTs (Fig. 1E) were smooth tube-shaped particles with diameters in the range of 50–100 nm and lengths ranging from 1 to 15 μm.
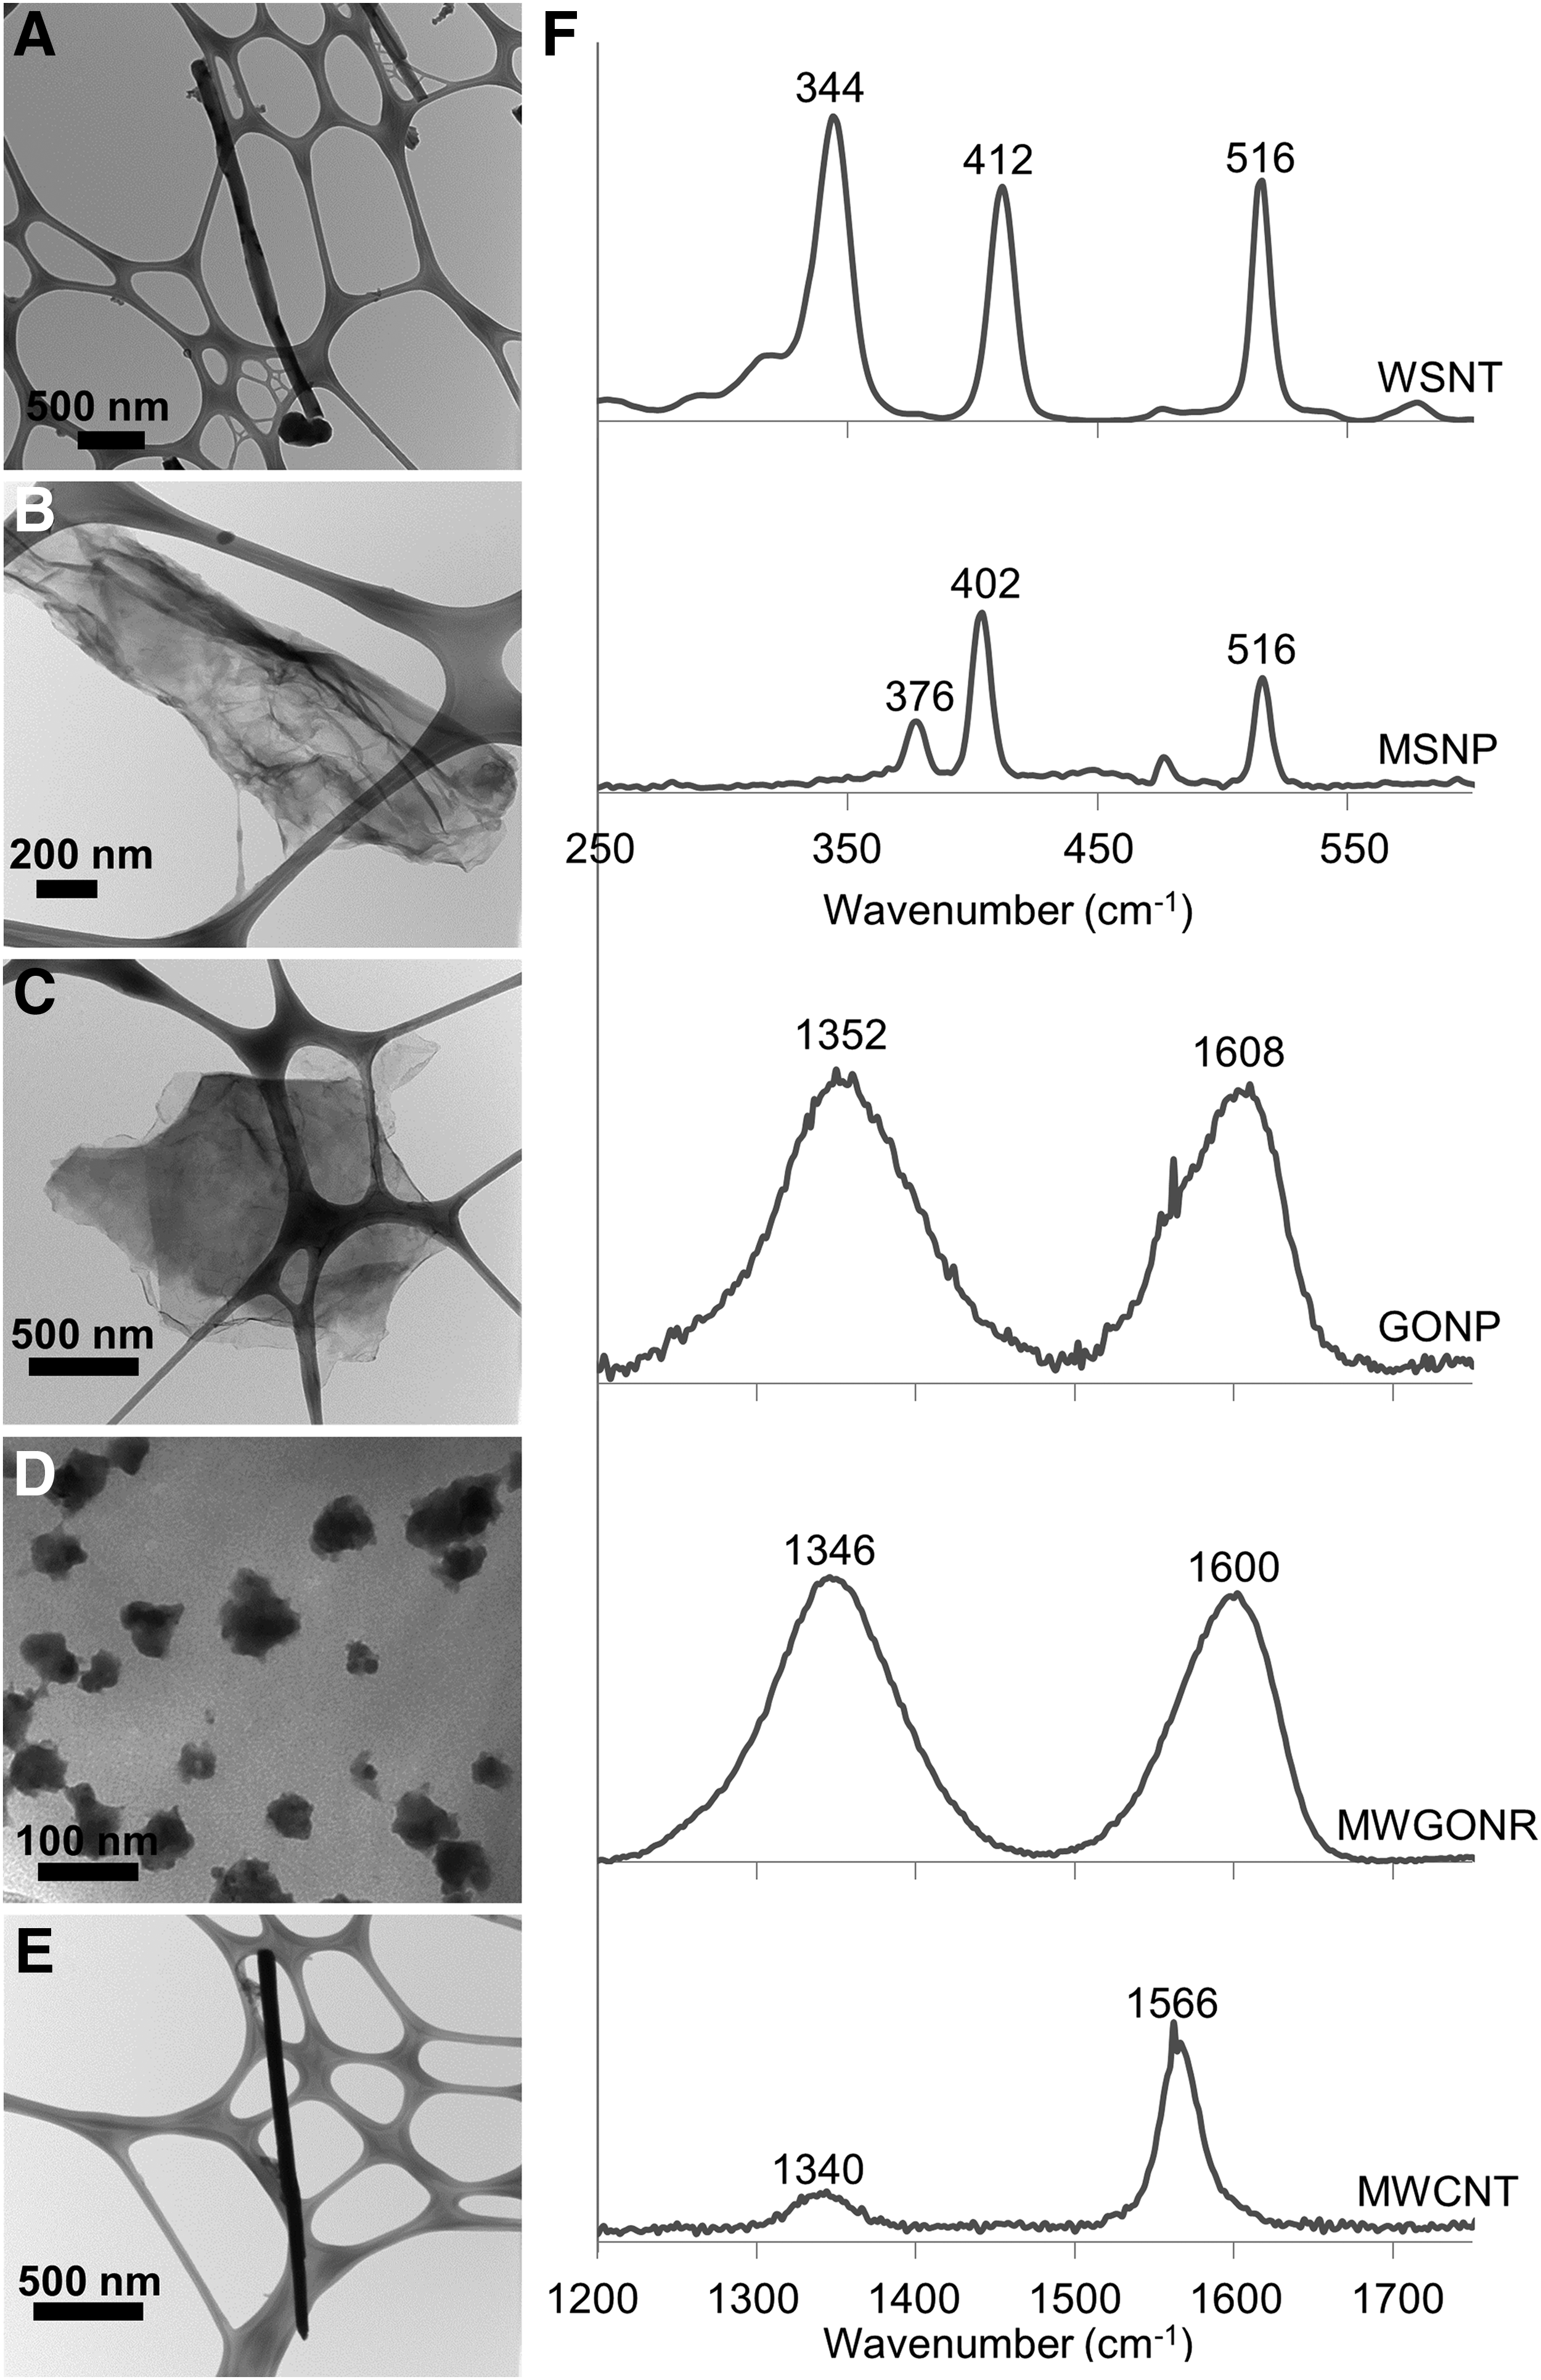
Representative HRTEM images.
Raman spectra for the nanoparticles are presented in Figure 1F. Peaks were observed at 1340 cm−1 (D band) and 1560 cm−1 (G band) for MWCNTs. Peaks were observed at 1346 and 1600 cm−1 for MWGONRs (Fig. 1F[ii]). Peaks were observed at 1350 and 1606 cm−1 for GONPs. MWCNTs, MWGONRs, and GONPs exhibit the characteristic D and G bands for graphene at about 1350 and 1580 cm−1, respectively. The G band is a first order and exists in all sp 2 carbon structures. This band represents the E2g mode or C–C stretching that occurs within the plane of carbon atoms. 28 The D band is also a first-order band representative of defects in the graphene structure. 28
Peaks were observed at 376, 404, and 476 cm−1 for MSNPs. Peaks were observed at 344 and 412 cm−1 for WSNTs. The two major bands observed in the Raman spectra of the inorganic nanoparticles, MSNPs and WSNTs, are characteristic of dichalcogenides representing the E2g 1 (in plane) and A1g (out of plane) Raman active modes, respectively.27,29 The small peak in the MSNP spectrum at 476 cm−1 can be attributed to unreacted MoO3 from the synthesis process. The peak at 516 cm−1 in both the spectra can be attributed to the silicon wafer.
Scaffold structural analysis
Figure 2 shows representative SEM images of control scaffolds or scaffolds incorporated with MWCNTs, MWGONRs, GONPs, MSNPs, or WSNTs incubated in SBF for 0, 1, 3, 7, or 14 days. For all groups, nodules of apatite (black arrows) can be observed on the polymer surface with the amount of apatite qualitatively increasing with increasing incubation time. A representative larger field of view before soaking in SBF can be found in Supplementary Figure S1 (Supplementary Data are available online at www.liebertpub.com/tea).

Representative scanning electron microscopy images. Surface morphology of control and nanoparticle-reinforced scaffold groups before soaking in SBF and after soaking for 1, 3, 7, or 14 days. Nodules of apatite observed after 1 day (black arrows). Scale bars = 20 μm. PLGA, poly(lactic-co-glycolic acid); SBF, simulated body fluid.
Confocal Raman
Figure 3 shows the results of confocal Raman analysis of control and nanoparticle-incorporated scaffolds soaked in SBF for 0, 1, 3, 7, or 14 days. On day 0, only peaks for PLGA polymer (∼880 cm−1) are observed for all groups. The characteristic apatite peak at 960 cm−1 appeared after 1-day incubation in SBF for all groups and follows an increasing trend toward 14 days of incubation. MWGONRs gave rise to strong fluorescence that dominated the spectra, obscuring the apatite and polymer bands, and therefore were not included.

Confocal Raman spectra. Collected from surface of control and nanoparticle-reinforced scaffolds before incubation in SBF
Total reflection X-ray fluorescence
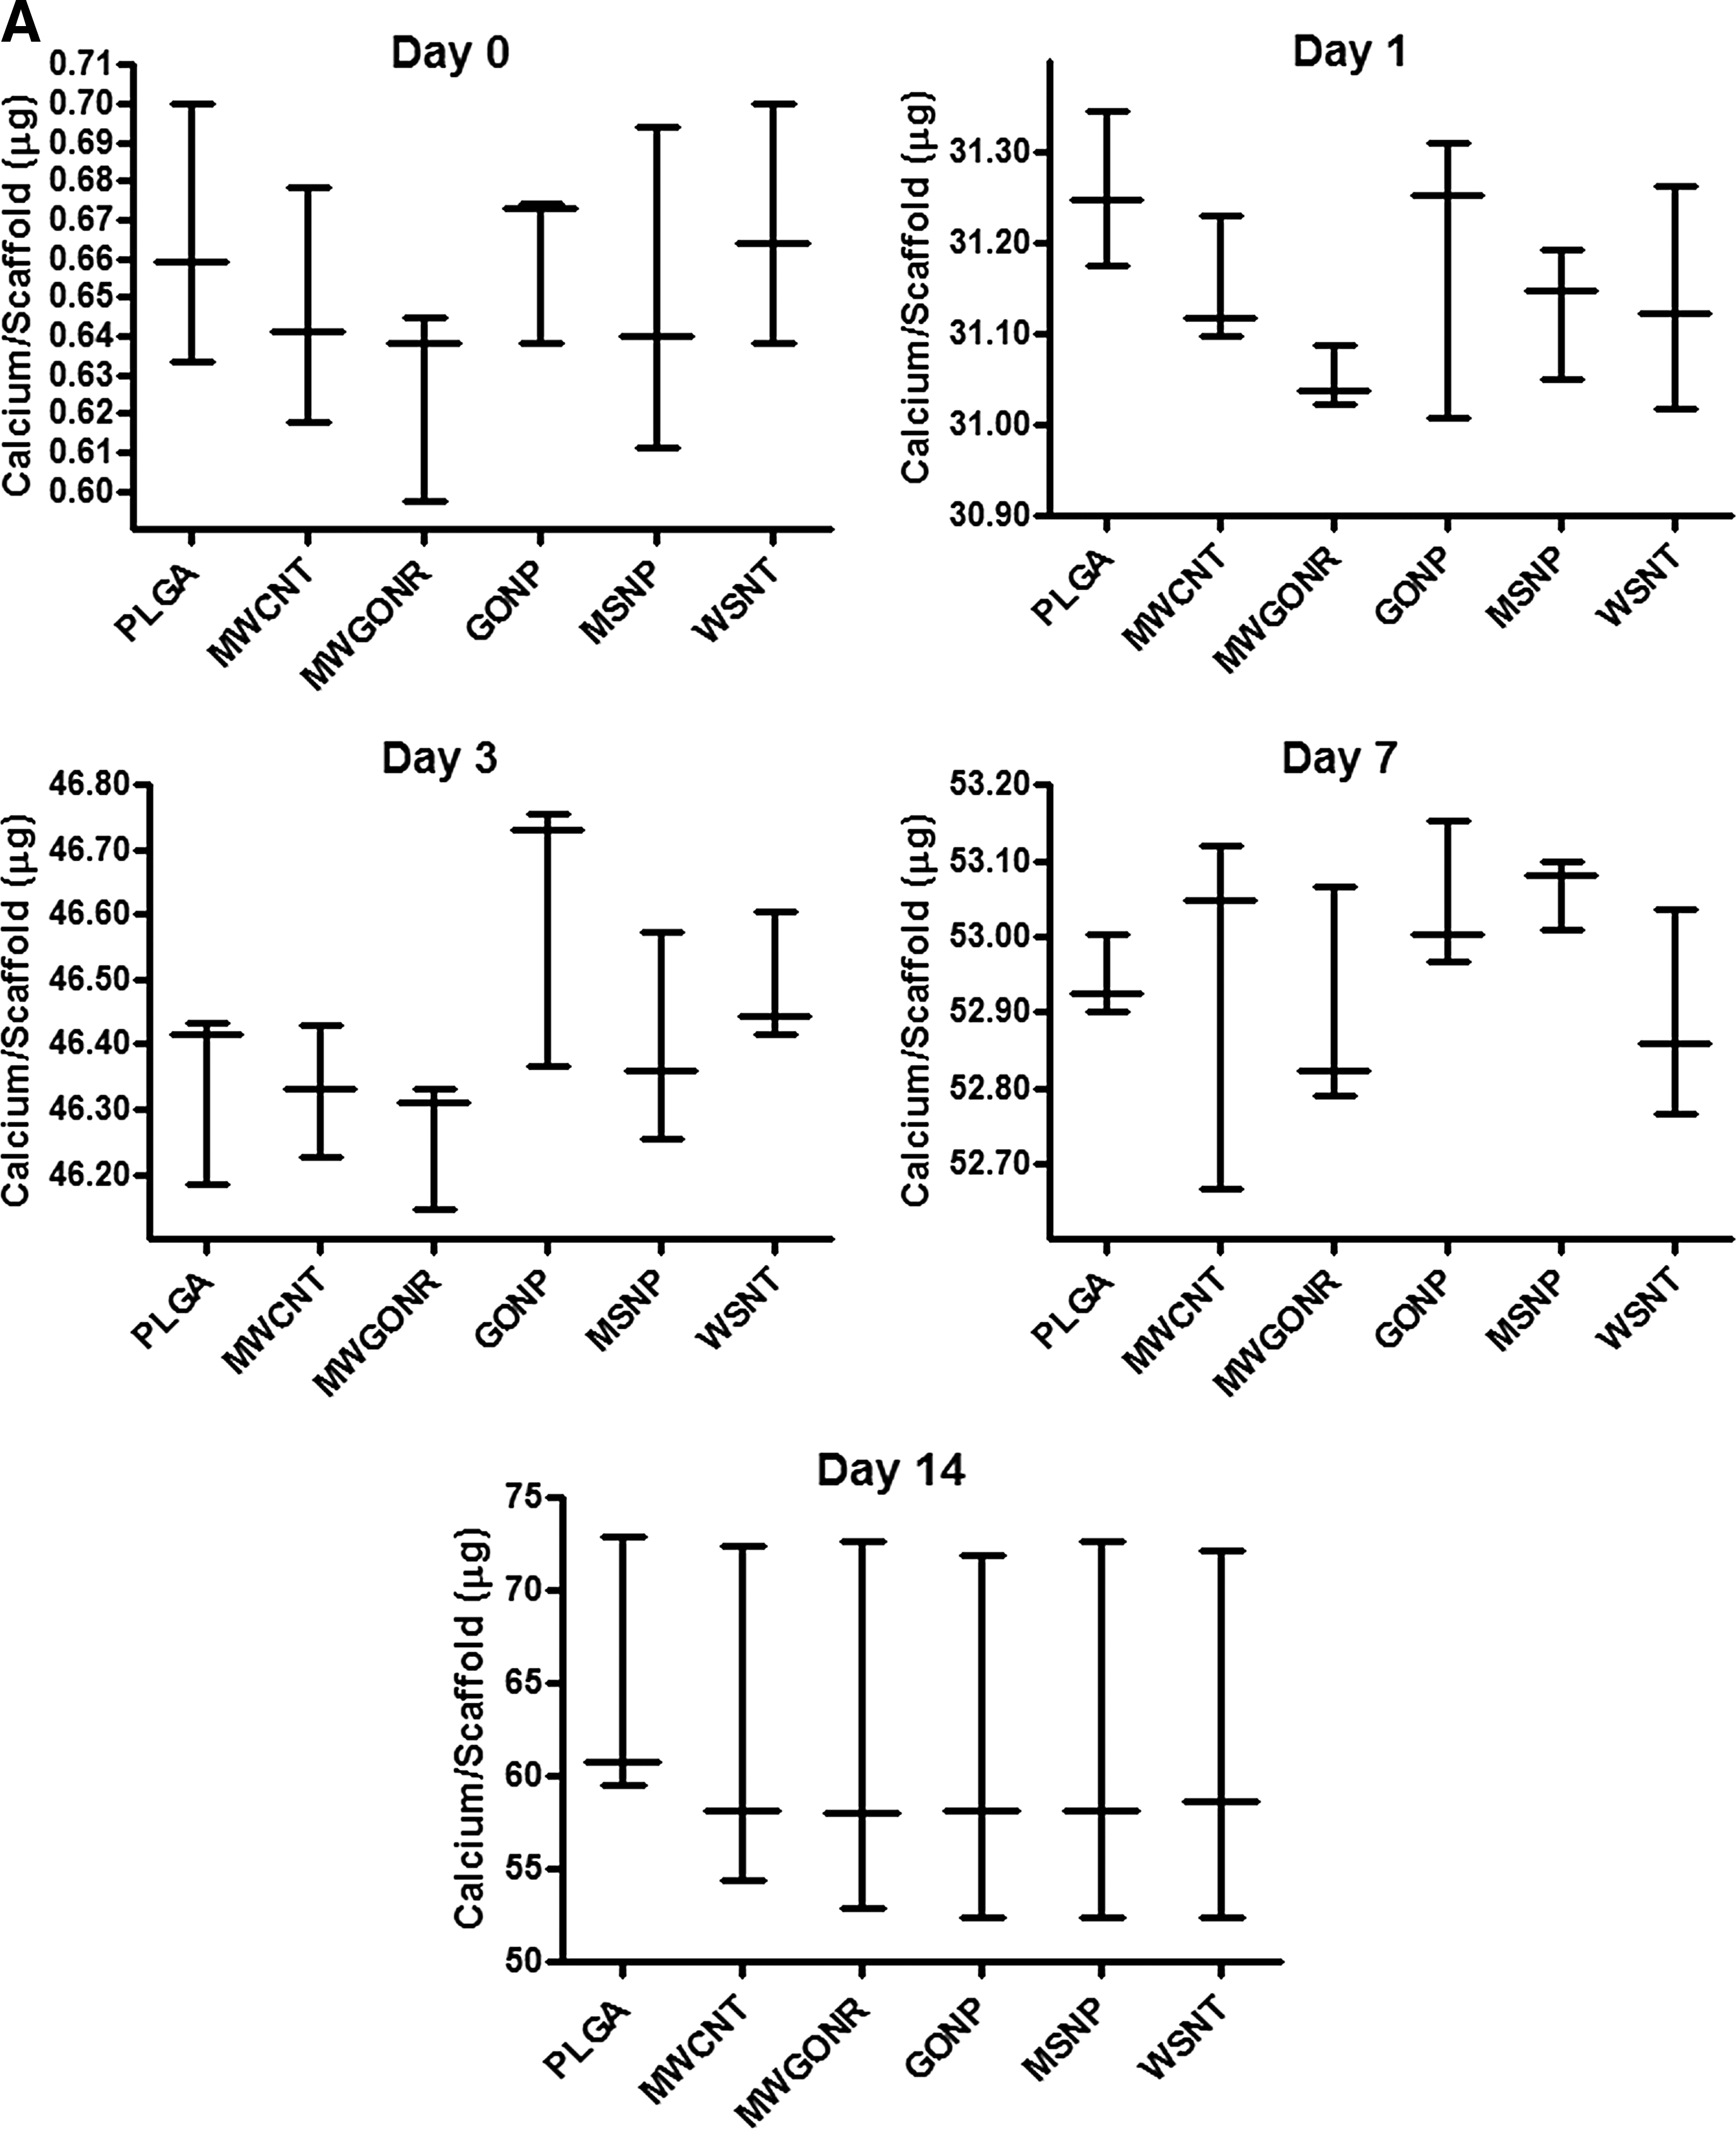
Figure 4 shows the quantity of calcium (Fig. 4A) and phosphorus (Fig. 4B) collection on control and nanoparticle-incorporated scaffolds over 0, 1, 3, 7, or 14 days incubation in SBF as found by TXRF analysis. The molar Ca/P ratio as calculated from the results is found in Figure 4C. Quantity of calcium increased throughout the time points with the highest amount occurring on day 14 of ∼64 μg for PLGA. Quantity of phosphorus increased at earlier time points and reached a maximum of ∼16 μg by day 3. It then decreased on day 7 and 14 with a lowest of ∼4.8 μg for MWGONR on day 14. The Ca/P ratio was below 1 before incubation in SBF, was above 1 after incubation, and significantly increased throughout the time points. The highest value was 9.79 for GONP-incorporated scaffolds by day 14. No significant differences in calcium, phosphorus, or Ca/P ratio were observed between groups at any time point.
TXRF results. Plots show TXRF results for
Calcium and phosphate assays
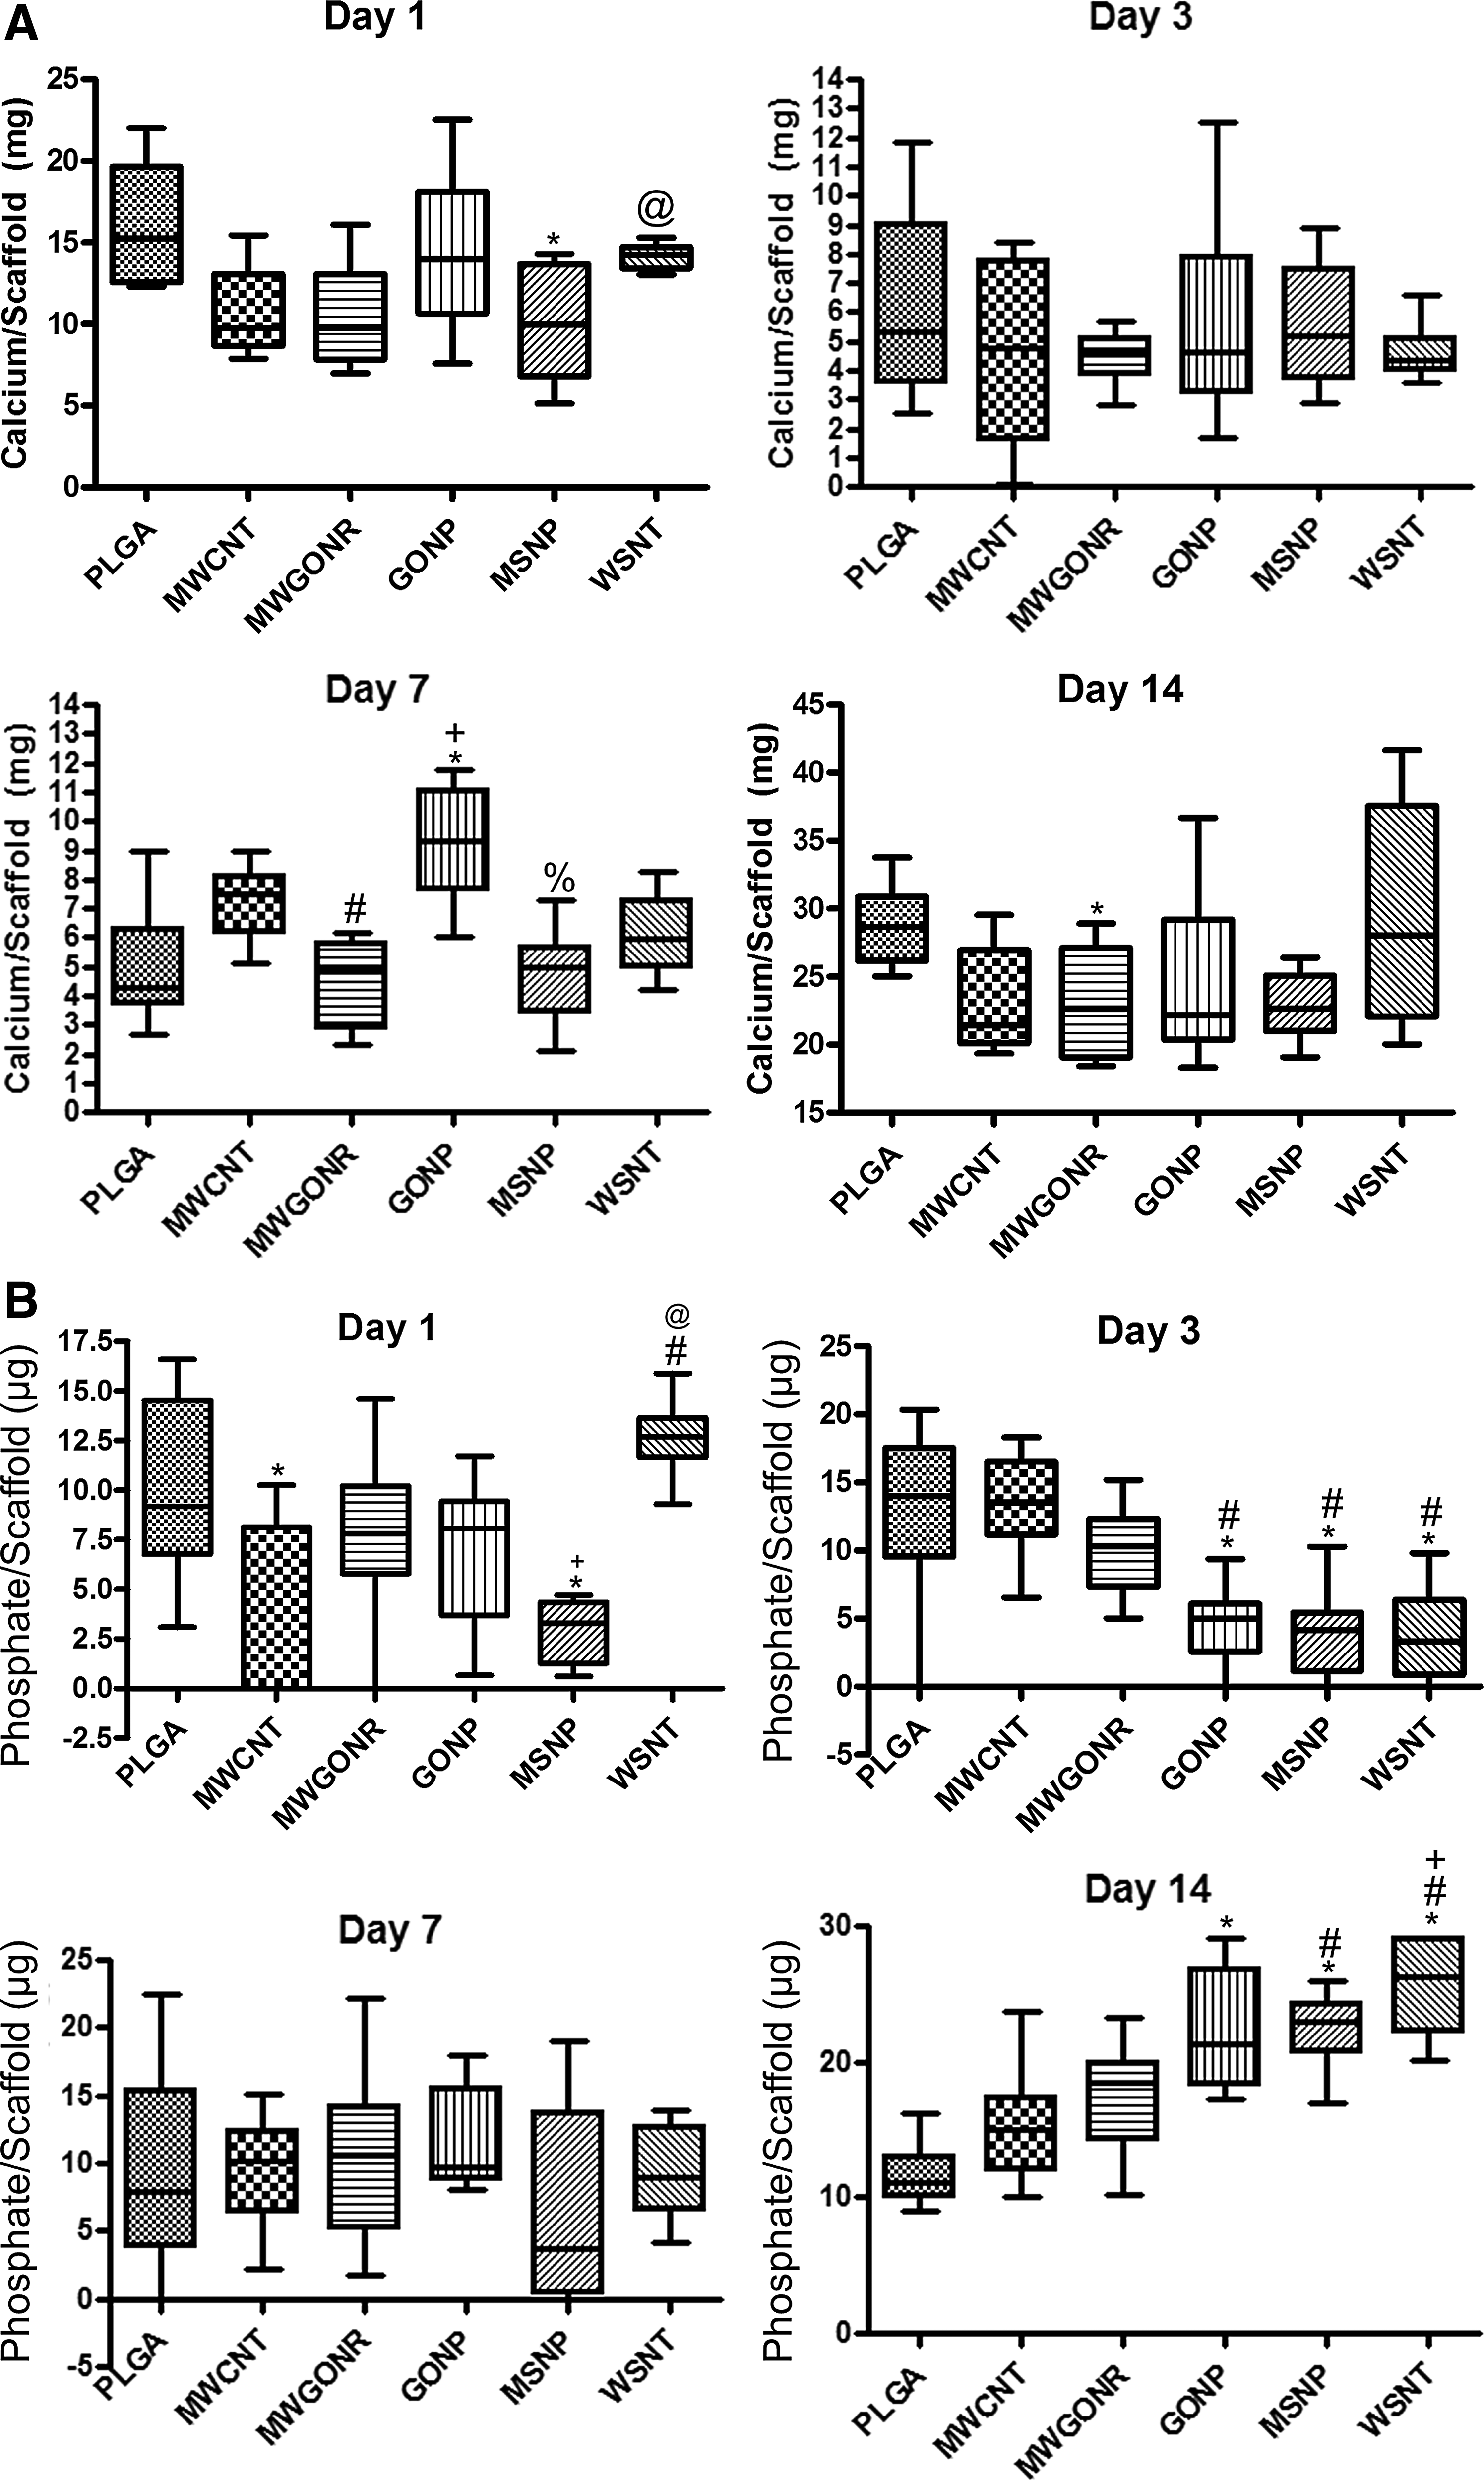
Figure 5 shows the calcium (Fig. 5A) and phosphate (Fig. 5B) quantified from control (PLGA only) or nanoparticle-incorporated scaffolds after incubation in SBF for 1, 3, 7, or 14 days. Overall, calcium quantity remained at similar levels through 7 days of incubation and increased by about 100% between day 7 and 14. After 1 day of incubation, the quantity of calcium was significantly higher on PLGA and WSNT scaffolds compared to MSNP-incorporated scaffolds. No differences were observed after 3 days of incubation in SBF. After 7 days of incubation in SBF, GONP-incorporated scaffolds showed significantly higher calcium compared to PLGA-, MWGONR-, and MSNP-incorporated scaffolds, while MWCNT-incorporated scaffolds showed significantly more calcium than MWGONR-incorporated scaffolds. After 14 days of incubation PLGA scaffolds showed significantly higher (as much as 20%) calcium collection compared to MWGONR scaffolds.
Calcium and Phosphate Assays. Box plots show results of
Phosphate values were approximately similar through the first 7 days of incubation. The values increased for GONP-, MSNP-, and WSNT-incorporated scaffolds on day 14. After 1 day of incubation, phosphate amounts on PLGA were significantly greater than MWCNT- and MSNP-incorporated scaffolds. WSNT-incorporated scaffolds had significantly greater phosphate collection compared to MWCNT- or MSNP-incorporated scaffolds. After 3 days of incubation, PLGA scaffolds and scaffolds incorporated with MWCNTs had significantly greater phosphate accumulation than GONP-, MSNP-, or WSNT-incorporated scaffolds. No significant differences in phosphate collection were observed after 7 days of incubation in SBF. After 14 days of incubation, PLGA had significantly less phosphate compared to groups incorporated with GONP, MSNP, or WSNT, accumulating just 46% of WSNT scaffold levels. MWCNT-incorporated scaffolds accumulated significantly less phosphate compared to MSNP- and WSNT-incorporated scaffolds, and MWGONR-incorporated scaffolds accumulated significantly less phosphate compared to WSNT-incorporated scaffolds.
Discussion
The objective of this study was to investigate and compare the effect of 1D and 2D carbon and inorganic nanoparticles on the bioactivity of osteoconductive biodegradable polymer scaffolds. In the realm of bone tissue engineering, bioactivity is a material property, an ability to influence bone regeneration through formation of a bone-bonding layer of apatite on the surface. The amount of bioactive influence a scaffold will elicit is strongly dependent on surface properties and chemistry. 14 Therefore, nanoparticles with distinct composition (organic or inorganic) and morphologies (nanotubes, nanoplatelets, or nanoribbons) were incorporated into PLGA-based scaffolds at a concentration of 0.2 wt% and the bioactivity was tested through incubation in SBF for up to 14 days under physiological conditions.
PLGA was selected for the biodegradable polymer matrix due to the large body of research around PLGA scaffolds.17,18,30,31 It is also approved for clinical use by the Food and Drug Administration. 32 0.2 wt% nanoparticle incorporation was chosen as this concentration has previously been shown to be cytocompatible when incorporated into biodegradable polymeric scaffolds. 9 In addition, previous studies have found that 0.2 wt% loading of MWGONRs, GONPs, MSNPs, or WSNTs, which if released from a 90% porous scaffold with volume 10 cm3 equals about 20 μg/cm3, is potentially safe for stem cells.27,33 14 days of incubation in SBF was chosen as this was the longest time allowable to observe growth of an apatite layer in all groups without significant degradation of polymer; however it should be noted that that longer incubation times may lead to further growth of this layer. 34 Longer incubation times would require the use of PLGA formulation with a higher ratio of lactic acid to glycolic acid, decreasing hydrophilicity of the polymer and slowing degradation. 32 This would lead to slower change in morphology of the polymer and release of nanoparticles, allowing increased time for apatite nucleation.
Raman spectroscopy of the nanoparticles before scaffold incorporation is presented in Figure 1F. The ratio of the intensities of the D and G bands is commonly used to infer the amount of defects in the graphene sheet. 35 Therefore, the increased ID/IG ratio for MWGONRs and GONPs compared to pristine MWCNTs implies disruption of the sp 2 -bonded carbon owing to oxidative unzipping of nanotubes during synthesis. 26 The small shifts in Raman spectra for the inorganic dichalcogenides compared to previous reports could be due to variations in the number of layers in the prepared sample. 36
SEM image analysis (Fig. 2) of PLGA and nanoparticle-incorporated scaffolds soaked in SBF over 14 days showed small seed structures that appeared after just 1 day of incubation (black arrows). Such seed structures typically suggest the presence of apatite crystals. The seed structures showed an increase in size with increase in time. Such increases were previously noted and attributed to carbonate incorporation into the mineral structure. The carbonate substitutes for OH or PO43−, which causes apatite crystal morphology to become more spherulitic structures. 37 Nanoparticles were not distinctly observed in SEM images most likely due to their enfoldment in the polymer and the low SEM magnification.
Confocal Raman analysis (Fig. 3) showed the peak for apatite at 960 cm−1, representing the symmetric stretching of the PO43− group, after 1 day of incubation in SBF. The variability in peak strength across the lower time points could be explained by the nonhomogenous deposition of the apatite layer. With the increase in apatite formation with increase in time, the deposition becomes more ubiquitous and the 960 cm−1 peak becomes more prominent (Fig. 3E). 38
Both TXRF and calcium and phosphate assays were used to quantify the apatite collection. This is because, while the TXRF instrument is more accurate and precise than the calcium and phosphate assays, it is also very sensitive and at a higher risk of contamination by outside sources. This allowed comparison of trends and values between the techniques. Line graphs showing the technique comparison for calcium and phosphorus/phosphate collection can be found in Supplementary Figures S2 and S3. Indeed, the concentration of calcium as detected by TXRF and calcium assay showed similar trends, but a different range of values (Supplementary Fig. S2). This variability may be due to the potential of Arsenazo III to react with trace metals or other interferents that may have been present during the assay. 39 However, the results from both measurement techniques are in agreement that the addition of nanoparticles to the PLGA matrix does not hinder calcium collection on the scaffolds.
The amount of phosphorus detected by TXRF and phosphate detected by the phosphate assay showed similar range of values at the various time points, but different trends (Supplementary Fig. S3). Phosphorus amounts increased to a maximum by day 3 and then decreased through day 14, while quantity of phosphate continued to increase throughout the time points with the major increases occurring between days 7 and 14. By day 14, the amount of phosphorus was about 1/2 to 1/3 that of phosphate, which is similar to the stoichiometric proportion of phosphorus in phosphate (0.326).
The Ca/P ratio (Fig. 4C) increased throughout the time points due to increasing calcium concentration and decreasing phosphorus concentration. By day 14, the ratio was as high as 9.79, much greater than the Ca/P ratio of bone (1.5–1.7) 40 or the highest known stable calcium phosphate compounds (∼2). This may indicate that there are ions of free calcium on the sample surface. 41
Results from the phosphate assay (Fig. 5B), which showed the greatest increase in phosphate accumulation at the 14-day time point, are in agreement with the results of the calcium assay, implying that the majority of mineralization occurred between days 7 and 14. This significant increase in phosphate, after 14 days of incubation in SBF, detected on GONP, MSNP, and WSNT nanoparticle-incorporated scaffolds compared to the PLGA control suggests that these nanoparticles act as nucleation sites for apatite formation. 42 This result may relate to the dependence or interdependence of factors such as the charge of the nanoparticles, dimensions, and composition. The charge on the nanoparticles due to the presence of functional groups may play a role, as negatively charged implant surfaces (due to presence of carboxyl groups) have been shown to act as nucleation sites for apatite formation. 43 The Raman showed similar spectra for MWGONRs and GONPs. It can be inferred from this result that both nanoparticles have similar number of carboxyl groups and hence similar charge. Thus, a similar bioactive effect could be expected for both nanoparticles. While MWGONRs show larger amounts of phosphate compared to the PLGA control, their values are lower than those of GONPs. Thus, charge alone could be not considered the dominant factor.
The varying sizes (or aspect ratios) and compositions of the nanoparticles may explain the different extent to which phosphate collected on the incorporated scaffolds compared to control. Looking at the effect of size in terms of aspect ratio (ratio of breadth or diameter:length), the organic particles follow the trend, nanoplatelets (2D) > nanoribbons (2D) > nanotubes (1D), while the inorganic particles follow the trend, nanotubes (1D) > nanoplatelets (2D). GNPs and MSNPs have similar aspect ratios, but the absolute length and breadth values of GNPs are significantly greater than inorganic nanoparticles (MSNPs). Yet, both these nanoparticles show equal phosphate concentration. Thus, composition could also play a greater role with inorganic being more favorable than carbon nanoparticles.
To the best of our knowledge, this is the first report investigating and comparing the bioactivity of 1D and 2D as well as organic and inorganic nanomaterials as reinforcing agents toward application as biomedical implants for bone tissue engineering. Previous reports have mainly focused on 1D or 2D carbon nanostructures along with hydroxyapatite particles dispersed in polymeric matrices. However, direct comparisons of our results with those reports are not possible since the results presented in those reports were mainly qualitative, and due to the inclusion of apatite.9,42,43 Fewer reports have presented the bioactivity in SBF of 1D or 2D carbon nanostructures incorporated in osteoconductive polymer matrices without additional inclusion of hydroxyapatite.4,23,24
Wan et al. incorporated low concentrations (0.3 wt%) of GONP into PCL or gelatin nanocomposites.4,23 Zawadzak et al. used electrophoretic deposition to coat polyurethane foams with MWCNTs. 24 Both these studies indicated that the addition of carbon nanoparticles enhances the accumulation of apatite on scaffold surfaces compared to polymer alone.4,23,24 However, our results indicate that, while GONPs significantly enhance the accumulation of apatite crystals onto scaffold surfaces, the enhancement due to the presence of MWCNTs was not statistically significant. This difference in results may be explained by the higher concentration of MWCNTs (0.5–0.6 mg/cm3) used by Zawadzak et al. 24 to coat the polyurethane foams compared to the ∼20 μg/cm3 incorporated into PLGA polymer in this study.
Our results indicate that the 1D and 2D inorganic nanoparticles in general are equivalent or better at enhancing the bioactivity of the polymeric scaffolds compared to 1D and 2D carbon nanoparticles. Other studies also suggest that the 2D inorganic (MSNP) and carbon (GONP) nanoparticles incorporated in biodegradable osteoconductive polymeric matrices improve the bulk (mechanical) properties, 2 and are cytocompatible.2,9 Through comparisons of bioactivity for polymer nanocomposites incorporated with various 1D or 2D, organic or inorganic nanoparticles, this work significantly contributes to the existing body of work surrounding bioactive nanostructure-incorporated polymer nanocomposites. In addition, the enhanced phosphate results of the 2D GONP- and MSNP- incorporated scaffolds and 1D WSNT-incorporated scaffolds give additional support toward their application in bone tissue engineering. Further studies of these particles should be conducted in vivo to investigate their bioactivity as well as biocompatibility.
Conclusions
We report the influence of nanoparticle composition and morphology on the formation of an apatite layer to determine what properties show the most promise toward application as bone tissue engineering scaffold reinforcing agents. Apatite nodules formed on the surface of PLGA and all nanoparticle-incorporated scaffolds after incubation in SBF for up to 14 days. Apatite presence was confirmed by confocal Raman analysis. GONP-, MSNP-, and WSNT-incorporated groups showed significantly greater phosphate accumulation compared to PLGA alone. The results suggest that GONPs, MSNPs, and WSNTs at 0.2 wt% in PLGA porous scaffolds should be studied in vivo to further illustrate the potential bioactivity. This study of a broad range of nanoparticles allowed identification of specific nanoparticle properties that may be most promising for eliciting a bioactive response when implanted in hard tissue.
Footnotes
Acknowledgments
This work was supported by the National Institutes of Health (Grant No. 1DP2OD007394-01). Research was carried out, in part, at the Center for Functional Nanomaterials, Brookhaven National Laboratory, New York, which is supported by the U.S. Department of Energy, Office of Basic Energy Sciences, under Contract No. DE-AC02-98CH10886. Confocal Raman data were acquired in SoMAS' NAno-Raman Molecular Imaging Laboratory (NARMIL), a community facility dedicated to environmental sciences' applications and founded with NSF-MRI (Grant No. OCE-1336724).
Disclosure Statement
No competing financial interests exist.
References
Supplementary Material
Please find the following supplemental material available below.
For Open Access articles published under a Creative Commons License, all supplemental material carries the same license as the article it is associated with.
For non-Open Access articles published, all supplemental material carries a non-exclusive license, and permission requests for re-use of supplemental material or any part of supplemental material shall be sent directly to the copyright owner as specified in the copyright notice associated with the article.