
Abstract
Understanding how key signaling molecules are coregulated by biochemical agents and physical stimuli during stem cell differentiation is critical but often lacking. Due to the important role of extracellular signal-regulated kinase (ERK), this study has examined its temporal dynamics to determine the coregulation of mechanochemical cues on ERK phosphorylation for smooth muscle cell (SMC) differentiation. To assess ERK1/2 activity, a fluorescence resonance energy transfer-based biosensor was transfected into mesenchymal stem cells. The influences of nanopatterned substrates, growth factors, and drugs on ERK activities were related to their effects on SMC differentiation. Results revealed that nanopatterned substrates significantly increased ERK activity in cells, overriding ERK response from administered biochemical factors. The nanopatterned substrates reduced expression of SMC markers after a 48-h biochemical treatment, except for the combination with ERK inhibitor PD98059 treatment, which enhanced expression of mature SMC marker MYH11. Immunofluorescent staining for focal adhesion proteins, vinculin and zyxin, indicated no significant differences in vinculin cluster distribution or dimension, while the location of zyxin changed from adhesion sites of cell periphery on nonpatterned substrate to actin filaments on nanopatterned substrate. The zyxin-reinforced stress fibers likely enhanced the cytoskeletal tension to increase ERK dynamics. Collectively, results suggest that physical stimuli play a dominating role in initial ERK signaling and early-stage differentiation through focal adhesion changes, and the capability of monitoring signaling events in real time could be exploited to guide the engineering of cell microenvironment.
Introduction
M
Extracellular signal-regulated kinase (ERK), of the mitogen-activated protein kinase (MAPK) family, is implicated as a regulator of differentiation in MSCs. Previous studies reported that osteogenic differentiation induced by collagen I and vitronectin was abrogated in human MSCs using the MEK inhibitor PD98059, 11 while thromboxane A2 (TXA2) analog U46619 was implicated in late-stage differentiation of adipose-derived MSCs to SMCs by affecting the ERK signaling pathway.12,13 Furthermore, inhibition of ERK by PD98059 was found to induce SMC-like differentiation in bone marrow-derived MSCs through the expression of late-stage SMC markers and contractility. 14 In addition to biochemical stimuli, mechanical forces also activate ERK through integrin focal adhesion complexes and the Ras-Raf-MEK-ERK signaling cascade. 15 Cyclic strain increases matrix mineralization with MSCs in osteogenic differentiation media through the ERK pathway, 16 while uniaxial alignment of MSCs promotes myogenic marker expression when compared to variable direction stresses with reduced focal adhesion kinase activity. 6 However, such studies only provide insights into ERK activity at specified time points, that is, 24 or 48 h, limiting our knowledge of how these important early messengers are activated in a temporal manner. Unraveling the dynamic roles of ERK signaling in response to different mechanochemical stimuli could tremendously inform optimization of MSC differentiation protocols as well as provide valuable insights toward fundamental mechanisms associated with vascular differentiation.
Fluorescence resonance energy transfer (FRET)-based biosensors provide a way to visualize protein activity with high temporal resolution and have been utilized successfully in biosignaling studies.17–19 In this study, we transfected a previously demonstrated FRET biosensor for cytoplasmic ERK 20 into rat bone marrow-derived MSCs to quantify ERK activity in response to several biochemicals such as growth factors and physical stimuli (topography) known to induce differentiation toward vascular SMCs. We used substrates with submicron grating pattern on polydimethylsiloxane (PDMS) to investigate the effects of anisotropic nanotopography on ERK activity alone or in concert with several biochemical factors. We further correlated cellular ERK activity with vascular SMC differentiation of MSCs exposed to different mechanochemical environments. Our data reveal that patterned substrates increased ERK activity in MSCs with or without the presence of growth factors. Furthermore, SMC phenotypic expression was inhibited on patterned substrates alone but could be activated with the inhibition of ERK signaling. We further found enhanced SMC phenotypic expression by combining mechanochemical environments (patterned substrate with ERK inhibition). Altogether, our data suggest that the integration of biochemical and biomechanical stimuli provides critical inputs into the early signaling of ERK, which may have profound downstream implications toward the differentiation of MSCs.
Experimental Methods
Cell culture
P3–P6 rat MSCs, bought (Lonza Group Ltd., Switzerland) or harvested, were seeded, cultured, and maintained in Dulbecco's modified Eagle's media (Hyclone, Logan, UT), with 10% defined FBS (Hyclone) and 1% Penn/Strep (Invitrogen, Carlsbad, CA) at 37°C and 5% CO2. Media were replaced every 2–3 days.
Biochemical treatment
Cells were serum starved for 12 h in 1% FBS media without phenol red or riboflavin before addition of biochemical factors. Biochemical factors were used at these concentrations unless otherwise stated: MEK inhibitor PD98059 (10 μM; Cell Signaling Technology, Danvers, MA), TGF-β1 (10 ng/mL; GenScript, Piscataway, NJ), epidermal growth factor (EGF) (10 ng/mL; Novoprotein, Summit, NJ), and thromboxane (TXA2) analog U46619 (1 μM; Enzo Life Sciences, Inc., Farmingdale, NY). The ranges of the biochemical concentrations were chosen according to the established literature. Cells were seeded at a density of 1 × 10⁴ cells/cm2. Supplementary Figure S1 (Supplementary Data are available online at www.liebertpub.com/tea) shows combinations of cell density and biochemical concentrations tested for ERK activity. A seeding density of 1 × 10⁴ cells/cm2 was chosen, along with concentrations commonly found in the literature for the experiments that follow, because this combination yielded the clearest separation of measured ERK activity signal for the tested biochemical factors.
Transfection and selection
Cells expressed the biosensor through stable transfection with NES-EKAR plasmid and piggyBac retrotransposon plasmid (gift from Dr. Xuedong Liu, University of Colorado) using Lipofectamine 3000 (Life Technologies, Grand Island, NY) and were selected using blasticidin S (10 μg/mL; Invivogen, San Diego, CA) for 60 h. Transfected cells were imaged using a Zeiss Axiovert 40 CFL microscope (Carl Zeiss Microscopy, Thornwood, NY) with FITC filter.
FRET imaging
Cells were cultured on 96-well glass-bottomed MicroWell plates (Brooks Life Sciences, Chelmsford, MA) treated with fibronectin (10 μg/mL; EMD Millipore, Billerica, MA). Cells were imaged at 37°C and 5% CO2 in 1% FBS media without phenol red or riboflavin using ImageXpress MicroXL microscope (Molecular Devices, Sunnyvale, CA) with Chroma filters T455lp and ET535/30m (Chroma Technology Corporation, Bellows Falls, VT) for ECFP and ECFP/EYFP-FRET, respectively, at 10 × magnification. Images were captured at three frames an hour using MetaXpress software. Background correction and quantification were processed using MATLAB.
Nanoimprint lithography
The fabrication method was developed and detailed previously. 21 A solution of poly(acrylic-acid) (PAA) in deionized water (10 wt%) was used to spin coat a thin film of PAA on top of an SiOx wafer surface. Spin coating was performed at 2000 RPM for 2 min. Nanoimprint lithography (NIL) (Eitrie 3; Obducat) was then used to impose a line-space grating pattern on the PAA (height = 220 nm, Λ = 880 nm, a line-to-space ratio, Rls = 1). Polyethylene terephthalate (PET) spacers with a thickness of 150 μm were then placed onto the PAA films. Polydimethylsiloxane (PDMS, Sylgard-184 manufactured by Dow Corning, Midland, MI) precursors were mixed (10:1, oligomer to crosslinking agent ratio) and then poured onto the patterned PAA. A glass slide was then placed on top and affixed with binder clips. The final apparatus consisted of a glass slide and coated wafer separated by a cavity (created by the PET spacer) containing PDMS. The PDMS was cured at 70°C for 8 h. On removal, the PAA pattern had been replicated onto the PDMS surface. The PDMS surfaces were cleaned using ethanol and phosphate-buffered saline (PBS) and placed in a vacuum oven for 30 min at 85°C before UV sterilization for 5 min. PDMS surfaces were incubated with fibronectin solution (10 μg/mL) for 2 h at 37°C before cell seeding.
Immunofluorescent staining, imaging, and measurement
Samples were fixed using 4% formaldehyde for 15 min at room temperature, quenched with 0.1 M glycine for 10 min at room temperature, and permeabilized with 0.2% Triton-X for 10 min at room temperature with three rinses of PBS between each step. Blocking was performed with either goat or donkey serum, and the primary antibody was incubated for 1 h at 37°C with a 1:50 dilution. Primary antibodies were purchased from Santa Cruz Biotechnology and include rabbit polyclonal anti-α-actin, mouse monoclonal anti-MYH11 (G-12), 22 mouse monoclonal anti-calponin 1 (CALP), mouse monoclonal anti-vinculin (7F9), and goat polyclonal anti-zyxin (N-19). After the unbound primary antibody was washed away, samples were incubated with either Alexa Fluor 488- or Alexa Fluor 647-conjugated anti-IgG secondary antibodies (Life Technologies) for 1 h at room temperature at a 1:500 dilution. Cell nuclei were counterstained using DAPI (Sigma-Aldrich, Inc., St Louis, MO) and permanently mounted using Vectashield Hard Set (Vector Laboratories, Burlingame, CA). Cells were imaged using Nikon A1-R confocal microscope running NIS-Elements 4.0 at either 20 × 0.5 NA or 40 × 0.5 NA objective with the pinhole set at 1.2 airy units. Maximum intensity projections were generated from z-stacks for fluorescence intensity measurement. Single cell intensity was measured according to published methods.23,24 Briefly, cells were outlined and the corresponding area and integrated density were measured using Fiji, ImageJ. 25 For each sample, regions without cells were measured and averaged to yield background integrated density. To calculate the corrected total cell fluorescence, these data were imported into Microsoft Excel and the following calculation was performed: Integrated density − (Area of cell) × (Background integrated density). Vinculin cluster dimensions were also manually measured using Fiji's built-in measuring tools.
Scanning electron microscopy imaging
Samples were sputter coated with gold before scanning electron microscope (SEM) imaging. The substrates were mounted and observed under an SEM (JEOL JSM-6480, JEOL USA, Peabody, MA) operating at an accelerating voltage of 5 kV.
Quantitative real-time polymerase chain reaction
Total RNA was extracted from samples using TRI Reagent (Zymo Research, Irvine, CA), quickly followed by further purification with Direct-zol™ RNA Miniprep Plus (Zymo Research) as per the manufacturer's instructions. Quantification of mRNA was performed on a NanoDrop 2000 spectrophotometer (Thermo Scientific). Single-stranded complementary DNA (ss-cDNA) was synthesized from RNA with the iScript cDNA synthesis kit (Bio-Rad, Hercules, CA) using a Hybaid PCR Express thermal cycler as per the manufacturer's instructions. RT2-qPCR primer assays were performed using iQ SYBR Green Supermix (Bio-Rad) in this study. The primers used were obtained from RealTimePrimers.com (Elkins Park, PA); the corresponding National Center for Biotechnology (NCBI) Reference Sequence (RefSeq) numbers are as follows: ACTA2, MYH11, CNN1, and GAPDH. GAPDH was the reference gene. Quantitative real-time polymerase chain reaction (qPCR) was performed on either a Bio-Rad Hybaid PCR Express thermal cycler d CFX96 or iQ5 under the following reaction conditions: 95°C for 3 min and 45 cycles of 95°C for 10 s and 58°C for 45 s. Relative expression was calculated using quantification cycle (Cq) values as per the ΔCq-method and fold change was calculated as follows: Ratio (reference/target) = 2Cq(ref) − Cq(target).
Data analysis and statistics
All experiments were performed in triplicate unless otherwise stated. Statistical analysis of FRET data used multiple series t-tests. Due to the positively skewed distribution of the immunofluorescence intensity data, data sets underwent natural log transformation before analysis using two-way ANOVA with Holm–Sidak's multiple comparison test. Statistical analysis of vinculin cluster quantitation used independent Student's t-test. All statistical analyses were performed with GraphPad Prism software.
Results
ERK response to chemical and mechanical stimuli
To evaluate how specific mechanochemical cues affect ERK activity using the FRET-based biosensor (Fig. 1A), transfected MSCs (Fig. 1B) were seeded on a glass slide, an NIL-patterned PDMS substrate (Fig. 1C), or nonpatterned PDMS substrate, and were, respectively, subject to four biochemical treatments: thromboxane A2 analog U46619, MEK inhibitor PD98059, TGF-β1, and EGF. Our interest in the vascular differentiation informed our choice of administered factors. EGF is known for its effect on ERK activation 26 while not significantly influencing vascular differentiation. PD98059 is known for its effect on reducing ERK activation, and according to a previous report, a potent differentiation factor. 13 TGF-β1 and U46619 have been used to induce SMC differentiation in stem cells.7,10–12

Experimental strategy to study ERK response to mechanochemical stimuli.
Figure 2 shows ERK activity under the influence of biochemical factors. When taking the normalized FRET ratio emission as a representation of ERK activity on the substrates, PD98059 sharply reduced ERK activity, presumably through the inhibition of upstream phosphorylation of ERK, while EGF increased ERK activity (Fig. 2A), likely via the Ras-Raf-MEK-ERK pathway. No significant effects on ERK activity were detected for TGF-β1 or U46619 during the 8-h time course (Fig. 2A). On closer analysis, we observed a brief increase in ERK activity on our blank controls immediately after pipetting (Fig. 2B). This indicates that the genetic biosensor is activated in the presence of small shear forces, that is, pipetting, as no chemical factors were present.

Temporal profiles of ERK phosphorylation dynamics in response to mechanochemical stimuli.
When replicating these treatments for MSCs seeded on either patterned (NIL+) or nonpatterned (NIL−) PDMS substrates, EGF-treated cells revealed no significant difference (p > 0.05) in ERK activity between NIL+ and NIL− over 48 h; meanwhile, TGF-β1, PD98059, U46619, and control group exhibited significantly increased (p < 0.05) ERK activity for over half of the observed time points. The results are shown in Figure 3. Results here suggest that the nanotopography of the PDMS substrates contributes to the increased activation of ERK. The ERK signals under all the experimental conditions on the nonpatterned (NIL−) PDMS appeared higher than those cultured on the glass substrate. However, it was noted that optical enhancement was obvious on the PDMS substrates when compared with glass substrate, and therefore, the direct comparison of FRET emission ratios between the two substrates would not bring meaningful insights. However, it was found that ERK activity in the cells cultured on the nonpatterned NIL− PDMS substrate reflected similar changes in response to the biochemical treatments as those cultured on our glass substrates, which thus provide the basis to investigate the combined effects of biochemical factors and topography using the NIL+/− substrates.
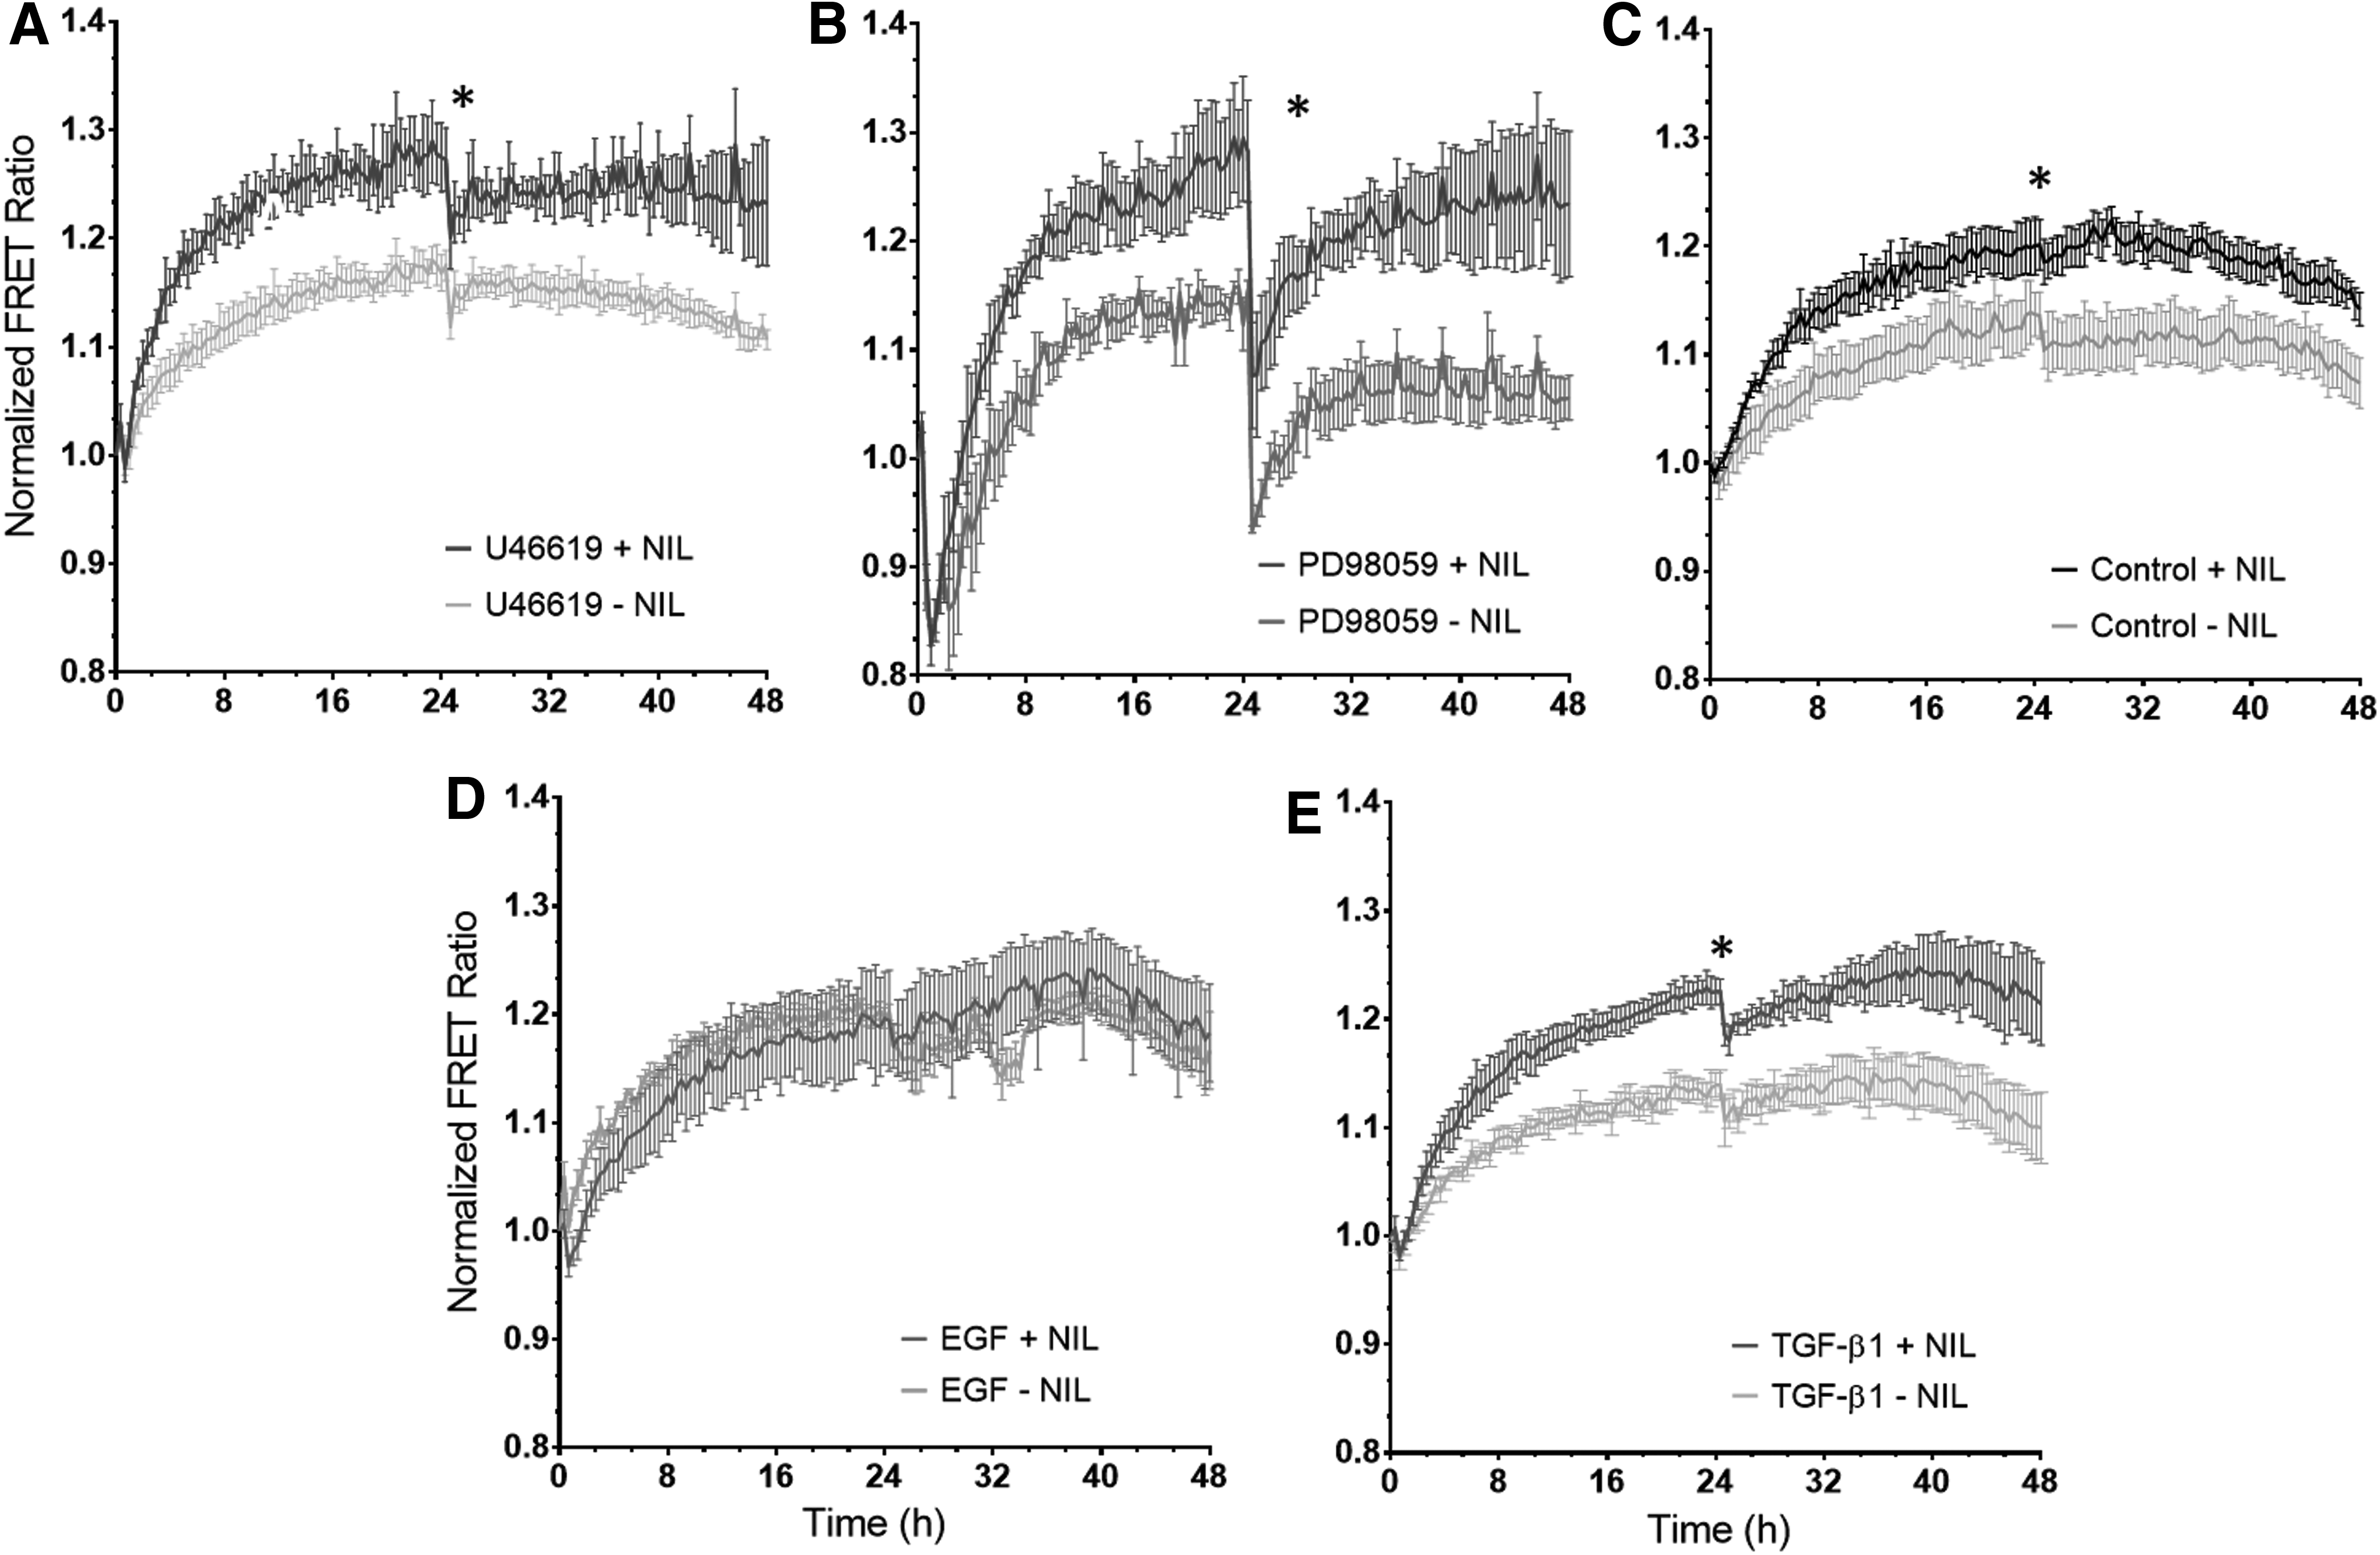
Nanopatterning upregulates ERK activity.
Nanopatterned PDMS regulated the expression of myogenic markers
To explore the combined influence of biochemical factor and topography on SMC differentiation of MSCs and to determine the correlation between the ERK activities and SMC differentiation, we measured the expression of myogenic markers with immunofluorescent staining and qPCR on the cells after 48 h of biochemical treatment on the substrate with or without anisotropic nanopatterns (NIL+/−).
As shown in Figure 4A and B, for the cells undergoing biomolecular treatments on the NIL− substrate, α-smooth muscle actin (α-SMA) expression was found to significantly (p < 0.01 and p < 0.05) increase in those treated, respectively, with TGF-β1 and PD98059, when compared with NIL− control (no biochemical treatment on cells). When comparing the NIL+ biochemical-treated groups with NIL+ control, TGF-β1 significantly (p < 0.05) increased α-SMA expression, while that expression was very significantly (p < 0.0001) reduced by U46619. Strikingly, when comparing the α-SMA expression results between NIL+ and NIL− groups, we found that the expression was significantly reduced for most NIL+ conditions, including U46619 (p < 0.0001), PD98059 (p < 0.0001), TGF-β1 (p < 0.01), and control or no treatment (p < 0.05). EGF displayed no significant influence on α-SMA expression in the NIL+/− comparison, which reflected the minimal ERK responsiveness to nanotopography under EGF stimulation. These data indicated that the nanopatterned PDMS substrate reduced MSC expression of α-SMA. Notably, the results here correlated well with the effect of nanotopography on ERK activities, in that NIL+ sustained continuously elevated ERK activities, which likely contributed to the reduction in MSC expression of α-SMA. Also, quantification using corrected fluorescence yielded similar results as quantification with expression-positive cell percentage.

The expression of SMC markers, including α-SMA, calponin-1, and MYH11, in MSCs on NIL+/− PDMS after 48 h.
Expression of another early-middle myogenic marker, calponin-1, was significantly (p < 0.05) increased for NIL− PD98059 and NIL− TGF-β1 compared with NIL− control (Fig. 4C, D). No significant difference in calponin-1 expression was found between control and any biochemical administered in all NIL+ groups. As with α-SMA expression, NIL+ treatments with U46619, PD98059, or TGF-β1 expressed significantly (p < 0.01) less calponin-1 than corresponding NIL− groups. These data indicated that the patterned PDMS substrate has a significant inhibitory effect on calponin-1 expression. Similar as α-SMA results except for the control, reduced calponin-1 expression in the NIL+ groups (U46619, PD98059, or TGF-β1) correlates with the NIL effect on increasing ERK activities under these biochemical treatments.
Smooth muscle myosin heavy chain (MYH11) is a mature marker of myogenic differentiation and commonly used to identify late-stage SMC development. On NIL− substrate, only U46619 displayed a significant (p < 0.05) increase in MYH11 expression compared with the control group (Fig. 4E, F). For the NIL+ group, expression of MYH11 with U46619 was significantly (p < 0.05) reduced compared with the control. Interestingly, MYH11 expression was significantly (p < 0.01) enhanced for NIL+ PD98059 compared with NIL+ control. When comparing NIL+/− groups, MYH11 expression from U46619 treatment was very significantly (p < 0.0001) reduced in NIL+ compared with NIL− substrates. We further observed significantly enhanced (p < 0.05) MYH11 expression from PD98059 treatment on NIL+ substrate when compared with the NIL− treatment.
To confirm the results obtained by immunofluorescence staining, we have performed qPCR for gene expression of similar myogenic biomarkers. The results are shown in Figure 5, which have affirmed major findings from immunofluorescent results. In particular, four groups were selected and included in the qPCR study: NIL− Control, NIL+ Control, NIL− PD98059, and NIL+ PD98059. Consistent with immunostaining results, α-SMA gene expression was upregulated by PD98059 treatment, particularly for cells cultured on the NIL− substrata, while the expression was downregulated by the nanopattern as illustrated by NIL+ Control compared with NIL− Control (Fig. 5A). Interestingly, the gene expression of MHC was significantly enhanced in cells on NIL+ substrate under PD98059 treatment, when compared with those under the NIL− treatment. That was also in agreement with immunofluorescent results. Altogether, these results suggest that the interplay between mechanical cue (nanopattern) and biochemical presentation is important to MSC differentiation. The expression of SMC early and mature markers may be differentially regulated by sophisticated mechanochemical treatment.

PCR assessment of select vascular markers of MSCs cultured on NIL+ and NIL− substrates with or without PD98059 treatment:
Focal adhesion molecules regulated mechanotransduction of nanotopographical structure
As nanotopographical features demonstrated strong overall regulatory mechanisms on ERK signaling and cell differentiation, we further studied possible mediating focal adhesion molecules that translate the nanostructural guidance into intracellular signals. Previous studies showed that vinculin clusters likely play important roles in cell mechanosensing and transduction of the substrate structure and property.27,28 Thus, we first quantified vinculin clusters in cells on NIL+/− substrates. To evaluate how focal adhesion size and length differed on nanopatterned vs. nonpatterned substrates, cells were immunofluorescently stained for vinculin (Fig. 6A, B). Although observations suggested that cells on the patterned substrate appeared to contain longer/larger vinculin clusters than those cultured on nonpatterned substrates, quantitative measures of vinculin cluster area and axis length did not reveal significant differences between patterned and nonpatterned substrates (Fig. 6C). Furthermore, the averaged frequency distribution of cluster length per cell for both patterned and nonpatterned substrates had similarly right-skewed distributions (Fig. 6D), but cells on the nonpatterned substrate had higher frequencies of cluster lengths below 10 μm on average. The higher frequencies of vinculin cluster length could be attributed to differences in overall surface area of the cells, since the nonpatterned cells spread out more than the patterned cells. These results indicated that vinculin cluster length and area, and subsequently the focal adhesion length and area, were not significantly different between patterned and nonpatterned substrates.
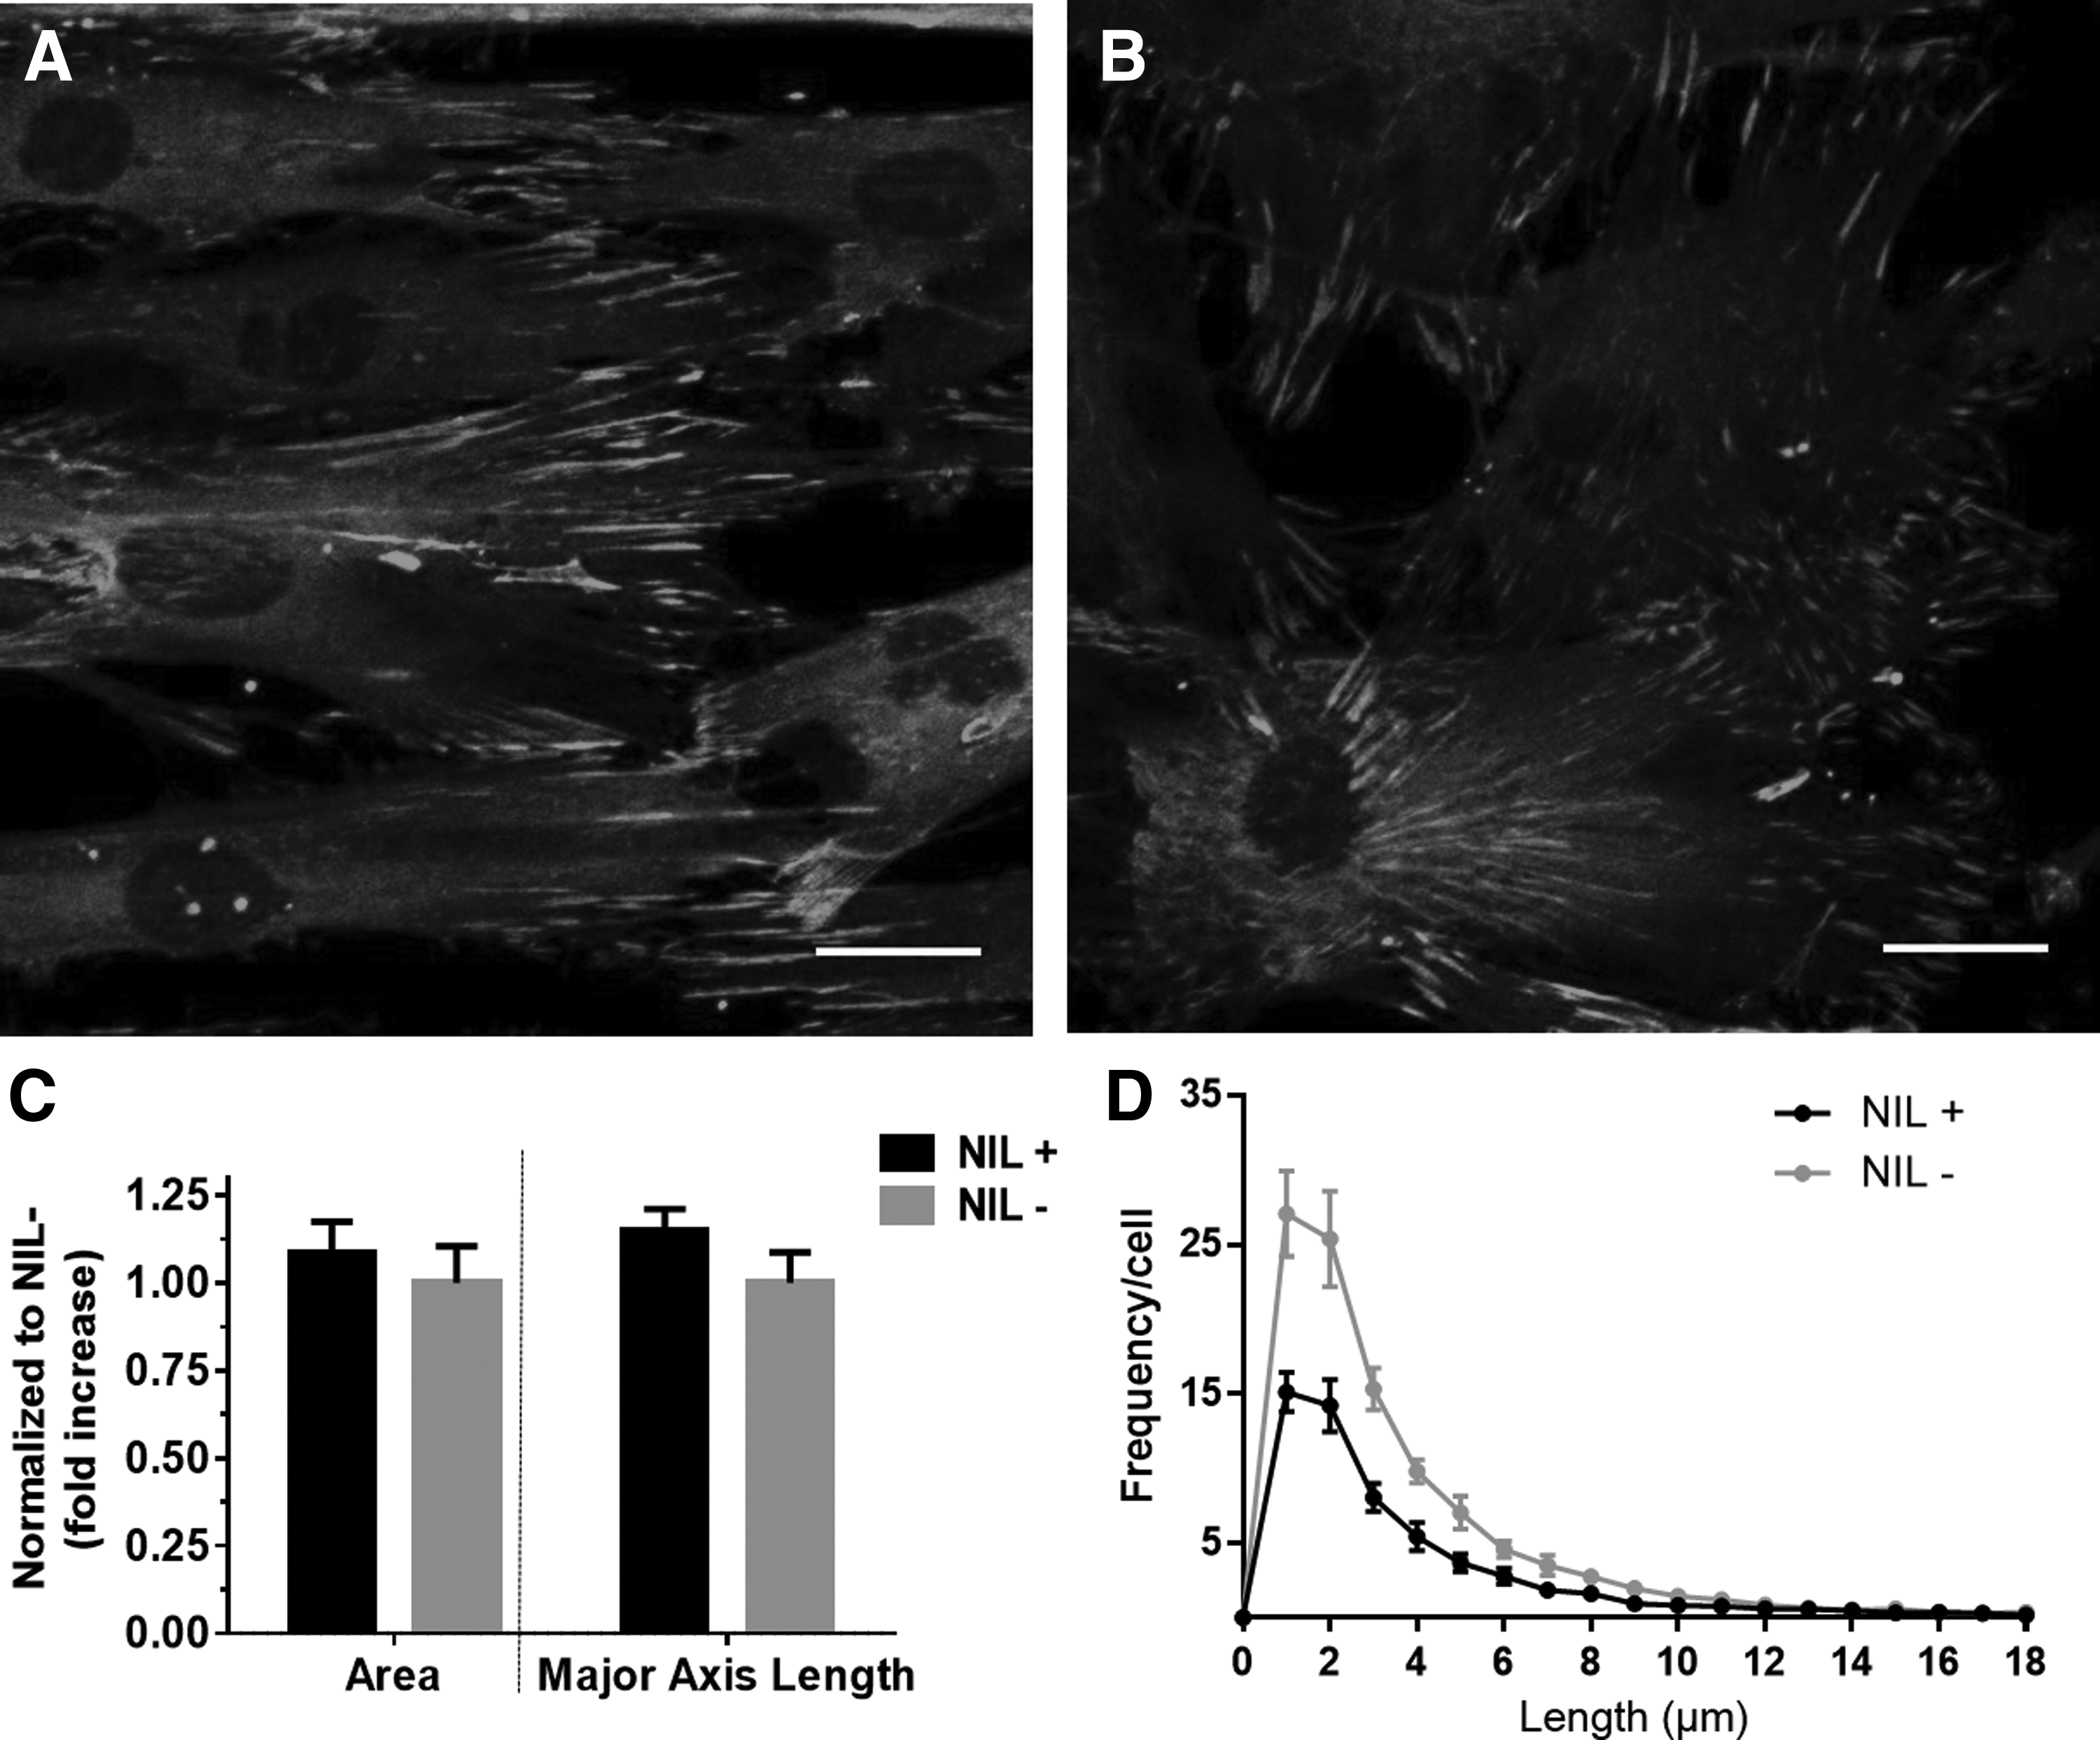
Vinculin expression and quantitation.
To further the investigation, we evaluated characteristics of zyxin, another focal adhesion molecule responsive to mechanical forces by colocalizing with and reinforcing stress fibers of cells when cytoskeletons were under tensile forces.29–31 Also, ERK has recently been shown to colocalize to stress fibers where the activation of ERK is positively correlated with increased tensile forces. 32 Thus, we costained and imaged zyxin and F-actin (Fig. 7). Results showed that zyxin translocation from focal adhesions to stress fiber was dependent on nanotopography. On nonpatterned substrates, zyxin appeared to localize diffusely around cell nuclei and strongly in clusters around the perimeter of the cell (Fig. 7E). These clusters, presumed to be focal adhesion-localized zyxin, were also distinctly located at the ends of F-actin filaments (Fig. 7F). In comparison, cells on the patterned substrate exhibited a highly diffuse distribution of zyxin throughout the cell's actin stress fibers (Fig. 7B). Supplementary Figure S2 showing zyxin and F-actin expression in a single cell further illustrated the difference. Interestingly, large and distinct stress fiber-colocalized clusters visible on the patterned substrate were absent on the nonpatterned substrate (Fig. 7C). These results demonstrated clear differences in localization of zyxin, with patterned substrates exhibiting distinct clusters that were absent in nonpatterned substrates. This agreed well with recent findings, collectively suggesting that mechanical stress on the cytoskeletons induced by nanostructures mobilized zyxin from focal adhesions to actin filaments.
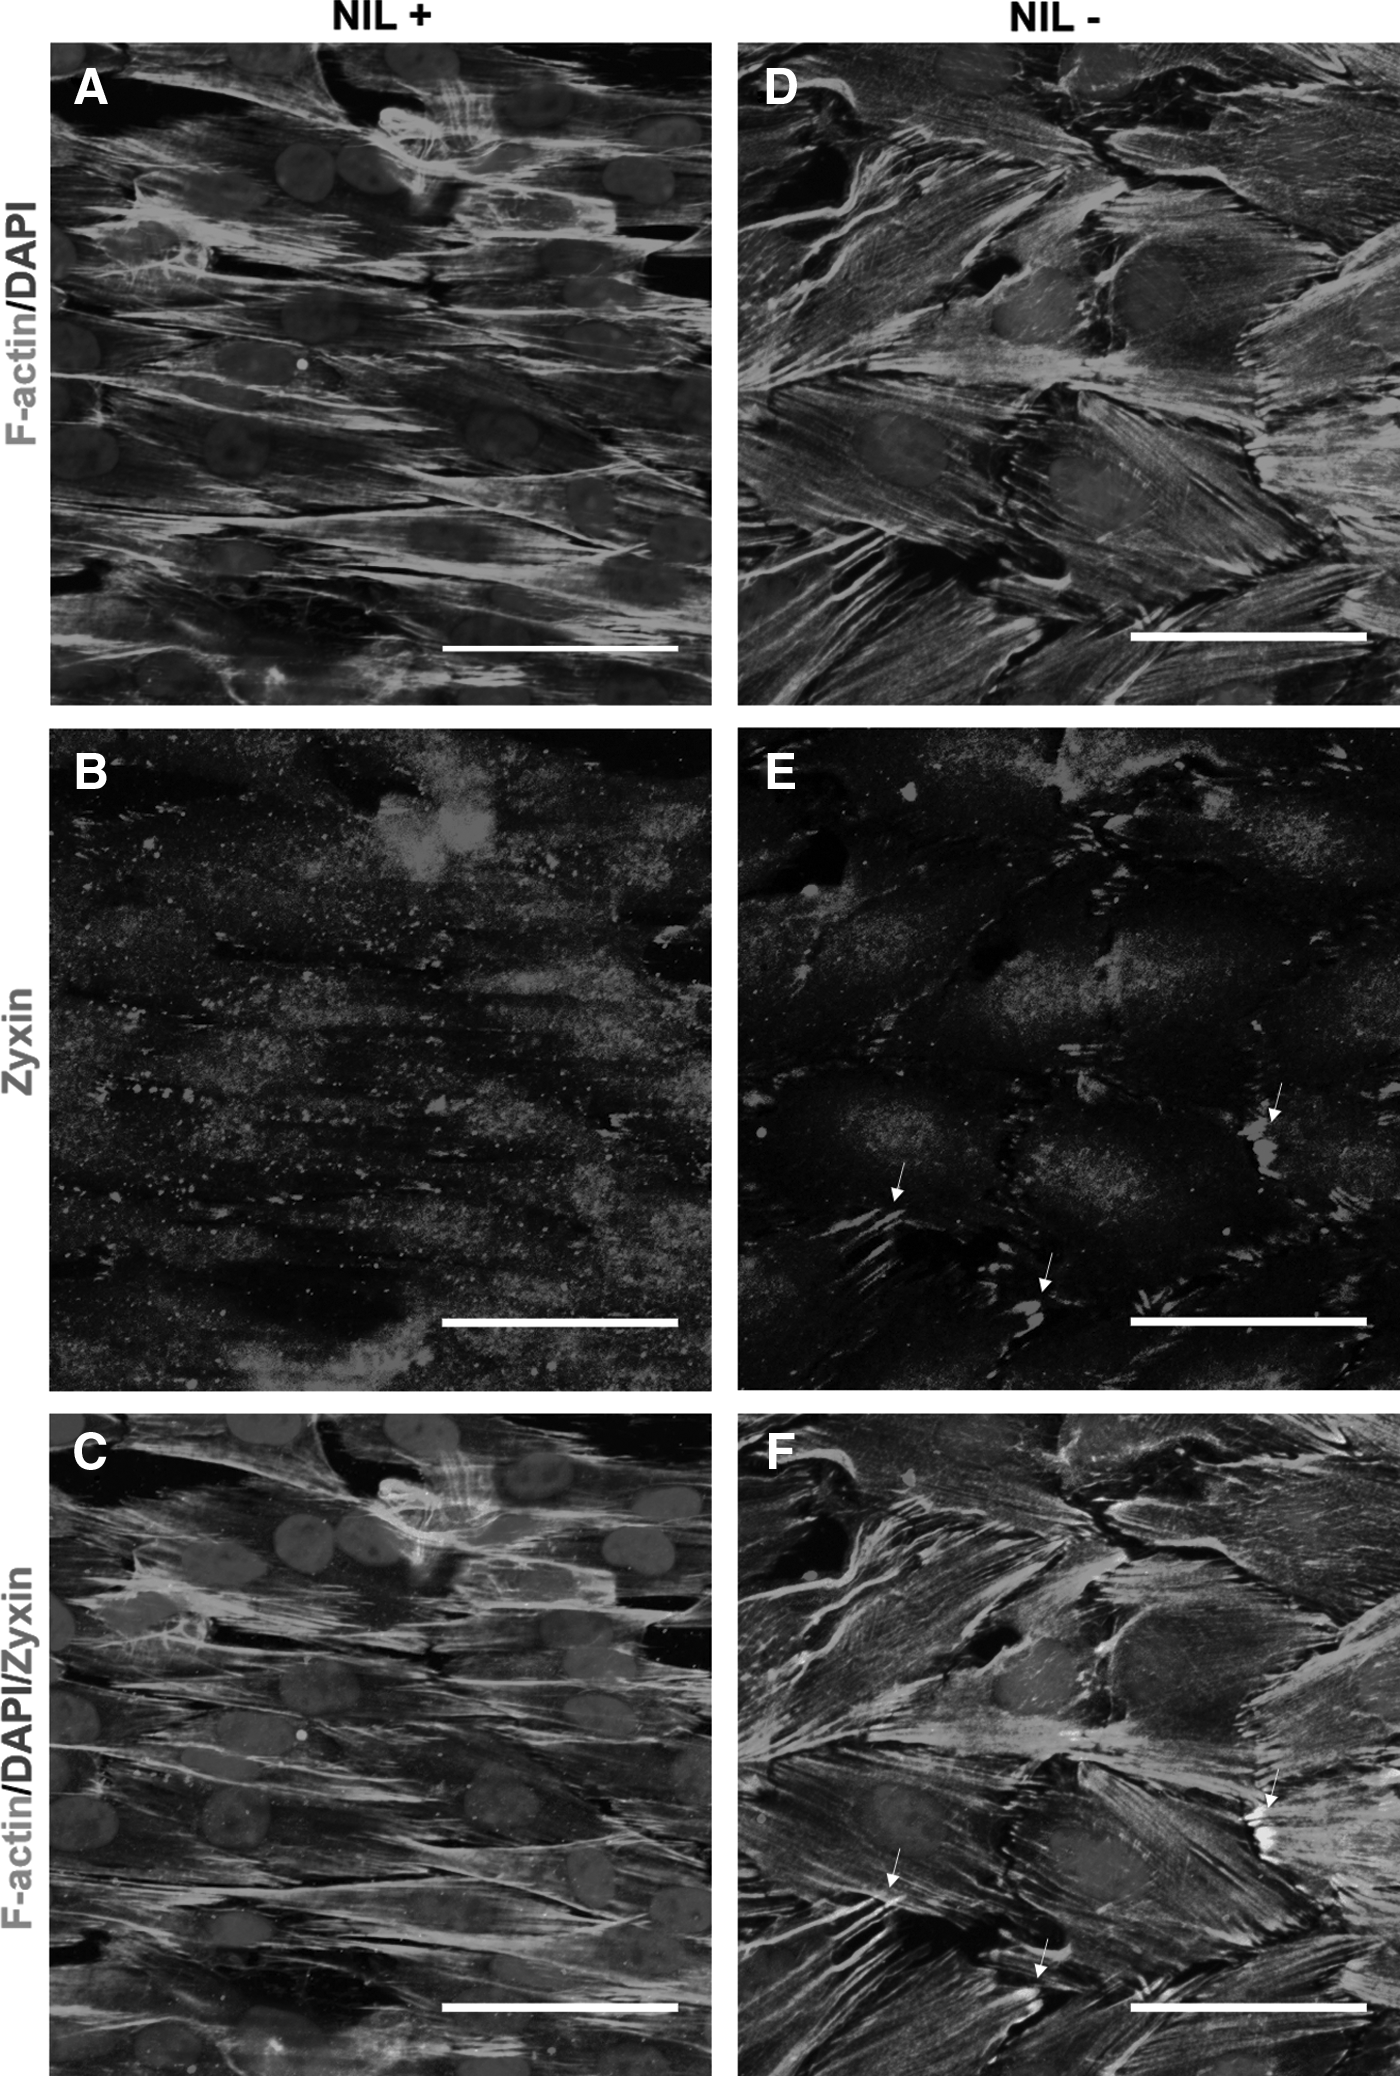
Translocation of zyxin from focal adhesions to actin stress fibers in nanopatterned substrate.
Discussion
Emerging evidence suggests that stem cells interact significantly with their local environments, specifically through mechanical and chemical feedback.33,34 These mechanical or chemical cues have been separately correlated with several cellular processes, including proliferation, migration, apoptosis, and differentiation. The integration of mechanical and biochemical environmental factors could synergistically augment or inhibit cellular processes such as differentiation. 10 While significant progress has been made to understand how mechanochemical environments influence stem cell behavior, to date, little is known how early signaling events direct these cellular outcomes. ERK signaling has previously been shown to be responsive to biochemical signals as well as to shear stress and other mechanical forces.11,14 The importance of ERK as an early messenger in regulating cell processes has been well recognized. FRET sensors have been used to measure ERK or other early messengers as they relate to cell activity or differentiation.17–19 While many studies have highlighted the potential for FRET sensors to elucidate real-time activity of cellular events, temporal resolution of ERK activity of cells in response to specific stimuli, such as those known to induce differentiation processes, is yet to be investigated as it is demonstrated here. Our interest in vascular regeneration prompted us to correlate the role of ERK signaling of stem cells in the presence of mechanochemical stimuli established to differentiate stem cells into vascular SMCs. Our data suggest that diverse environmental factors significantly influence ERK signaling and that this activity may have a direct role in the differentiation events of stem cells.
In this study, we showed that ERK was sensitive to nanotopography besides biochemicals, and that this sensitivity could override biochemical modulation of ERK activity. Nevertheless, the lack of change in activity due to EGF treatment in nanotopographic substrates could be attributed to saturation of the signaling cascade, since EGF was a potent activator of ERK. 26 Conversely, we showed that patterned substrates reduced SMC differentiation in MSCs except for the case of MEK inhibitor PD98059. Growth factors or pharmacological agents such as TGF-β1, U46619, and PD98059 have all been shown to increase expression of SMC markers, but when cells treated with these biochemicals were cultured on nanopatterned substrates, there was a drastic reduction in SMC expression. Tamama et al. demonstrated that inhibition of ERK activity induces SMC differentiation in bone marrow MSCs. 14 Herein, we presented evidence that the opposite might also be true; that increasing ERK activity reduced SMC differentiation in MSCs. One surprising observation from these data was that when ERK was inhibited by the MEK inhibitor PD98059 in cells cultured on the nanopatterned substrate, a mature SMC marker, MYH11 expression was enhanced. SMCs cultured on groove-patterned substrates favored expression of SMC-specific genes and proteins.35,36 Taken together with evidence that reducing ERK activity induced SMC differentiation, 14 it was plausible that a synergistic effect between the constrained and polarized morphology induced by the grooved nanopattern and inhibition of ERK activity by PD98059 augmented expression of late-stage marker MYH11. The mechanism for this interaction was unclear. Overall, ERK signaling was sensitive to mechanosignaling induced by substrate nanotopography, and inhibition of activated ERK was important to MSC expression of SMC differentiation markers. However, the regulatory mechanism with biochemical or biophysical signals may be more sophisticated than what was reported in past literature.
To investigate why ERK activity increases in the cells cultured on nanopatterned grooves, we evaluated characteristics of focal adhesions. Focal adhesions were the adhesion points and the mechanical interface between the substrate and the cytoskeleton of the cell.29,30 We inferred that differences in the focal adhesion characteristics could contribute to the differences in ERK activity. When comparing major axis length and area of vinculin clusters, we found that there was no significant difference between the means, although the mean frequency distribution indicated that cells on patterned substrates have fewer vinculin clusters of lengths below 10 μm. Zyxin is a focal adhesion protein that is responsive to mechanical forces,29–31 and localization of zyxin away from focal adhesions indicates that the cellular cytoskeleton is under tension. Recently, it was shown that phosphorylated ERK colocalizes to stress fibers when cells were under tension, 37 and that ERK was reduced when the cytoskeleton is disrupted.38,39 We showed that cells on patterned substrates exhibited defined zyxin clusters throughout the cells and colocalized with actin stress fibers, indicating translocation of zyxin away from focal adhesions. Cells on the nanopatterned substrate could undergo tension due to topographical constraints that could, in turn, increase ERK activity. However, the detailed mechanotransduction process in cells requires further investigation.
Conclusion
This study is the first to demonstrate high-resolution temporal dynamics of signaling molecule phosphorylation in stem cells under mechanochemical stimulation and associate that with cell differentiation. The FRET biosensor system will be an important tool for elucidating the mechanisms underlying stem cell differentiation. In addition, the capability of monitoring and modulating signaling events in real time could be exploited to advance stem cell-based tissue engineering by facilitating the development of optimal differentiation protocols. Finally, our results encourage future studies that aim at using FRET sensors to guide the engineering of cell microenvironments that involve multiple physical and chemical stimuli for a specific lineage commitment and maturation.
Footnotes
Acknowledgments
The authors thank Dr. Doug Chapnick and Professor Xuedong Liu for their gift of the plasmid and their help with performing FRET imaging. This research was financially supported by IGP grant from University of Colorado at Boulder and NHLBI R01HL119371 (to W.T.).
Disclosure Statement
No competing financial interests exist.
References
Supplementary Material
Please find the following supplemental material available below.
For Open Access articles published under a Creative Commons License, all supplemental material carries the same license as the article it is associated with.
For non-Open Access articles published, all supplemental material carries a non-exclusive license, and permission requests for re-use of supplemental material or any part of supplemental material shall be sent directly to the copyright owner as specified in the copyright notice associated with the article.