
Abstract
Cell-based therapy is an ideal way of repairing defective cartilage. At present, the articular chondrocytes (ACs) is the cell source for cartilage repair. Problematically, in serial culture, the dedifferentiation of ACs occurs, which may result in graft failure. In the present study, we examined chondrogenic capacity and physical characteristics of proliferating layer chondrocytes (PLCs) from the growth plate cartilage and evaluated its regenerative activity for cartilage repair. We found that PLCs preserved more chondrogenic phenotypes, such as polygonal appearances, whereas ACs appeared fibroblast-like after seventh passage. Profoundly, the ACs expressed higher apoptosis-related proteins, such as cleaved caspase-9 and cleaved caspase-3, than PLCs. Also, the PLCs have higher proliferation rate than ACs, and the cell doubling time is 20.9 h for PLCs and 29.5 h for ACs. Using flow cytometry, we demonstrated that 26.6% of PLCs entered the S-phase after 16 h serum re-addition to starved cells compared with 13.3% of ACs. Otherwise, col2a1, aggrecan, sox5, sox6, and sox9 mRNAs were significantly increased in PLCs compared with ACs; in contrast, the col1a and col10a1 mRNA expression level in PLCs was lower than that in ACs. The glycosaminoglycan content in PLCs was higher than that in ACs by the direct 1,9-dimethylmethylene blue assay. Histological and immunohistochemical evaluations have demonstrated that significantly more chondrogenic extracellular matrix was detected in the PLCs group compared with the ACs group after implantation in nude mice. Taken together, our data indicate the PLCs preserved much more chondrogenic phenotypes than ACs in vitro and in vivo. These results might imply that PLCs act as the better cell source for reapairing and regenerating growth plate and articular cartilage.
Impact Statement
In recent years, cell-based therapy is a promising strategy for repairing defect cartilage. However, in vitro expansion of articular chondrocytes (ACs) for collecting enough cell numbers eventually develops cell de-differentiation. In the present study, we choose the proliferative layer chondroctytes (PLCs) of growth plate as new candidate. The novel findings include (1) the higher proliferation potential of PLCs in comparison with the ACs, (2) PLCs produced more GAG than ACs, (3) the increased in GAG matrix production, (4) and lower senescence in PLCs. From these results, we found PLCs might be suitable as cell source for cartilage regeneration.
Introduction
C
Recently, microfrature 9 and mosaicplasty 10 are the two main therapeutic approaches to amend cartilage injuries. Problematically, the mosaicplasty frequently causes donor site morbidity and postoperative pain, 11 and these two treatments often lead to the formation of a fibrocartilaginous material constituted type I collagen replaced type II collagen (Col-2), by which the cartilage is unable to restore hyaline structure and its biological function. 12
To cope with clinical difficulty, the cell-based therapy is considered a curing way for cartilage injuries. This is one of the best self-healing approaches due to its high successful rate, wide applicability, and predominant results in improving the implanted cartilage.13,14 The human multipotent mesenchymal stem cells (MSCs) that are derived from bone marrow, 15 adipose tissue, 16 peripheral blood, 17 placenta, 18 synovium, 19 or dental pulp 20 are experimentally applied in cartilage tissue engineering. Although these stem cells have high proliferative rate and can express higher level cartilage-specific genes, their ability to chondrogenesis is not reliable.21,22
The in vitro expansion protocols for MSCs being induced to chondrogenic phenotypes frequently yielded the expression of hypertrophic markers, including ColX, MMP13, osteopontin (OP), and alkaline phosphatase (ALP), in differentiated cells. 23 Subcutaneous transplantation of hypertrophic cells in severe combined immunodeficient mice results in unstable cartilage forming, which contains extensive calcification and vascular access. Beside MSCs, the primary human articular chondrocytes (ACs) that is isolated from a nonweight-bearing area is the other cell source for cell-based therapy for cartilage repair.24–26 As the ACs are multiplied by monolayer culture in vitro to obtain enough amounts of chondrocytes for therapy, the ACs with high passage number consequently lost chondrogenic phenotype and get dedifferentiated.27,28 As the result of dedifferentiation, the deregulation of chondrogenic markers, such as GAGs, collagen type II (Col2a1), aggrecan, and cartilage oligomeric matrix protein, occurs in the ACs. The dedifferentiated cells destine in the expression of collagen type I (Col1a1) and collagen type X (Col10a1) and have fibroblast-like morphology, which is undesirable for cartilage repair.29–31 Along with cell passage increasing, the cultured ACs begin with senescence-specific gene expression and activation of apoptotic pathway while the cell proliferation and viability decreases.32–35 Hence, selecting a better cell source for cartilage repairing was critical and indispensable.
The epiphyseal growth plate is composed of three distinct zones, namely the resting zone (RZ), the proliferative zone, and the hypertrophic zone (HZ). In the RZ, chondrocytes are relatively small size and inactive divided and express markers such as Col2a1 (type II collagen). Underneath this zone, the chondrocytes of proliferating layer chondrocytes (PLCs) are present, which are larger in size than RZ and rapidly proliferate and express aggrecan and Col2a1. Next, prehypertrophic chondrocytes exit the cell cycle and become expressing Col10a1 (type X collagen) and Ihh (Indian hedgehog). Prehypertrophic chondrocytes added in size to become hypertrophic cells and continue expressing Col10a1. The chondrocytes of HZ eventually cease expressing Col10a1 and toward terminal stages, undergoing autophagic cell death, apoptosis, or transdifferentiation. 36 In addition, the proliferative zone is responsible for matrix production (including collagen-II and aggrecan) and cellular division during endochondral ossification.
The height of the proliferative zone directly correlates with the extent of longitudinal growth that can be achieved by the long bone. This is regulated by various signaling pathways including parathyroid hormone-related protein (PTHrP), 37 bone morphogenic protein, 38 Wnt/β-catenin, 39 fibroblast growth factor, 40 and Ihh (Indian hedgehog). 41 Since the chondrocytes in the RZ have stem-like property and the chondrocytes in the proliferating zone have continuous cell dividing capacity and chondrogenic phenotype, it is speculated that the cell derived from the epiphyseal growth plate might be used to repair cartilage injury. In this study, we propose to characterize the chondrogenic character and phenotype of the cells isolated from PLCs in the epiphyseal growth plate.
Materials and Methods
Cell preparation
All animal procedures were reviewed and approved by the Kaohsiung Medical University Hospital Institutional Review Board. The 8-week-old porcine growth plates and articular cartilage of distal femur were harvested. The growth plates and articular cartilage samples were excised between the endochondral bone plate and the epiphyseal resting cartilage, and the secondary ossification center was removed by excision and then collected in the cell culture medium (Dulbecco's Modified Eagle Medium [DMEM]/F12, [Gibco], supplemented with 0.05 mg/mL sodium ascorbate, 1 mM cysteine, 1 mM sodium pyruvate, 50 U/mL of penicillin, and 0.05 mg/mL of streptomycin). The growth zones were cut into small pieces using a scalpel and incubated in 0.1% (w/v) trypsin in phosphate buffer saline (PBS) under gentle agitation for 20 min at 37°C. The trypsin was removed and the pieces were washed with culture medium and digested overnight with 0.01% (w/v) (0.166 U/mL) collagenase P (Boehringer/Roche Mannheim, Germany) in the medium in the presence of 10% fetal calf serum at 37°C under agitation. The growth plates were then digested in supplemented DMEM/F12 containing 1.5 mg/mL collagenase type II and 5% FBS at 37°C for 10 h. After the 10 h enzymatic digestion of the ECM, the freed cells were separated from tissue debris by filtration through a 70-μm nylon cell strainer (Becton Dickinson, Franklin Lakes, NJ) and collected from the filtrate by centrifugation at 150g for 5 min. Then, cells were washed twice in 1 × PBS and resuspended in 1 mL DMEM/F12. Growth plate cells were layered on a discontinuous isotonic Percoll (Sigma) gradient prepared by weight (densities of 1.015, 1.04, 1.05, and 1.07 g/mL) and centrifuged at 300g for 20 min in a swinging bucket rotor (Evans and Oberbauer, 2008).
Cell viability
MTT assay was used in detecting the viability of chondrocytes at various passages. Briefly, the chondrocytes were cultured in 24-well plates (10 4 cells in each well) or in alginate beads, added with 200 μL MTT solution (final concentration 2 mg/mL), and incubated for another 4 h. After the supernatant was discarded, 150 μL of dimethyl sulfoxide (DMSO) was added to each well. In 3D cultures (alginate beads), the beads were resuspended in citrate buffer (55 mM citrate, 0.15 M NaCl, 30 mM EDTA, pH 6.8), then the cells were centrifuged at a speed of 3000 rpm for 5 min, and after discarding the supernatant, 150 μL of DMSO was added and the samples were measured spectrophotometrically at 570 nm.
Cell proliferation
The chondrocytes were seeded in 24-well plates (10 4 cells in each well) and cultured in complete growth medium and followed by different incubation times. After incubation, cells were collected and counted using counting chamber for 1–3 days. Population doubling time (PDT) can be calculated, given two measurements of a growing quantity, q1 at time t1 and q2 at time t2, and assuming a constant growth rate, the doubling time is calculated as: PDT = (t2 − t1) × log (2 − q2/q1).
Cell senescence
Senescence-associated β-galactosidase (SA-β-gal) activity at pH 6.0 was detected histochemically in subconfluent cultures for 3 or 4 days using the Senescence β-Galactosidase Staining kit (Cell Signaling Technology, Danvers, MA).
Cell cycle analysis
Chondrocytes were synchronized by growth in DMEM containing 10% FBS for 1 day, followed by culturing in serum-free DMEM medium for an additional 24 h and considered to be at G1 arrest. Cells were then replated in DMEM containing 10% FBS and collected at various time points. Then, cells were trypsinized and washed once in PBS and fixed by the dropwise addition into ice-cold 70% ethanol while mixing. These cells were washed twice in PBS and treated for 20 min with RNaseA (250 μg/mL) at 37°C and for 30 min with propidium iodide (PI) (50 μg/mL) at 4°C. DNA content was analyzed by fluorescence-activated cell sorter, and the cell number in each phase of the cell cycle was determined using the ModFit LT software (BD Biosciences).
Western blotting
Chondrocytes were lysed in RIPA buffer (Sigma) supplemented with protease inhibitor and phosphatase inhibitor cocktail solution (Sigma–Aldrich, St. Louis, MO) and centrifuged at 12,000 rpm for 20 min. The protein concentration was determined using a Bradford protein assay kit (Bio-Rad). The protein extracts (30 μg) were separated by sodium dodecyl sulfate–polyacrylamide gel electrophoresis. After transfer to a polyvinylidene difluoride membrane (PerkinElmer Life Sciences) and blocking with 5% milk, the blots were probed with the following mouse monoclonal antibodies overnight at 4°C: anti-cleaved caspase 3 (Upstate, Lake Placid, NY), anti-caspase 9 (Upstate), and anti-β-actin (Sigma). Horseradish peroxidase-conjugated secondary antibodies (Bio-Rad) were then applied to the membrane and incubated for 60 min. The bands were visualized using the enhanced chemiluminescence Western blotting with LAS-3000 (Fujifilm, Tokyo, Japan). For western blot quantification, the band intensity was quantified by densitometry using the ImageJ software (NIH). The ratio of target protein to β-actin was calculated, and then, the ratio was normalized to the control.
RNA isolation and real-time polymerase chain reaction
Total RNA was extracted using TRIzol (Invitrogen). Two micrograms of purified total RNA was reverse-transcribed using the Thermo Scientific Maxima First Strand cDNA Synthesis Kit (ThermoFisher) according to the manufacturer's instructions. Briefly, the solution was incubated at 65°C for 5 min, and it was mixed with the first-strand buffer, DTT, and RNaseOUT in a final volume of 20 μL. Then, the solution was incubated at 42°C for 60 min and then at 70°C for 15 min to inactivate the reverse transcriptase activity. Real-time polymerase chain reaction (PCR) was conducted using the SYBR Green PCR Master Mix (Qiagen) and was processed on a LightCycler PCR and detection system (Roche Diagnostics). Each reaction (20 μL) was run in duplicate and contained 1 μL of cDNA template along with the following primer sequences: col2a1, forward (ACTCCT GGCACGGATGGTC) and reverse (CTTTCTCACCAACATCGCCC); aggrecan, forward (CCC AACCAGCCTGACAACTT) and reverse (CCTTCTCGTGCCAGATCATCA); col10a1, forward (TGAACTTGGTTCATGGAGTGTTTTA) and reverse (TGCCTTGGTGTTGGATGGT); gapdh, forward (TCACGACCATGGAGAAGGCT) and reverse (CAGGAGGCATTGCTGATGATC); col1a1, forward (CTGGTACGGCGAGAGCATGACC) and reverse (GGAGGAGCAGGGCCTTCTTGAG); sox5, forward (GGCCAAGCAGCAGCAAGAACAG) and reverse (AGCTGAAGCCTGGAGGAAGGAG); sox6, forward (CAGCCCTGTCAGTCTGCCTAACA) and reverse (GCATCTTCCGAGCCTCCTGAATAGC); sox9, forward (GGCAATCCCAGGGTCCACCAAC) and reverse (TGGTCGAACTCGTTGACGTCGAAG); mmp13, forward (ACCCAGGAGCCCTCATGTTTCC) and reverse (CAGGGTTTCTCCTCGGAGACTG); runx2, forward (CCAGACCAGCAGCACTCCATAC) and reverse (GGGAACTGCTGTGGCTTCCATC); and osterix, forward (CAGGACCCTGGGCTACTAGTGC) and reverse (TGCCCTCCACCTAGCCAGTTGC). Cycling parameters were 95°C for 15 min to activate DNA polymerase, followed by 40 cycles at 95°C for 15 s, 60°C for 20 s, and 72°C for 30 s. Melting curves were generated at the end of the reaction. Threshold cycles (Ct) for each gene tested were normalized to the housekeeping GAPDH gene value (ΔCt), and every experimental sample was referred to its control (ΔΔCt). Fold change values were expressed as 2−ΔΔCt.
Immunofluorescence and histological analysis
For immunofluorescence, samples were fixed in 4% paraformaldehyde for 30 min (PBS, 0.1% Triton X-100 and 1% bovine serum albumin) and permeabilized with 0.01% Triton X-100 for 1 min, then the samples were incubated with 1% BSA for 20 min and blocked with antibodies against Col2a1 (1:100; Abcam, Cambridge, MA) and Col10a1 (1:200; Developmental Studies Hybridoma Bank, University of Iowa) overnight at 4°C. Samples were washed three times in PBS and then incubated with either FITC 488 goat anti-rabbit IgG (1:250; Invitrogen) or TRITC 543 goat anti-rabbit IgG (1:250; Invitrogen) for 1.5 h at room temperature. Samples were washed and mounted with Fluoroshield with DAPI (Sigma) and visualized on an Olympus IX81 inverted fluorescence microscope. For histological analysis, pellet tissues were fixed in 10% buffered formaldehyde for 4 h, dehydrated in alcohol, and then paraffin-sectioned in 8 μm thickness. Alcian blue was used to detect the sulfated proteoglycan GAG. The staining intensity was compared between the two chondrocytes groups by light microscope.
Total GAG quantification
Total sulfated GAG content was determined in monolayer and alginate or pellet samples from day 7 and day 14 cultures by using 1,9-dimethylmethylene blue (DMMB; Polysciences). Chondroitin sulfate C from shark cartilage was used as a standard. Briefly, 100 μL of the digested sample was combined with 1 mL dimethylmethylene blue dye solution, and the absorbance was immediately measured at 656 nm. DNA was measured using Hoechst 33258 dye. Briefly, 10 μL of the digested sample was combined with 200 μL Hoechst dye solution (0.7 μg/mL). Fluorescence measurements were taken with an excitation wavelength of 340 nm and an emission wavelength of 465 nm. A standard curve was obtained from calf thymus DNA. The GAG content was normalized to the amount of DNA measured per sample and expressed as μg GAG/μg DNA.
In vivo implantation of cells/polylactic-co-glycolic acid scaffold
All animal experiments were approved by the Animal Care and Use Committee of the Kaohsiung Medical University. The ACs or PLCs were trypsinized and resuspended to a final concentration of 1 × 10 7 cells/mL. The cell suspension was then pipetted into polylactic-co-glycolic acid (PLGA) scaffold (100 μL per scaffold). The scaffolds were cut with dimensions of 2 × 2 × 3 mm 3 , sterilized by irradiation, soaked in 95% alcohol for 2 h, washed in PBS, and aired before use. The cell–scaffold constructs were then incubated for 4 h at 37°C with 5% CO2 to allow for complete adhesion of the cells to the scaffolds. The ACs/PLGA scaffolds were implanted subcutaneously into the dorsal region of five 6-week-old BALB/C nude mice (n = 5). The PLCs/PLGA scaffolds were implanted into the other side of the dorsal region. Eight weeks later, both implants were harvested, fixed, embedded, sectioned and stained with Alcian blue, and counterstained with hematoxylin and eosin. Furthermore, seeded scaffolds were performed immunohistochemical (IHC) staining to detect the expression of Col2a1.
Results
Evaluation of the functional property of RZ, PLCs, and HZ chondrocytes
The femur growth plate in 8-week-old porcine was removed and collected. There are three distinct zones, namely RZ, proliferating zone, and HZ in the femur growth plate. These chondrocytes in the three zones of the epiphyseal growth plate are different in their cell size (Fig. 1A). Based on the physical properties, chondrocytes derived from the three zones were fractionated by discontinuous Percoll gradient prepared by weight and the densities were settled at 1.023, 1.044, and 1.053 g/mL. 42 After centrifugation, the RZ chondrocytes, the PLCs, and the HZ chondrocytes that had different buoyancies were distributed in different Percoll density layers. The mRNA levels of col2a1, col10a1, and aggrecan as the given indexes were employed to distinguish chondrocytes derived from the three zones following the experimental method that was reported by Weisser et al. 42 As shown in Figure 1B, the largest cells, the prehypertrophic/hypertrophic chondrocytes, in the upper fraction have higher col10a1 expression level, the cells in the middle layer that are PLCs express higher level of col2a1 and aggrecan mRNA, and the cells in the lowest layer that are smaller size chondrocytes derived RZ have lower col2a1 mRNA expression level. In addition, to elucidate whether the PLCs have more chondrogenic potential than chondrocytes from the RZ and HZ, we analyzed the mRNA expression levels of sox5, sox6, sox9, mmp13, runx2, and osterix (Fig. 1B). As shown in Figure 1B, the significant expression of genes important for cartilage maintenance and chondrocyte differentiation, including col2a1, aggrecan, sox6, and sox9, was higher in PLCs. In contrast, the expression of col10a1, mmp13, and runx2 was lower in PLCs. Furthermore, PLCs have better cell growth rate (Fig. 1C), cell viability (Fig. 1E), and synthesized cartilage matrix with high levels of GAGs (Fig. 1D). These data can robustly indicate that the PLCs are better than other cell sources for cartilage repair.
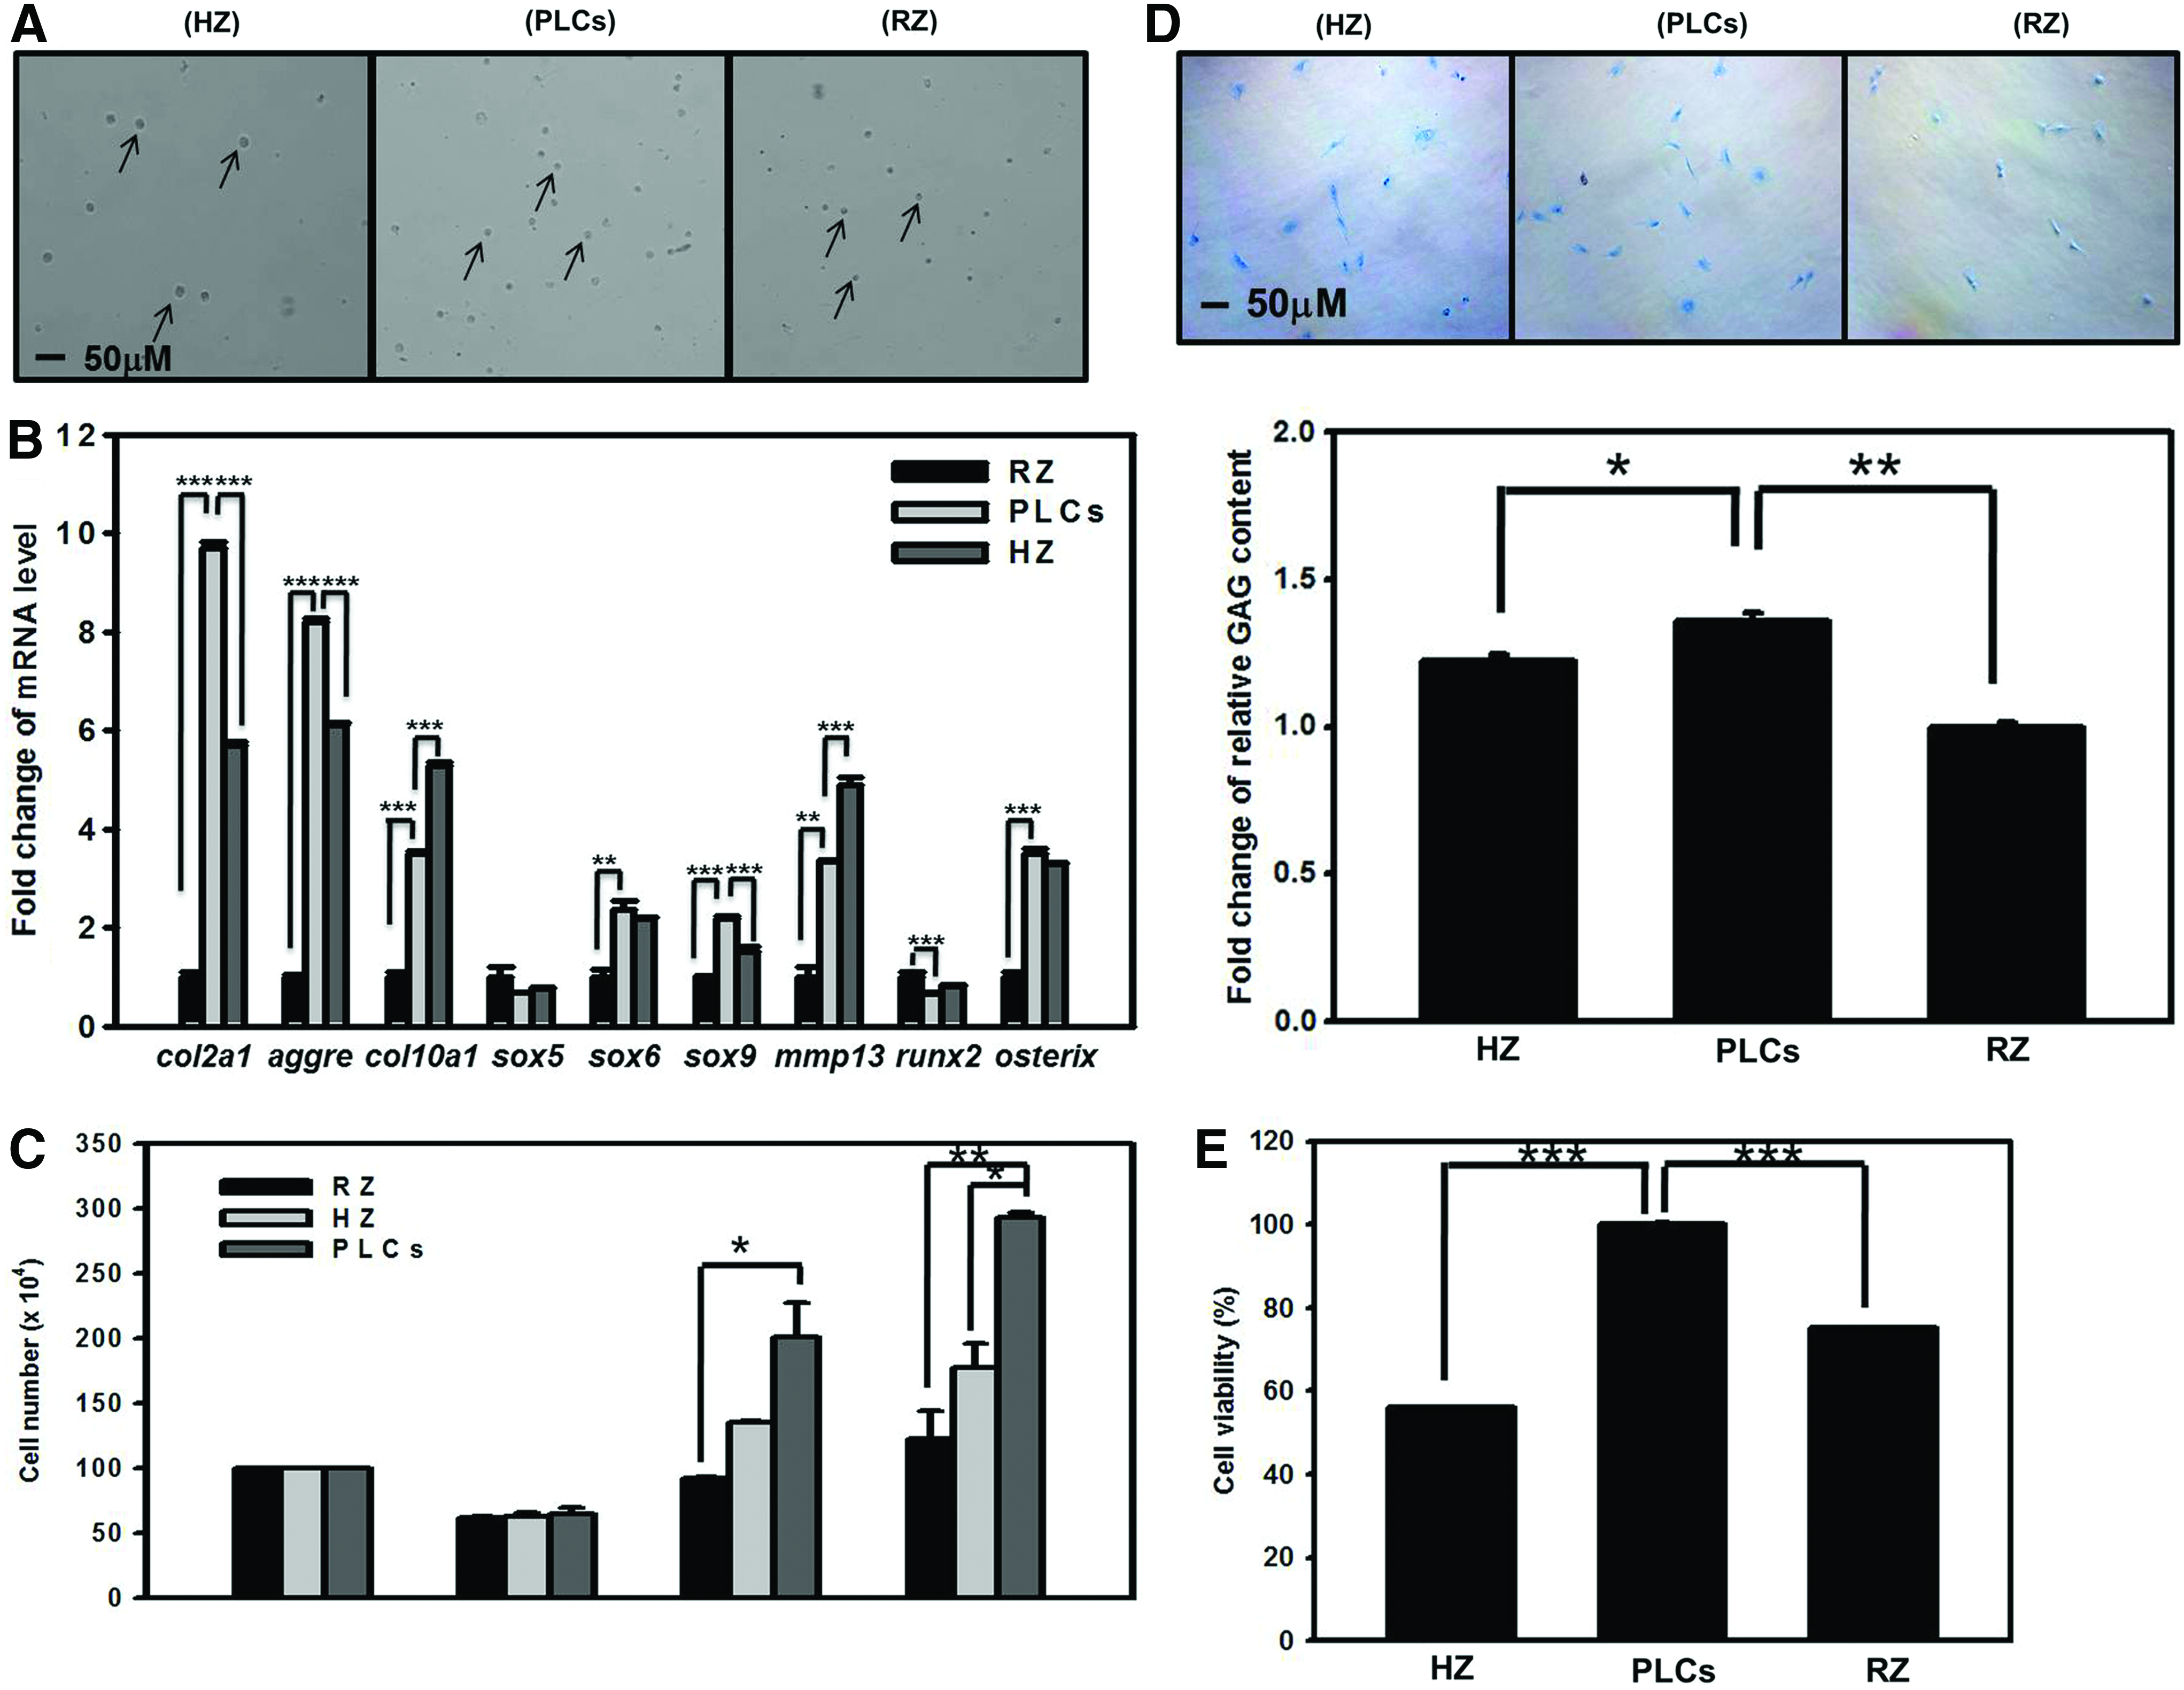
Separation of porcine chondrocytes by continuous Percoll gradient.
Comparisons of morphology and the viability of ACs and PLCs
As the passage number increased, the chondrocytes might lose their chondrogenic character. Phase-contrast microscopy imaging reveals that ACs appeared long shape at P7 and PLCs were round-like appearance at P7 in monolayer culture, as shown in Figure 2A. In this study, the MTT assay served to evaluate the viability of PLCs and ACs in monolayer or 3D alginate-based hydrogel. Whereas early and later passage PLCs in monolayer and 3D cultures had less change in their viability, the viability of ACs was good in the early passage and was gradually reduced in the late passage. The results show that the PLCs survive for prolonged time periods and might significantly increased their cell numbers and achieved the higher viability compared with the ACs.

Passage-dependent phenotype and cell viability change of ACs and PLCs.
Evaluation of the proliferation rate of ACs and PLCs
Subsequent autologous chondrocyte implantation generations have concentrated on improving of the low proliferation rate of chondrocytes. 43 The proliferative activity of chondrocytes is an important parameter approaching to the effectiveness of cell-based therapeutic cartilage regeneration. To assess the proliferative activity of ACs and PLCs, equal number of ACs and PLCs was initially seeded for monolayer culture. The cell number was counted after 24, 48, and 72 h, and the PDT was algebraically solved. As shown in Figure 3A, the PLC multiplication is much fast. In contrast, the growth rate of AC was relatively lower. Our calculation shows that the PDT of the PLCs was 20.9 h (standard deviation [SD] = 0.78) and the PDT of the ACs was 29.5 h (SD = 1.21). To further analyze the proliferation rate of ACs and PLCs, we investigated the cell cycle distribution by flow cytometry using PI staining and arrested the cell cycle at G1 by depleting serum in these cells. As shown in Figure 3B, C, over 16 h, in ACs, the G1 population declined from 87.7% ± 5% to 74.8% ± 1%, whereas the S and G2/M fractions reached 13.3% ± 3% and 11.9% ± 2.4%, respectively, and in 24 h, 33.1% of cells entry the S phase, until 28 h, most cells (42.8%) entry the G2/M phase. In the PLCs, over 16 h, the G1 population declined from 89.1% ± 3% to 62.1% ± 2%, whereas the S and G2/M fractions reached 26.6% ± 4% and 11.4% ± 2.4%, and after 24 h, the S and G2/M populations were 26.4% ± 6% and 37.5% ± 3%, respectively. These results represent that the proliferative activity of PLCs is much better than ACs. Based on the above calculation and statistical analysis, the early and late passage of cultured PLCs has the similar propagation rate. Relatively, although the proliferative activity of ACs with early passage is still good, the ACs with late passage are no longer bearing high proliferative activity.

Proliferation rate of ACs and PLCs.
Comparisons of col2a1, aggrecan, col10a1, col1a, sox5, sox6, and sox9 mRNA expression in ACs and PLCs
The dedifferentiation of chondrocytes frequently occurs when the expansion of chondrocytes is set in vitro multiplication. Hence, to maintain the chondrocytes differentiation and produce great amounts of type II collagen, aggrecan are required. 44 Furthermore, we analyzed the mRNA levels of col2a1, aggrecan, col10a1, col1a, sox5, sox6, and sox9 by real-time PCR (Fig. 4A–G). As shown in Figure 4A–G, after chondrocytes expansion with serial passage, the chondrogenic markers expression levels in the chondrocytes, including col2a1, aggrecan, and sox9, were significantly lowered (Fig. 4A, B, E). In contrast, the fibroblastic markers expression level, the col10a1, showed increase in both PLCs and ACs (Fig. 4C). Furthermore, the degradation rate of col2a1, aggrecan, and sox9 mRNA was slower in PLCs than in ACs (Fig. 4A, B, E). In contrast, the elevation rate of col10a1mRNA was faster in ACs than in PLCs; in addition, the degradation rate of col1a, sox5, and sox6 mRNA are not notably changed in the PLCs and ACs (Fig. 4D, F, G). In addition, we analyzed the mRNA expression levels of col2a1, aggrecan, col10a1, col1a, sox5, sox6, and sox9 from P1 to P6 passages in ACs and PLCs, respectively. As shown in Figure 5, the col2a1, aggrecan, sox5, sox6, and sox9 mRNA level in the PLCs from P1 to P6 passages is significantly higher than that in ACs in monolayer culture. Furthermore, the col10a1 and col1a mRNA expression level in PLCs was lower than that in ACs in monolayer culture, as shown in Figure 5C, D. These results suggested that the molecular mechanism of post-transcriptional might at least partially participate in the regulation of phenotype change during the dedifferentiation of chondrocytes. In addition, we compared the relative mRNA expression levels of col2a1, aggrecan, col10a1, col1a, sox5, sox6, and sox9 from P1 to P6 passages between ACs and PLCs. As demonstrated in Figure 5, the col2a1, aggrecan, sox5, sox6, and sox9 mRNA expression level of PLCs from P1 to P6 passages was significantly higher than that of ACs in monolayer culture, along with the passage increased (col2a1: PLCs vs. ACs, 2.5-fold in P1, 3.1-fold in P3, and 4.8-fold in P6; aggrecan: PLCs vs. ACs, 3.2-fold in P1, 3.7-fold in P3, and 6-fold in P6; sox5: PLCs vs. ACs, 1.4-fold in P1, 1.8-fold in P3, and 2.1-fold in P6; sox6: PLCs vs. ACs, 0.8-fold in P1, 1.2-fold in P3, and 1.4-fold in P6; sox9: PLCs vs. ACs, 2.4-fold in P1, 1.6-fold in P3, and 1.7-fold in P6) (Fig. 5A, B, E, F, G). Furthermore, the col10a1 and col1a mRNA expression level of PLCs was lower than that of ACs in monolayer culture (col10a1: PLCs vs. ACs, 0.6-fold in P1, 0.3-fold in P3, and 0.4-fold in P6; col1a: PLCs vs. ACs, 0.6-fold in P1, 0.8-fold in P3, and 0.7-fold in P6) (Fig. 5C, D). Similar results are also demonstrated in pellet culture as shown in Figure 5 H–N. Hence, the gene expression analysis revealed the obvious difference between ACs and PLCs at P0–P6. Chondrogenic ECM protein production was also assessed in the monolayer culture and pellet culture at P3 passage. As shown in Figure 5O, immunofluorescence detection of Col2a1 was greater in PLCs at both culture conditions in comparison with ACs. These data were consistent with mRNA results.
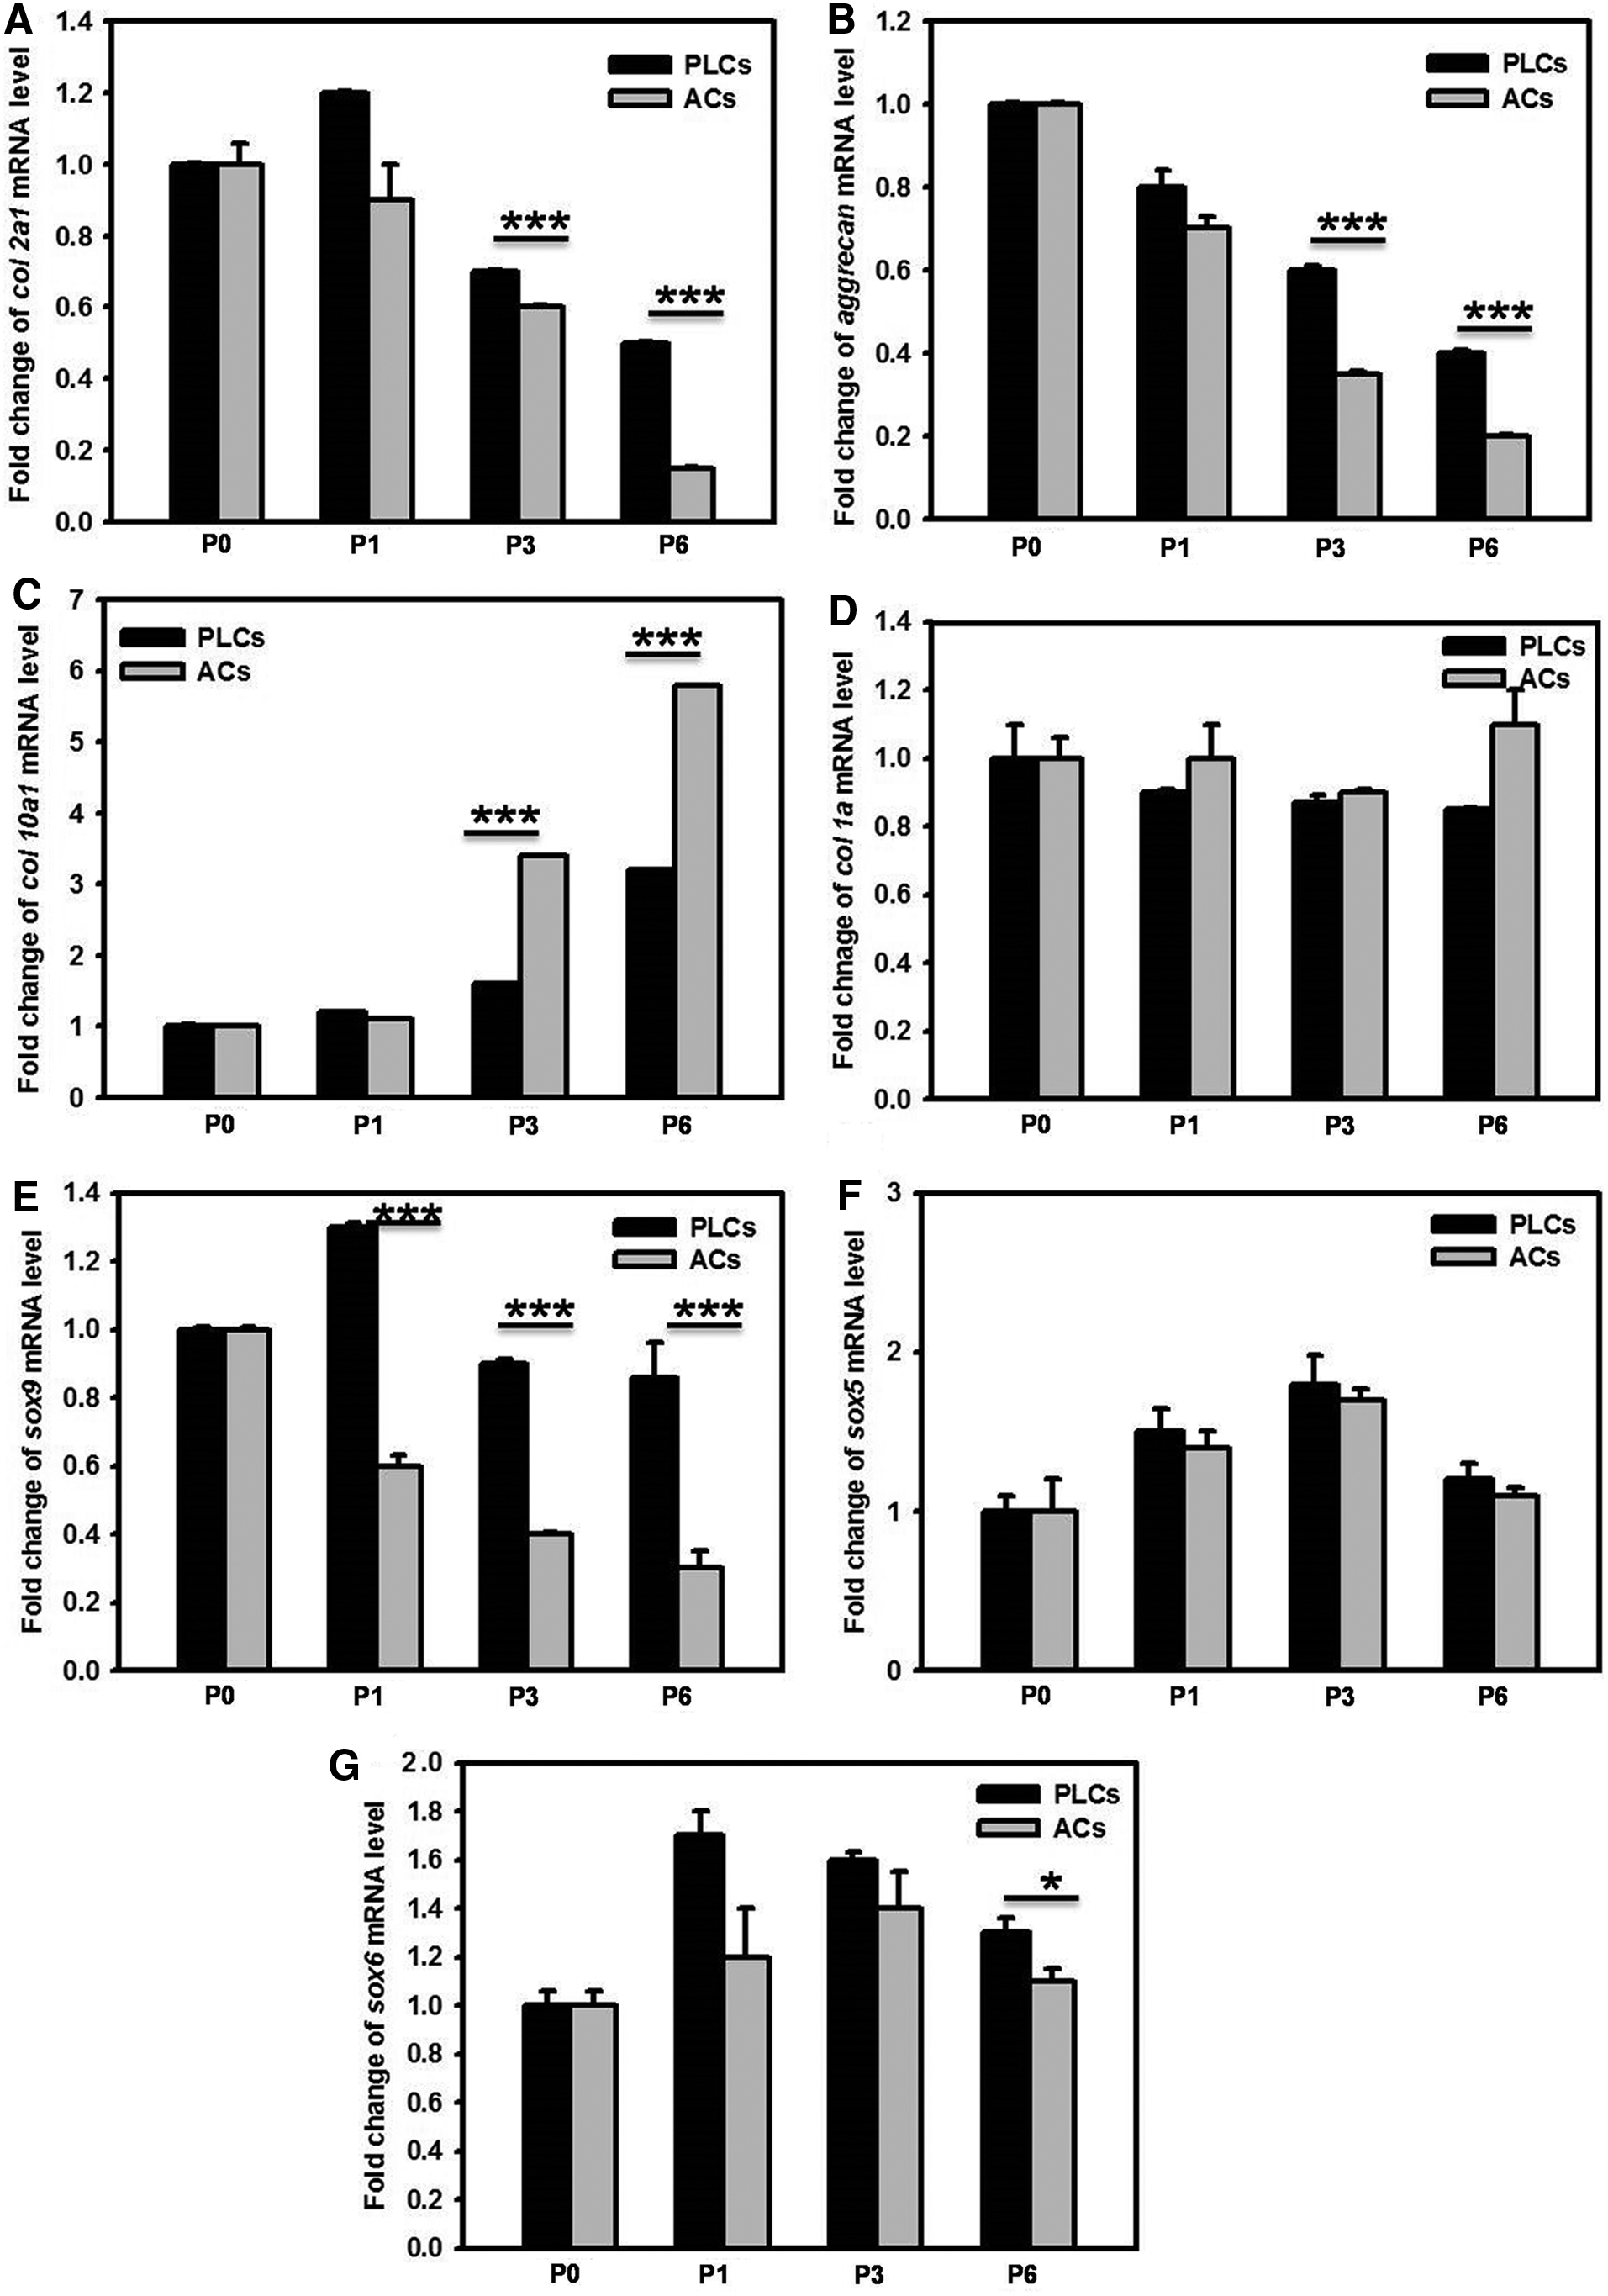
The mRNA degradation or elevation rate of col2a1, aggrecan, col10a1, col1a, sox5, sox6, and sox9 of ACs and PLCs in serial passage. The col2a1
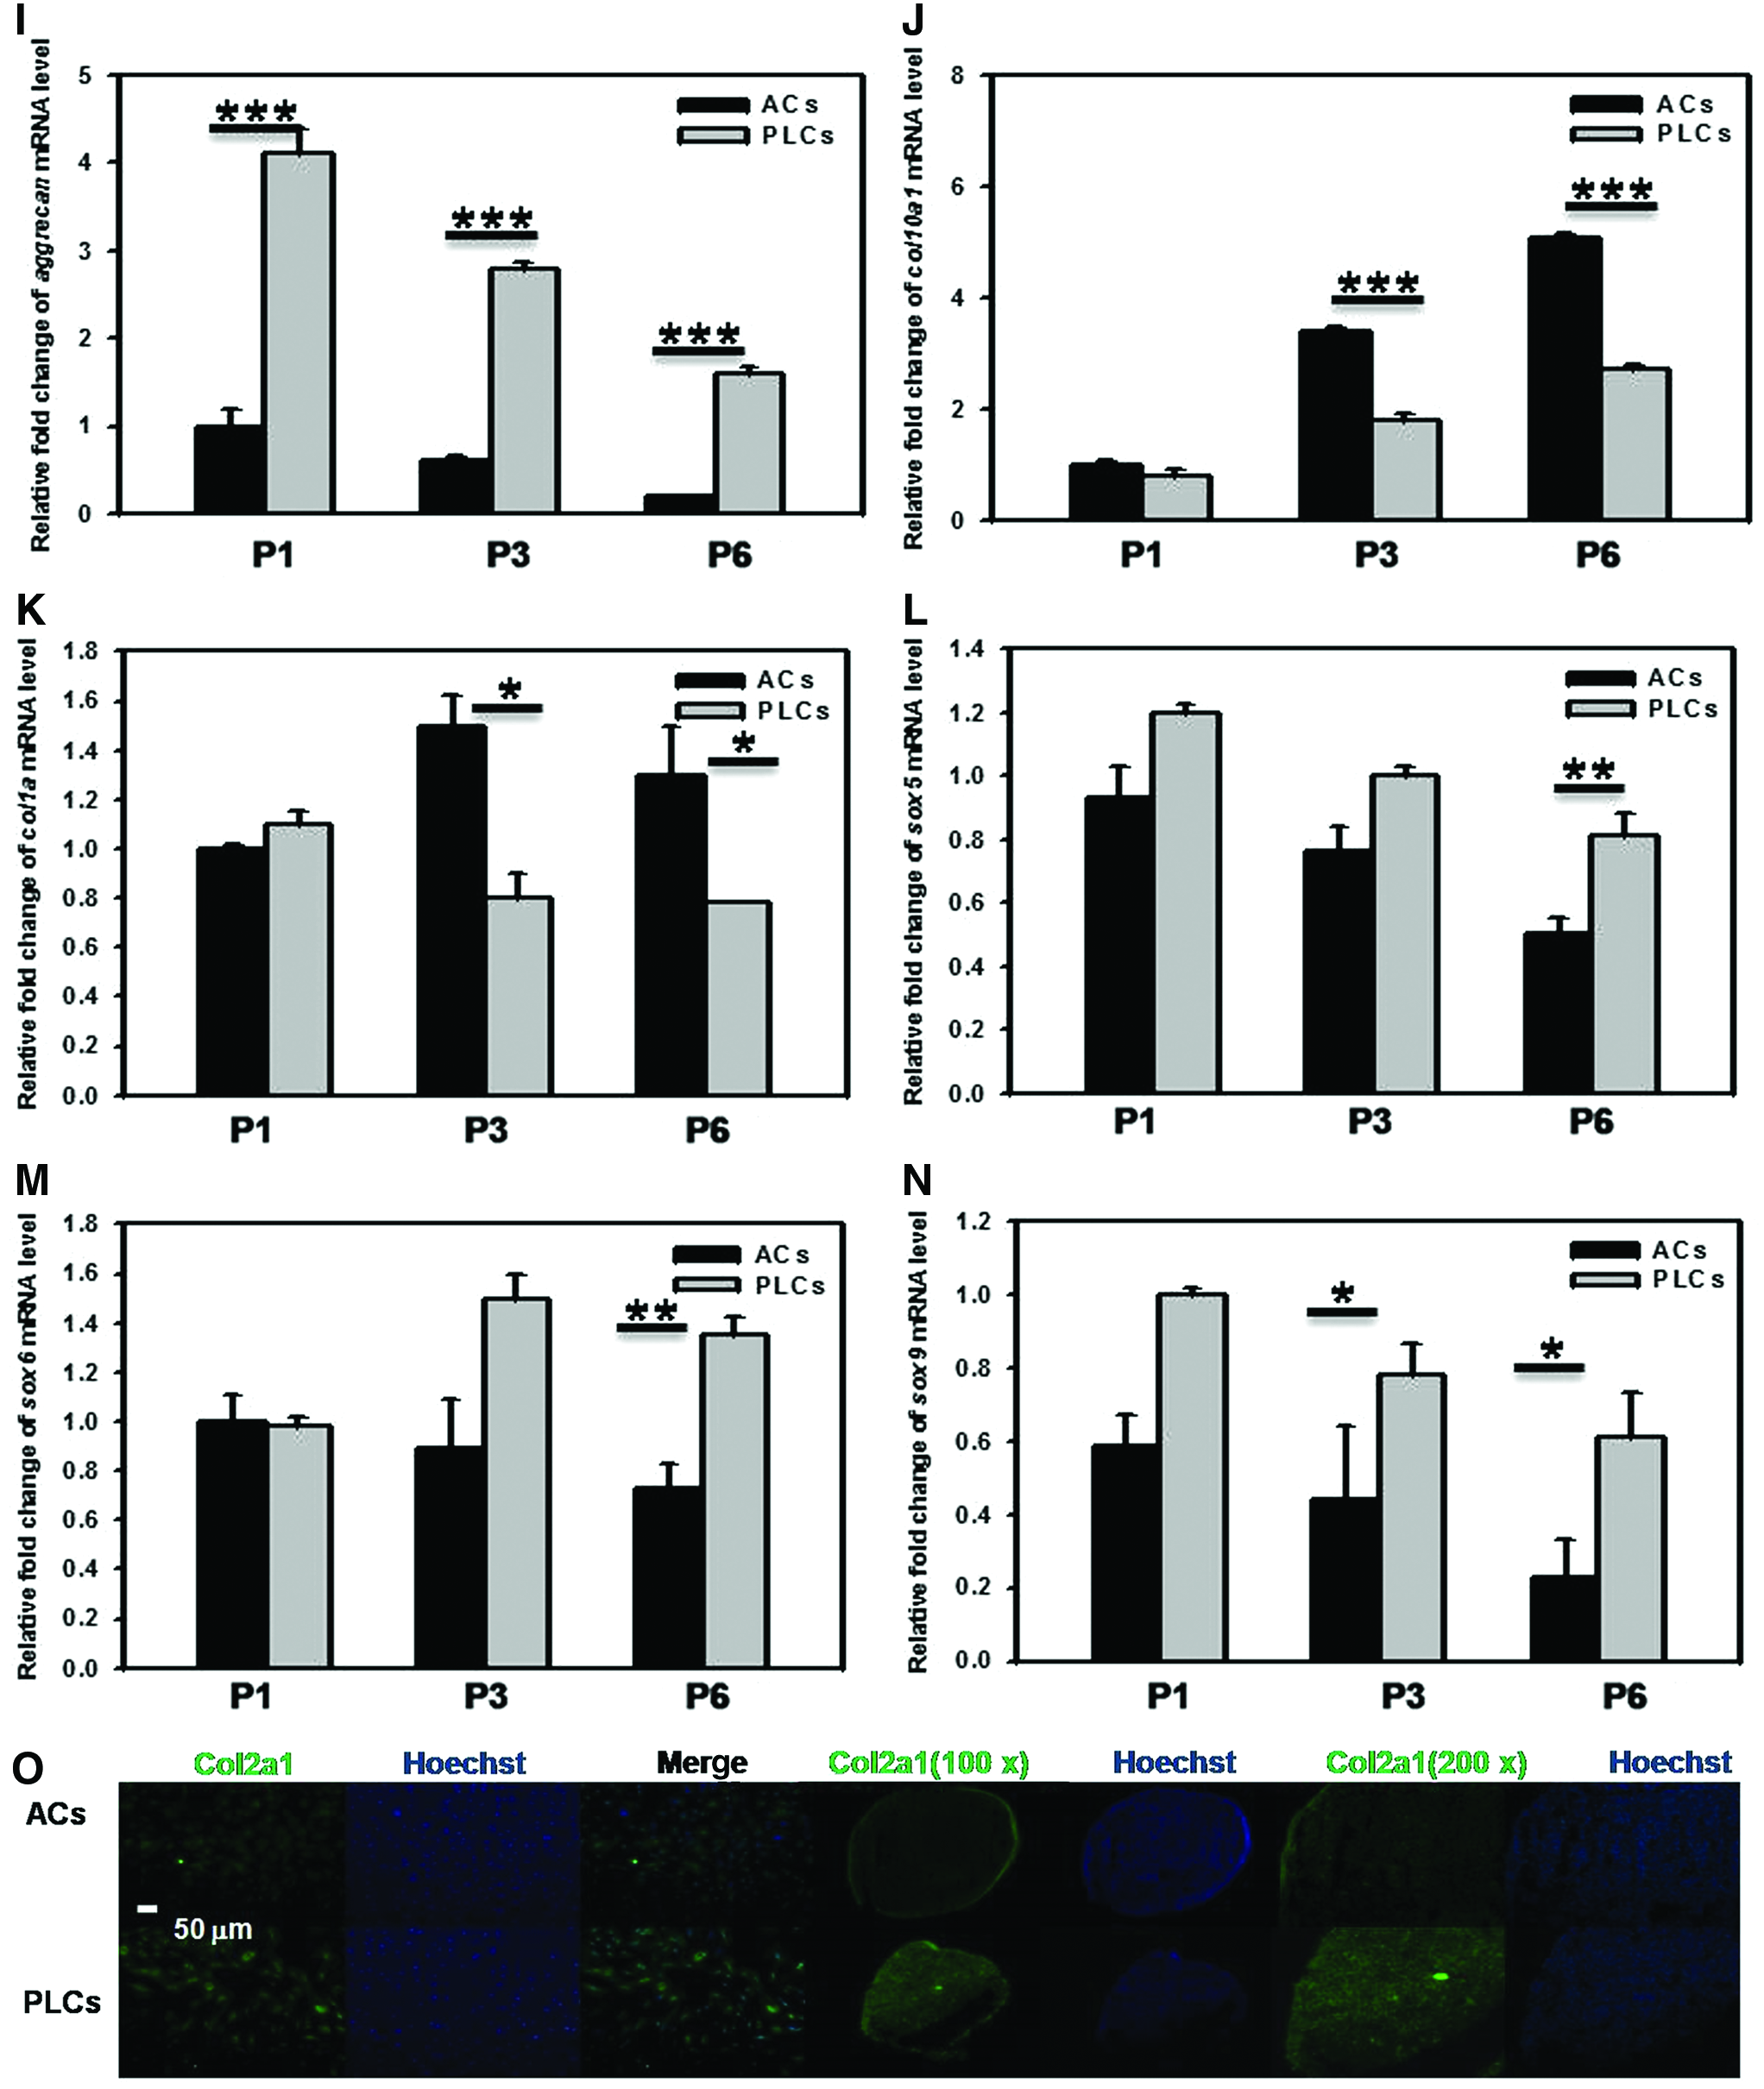
The expression of col2a1, aggrecan, col10a1, col1a, sox5, sox6, and sox9 mRNA and COL2a1 protein in the same passage of ACs and PLCs. Real-time PCR was performed to compare the mRNA levels of col2a1
Total GAG content detection of ACs and PLCs in 2D and 3D cultures
In addition to chondrogenic extracellular proteins, GAG synthesis is an essential hallmark of chondrogenic differentiation. 45 To qualitatively detect the GAG accumulation in PLCs and ACs in the monolayer culture or pellet culture, samples were stained with the Alcian blue. As shown in Figure 6B, there are significant increases in GAG content at PLCs compared with ACs. Furthermore, the GAG content in three culture systems was quantified by the DMMB assay and normalized to DNA content (Hoechst assay). Total GAG content of PLCs in monolayer, alginate, and pellet culture systems was higher than that of ACs at 7 and 14 days (Fig. 6A). These results demonstrated that PLCs has better ability to maintain the chondrogenic phenotypes than ACs during in vitro expansion.
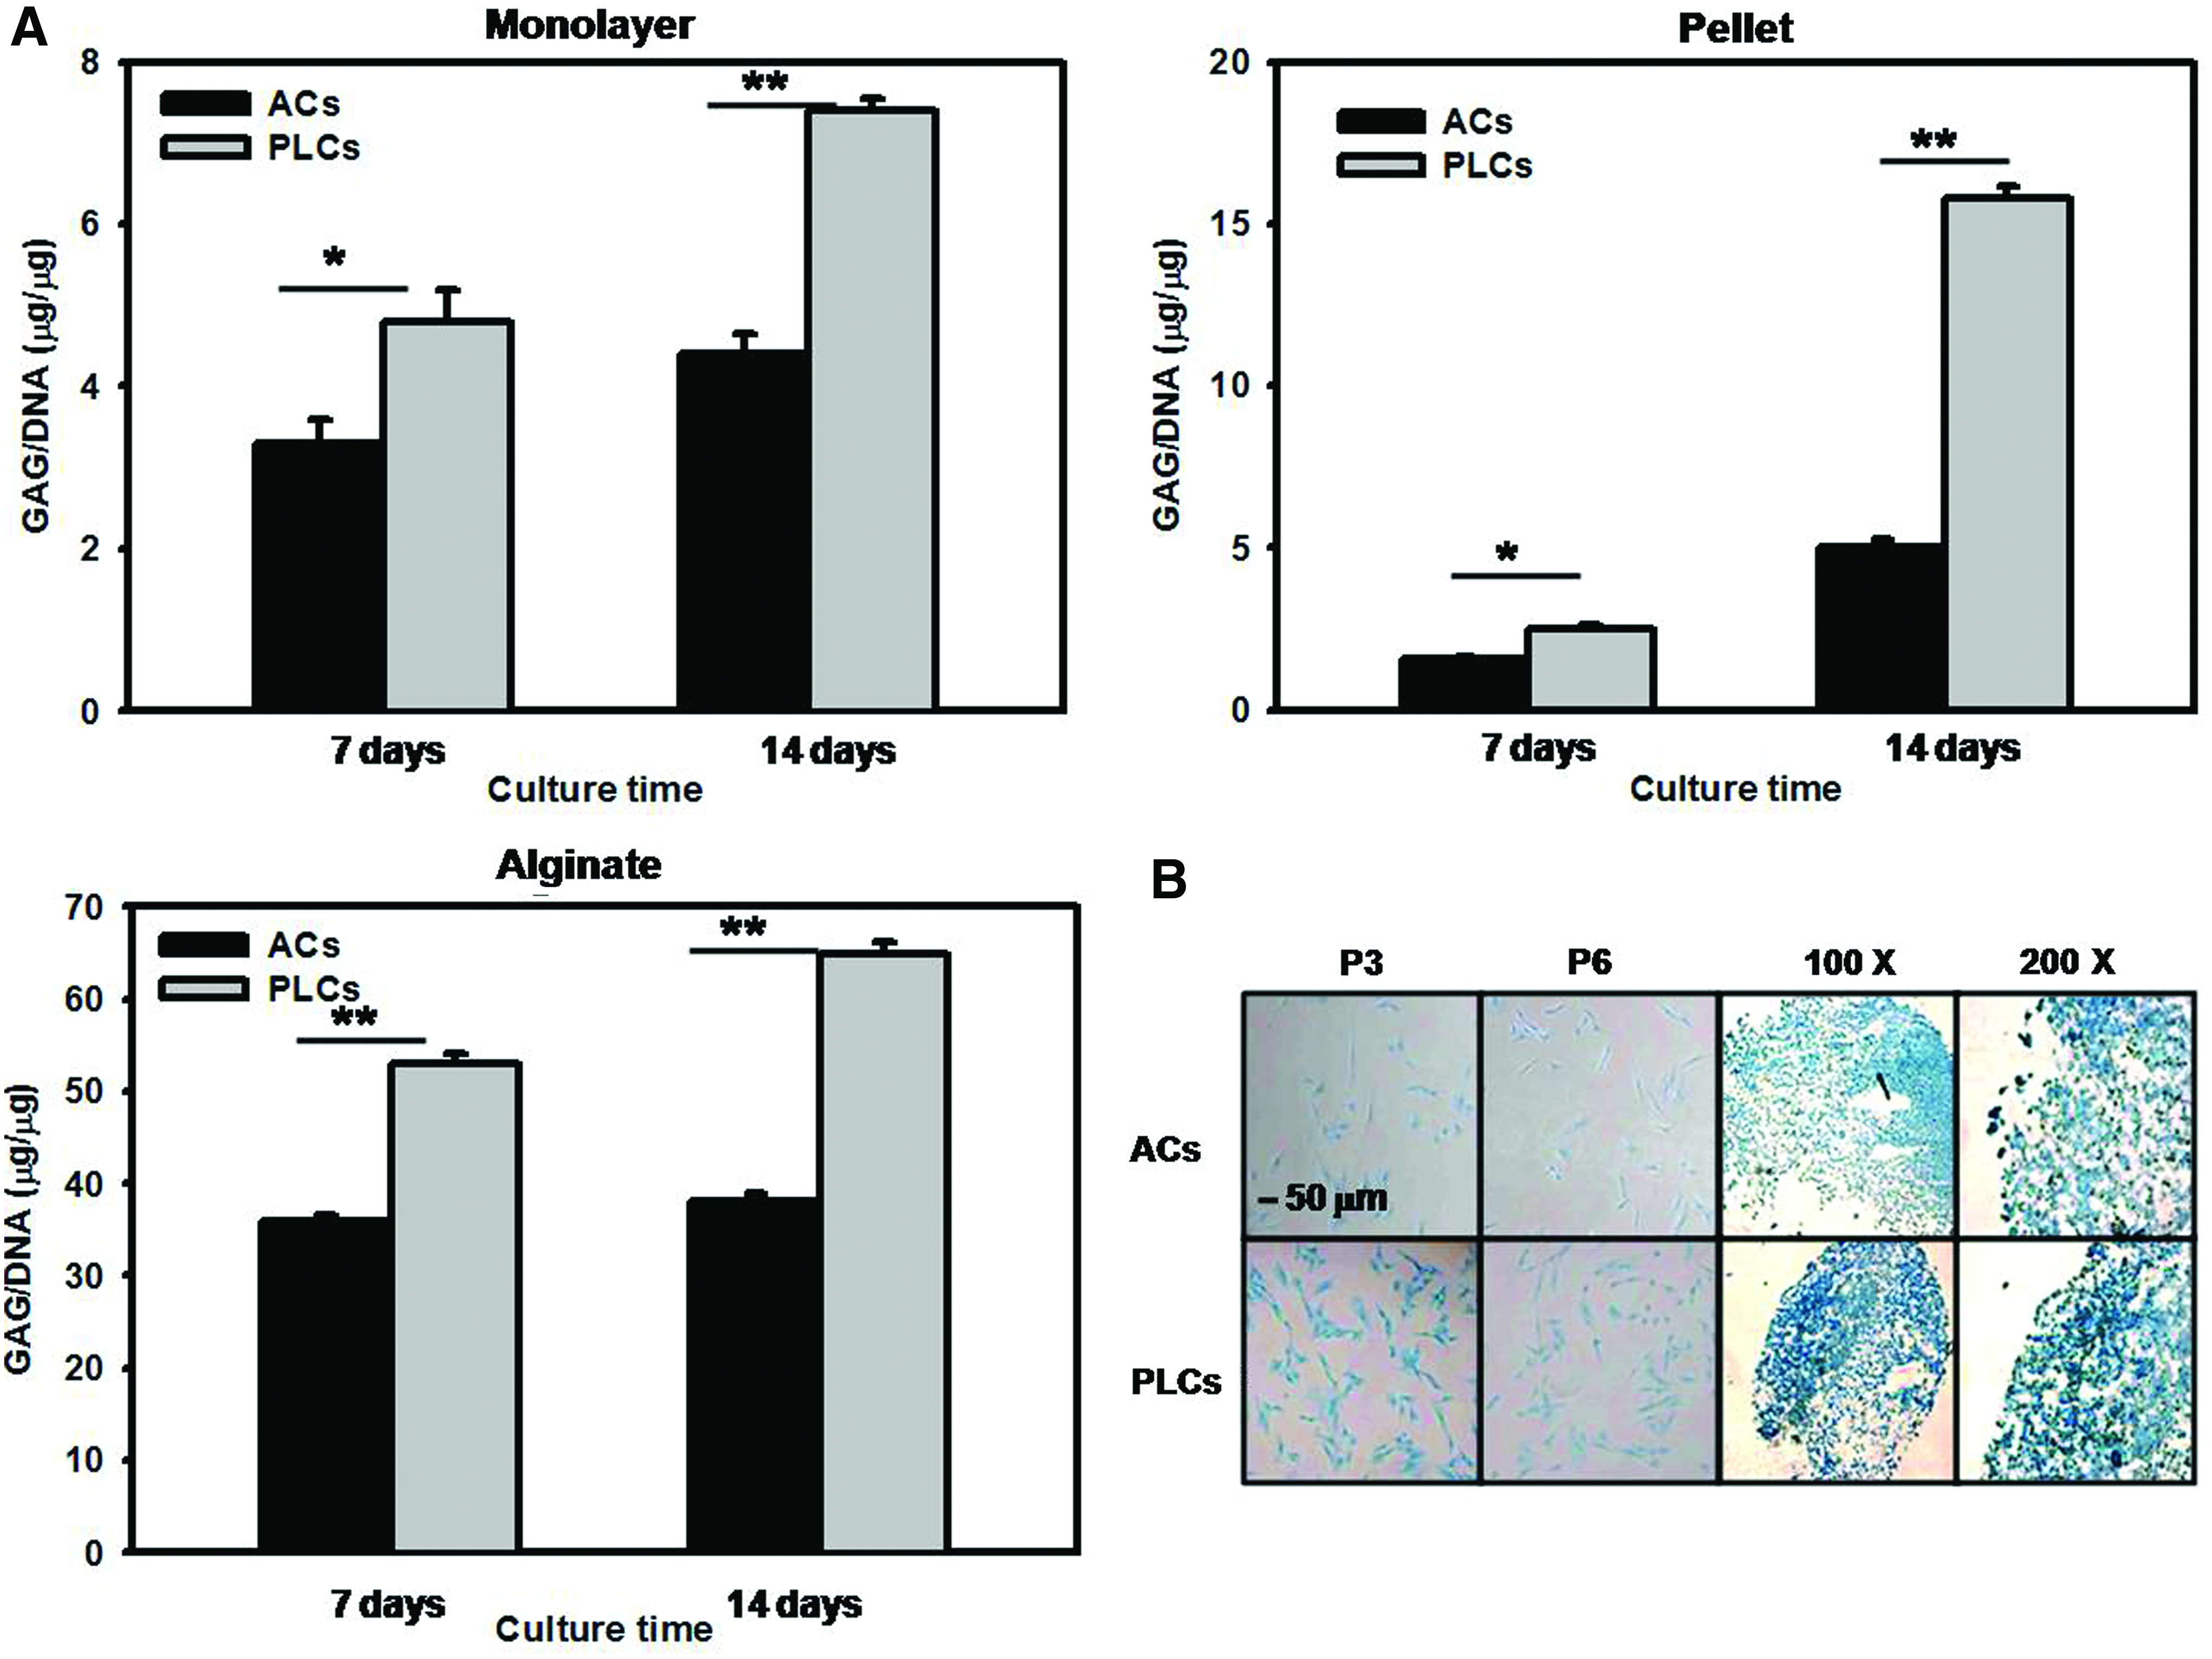
The GAG contents of ACs and PLCs in 2D or 3D culture systems.
Comparisons of the senescence or apoptotic markers with prolonged passage of ACs and PLCs
A previous study has shown that chondrocyte senescence plays an essential role in cartilage degeneration in aging and also increased along with subculture-induced dedifferentiation of chondrocytes. 46 As shown in Figure 7A, consistent with previous studies,35,47,48 late passage (>P4) chondrocytes showed morphological changes typical of cells undergoing senescence, such as an enlarged nucleus and increases in specific SA-β-gal in both ACs and PLCs. And we have further investigated the cellular senescence with the acidic beta-galactosidase assay in P3, P6, and P9 passages of ACs and PLCs. As shown in Figure 7A, a passage-dependent increase of SA-b-gal positivity fashioned in both ACs and PLCs. Compared with the acidic beta-galactosidase activity, the X-gal positivity in PLCs is relatively less than that in ACs in the same passage. SA-β-gal-positive cells were much more in ACs (P3, P6, and P9, 26%, 52%, and 71%, respectively), whereas less number of positive cells appeared in PLCs (P3, P6, and P9, 18%, 37%, and 58%, respectively). This suggested that both ACs and PLCs spontaneously progressed to cellular senescence after long period of subculture; in addition, senescence in chondrocytes is associated with the dedifferentiation status, which indicates that the speed of loss of differentiated chondrocyte phenotypes in PLCs is slower than that in ACs in in vitro culture. Next, we also investigated the expression of apoptosis markers of the ACs and PLCs from passages P3–P9 in monolayer culture and P3–P12 in alginate culture. As shown in Figure 7B, in monolayer culture, the active caspase-3 protein expression was obviously increased at P3 passage and gradually increased until the P9 passage in ACs. However, in PLCs, the protein expression of active caspase-3 protein was only slightly increased from passage P6 to P9 in comparison to ACs; in addition, the active caspase-9 protein expression was remarkably elevated at P6 passage in ACs compared with the PLCs. Furthermore, in alginate culture, the active caspase-3 and caspase-9 were early detected in the preceding passage in ACs and the protein expression level was also higher compared with PLCs. These results indicated that early cell death occurs in ACs and relatively late appearance in PLCs.

The senescence and apoptotic markers in ACs and PLCs.
Comparison of chondrogenesis in vivo by PLGA scaffolds seeded with ACs and PLCs
To assess the efficacy of chondrogenesis in vivo, the AC- and PLC-seeded PLGA scaffolds were subcutaneously transplanted in nude mice for a period of 8 weeks. Proteoglycan synthesis was examined using Alcian blue staining. The staining was digitalized by ImageJ software. Also, we practiced statistics calculation, and all data were plotted in bar charts. As shown in Figure 8A (left panel), the deposition of GAG could be observed by Alcian blue staining, which was more eminent in the PLCs/PLGA scaffold shown for comparison. The results pointing toward cartilage matrix produced by the PLCs in the PLGA scaffolds were confirmed by the positive immunostaining of Col2a1, staining was significantly increased in the areas of the construct (Fig. 8A, right panel). Taken together, these results demonstrate that PLCs/PLGA scaffolds can induce more neocartilage formation subdermally 8 weeks after implantation.
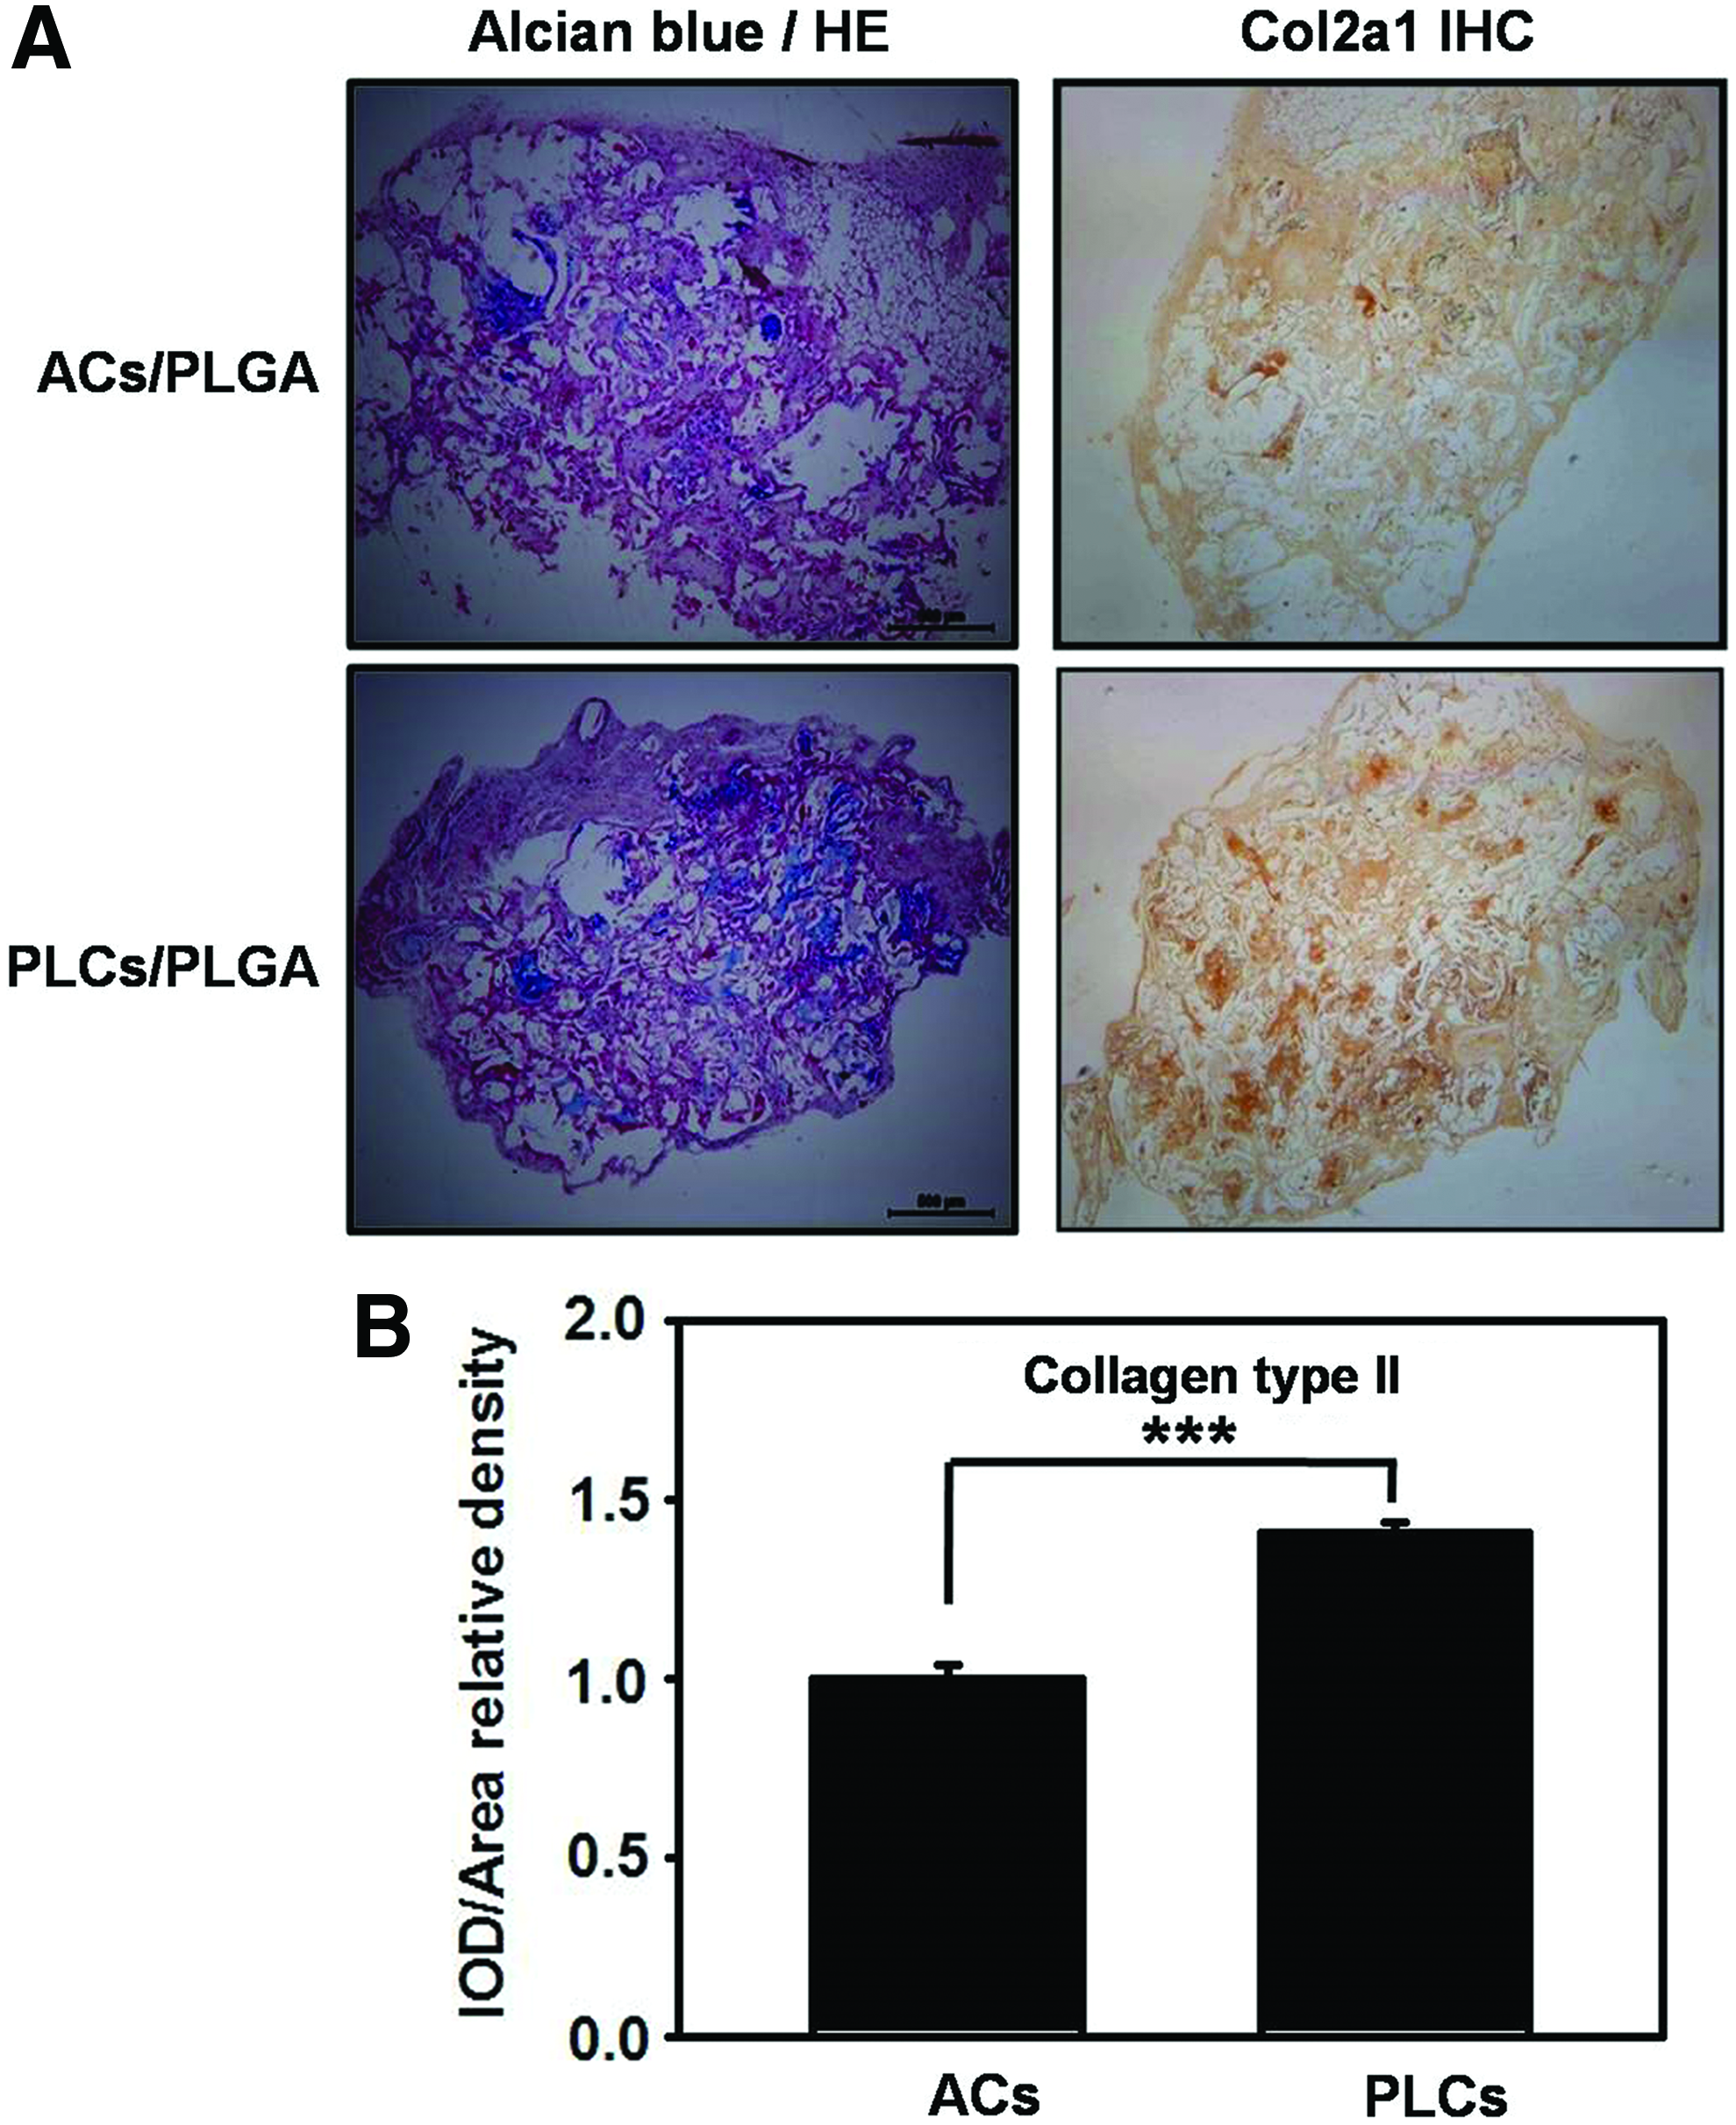
Histochemical and immunohistochemical examinations of the ACs and PLCs embedded in PLGA scaffold after subcutaneous transplantation in nude mice.
Discussion
Many studies had reported that the isolation of different layers of chondrocytes from the growth plate cartilage of various species including chicken, 49 bovine,42,50 and mice 51 using different cell sedimentation rates has been accomplished. And also could gain high purity of different layer cells by centrifugation method (enrichment the RZ cells to 95%, hypertrophic cells to 90%, and proliferative layer cells to 75%). 51 However, the purified purity still needed to improve especially in proliferating layer of chondrocytes. Recently, using microarray data set, transcriptome profiling of microdissected zones of mouse growth plate cartilage was performed to get appropriate cell surface markers, and then, the flow cytometry and immunomagnetic cell separation methods were performed to discriminate and purify cell populations of the growth plate.52,53 Nevertheless, the suitable cell surface marker identified in small animal might not apply to different species. In addition, many established growth plate markers such as extracellular molecules (e.g., Col10a1, Col2a1, glycoproteins, and MMP13), transcription factors (e.g., members of the Sox and Runx families), and signaling molecules (e.g., Ihh and PTHrP) were also not appropriate for cell sorting54–56 in large animals. Hence, for more precise isolation of the different layers of chondrocytes from the growth plate cartilage of a large animal, the appropriate cell surface markers need to be further clarified.
In this study, we have demonstrated for the first time that PLC is a better cell source in facilitating cartilage formation. This conclusion was build upon the following observations: (1) PLCs had better proliferation rate than ACs. Mainly, an essential step in cell therapy is to obtain enough cell number before implantation. To diminish the long-term cultures and its adverse consequences ideally, one should use high proliferative cells that can achieve necessary cell number in a shorter period of time. In addition, we counted the cell number and labeled the cells with PI and analyzed the cell cycle using the flow cytometry (Fig. 3A, B). The results showed the higher proliferation potential of PLCs in comparison with the ACs. (2) PLCs produced more GAG than ACs in both monolayer and 3D cultures (Fig. 6A, B). After prolonged in vitro culture, dedifferentiated chondrocytes appear to lose their chondrogenic markers such as Col2A1 and GAG.57,58 In our study, as demonstrated by the DMMB assay (Fig. 6A) and Alcian blue staining (Fig. 6B), PLCs could produce more deposition of GAG, which implied that the PLCs might maintain more chondrogenic property than ACs. (3) Furthermore, consistent with the increase in GAG matrix production, the real-time PCR and IHC staining indicated that PLCs could express elevated levels of col2a1, aggrecan, sox5, sox6, and sox9 (Fig. 5), which are important for chondrocyte differentiation and cartilage formation. Moreover, the MMP13 (data not shown) and Col10 expression, markers for hypertrophy of cartilage tissue, is obviously lower in PLCs. Therefore, the high COL2:COL10 ratio might lead to delay in the hypertrophic differentiation process in PLCs. (4) Lower senescence and apoptosis rate in PLCs. Senescence of chondrocytes in monolayer culture is always accompanied with decreased expression of chondrocyte-specific glycoproteins such as ColII, proteoglycans, and glycoproteins. 33 From the above data, the PLCs displayed higher expression levels of col2a1, aggrecan, sox5, sox6, and sox9 (Fig. 5) compared with ACs in each passage. These results were consistent with the observation that the PLCs were also less occurrence of onset of senescence and dedifferentiation, and persistently sustain the chondrogenic characteristics for extended periods of time in vitro. (5) Furthermore, we found that IHC staining showed type II collagen, critical component of cartilage matrix, which significantly increased in PLCs/PLGA scaffold compared with ACs/PLGA scaffold after implanting subcutaneously in nude mice (Fig. 8). These findings indicated that PLCs are better in depositing cartilage matrix than ACs. A previous study has indicated that alginate could promote osteogenic differentiation 59 and primed to a hypertrophic-like state of stem cell through induced ALP activity; this explains that calcium ions incorporated in alginate gelation might induce chondrocytes hypertrophic change and transform to osteogenesis due to increased expression of osteonectin, OP, and osteocalcin. 60 The chondrocyte programmed to terminal differentiation will go to the end of apoptosis or cell death. 61 By the way, the cells in the 3D matrix might state in nutrient limitation. This is a disadvantage for cell survival. These might explain the phenomenon that active caspase-3 and caspase-9 to be induced in lower passages in alginate culture than in monolayer culture, as shown in Figure 7B.
In conclusion, from these results, we found that PLCs have a high cell growth rate and ability to retain phenotype and might be more suitable as cell source either for growth plate or articular cartilage regeneration. However, when considered for the clinical application, the autologous source will be impossible due to the harvest of growth plate tissue supposed to induce donor site growth arrest.
Cartilage has long been viewed as an “immunoprivileged” tissue 62 ; dense ECM has been theorized to prevent immune cells and factors from recognizing chondrocyte antigen. This concept provided the basis and justification for allogenic cartilage transplantation. However, the premise of isolated chondrocyte immune privilege remains contested, as many groups, using different species and different experimental designs, have supported or refuted this theory. A recent human juvenile and adult chondrocyte study demonstrated that isolated chondrocyte not only failed to activate T cells but also were able to inhibit activated T cell proliferation. From these findings, the clinical application of PLCs may be consider for allogenic cell source, which was isolated from cadaver donor or amputated limb.
Footnotes
Acknowledgment
This work was supported by a grant from the Ministry of Science and Technology (Taipei, Taiwan; MOST 106-2314-B-037-010).
Disclosure Statement
No competing financial interests exist.