
Abstract
Skeletal muscle is a tissue that is directly involved in the progression and persistence of type 2 diabetes (T2D), a disease that is becoming increasingly common. Gaining better insight into the mechanisms that are affecting skeletal muscle dysfunction in the context of T2D has the potential to lead to novel treatments for a large number of patients. Through its ability to emulate skeletal muscle architecture while also incorporating aspects of disease, tissue-engineered skeletal muscle (TE-SkM) has the potential to provide a means for rapid high-throughput discovery of therapies to treat skeletal muscle dysfunction, to include that which occurs with T2D. Muscle precursor cells isolated from lean or obese male Zucker diabetic fatty rats were used to generate TE-SkM constructs. Some constructs were treated with adipogenic induction media to accentuate the presence of adipocytes that is a characteristic feature of T2D skeletal muscle. The maturity (compaction and creatine kinase activity), mechanical integrity (Young's modulus), organization (myotube orientation), and metabolic capacity (insulin-stimulated glucose uptake) were all reduced by diabetes. Treating constructs with adipogenic induction media increased the quantity of lipid within the diabetic TE-SkM constructs, and caused changes in construct compaction, cell orientation, and insulin-stimulated glucose uptake in both lean and diabetic samples. Collectively, the findings herein suggest that the recapitulation of structural and metabolic aspects of T2D can be accomplished by engineering skeletal muscle in vitro.
Impact statement
The tissue engineering of skeletal muscle to model disease and injury has great promise to provide a tool to develop and/or improve therapeutic approaches for improved health care. A tissue-engineered skeletal muscle model of one of the most common and debilitating diseases, type 2 diabetes, has been developed in vitro as evidenced by the structural and metabolic alterations that are consistent with the disease phenotype in vivo.
Introduction
Type 2
Resident stem cells in adult skeletal muscle called “satellite cells” are well-known for their role in replenishing myonuclei after injury.3,4 The progeny of satellite cells (commonly referred to as muscle precursor cells (MPCs), myoblasts, or myogenic progenitor cells) derived from diabetic skeletal muscle exhibit a dysfunctional phenotype in vitro.5–11 While previous work was instrumental in defining the diminished performance of diabetic muscle cells using two-dimensional culture, the unique orientation of myogenic structures that can be achieved with tissue-engineered skeletal muscle (TE-SkM) derived from myogenic cells may support a more physiologically relevant study of disease. The notion that the fundamental characteristics of skeletal muscle T2D in vivo (e.g., reduced insulin-stimulated glucose uptake [ISGU]) extends to their phenotype in cultured myotubes in vitro, 12 suggests an opportunity exists to interrogate diabetic skeletal muscle phenomena using TE-SkM, where MPCs serve as the biological source from which myogenic structures within TE-SkM are developed.
The development of engineered skeletal muscle models using myogenic cells derived from skeletal muscles of patients with Pompe disease, amyotrophic lateral sclerosis, Duchenne, limb-girdle, congenital muscular dystrophy, or those derived from induced pluripotent stem cells, where in vivo characteristics of disease were recapitulated in vitro, supports the enthusiasm to use skeletal muscle tissue engineering as a means for drug screening.13–23 Given the deleterious consequences of T2D, the development of a diabetic TE-SkM model is also important. However, in order for this approach to be meaningful, it is imperative that the characteristics of diabetic skeletal muscle are represented in TE-SkM. For example, an adipocyte component may be useful because adipose tissue located between muscle fibers and beneath the muscle fascia has been observed in T2D skeletal muscle.24–26 Lipid uptake and oxidation are dysregulated in myotubes derived from diabetic satellite cells, just as diabetic muscle is characterized by an accumulation of lipid that contributes to insulin resistance in muscle in vivo.6,27 A better understanding of the complex mechanistic interactions between muscle and adipose tissue is required for a better understanding of the pathogenesis of metabolic diseases.26,28 While the cellular source of adipose tissue within skeletal muscle has not been definitively identified, the adipogenic potential of MPCs is augmented in the context of T2D, which alludes to the possibility that they may contribute to the pathology and may be useful in the context of TE-SkM.29,30
Given the appropriateness of using TE-SkM for the study of skeletal muscle disease and the dire need to develop treatments for T2D, the following study was undertaken to develop a model using MPCs procured from T2D muscle. The inherent capacity for increased diabetic MPC adipogenic differentiation was exploited to emulate the presence of lipids within T2D skeletal muscle. Collectively, the observations that key features of T2D skeletal muscle are maintained in the developed TE-SkM model, where a better orientation of skeletal muscle cells and spatial distribution of fat are observed suggests that this is a useful means for the screening and development of therapeutics for T2D.
Materials and Methods
This study has been conducted in compliance with the Animal Welfare Act and the Implementing Animal Welfare Regulations. The study was carried out in accordance with the principles of the Guide for the Care and Use of Laboratory Animals. It was also approved by the Institutional Animal Care and Use Committee at the University of Texas at San Antonio.
Animals
Experiments were carried out using MPCs procured from lean (FA/+) male or obese (FA/FA), and Zucker diabetic fatty (ZDF) rats purchased from Charles River (Wilmington, MA). ZDF rats were obtained at 4 weeks of age and fed Purina 5008 until 15 weeks of age. All FA/FA rats used in the study had blood glucose levels (from the lateral saphenous vein) greater than 300 mg/dL on the day of euthanasia and cell isolation. All animals were housed in a temperature-controlled environment with a 12-h light/12-h dark cycle and fed ad libitum.
TE-SkM formation
Rat MPCs from lean and diabetic rats were isolated, as described by us previously.31,32 Briefly, several skeletal muscle tissues, including tibialis anterior, extensor digitorum longus, quadiriceps, gastrocnemius, and plantaris were collected from each rat. MPCs were culture expanded in growth medium (GM) composed of 20% fetal bovine serum (FBS), 1% penicillin–streptomycin (P/S), 0.2% MycoZap (MZ), Dulbecco's modified Eagle's medium (DMEM) with 1 g/L
TE-SkM compaction analysis
Daily images were taken of TE-SkM using a digital camera (Sony α600; Minato City, Tokyo, Japan), and surface area coverage of the fibrin gels (n = 4/group) within the PDMS molds was monitored. The percentage of compaction was measured by evaluating the ratio between the total area of the molds and the hydrogel's surface area. The analysis was carried out using ImageJ (National Institutes of Health, Bethesda, MD).
Creatine kinase assay
Creatine kinase (CK) activity of MPCs within the TE-SkM constructs (n = 4/group) was evaluated according to the manufacturer's instructions (Creatine Kinase Activity Assay, MAK116; Sigma-Aldrich, St. Louis, MO). Briefly, TE-SkM was lysed using 1 × RIPA (radioimmunoprecipitation assay) lysis buffer (20-188; EMD Millipore, Billerica, MA) and homogenized using a tissue homogenizer (Omni, Kennesaw, GA). The samples were spun down (15,000 g) to remove debris. Ten microliters of each sample was combined with 100 μL of reconstituted reagent containing the assay buffer, a substrate solution, and the enzyme mix. Absorbance measurements were carried out after 20 and 40 min of incubation at room temperature at 340 nm. Total protein concentration was determined using a BCA protein assay (EMD, Millipore, Germany). CK measurements were normalized to μg/μL of protein.
Uniaxial tensile testing
TE-SkM (n = 4/group) samples (25 mm in length) were evaluated using uniaxial tensile testing until the point of failure using the CellScale (Waterloo, ON) UStretch machine with a 2.5 N load cell. Before testing, samples were stained with Hematoxylin for 1 min and then rinsed with PBS five times for easier visualization. The testing was performed by preconditioning the samples by applying a total extension to 12 mm, then stimulating them for five cycles at a cyclic strain of 1 mm followed by a step at 1 mm/s up to failure. All the samples were immersed in H2O at 37°C. To calculate the cross-sectional area of each sample, Bioquant (Nashville, TN) was used to calculate the average sample width along the sample length (12 mm) using an overview image of the samples while in the testing apparatus, before testing.
Histological analysis
Hydrogels were fixed in 4% formaldehyde for 2 h at room temperature, permeabilized using 0.5% Triton X for 20 min, then stained using boron dipyrromethene (BODIPY, D3922, 1:100; Thermo Fisher), F-Actin (R37112; Thermo Fisher), and DAPI (R37606; Thermo Fisher). Three regions of interests (comprising ∼50% of total construct length) per sample (n = 4/group) were imaged on a Leica TCS SP8 Confocal Microscope (Buffalo Grove, IL) using a rendering of 50 μm thickness/5 μm sections. BODIPY quantification was performed using the Leica 3D analysis toolkit using Otsu thresholding. The alignment of MPCs was quantified using the ImageJ (National Institutes of Health) directionality plugin (n = 4/group).
Insulin-stimulated glucose uptake
Insulin-stimulated glucose analysis was done on TE-SkM according to the manufacturer's instructions (Glucose Uptake-Glo™ Assay; Promega, Madison, WI), with some modifications. Briefly, TE-SkM was cultured in DMEM without serum or glucose for 24 h (subsets were switched on day 13 of culture). Samples were then cultured in DMEM (n = 6/group) or DMEM + insulin (1 mM; n = 6/group) for 2 h at 37°C, followed by the removal of DMEM ± insulin and the addition of 2-deoxyglucose (0.1 mM) in PBS for 1 h at room temperature. Finally, a 2-deoxyglucose-6-phosphate (2DG6P) detection reagent was used to quantify the amount of glucose internalized by the cells. Luminescence was measured after 2 h at room temperature with a spectrophotometer (Biotek, Winooski, VT).
Gene expression analysis
RNA was isolated and purified from TE-SkM using the Qiagen RNeasy Mini Kit (Valencia, CA) according to the manufacturer's guidelines (n = 4 individual TE-SkM/group). mRNA concentrations were measured using a Take3 Micro-Volume Plate (BioTek), then normalized to 150 ng of mRNA for its conversion to cDNA. Isolated RNA was converted to cDNA using the iScript cDNA Synthesis Kit (Bio-Rad, Hercules, CA). Real-time quantitative polymerase chain reaction (qPCR) was performed using a CFX96 Touch Real-Time PCR Detection System (Bio-Rad). All primers used to carry out the qPCR analysis were predesigned primers (Sigma-Aldrich) listed in Supplementary Table S1. Ten microliters of iTaq Universal SYBR Green Supermix (Bio-Rad) was used for each reaction. Fold expression levels were calculated using the 2−ΔΔCt method, where the MM Lean TE-SkMs were designated as the calibrator group, and GAPDH expression was used as the endogenous control. 33
Statistical analysis
GraphPad Prism Software 6 (GraphPad Software, Inc., La Jolla, CA) was used to run a one-way, or two-way ANOVA (analysis of variance) tests with Tukey's multiple comparison analyses to determine differences between groups. Statistical significance was determined when p < 0.05. All results are presented as mean ± standard error of the mean.
Results
Maturation of TE-SkM from lean and diabetic MPCs with adipogenic differentiation
TE-SkM constructs cultured for 14 days in either MM or AM conditions displayed differences in compaction among the groups as evaluated by the percentage of the covered area. All of the TE-SkM samples increased compaction after 1 day of culture, and TE-SkM constructs containing diabetic MPC showed less compaction compared with the lean samples irrespective of the type of media used (Fig. 1A, B), noting that the difference is not as significant between the AM lean and MM diabetic groups with only the day 14 time point showing a decrease in lean versus diabetic condition. The AM diabetic group had the least compaction for all the time points tested with an approximate coverage area of ∼32%, which remained relatively constant throughout the study. Overall, the TE-SkM samples in AM conditions were less compacted than those in MM conditions. The MM lean TE-SkM group displayed the highest degree of compaction with a coverage area of ∼20%.

TE-SkM fabrication and characterization.
Another critical evaluation of muscle maturity was obtained by measuring CK activity of MPCs. TE-SkM derived from lean MPCs in MM and AM conditions showed the highest CK activity with values equal to 83.5 ± 11.0 and 90.9 ± 5.9 U/L, respectively, although no statistical significance was found between them (Fig. 1C). In contrast, TE-SkM derived from diabetic MPCs presented a lower CK enzymatic activity equal to 42.0 ± 2.3 U/L for the MM diabetic TE-SkM sample and 69.1 ± 3.1 U/L for the AM diabetic group (Fig. 1C).
Assessment of mechanical properties of TE-SkM
Uniaxial mechanical testing of TE-SkM was carried out to evaluate differences in the overall mechanical properties of constructs made from either lean or diabetic MPCs in MM or AM conditions. TE-SkM constructs cultured in MM (Fig. 2A) or AM (Fig. 2B) that were subjected to tensile deformation had stress/strain curves typical of biological samples. Markedly, TE-SkM derived from diabetic MPCs displayed an S-shape stress/strain profile irrespective of the media used, while TE-SkM derived from lean samples were characterized by a small initial toe region in the low strain regime and mostly linear response for higher strains (Fig. 2A, B).

Uniaxial tensile testing of lean and diabetic TE-SkM.
The lean TE-SkM group had the greatest ultimate tensile strength value among the tested groups. In contrast, the lowest tensile strength was detected in the AM diabetic samples, although no statistical significance was observed when comparing AM diabetic and AM lean (Fig. 2C). Lean TE-SkM groups displayed the highest Young's modulus values irrespective of the media used when compared with the diabetic samples (Fig. 2D). Finally, elongation at failure was evaluated to measure how extensible or how much strain the TE-SkM could experience before failure. The MM diabetic samples displayed the highest value of elongation followed by AM lean and diabetic, and lastly by MM lean (Fig. 2E).
Assessment of adipogenic differentiation
TE-SkM constructs were stained with BODIPY to measure the presence of lipid droplets within samples as a surrogate for adipogenic differentiation. Fluorescent confocal images revealed a higher occurrence of lipid in the diabetic TE-SkM cultured in AM conditions (Fig. 3A). Additionally, constructs were stained with F-actin to visualize myotube alignment within the constructs. TE-SkM constructs derived from lean rats displayed a more aligned orientation in the fibrin hydrogels when compared with the diabetic TE-SkM samples irrespective of the media used (Fig. 3A). Quantification of BODIPY fluorescence confirmed the most significant increase in lipid content in the diabetic TE-SkM constructs cultured in AM conditions, indicating that a higher degree of adipogenic differentiation occurred in this group (Fig. 3B). Finally, ImageJ analysis of myotube orientation revealed a more narrow cell distribution in the lean groups around the direction of the passive tension forces generated by the pins introduced in the constructs. On the contrary, the diabetic samples presented broader distribution plots suggesting a lack of cell organization. The media composition had only a noticeable effect on the myotube orientation for the diabetic samples, which may have been due to the higher degree of adipogenic differentiation in the AM diabetic TE-SkM constructs (Fig. 3C).
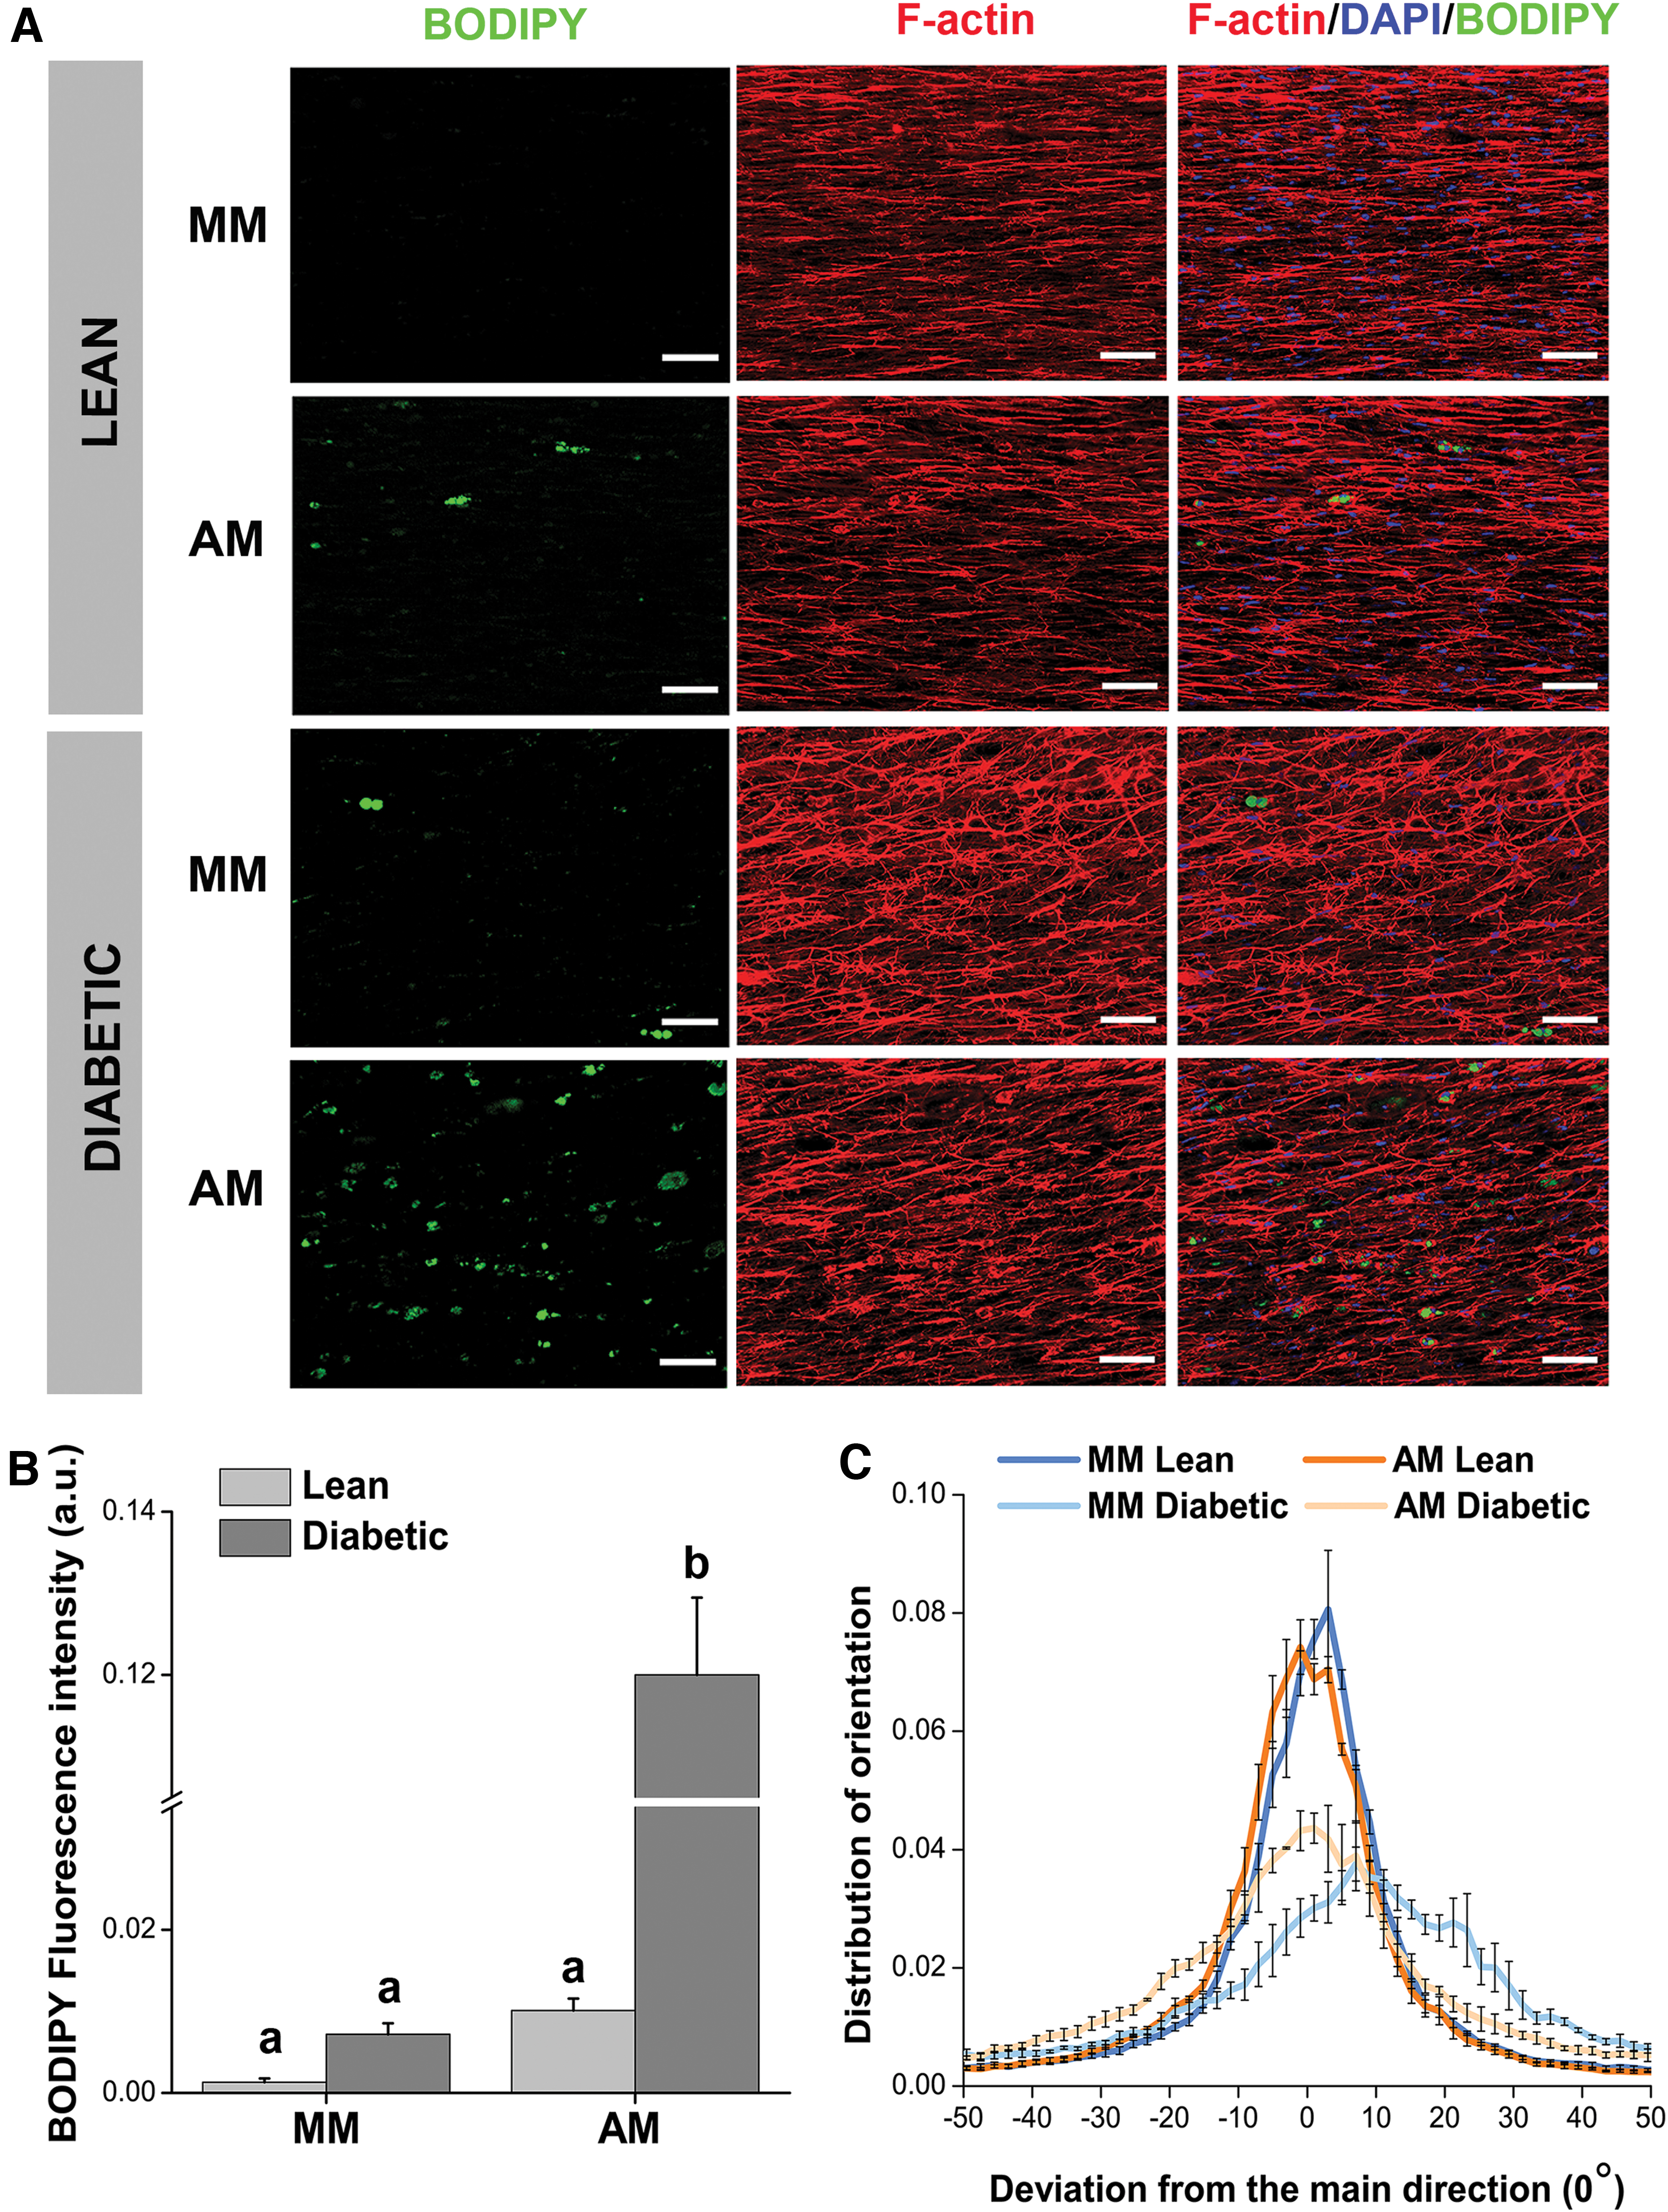
Characterization of adipogenic differentiation and muscle precursor cell alignment in TE-SkM.
Metabolic function assessment of TE-SkM constructs
The response to insulin stimulation for the different TE-SkM constructs was assessed by a bioluminescent method for measuring glucose uptake in cells, based on the detection of 2DG6P. The lean TE-SkM samples displayed a higher degree of glucose uptake versus diabetic TE-SkM samples in both MM and AM, with a significant increase in AM culture conditions (Fig. 4). An approximately twofold increase was observed for the Lean TE-SkM group cultured in MM conditions after insulin stimulation, whereas this effect was not observed for the diabetic TE-SKM in the same media. Overall, the amount of glucose internalized was much higher in AM conditions compared with constructs in MM culture, and this effect was detected irrespective of whether TE-SkM constructs were derived from lean or diabetic MPCs.

Characterization of glucose uptake for the lean and diabetic TE-SkM cultured in MM and AM (n = 6). Results are reported as mean ± standard error (n = 6). The different letters represent statistical significance among the groups (p < 0.05). Bars displaying the same letter indicate no statistical significance among the groups (n.s.).
qPCR analysis of TE-SkM constructs
Gene expression analysis of key adipogenic markers such as PPARG, adiponectin, and FAS confirmed the differentiation of MPCs into adipocytes when the constructs were cultured in AM conditions. PPARG fold expression was significantly higher in the diabetic TE-SkM constructs (∼150-fold expression) compared with lean samples (∼100-fold increase) (Fig. 5A). A rise in gene expression in TE-SkM constructs that were cultured in AM had an increase in adiponectin gene expression, although there was no significant difference between the lean and diabetic samples when cultured in AM (Fig. 5B). In contrast, FAS expression was significantly higher in the diabetic TE-SkM (∼70-fold increase) constructs compared with the lean TE-SkM constructs in AM conditions (Fig. 5C). Overall, the qPCR analysis findings are in accordance with the quantification of BODIPY staining (Fig. 3A, B), that is, TE-SkM constructs made from MPCs derived from diabetic animals increased indices of adipogenic differentiation, demonstrating how the source of MPCs had a direct impact on the degree of adipogenic differentiation.

qPCR analysis of adipogenic and myogenic markers. The different graphs represent:
Myogenic markers were also analyzed to gain insight into whether the presence of the source of MPCs for TE-SkM creation had an effect on myogenesis. MyoD expression was downregulated in the TE-SkM diabetic samples when cultured in MM conditions. As expected, MyoD was downregulated in both lean and diabetic TE-SkM constructs when cultured in AM culture (Fig. 5D). A similar trend was found for MyoG, although the most downregulated group was the diabetic TE-SkM sample in AM (Fig. 5E). Finally, no significant difference in the MHC gene expression was found among the groups tested irrespective of the type of media used.
Discussion
TE-SkM has widely been considered a promising approach for not only tissue regeneration, as in the case of volumetric muscle loss, but also as a means to create a high-throughput, patient-derived, biomimetic system for disease modeling to improve drug testing and efficacy for personalized medicine approaches.16,17 Taking this into consideration, the current study contributes to the study of T2D with the development of a TE-SkM model that recapitulates several aspects of the disease. The approach that was used allows the orientation of skeletal muscle and the spatial distribution of fat within the muscle to be emulated and suggests that this has the potential to be a useful means for the screening and development of therapeutics for T2D.
A particularly interesting characteristic of T2D muscle is the presence of adipose tissue within and between fibers. To better replicate this characteristic, TE-SkM constructs were exposed to AM to augment adipogenic differentiation. This was appropriate because it has been suggested that MPCs used to create the TE-SkM may be a source of adipocytes in vivo. Therefore, in the current study, we exploited the tendency of diabetic MPCs for adipogenic differentiation to create a heterogeneous cellular model. It is important to note that there is a spectrum of adipocytes that have been observed in skeletal muscle, to include brown, beige, and white adipocytes, and the precursor cells from which these different types of adipocytes are derived is being intensely investigated.34–36 Although the objective of the current study was to induce the formation of adipocytes to emulate the presence of intramuscular adipocytes in T2D muscle, additional experiments are required to definitively characterize which category of adipocytes are formed in this model, and whether or not they approximate the type of adipocytes seen in T2D muscle. In this regard, the use of TE-SkM may serve as a useful tool in identifying precursor cells that are contributing to adipogenic differentiation in the context of more physiologically relevant cell–cell and cell–matrix interactions.
In the pursuit of generating adipocytes within the TE-SkM constructs, the AM used was less potent than other adipogenic differentiation media that can be used to stimulate adipogenesis. For example, the AM used in the current study (containing insulin, forskolin, and dexamethasone) resulted in a lower level of adipogenic differentiation than when using a more potent adipogenic differentiation stimulus (additionally containing rosiglitazone and triiodothyronine), which was used to treat MPC 3D hydrogels. 32 Regardless of the methodology used, the presence of different cell types within the construct is worth emphasizing because the development of a multicellular heterogeneous construct may ultimately be a better representation of skeletal muscle in vivo.
It has been observed that there are significant decreases in the myogenic capacity of T2D muscle cells, therefore, it is not surprising that T2D muscle integrity is decreased. 30 In the current study, both gel compaction and CK levels were measured to determine muscle maturity in the TE-SkM (Fig. 1B, C). Compaction measurements, which were carried out to visualize changes in the gel surface area over time, have been found to correlate with the protein and cell content of the constructs, as well as their architecture, function, maturity, and strength.37–39 Skeletal muscle possesses high levels of CK that can account for as much as 20% of the soluble sarcoplasmic protein in specific muscles. 40 Moreover, increasing levels of CK activity have been presented to be a sign of muscle maturation. 41 Our results demonstrated an increased level of compaction and CK levels for the lean TE-SkM constructs irrespective of the media used, suggesting a higher level of muscle maturity. However, when considering the diabetic samples, the MM group showed larger compaction values, and the AM group displayed greater CK content. These conflicting results could be partially explained by the presence in the AM of hormones, which have been found to promote myogenesis.42,43 Furthermore, the limited compaction in the same group could be explained by the significant increase in lipid formation (Fig. 3A), which may have caused a hindrance in compaction.
Uniaxial tensile mechanical characterization on TE-SkM has received very little attention, although it is another potential marker of muscle strength and maturation.44,45 A major challenge of tissue engineering is to produce constructs with an anatomically correct architectural framework, both in terms of cell morphology and matrix deposition. This concept is particularly important in the case of modeling as well as tissue regeneration, where the model should possess sufficient physiological mechanical properties to be used for direct implantation. 45 Measuring TE-SkM mechanical deformation based on tensile testing allowed us to assess the possible effect of matrix deposition derived from different cell sources and culture conditions on the mechanical performance of the constructs. When looking at the stress/strain profiles alone, the lean samples had an initial toe region for low strain followed by a linear elastic response for high strain, while diabetic samples followed an S-shaped profile (Fig. 2A, B), although all groups showed viscoelastic curves typically seen in soft biological tissue 46 irrespective of the media used. Usually, the curvature of stress/strain responses for skeletal muscle tissues is dictated by the concentration and structural arrangement of collagen and elastin fibers, ground substance, and cells.46,47 Before stretching, fibers within the muscle appear orientated randomly; however, once a load is applied, the fibers stretch parallel to the load direction. It is thought that elastin fibers are the first to extend linearly, and as the load further increases, the collagen fibers follow suit to carry a higher proportion of the stress. This process occurs before the linear region of the curve in the toe and heel region of the stress/strain profile.46,48 Subsequently, in a stress/strain profile, which is linear at higher strains, there is a strain-stiffening effect, and the load increases with a transition from low to high stiffness. At this point, the fibers become overstretched and begin to rupture until failure.46–48 Uniquely, it appears that the TE-SkM constructs derived from a T2D MPCs did not display this strain-stiffening phenomenon. In contrast, the sampled showed an S-shaped profile, which is the opposite. In this case, as the load increases, the stiffness drops, and this phenomenon is most commonly seen in rubber-like materials. 49
The salient finding among the mechanical parameters calculated is that in the case of ultimate tensile strength and Young's modulus (Fig. 2C, D), lean TE-SkM displayed higher mechanical properties than their diabetic counterparts in both MM and AM conditions. Also, culturing constructs in AM conditions, ultimately inducing adipocyte differentiation and lipid formation, led to a drop in mechanical integrity in both lean and diabetic compared with the MM controls. Overall, considering that the reported Young's modulus values for skeletal muscle tissue range from ∼12 to 2800 kPa, the designed TE-SkM constructs fall in line with these values.50,51 The influence of increased adipocyte content on the mechanical properties of skeletal muscle certainly requires more investigation. However, when also taking into consideration recent findings where the presence of intermuscular adipose tissue had a direct effect on skeletal muscle function, 52 it is clear that better understanding of adipocyte infiltration in skeletal muscle is an area of study that has implications for improving functional outcomes in a number of skeletal muscle disease states.
There is a parallel in the findings of mechanical analysis (Fig. 2C, D), cell alignment (Fig. 3C), and compaction (Fig. 1A, B). However, when considering the role of cell signaling to determine muscle integrity, namely myogenic gene expression (Fig. 5D–F), it becomes difficult to decipher the role of myogenesis in the structural outcomes observed. Regardless, in addition to Muscat et al. 42 muscle compaction and the mechanical analyses, cell alignment within the constructs was used to evaluate muscle maturity and organization. A change in cytoskeletal cell alignment through F-actin staining has been shown to be characteristic of diabetic skeletal muscle. 53 TE-SkM derived from lean cell sources showed a more oriented arrangement compared with diabetic samples. These findings, along with the observed decrease in muscle strength and physical function, suggest that the designed model is a biomimetic system that can recapitulate T2D muscle, although future studies are required to understand the matrix properties and the biological signaling mechanisms responsible for differences between the lean and diabetic groups.
Among the materials used to create TE-SkM, collagen and fibrin have most commonly been used. Collagen is an abundant major structural protein in skeletal muscle extracellular matrix (ECM), accounting for 1–10% of muscle mass dry weight, and was accordingly used as the field of skeletal muscle engineering was first being developed.54–56 Fibrin possesses the ability to promote degradation and remodeling of endogenous ECM and has also been used to engineer skeletal muscle. 57 Fibrin was utilized in the current study based on the premise that fibrin fibrils have mechanical properties analogous to that of native SkM, is biocompatible, and has the ability to promote myogenesis and adipogenesis.57–59 The use of various biomaterials in the pursuit of creating TE-SkM models to investigate the role of the ECM is an intriguing area of research with important implications for effectively emulating disease.
It was imperative to demonstrate that the fabricated TE-SkM constructs displayed metabolic properties similar to that seen in both healthy and T2D skeletal muscle in vivo. Under normal conditions, skeletal muscle is responsible for over 90% of insulin-stimulated whole-body glucose disposal, a characteristic that is lost when T2D is developed. 60 The development of insulin resistance is correlated to the accumulation of lipids, which impair the insulin-signaling pathway responsible for glucose disposal. 61 This effect provides a further indication of the degree of crosstalk between skeletal muscle and adipose tissue. An ISGU assay was done on the TE-SkM to determine if our model successfully recapitulated this relationship (Fig. 4). Lean TE-SkM constructs demonstrated a significantly greater ISGU response in both MM and AM conditions. Some of our results parallel and expand recent findings by Kondash et al., 62 where both glucose uptake and insulin response were looked at in tissue-engineered human myobundles. They observed that the insulin response in myobundles is comparable to that of other 2D in vitro cultures, and TE-SkM retains the insulin sensitivity of in vivo muscle. 62 Similar to what was seen in the current study, when measuring 2-DG uptake in response to insulin sensitivity, the magnitude of the response to insulin was calculated to range from 1.2- to 2.28-fold, which falls in line with the finding of ∼2-fold increase of 2-DG uptake in lean TE-SkM in MM conditions (Fig. 4). Also, upon adipogenic differentiation, which was confirmed by lipid formation (Fig. 3A, B) and upregulation in key adipogenic genes (Fig. 5A–C), an increase in basal ISGU was observed. This result was in line with other reports that indicate how adipocytes can also be responsible for glucose uptake.63,64 Despite these encouraging findings, given the interdependent relationship between ISGU and glycogen synthesis,12,65 it may be appropriate to also quantify the glycogen synthesis to get a complete understanding of the system.
In vivo fat formation within skeletal muscle has a range of 1.5–11% of muscle volume depending on the health and age of the patients, 66 but in the current study, despite observing both structural and metabolic changes, BODIPY quantification as an index of adipocyte content was on the order of ∼0.001–0.1%. Future work, looking at the effect of a higher content of adipocytes in TE-SkM is prudent. Although the use of AM resulted in an increase in glucose uptake, adipocyte formation alone was not enough to warrant a biomimetic disease response. Specifically, lean constructs with an increased adipocyte content (i.e., with AM culture) had an increase in glucose uptake with insulin stimulation. In contrast, this effect was not found in the diabetic samples; therefore, the introduction of a diseased cell source appeared to be the critical element needed to affect glucose uptake.
The presence of both adipocytes and myogenic structures within TE-SkM models, both those derived from lean and T2D tissue sources, may support studies to identify the mechanisms behind insulin resistance in diabetes. This approach builds on other studies and models with the intent of studying in the interaction between muscle cells and adipocytes.28,32,67–69 Muscle is known to function as an endocrine organ and is involved in numerous paracrine functions necessary for the development and regeneration of surrounding tissues.70,71 Specifically, there is a large degree of crosstalk that occurs between muscle and adipocytes, as seen in intermuscular adipose tissue, 24 especially in the pathogenesis of metabolic diseases, such as T2D. TE-SkM allows for the creation of a physiologically relevant system that mimics not only the spatiotemporal organization of different tissues but also their biological intricacy. Although an in-depth comparison of in vitro versus in vivo conditions is needed, a T2D model of skeletal muscle containing adipocytes can ultimately serve as an approach to investigate fat formation within skeletal muscle in vitro, especially in the case of T2D.
Conclusion
In summary, our results present a TE-SkM model of T2D that also included the use of adipogenic differentiation of MPCs to better replicate the presence of adipocytes in the diseased tissue. Using this approach, we were able to model the structural and metabolic changes seen in T2D skeletal muscle. Future research will focus on using this model to understand the structural difference seen in the different conditions and use this as a source for drug and treatment testing to counteract metabolic diseases.
Footnotes
Disclosure Statement
No competing financial interests exist.
Funding Information
This work was supported, in part, by the National Institutes of Health (SC1DK122578, 5RO1EB020604), Veterans Administration (5 I01 BX000418-06), the San Antonio Area Foundation, NSF Award #1847103, the University of Texas System Science and Technology Acquisition and Retention Program, the University of Texas Department of Biomedical Engineering, and the UTSA RISE Research Training Program (NIH GM060655).
References
Supplementary Material
Please find the following supplemental material available below.
For Open Access articles published under a Creative Commons License, all supplemental material carries the same license as the article it is associated with.
For non-Open Access articles published, all supplemental material carries a non-exclusive license, and permission requests for re-use of supplemental material or any part of supplemental material shall be sent directly to the copyright owner as specified in the copyright notice associated with the article.