
Abstract
Critical-sized mandibular bone defects, arising from, for example, resections after tumor surgeries, are currently treated with autogenous bone grafts. This treatment is considered very invasive and is associated with limitations such as morbidity and graft resorption. Tissue engineering approaches propose to use 3D scaffolds that combine structural features, biomaterial properties, cells, and biomolecules to create biomimetic constructs. However, mimicking the complex anatomy and composition of the mandible poses a challenge in scaffold design. In our study, we evaluated the dual effect of complex pore geometry and material composition on the osteogenic potential of 3D printed scaffolds. The scaffolds were made of polycaprolactone (PCL) alone (TCP0), or with a high concentration of β-tricalcium phosphate (β-TCP) up to 40% w/w (TCP40), with two complex pore geometries, namely a star- (S) and a diamond-like (D) shape. Scanning electron microscopy and microcomputed tomography images confirmed high fidelity during the printing process. The D-scaffolds displayed higher compressive moduli than the corresponding S-scaffolds. TCP40 scaffolds in simulated body fluid showed deposition of minerals on the surface after 28 days. Subsequently, we assessed the differentiation of seeded bone marrow-derived human mesenchymal stromal cells (hMSCs) over 28 days. The early expression of RUNX2 in the cell nuclei confirmed the commitment toward an osteogenic phenotype. Moreover, alkaline phosphatase (ALP) activity and collagen deposition displayed an increasing trend in the D-scaffolds. Collagen type I was mainly present in the deposited extracellular matrix (ECM), confirming deposition of bone matrix. Finally, Alizarin Red staining showed successful mineralization on all the TCP40 samples, with higher values for the S-shaped scaffolds. Taken together, our study demonstrated that the complex pore architectures of scaffolds comprised TCP40 stimulated osteogenic differentiation and mineralization of hMSCs in vitro. Future research will aim to validate these findings in vivo.
Impact Statement
In this study, we report the fabrication of composite scaffolds with advanced pore geometries to promote osteogenic differentiation of human mesenchymal stromal cells. We showcase how 3D constructs having two complex biomimetic pore shapes can induce higher expression of bone-related markers. Our approach provides a novel scaffold-based solution to tackle mandibular critical-sized bone defects.
Introduction
Mandibular critical-sized defects, resulting from traumatic injuries or tumor resections, fail to spontaneously heal, requiring surgical interventions to be repaired.1,2 Nowadays, the golden standard treatment is implanting an autologous bone graft, harvested from the fibula of the patient. 3 However, this very invasive procedure is associated with multiple drawbacks such as donor site morbidity, graft resorption, and risk of infections.4–6 As an alternative solution, tissue engineering principles have been used to design mandibular implants (i.e., scaffolds), combining cells, biomaterials, and biomolecules. 7 To achieve successful regeneration, features of the complex mandibular anatomy and composition must be integrated in the constructs. To this end, additive manufacturing techniques enable the fabrication of scaffolds with high control over the design and in a patient-specific manner. 8 Among these biofabrication technologies, melt-extrusion-based manufacturing technology has been most frequently used as they permit deposition of biomaterials, resembling the native tissue composition, into a porous scaffold with intricate geometry. 9
Melt-extrusion-based techniques typically use synthetic thermoplastic materials. 10 For instance, medical grade polycaprolactone (PCL) has previously been selected for scaffold fabrication for bone applications, as it is biocompatible, biodegradable in the long term, and offer good mechanical properties.11–15 However, PCL is known to be inert. 16 Therefore, its bioactivity can be enhanced in combination with ceramic materials, such as tricalcium phosphates (TCP).11,16–18 Simultaneously, the incorporation of ceramics leads to biomimicry of the natural bone matrix, which contains an inorganic phase of hydroxyapatite minerals embedded in a collagen-based organic phase. 19 Moreover, the incorporation of ceramic particles reinforces the polymeric matrix, enhancing the mechanical performance of the final scaffolds while solving the intrinsic brittleness of scaffolds made of ceramic only.20,21 Among different ceramics, TCP has higher solubility and faster resorption rate compared, for example, to hydroxyapatite. Therefore, it can lead to a rapid bone formation after implantation, improving tissue regeneration. 7 Different studies reported the successful use of PCL-TCP composite scaffolds to enhance the osteogenic differentiation of seeded adult stem cells and in vivo bone regeneration.19,22–24 For example, Khojasteh et al. fabricated PCL scaffolds containing 20% w/w TCP to evaluate their effect on healing of vertical bone critical sized defects in a dog’s mandible model. 22 Another study used PCL with 30% w/w TCP, to promote in vitro osteogenic differentiation of bone marrow stem cells. 25
In addition to the composition of the scaffolds, studies have also reported that pore geometry affects osteogenesis. For example, Werner et al. demonstrated that 3D substrate curvatures can modulate the cytoskeletal forces acting on the nucleus, driving cell differentiation toward an osteogenic phenotype. 26 Di Luca et al. showed that rhomboidal pore shapes promoted better osteogenic differentiation of human mesenchymal stromal cells (hMSCs), compared with typical woodpile constructs. 27 Recently, mathematical models describing triply periodic minimal surfaces (TPMS) were also applied to scaffold design. Minimal surfaces are found in nature; thus, they can be useful to achieve biomimicry of the scaffolds. 28 For instance, the geometries described by the TPMS models resemble the native trabecular bone, characterized by curved surfaces. 29 Among the different TPMS structures, the diamond was shown to be promising in terms of cell migration and (osteogenic) differentiation, because of greater curvatures.30,31
In this study, we aimed to assess the combined effect of the pore geometry and material composition on the osteogenic potential of 3D printed scaffolds. We used a composite material made of a medical grade PCL matrix, containing a high content of β-TCP (40% w/w). In fact, to the best of our knowledge, studies that used melt-extrusion techniques for mandibular applications reported a maximum incorporation of 30% w/w of TCP content.22,25,32 Given that the inorganic component of bone typically constitutes about 60% of the tissue, 33 incorporating such a high amount of TCP in our composite represents a step forward mimicking the natural mineral bone composition.
In addition, instead of a typical woodpile architecture, the scaffolds were fabricated with two advanced pore geometries, a diamond- (D) and a star- (S) shape. First, the morphology of the scaffolds was optimized and evaluated with scanning electron microscopy (SEM) and microcomputed tomography (micro-CT). Then, the scaffolds were tested in vitro for mechanical performance and bioactivity. Finally, the potential of the scaffolds to induce osteogenic differentiation of hMSCs was investigated during a 28-day culture period in vitro. We assessed the expression of osteogenic markers, such as RUNX2, alkaline phosphatase (ALP) activity, collagen deposition, and mineralization of the matrix, from the gene to the protein level. Our results pave the way for a novel approach in scaffold design for mandibular critical-sized defects.
Materials and Methods
Medical grade PCL (PURASORB® PC12, Mw 72 kDa) was provided by Corbion. β-TCP powder was provided by Kuros. All chemicals were bought from Sigma-Aldrich unless stated otherwise.
Composite preparation and characterization
β-TCP preparation and characterization
The β-TCP particle size was decreased with ball milling, performed in Milli-Q water for 72 h. The particle size was determined with dynamic light scattering (DLS, Malvern Zetasizer Nano ZS, Malvern Instruments Ltd.). The measurement was done at 25°C, using 0.1% w/v of particles in distilled water (dH2O), in a polystyrene disposable cuvette. In addition, the milled particles were gold coated and imaged with SEM (Jeol JSM-IT200 InTouchScope SEM) at a working distance of 10 mm using a voltage of 10 keV.
Composite preparation
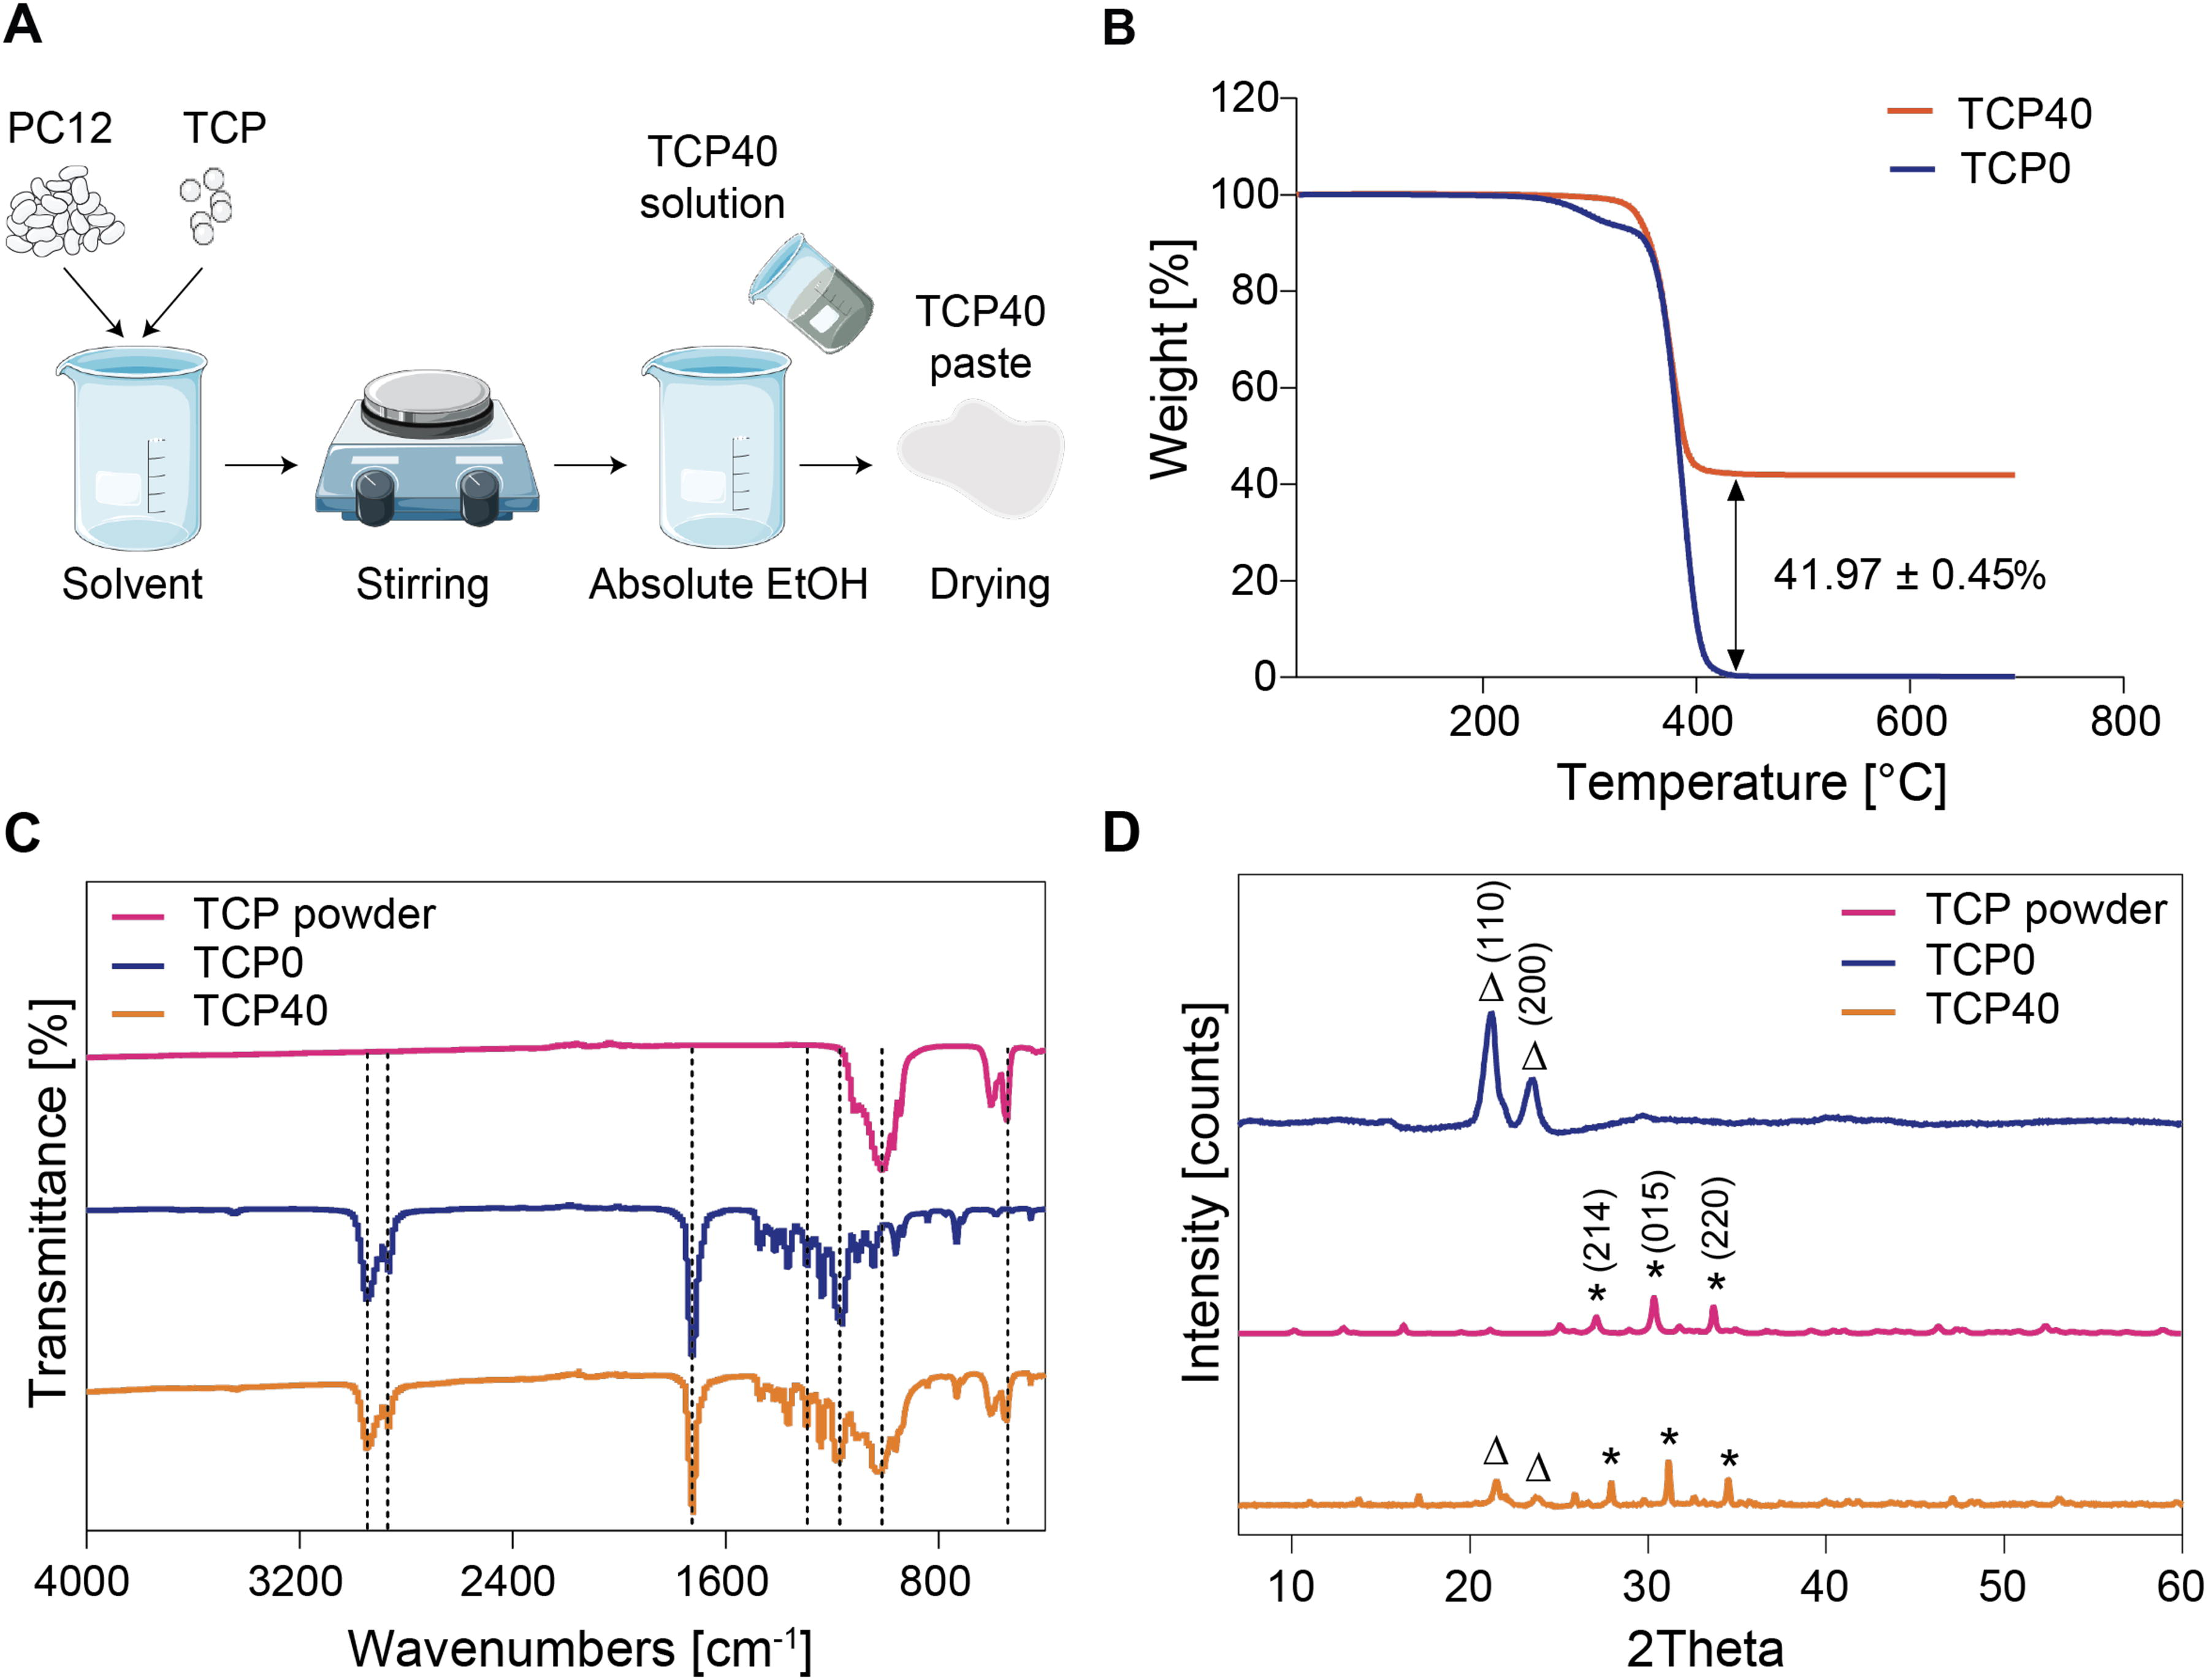
The composite material (TCP40) of PC12 and TCP (60:40 w/w) was prepared using a blending strategy, as depicted in the schematic in Figure 1A. First, the polymer was dissolved in tetrahydrofuran at T = 30°C under stirring. Then, the TCP powder was added, and the mixture was stirred until homogeneous dispersion of the powder. The solution was mixed with a mechanical stirrer to reach a homogeneous dispersion. Finally, the particle mixture was poured in absolute ethanol (1:4 v/v) to obtain the final composite paste. The final paste was then let dry in a vacuum oven overnight at T = 30°C.
Schematics of the composite production process
Thermogravimetric analysis
The efficiency of the blending method was evaluated with a thermogravimetric analysis (TGA, TA Instruments TGA550). Briefly, PCL (TCP0) and TCP40 were heated to 700°C with a temperature ramp of 10°C·min−1. Then, the temperature was kept constant for 5 min, before it was decreased at the same rate back to 25°C. The final weight percentage indicated the percentage of TCP in the composite.
Chemical characterization
The chemical composition of TCP0 and TCP40 was investigated with Fourier transform infrared (FTIR) spectroscopy (Nicolet iS50, ThermoFisher Scientific) and X-ray diffraction (XRD, D2 phaser, Bruker). FTIR was performed in the range 4000–400 cm−1, running 32 scans. XRD was conducted in the range of 7° ≤ 2θ ≤ 60°, with increments of 0.02°.
Differential scanning calorimetry
The thermal properties of TCP0 and TCP40 were assessed by differential scanning calorimetry (DSC, TA Instruments Q2000 DSC). The samples were heated from 10°C to 200°C at a rate of 10°C·min−1 and held isothermal for 10 min to remove thermal history. Then, the samples were cooled to −30°C at a rate of 10°C·min−1, held isothermal for 10 min, before heating them again to 200°C at 10°C·min−1. The melting temperature (Tm) was determined from the second heating cycle.
Scaffold design and fabrication
Three-dimensional models of scaffolds with two different pore shape architectures, S and D shapes, were designed. The G-code to fabricate a cylindrical scaffold with S-shaped pores was generated in the PrimCam software of the printer. The S-shaped pores were created by rotating the deposition angle after every layer by 15°. The strand distance and the layer thickness were set at 850 µm and 200 µm, respectively.
The D 3D model was designed in the Rhinoceros software with the Grasshopper plugin, based on the equation (1) of the diamond TPMS.
34
The 3D model was sliced with a custom-made slicing code, setting a layer thickness of 200 µm, and the G-code was generated with a custom-made G-code generator. Both scaffold shapes were designed to have a theoretical porosity of 70%.
All scaffolds were fabricated with an extrusion-based printing system (Bioscaffolder, SYSENG). TCP0 or TCP40 was added in the reservoir, capped with a Teflon plunger, and melted at T = 100°C or T = 140°C, respectively. The materials were extruded through a 25G nozzle, at a pressure of 5 bar, a screw rotation of 11 rpm, and a translation speed of 100 mm·min−1. Cylindrical scaffolds for mechanical testing were printed with a diameter of 6 mm and a height of 4 mm. Samples for cell studies had a diameter of 6 mm and a height of 2 mm.
Morphological characterization
SEM
The morphology of the scaffolds was observed using a Jeol JSM-IT200 InTouchScope SEM, with a voltage of 10 kV and a working distance of 10 mm. Before imaging, the scaffolds were coated with gold, using a Cressington sputter coater 108 Auto. Fiber diameter, strand distance, and layer thickness were measured from the images using the Fiji Software.
Micro-CT
Micro-CT was performed using a SkyScan1272 (Bruker) scanner. TCP0 samples were scanned at a pixel size of 3.5 μm, 50 kV, and 150 μA, rotation step of 0.2°, and 4 averaging frames, whereas for TCP40 samples, a 0.25Al filter was used (n = 3). Images were reconstructed using NRecon software (1.7.1.6, Bruker), and samples were visualized using CTVox (3.3.0 r1403, Bruker) and DataViewer (1.5.4.6, Bruker). The quantitative data were obtained using CTan software (1.18.4.0+, Bruker).
Mechanical characterization
The mechanical performance of the scaffolds was determined upon compression using a TA ElectroForce system (TA Instruments), equipped with a 450N load cell, and controlled with Win7 software. The tests were conducted at a strain rate of 0.04 mm·s−1 up to a maximum of 50% compression. TCP0 and TCP40 scaffolds with both S and D shape were tested (n = 5). Before testing, the height and the diameter of the samples were measured with a caliper, and the scaffolds were weighted to calculate the net porous area, with the formula:
Where:
m is the weight of the sample;
h is the height of the sample;
ρ is the density of the raw materials (TCP0 = 1.145 g·cm−3, TCP40 = 3.14 g·cm−3).
The stress values were obtained dividing the measured load against the area of the fibers for each scaffold. 35 The compressive modulus was calculated between approximately 5–15% strain in the linear region of the stress–strain curves. The yield stress and strain were calculated with the 0.2% offset method from the stress–strain curves. The toughness was calculated as the area under the stress–strain curves in the plastic region, defined from the yield points.
Bioactivity evaluation
Simulated body fluid
The bioactivity of the composite scaffolds was tested in simulated body fluid (SBF) 1× solution, for 7 and 28 days. The solution was prepared following Kokubo’s method, 36 as reported in the Supplementary Table S1. All scaffolds were prewetted in Milli-Q water and placed in a 24-well plate with 2 mL of SBF solution. The samples were incubated at T = 37°C, and the solution was refreshed every 2–3 days. After 7 and 28 days, the samples were washed five times in Milli-Q water and dried overnight. Samples were gold coated, imaged on the SEM, and energy-dispersive x-ray analysis (EDX) was performed.
Ion release in culture medium
TCP40 scaffolds were incubated in cell culture medium for 28 days, and the calcium (Ca) and phosphorous (P) release was quantified by inductively coupled plasma mass spectrometry (ICP-MS, iCAP Q, ThermoFisher Scientific) in standard mode (n = 3). At different time points, 100 µL of sample was dissolved in 4.9 mL of 1% nitric acid, containing Scandium at a concentration of 200 ppb as internal standard. The standard curve was obtained in the range 0.3–4.8 ppm.
hMSC culture and differentiation
hMSCs were purchased from PromoCell (donor Caucasian woman, 30 years old). Cells were expanded in T225 flasks at a density of 1000 cells·cm−2 in α-minimum essential medium (α-MEM, Gibco) supplemented with 10% v/v fetal bovine serum (FBS). Cells were passaged at 70–80% confluency and used at passage 5 for experiments.
Scaffold seeding
For cell experiments, TCP0 and TCP40 scaffolds with S or D shapes were printed. Prior to seeding, the scaffolds were sterilized in 70% ethanol for 30 min, washed thrice in phosphate buffer (PBS), and incubated overnight at 37°C in basic culture medium (BM). The BM consisted of α-MEM supplemented with 10% v/v FBS, 0.2 mM l-ascorbic acid-2-phosphate, and100U·mL−1 penicillin–streptomycin.
An amount of 200,000 cells were seeded at passage 5 in BM with the addition of 10% w/v of dextran (Pharmacosmos, 5510 0500 9006) per scaffold. After 24 h (day 1), the media was changed to BM, or osteogenic medium (OM = BM + 10 nM dexamethasone), or mineralization medium (MM = BM + 10 nM dexamethasone + 10 mM beta-glycerophosphate). Scaffolds were kept in culture for 28 days and medium refreshed every 2–3 days.
Immunostaining
Immunostaining was performed after days 1, 7, and 28. At each time point, samples were fixed in 4% paraformaldehyde (PFA), washed, and stored in PBS (n = 3). Then, the cells were permeabilized for 20 min in 0.1% Triton X-100 (Merck) and rinsed again three times in PBS. The blocking was done for 1.5 h in 3% bovine serum albumin (BSA) and 0.01% Triton X-100. Samples were then incubated overnight at 4°C in dark with phalloidin and primary antibodies, depending on the fixation time point, as summarized in Table 1.
Constructs Were Stained After 1, 7, and 28 Days with Primary Antibodies and/or Phalloidin
After incubation, primary antibodies and phalloidin were washed three times with 0.3% BSA and 0.01% Triton X-100 in PBS. Phalloidin was used to stain cells' actin filaments. Secondary antibodies (goat anti-rabbit and goat anti-mouse, 1:300, Abcam) were added to the samples and incubated in dark for 45 min. Finally, samples were stained with DAPI (1:300) in dark for 20 min and rinsed with PBS. Stained samples were imaged with a Leica TCS SP8 CARS confocal microscope.
ALP activity
ALP activity was quantified for all the samples on day 7 and day 28 (n = 5). The scaffolds were washed twice with PBS, transferred in Eppendorf tubes, and stored at −80°C. Then, three cycles of thawing at room temperature (RT) and freezing in liquid nitrogen were performed, and samples were incubated in a lysis buffer (0.1M KH2PO4, 0.1M K2HPO4, 0.1% Triton X-100, pH 7.8) for 1 h at RT. At this point, 50 µL of lysates were transferred in a different Eppendorf and used to perform ALP activity assay. Briefly, 10 µL of lysate was transferred in duplicate in a white 96-well plate. Then, 40 µL of a CDP-Star chemiluminescent substrate reagent (ready-to-use, Roche) was added to the samples and incubated for 15 min at RT in the dark. The luminescence was measured at 466 nm using a CLARIOstar spectrophotometer (BMG Labtech). The results of the ALP activity quantification were normalized against the available surface area or cell density, calculated as the total DNA divided by the pore volume (see DNA quantification). The remaining cell lysate was used for DNA quantification and hydroxyproline (HYP) assay.
DNA quantification
To evaluate the seeding efficiency and the proliferation of the cells, the DNA was quantified at days 1, 7, and 28 (n = 5). To further digest extracellular matrix (ECM), 200 µL of cell lysates from ALP activity were incubated overnight at 52°C in 200 µL of 1 mg·mL−1 proteinase K, dissolved in solution comprising 50 mM Tris, 1 mM ethylenediaminetetraacetic acid, and 1 mM iodoacetamide (TRIS/EDTA). From the digested samples, 100 µL were taken for HYP assay. At this point, three freeze-thawing cycles were performed, and the CyQUANT™ Cell Proliferation Assay Kit (ThermoFisher) was used for a DNA assay. Briefly, scaffolds were incubated at RT in 300 µL of lysis buffer containing DNAse-free RNase A (1:500) (ThermoFisher). Then, 100 µL of each sample was transferred in a 96-well plate in duplicate and incubated at RT with 100 µL of a 2× GR-dye solution for 12 min. A standard curve was made with a DNA standard, and the fluorescence was measured at λex = 480 nm and λem = 520 nm with a CLARIOstar spectrophotometer (BMG Labtech).
At day 1, the seeding efficiency was estimated from the measured DNA values, assuming a DNA content per cell of 6.6 pg DNA·cell−1. For each scaffold shape, the DNA values were normalized against the available surface area or against the pore volume obtained from micro-CT measurement, to calculate the cell density.
Collagen production
Proteinase K digested samples (see DNA quantification) were diluted 1:4 at day 7 and 1:5 at day 28 in TRIS/EDTA solution and hydrolyzed 1:1 in 37% hydrochloric acid for 18 h at 110°C (n = 5). Then, the solvent was evaporated in a vented oven, and the hydrolysis product was suspended in 200 µL of Milli-Q water. The HYP was oxidized in a chloramine T containing buffer for 20 min at RT. Then, the product was made fluorescent by reaction with 4-dimethylaminobenzaldehyde. A standard curve was prepared by serial dilutions of trans-4-hydroxy-L-proline solution. Absorbance was measured at 570 nm. The total collagen content was calculated assuming a HYP to collagen ratio of 1:7.69, and the values were normalized against the available surface area or the cell density for each scaffold.
ECM morphology and mineralization assay
At days 7 and 28, the scaffolds in BM and OM were fixed with 4% PFA for 30 min and washed thrice with PBS. Then, the samples were dehydrated in a series of ethanol solutions (30, 50, 70, 80, 90, 96, and 100% in water) for 15 min at RT. Finally, the samples were immersed in a series of absolute ethanol and hexamethyldisilazane (HMDS) solutions (72:25, 50:50, 25:75, 0:100) for 15 min. At the end, the samples were dried overnight at RT to remove residual HMDS. Samples were sputter coated with gold and imaged using SEM.
Ca deposition was observed with an Alizarin Red staining (n = 3). Samples in BM and MM at day 28 were fixed in 4% PFA for 30 min and washed with distilled water. Alizarin Red solution (ARS) 40 mM was prepared in distilled water, and the pH was adjusted at 4.1–4.3. The scaffolds were incubated in the solution for 20 min at RT and then washed thoroughly until the ARS was completely removed. The stained samples were imaged with Stereomicroscope (NIKON SMZ25) for a qualitative evaluation of Ca deposition.
Moreover, the stained samples were placed in Eppendorf and incubated with 400 µL of 10% chloride monohydrate (CPC) in 10 mM sodium phosphate (pH = 7) overnight, to completely extract the dye. A standard curve was made with a serial dilution of the ARS in 10% CPC. Finally, 100 µL of each sample was transferred in duplicates in a 96-well plate and measured at 562 nm using a CLARIOstar spectrophotometer. Acellular scaffolds served as blanks to subtract the background values originating from the TCP inherently present in the TCP40 scaffolds. The results were normalized against the available surface area or the pore volume of each scaffold measured with micro-CT.
Gene expression
Gene expression was evaluated at day 7 and day 28 on scaffolds in BM and OM (n = 3). At each time point, scaffolds were minced, collected in 1 mL of TRIzol (Invitrogen), and stored at −80°C. After three steps of freeze-thawing, the scaffolds were centrifuged at 12,000 g for 5 min at 4°C to remove scaffold pieces and precipitate ECM. The supernatant was then transferred into new Eppendorf, mixed with 200 µL of chloroform, and centrifuged at 12,000 g for 15 min at 4°C. The aqueous phase was collected, and 500 µL of isopropanol was added and centrifuged for 10 min at 12,000 g at 4°C. The supernatant was discarded, and the precipitated RNA was resuspended in RNAse-free water. The RNA concentration and the 260/280 and 260/230 values were measured using BioDrop uLITE instrument (Scientific Laboratory Supplies). cDNA was synthesized from 200 ng of RNA, using iScript cDNA Synthesis Kit (Bio-Rad), following the manufacturer’s protocol. Finally, the quantitative polymerase chain reactions (qPCRs) were conducted in 20 µL of volume containing 4 ng of cDNA in 2 µL of RNAse-free water, 10 µL of iQ SYBER green Supermix (Bio-Rad), and 8 µL of reverse and forward primer mix (Supplementary Table S2). A CFX96™ IVD RT-PCR system (Bio-Rad) was used with a thermal cycle of 95°C for 3 min, 95°C for 15 s, and 55°C for 20 s for 40 cycles. The 2-ΔΔCt method was used to calculate the relative gene expression. 37 B2M was chosen as housekeeping gene, and values were normalized with reference to the relative expression of cells cultured on TCP0_S scaffolds at day 7 in BM or OM.
Statistical analysis
All the quantitative data are shown as mean ± standard deviation. The statistical analysis was performed with the software GraphPad Prism. Three to five replicates were used for each experiment. The normality of the data was assessed with a Shapiro–Wilk test, and when confirmed, statistical significance was determined with parametric Student’s t-test or analysis of variance. Otherwise, non-parametric tests were done. (****) p < 0.0001, (***) p < 0.001, (**) p < 0.01, (*) p < 0.05.
Results and Discussion
Composite preparation and characterization
Ball milling of the particles allowed to obtain a β-TCP particle size of 1223 ± 98.2 nm (Supplementary Fig. S1A, B). Morphological features of the particles, such as size, microstructure, porosity, and crystallinity, are known to tune the bioactive potential of β-TCP.38,39 Therefore, we targeted a submicron particle size range, as it was demonstrated to induce higher osteoclast activity and hMSC differentiation.39,40
A blending strategy was used to produce TCP40. The TGA results displayed an amount of TCP of 41.97 ± 0.45%, implying high efficiency, limited loss of material, and reproducibility of the method (Fig. 1B). The incorporation of the TCP particles did not affect the Tm of PCL, which remained around 55°C, but a small reduction in the polymer crystallinity was observed as indicated by the enthalpy of the melting peak (Supplementary Fig. S1C).
The chemical composition of TCP40 was investigated with both FTIR and XRD, in comparison with TCP0 and the TCP particles alone. FTIR analysis (Supplementary Fig. 1C) showed that both the TCP0 and the TCP40 scaffolds presented the typical bands associated with the polymeric chains. 41 The CH2 symmetrical and asymmetrical vibration stretches are located at 2868 cm−1 and 2945 cm−1, respectively. The C = O stretching is found at 1728 cm−1 and the C-O stretch mode at 1290 cm−1. Finally, the C-O-C stretching of the ether is found at 1165 cm−1. As expected, in both the TCP and the TCP40, the characteristic band of the asymmetrical stretching and bending of the PO43− were found at 1013 cm−1 and 540 cm−1, respectively.41,42
Furthermore, XRD patterns showed the typical sharp peaks of the β-TCP in the powder only, at 2θ = 27°, 2θ = 30.3°, and 2θ = 33.6° (Fig. 1D), corresponding to the (214), (015), and (220) planes, respectively. 43 In the TCP40, the TCP pattern was maintained, but amorphous peaks appeared, due to the presence of the polymer (Δ), at 2θ = 21.4° and 23.7°, corresponding to (110) and (200) crystallographic planes, respectively. 44
Scaffold fabrication and morphological and mechanical characterization
TCP0 and TCP40 scaffolds were fabricated with a S- and D- pore shape architecture, according to the .STL designed files depicted in Figure 2A. SEM images revealed that S- and D-like pore shapes had a fiber diameter and layer thickness of approximately 250 µm and 200 µm, respectively (Fig. 2B, Supplementary Fig. S2A, B). Moreover, the map of elements obtained from SEM images revealed a homogeneous distribution of the Ca and P on both the surface and the cross section of the TCP40 fibers (Supplementary Fig. S2C).

3D models of the S (top) and D (bottom) scaffolds
In addition to SEM, morphological evaluations were performed through micro-CT analysis. Images of the cross sections indicated a high printing fidelity of both scaffold architectures (Fig. 2C, Supplementary Fig. S3). The S scaffolds displayed a higher surface area than D scaffolds (522.9 ± 17.6 vs. 446.2 ± 4.3 mm2). Conversely, the pore volume of D scaffolds was higher than the S ones (51.8 ± 2.5 vs. 43.5 ± 0.7 mm3). The differences in pore volume can also be qualitatively appreciated from the videos recorded with micro-CT, which revealed that the S pores are more interconnected (Supplementary videos S1 and S2). Moreover, the experimental porosity calculated with the micro-CT was on average 66%, close to the theoretical one of 70% set in the 3D models.
The mechanical performance of the scaffolds, comprising different shapes and material composition, was tested under compression. The stress–strain curves presented an initial elastic response up to approximately 15% strain (Fig. 3A). Notably, in the linear region of the stress–strain curves, the D-shaped scaffolds consistently displayed higher compressive moduli compared to their S-shaped counterparts, a trend observed for both TCP0 (18 ± 2 and 103 ± 8 MPa for S and D, respectively) and TCP40 scaffolds (43 ± 7 and 277 ± 16 MPa for S and D, respectively) (Fig. 3B). We attributed the differences between the two shapes to the different amount of contact points between consecutive fibers, which can also be observed from the micro-CT scans of the cross sections (Supplementary videos S1 and S2). Particularly, the S scaffolds present lower contacts between consecutive layers because of the rotation of 15°, resulting in a weakening of the structure, as also previously observed in other studies.13,27 The D model, instead, is characterized by the repetition of three wave-like layers of fibers deposited along the same direction, thus reinforcing the structure. Moreover, the TCP40 scaffolds displayed a higher compressive modulus than the corresponding TCP0, which is likely a result of reinforcement effects of the TCP particles.41,45,46

Stress–strain curves of the TCP0 and TCP40 with S or D shape tested under compression, n = 5
Subsequently, other mechanical parameters were calculated from the stress–strain curves (Supplementary Fig. S4A–D). The yield strength was significantly higher for the D constructs, regardless of the material type (8.9 ± 0.3 and 15.4 ± 2.1 MPa, for TCP0_D and TCP40_D, respectively). All the samples presented a yield strain of approximately 15%. Finally, the toughness was significantly higher for the D samples than the S ones (432.7 ± 27.7 and 760.3 ± 74.5N·mm2, for TCP0_D and TCP40_D, respectively).
Bioactivity
Since EDX analysis on the TCP40 scaffolds revealed the presence of Ca and P elements (Fig. 4A), we evaluated the bioactivity of the constructs at days 7 and 28. First, the samples were immersed in SBF, a solution that mimics the ion concentrations of human blood plasma.36,47 After 7 days, on both TCP0 and TCP40 scaffolds, no differences were observed compared with the scaffolds before incubation (Supplementary Fig. S5A). However, by day 28, significant mineral deposition occurred on the TCP40 surfaces of both S and D scaffolds, with no qualitative differences between the two (Fig. 4B). Notably, the EDX analysis at this time point did not display the C elements characteristic of the polymeric component, suggesting complete coverage of the scaffold surfaces by mineral deposits. At the same time point, no mineral deposition occurred on the TCP0 scaffolds (Supplementary Fig. S5B).
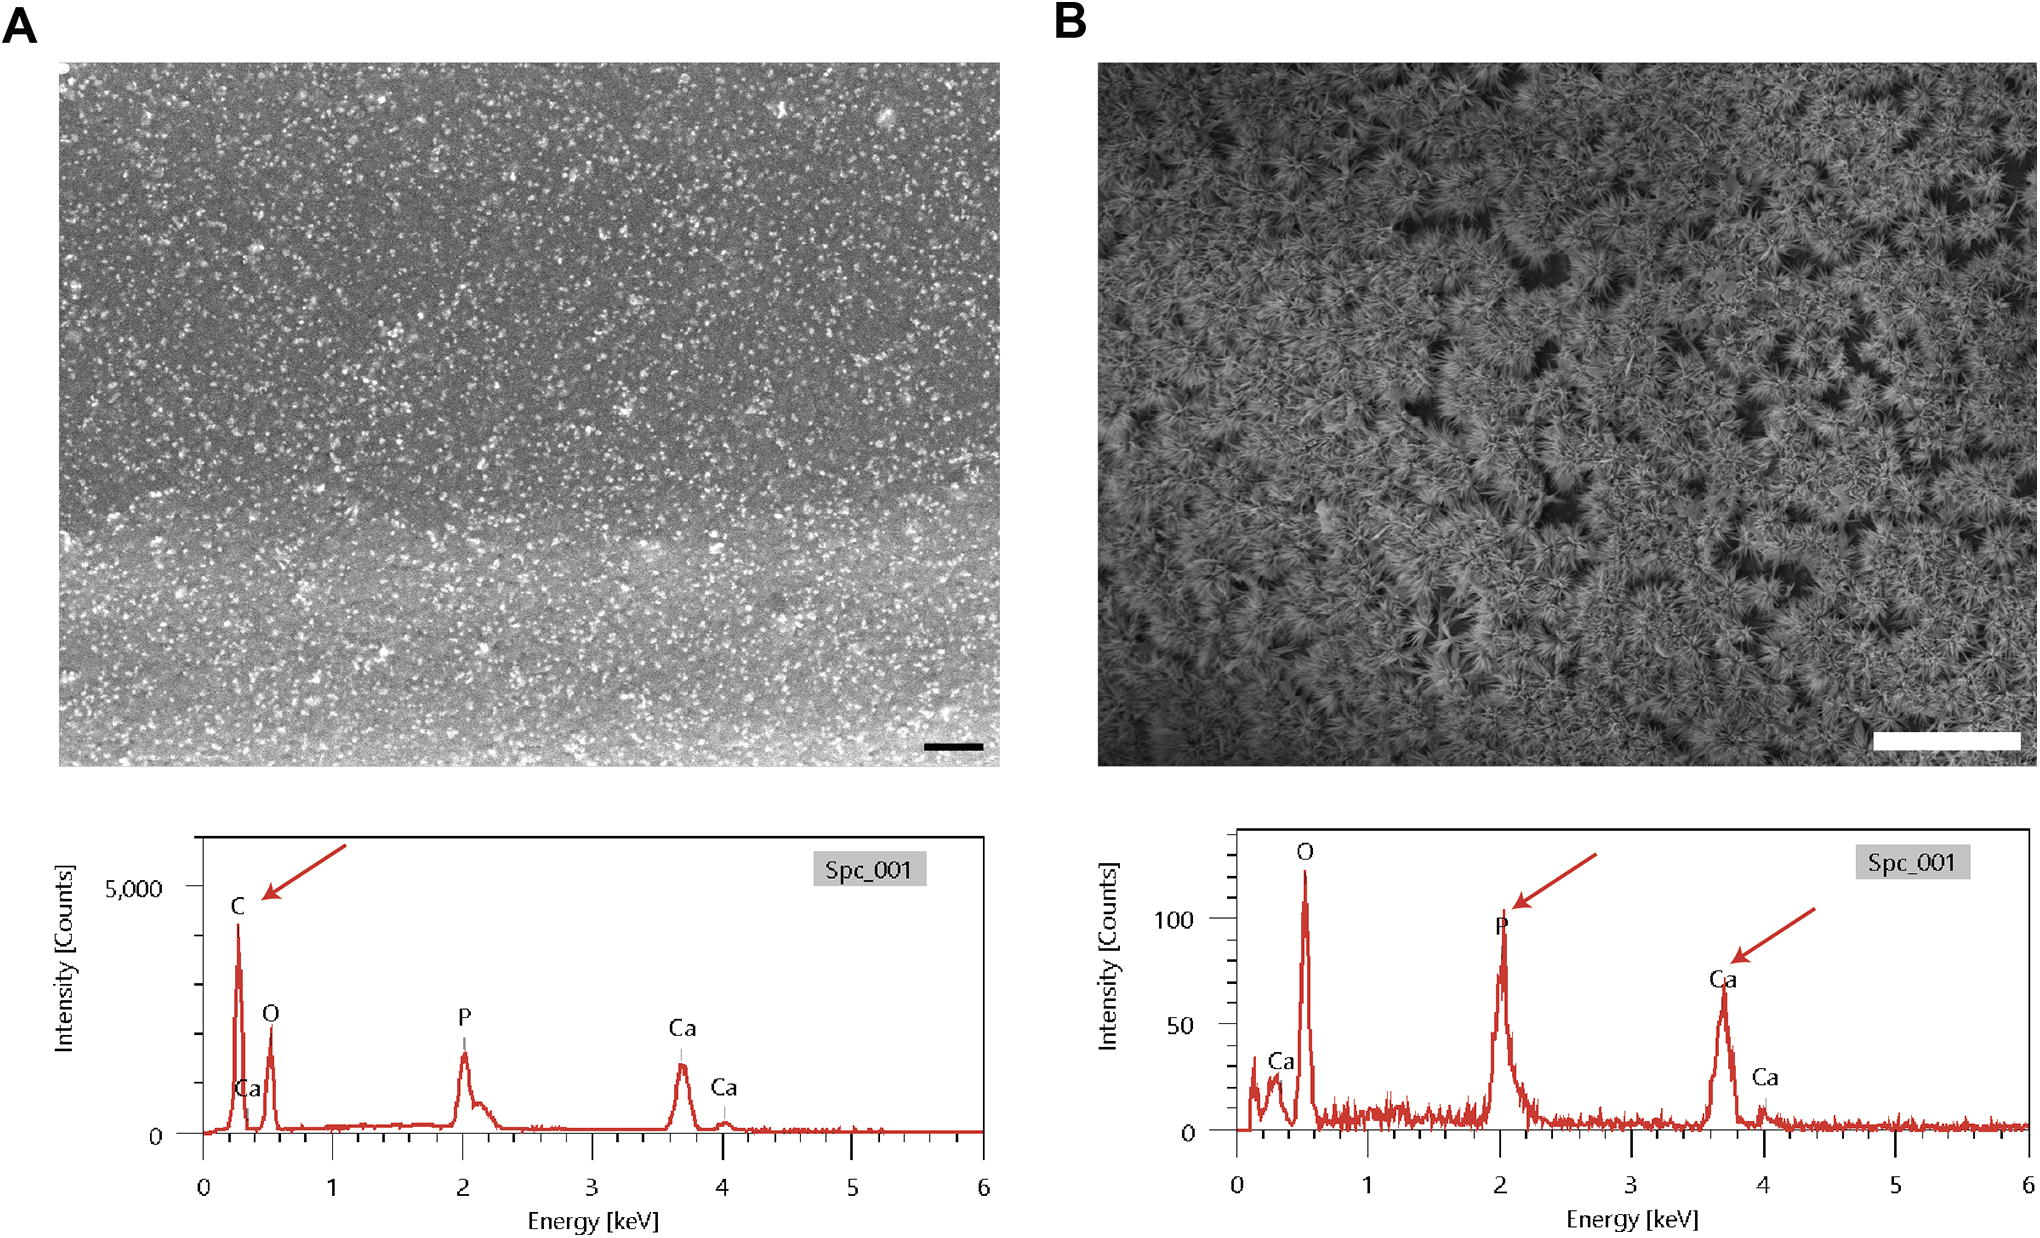
Representative SEM image of a TCP40_D scaffold and EDX analysis before
We hypothesized that the presence of TCP in the TCP40 scaffolds played a role in the bioactivity of the constructs. However, mineral deposition in SBF did not occur during the initial days of immersion, requiring a longer period. We hypothesized that this was due to the formation of a thin polymer layer over the fibers. Over time, the polymer could have gradually degraded, exposing the particles to the surface. To prove this, we cut the scaffolds in half, thus exposing the particles of the cross section directly to the solution. After 7 days, we observed the samples at SEM and found mineral deposition already at this early time point, confirming the hypothesis (Supplementary Fig. S5C). Moreover, similar observations have been documented in literature.40,48,49 In this context, surface alkaline etching has been proposed as a strategy to accelerate surface erosion and, consequently, particle exposure.50,51
Subsequently, we investigated the release dynamics of Ca and P in cell culture conditions. TCP0 and TCP40 scaffolds were incubated in culture medium, which was analyzed at different time points. ICP-MS analysis revealed that at each time point the ionic concentration of both Ca and P was similar between the samples (Supplementary Fig. S5D). However, as the measured concentrations were comparable with the blank (culture medium only), the data suggested that no particles were released from the scaffolds.
Similar to what happened in SBF, we believe that after 28 days, the degradation of the first polymeric layer occurred. However, the TCP particles were not dissolved in the medium, because of their low solubility in non-acidic solutions, thus remaining on the surfaces. Indeed, SEM images showed fully exposed particles to the external environment but still adhered on the surface of the scaffolds (Supplementary Fig. S5E).
Cell adhesion and proliferation
After scaffold characterization and assessing the mineralization potential, we wanted to investigate cell adhesion and proliferation of hMSCs on TCP0 and TCP40, D- or S-shaped, over 28 days of culture. First, we evaluated whether the scaffold architecture significantly affected the cell seeding efficiency by assessing the cell number and distribution. Actin staining revealed that the cells were homogeneously dispersed throughout the scaffolds, similarly for all the different samples (Supplementary Fig. S6A). Moreover, we quantified the DNA content and the number of cells after 24 h. To compare the effect of the shape, the values were normalized against the available surface area of each shape, being the cells mostly present on the surface of the fibers at early time points (Supplementary Fig. S6B). The seeding efficiency of the scaffolds was approximately 44%. This relatively high value was attributed to the seeding procedure with dextran-supplemented media. 52 Moreover, no significant differences in the seeding efficiency were observed comparing the samples. This was also attributed to the dextran seeding procedure, which might mask the initial effect of the shape. In fact, it was observed before that in scaffolds seeded without dextran the S shape resulted in higher and more homogenous seeding efficiency compared with other standard shapes, such as woodpile and triangular pore architectures. 13
At day 7 and day 28, the cell density was calculated to assess proliferation. In this study, the DNA values were normalized against the pore volume, as the pores were already filled with cells (Supplementary Fig. S6C). Both in BM and OM, the cells proliferated over time, with no significant differences between the conditions (Supplementary Fig. S6D, E). From here on, the biological data are always normalized on the pore volume. However, for completeness, we reported also the data normalized against surface area in Supplementary Figure S7.
hMSCs’ differentiation
After investigating the capacity of the developed scaffolds to support cell adhesion and proliferation, we evaluated the effect of scaffold composition and shape on osteogenic differentiation of hMSCs over 28 days, which is considered as a sufficient late time point to observe mature osteogenic differentiation in vitro.53–55 The cells were seeded on TCP40 and TCP0 scaffolds with D or S shape, and after 24 h, the constructs were incubated in basic, osteogenic, or mineralization medium. First, at day 7, we assessed the expression of master transcription regulators for osteogenesis and chondrogenesis, Runt-related transcription factor 2 (RUNX2) and SRY-Box Transcription Factor 9 (SOX9), respectively, as hMSCs can differentiate in both phenotypes.56,57 Confocal images displayed higher presence of RUNX2 localized in the cell nuclei, compared with SOX9 (Supplementary Fig. S8). Early upregulation of RUNX2 and inactivity of SOX9 indicated the commitment of hMSCs toward an osteogenic phenotype.58–60 Therefore, after 7 and 28 days, osteogenic differentiation markers were investigated at a molecular and protein level (Fig. 5A).

Schematic representation of the experiment. At day 0, the cells were seeded on all the scaffolds in BM. At day 1, the scaffolds are divided into three groups: BM, OM (BM + Dexamethasone), and MM (BM + Dexamethasone + β-glycerophosphate)
ALP activity
As an early marker of osteogenic differentiation, the normalized ALP activity was measured after 7 and 28 days of culture, in both BM and OM. In BM, ALP activity was shown to be higher at day 7 than at day 28 (Fig. 5B). Interestingly, we could observe higher values of the D scaffolds (18.2 ± 3.3·103 and 9.9 ± 1.6·103 intensity a.u./(µg/mm3), for TCP0 and TCP40, respectively), when comparing them with the respective S ones, suggesting a possible effect of the shape on ALP activity. In OM, the trend remained the same but with overall higher values (Supplementary Fig. S9A).
No significant effect of the TCP40 samples on cell differentiation was found compared to TCP0 scaffolds. Similar observations were found in literature, where calcium phosphate-based composites did not show significant improvement of ALP activity.61,62 This was ascribed to a slow ion release dynamic, leading to insufficient Ca2+ concentration in the medium so as to affect Ca2+ signaling pathways involved in osteogenesis.
ECM morphology and collagen quantification
The ECM formation on the scaffolds was assessed using SEM at days 7 and 28 (Supplementary Fig. S9B). Cross-sectional images revealed that cells were homogenously distributed across the scaffolds, with no qualitative differences between all conditions. Although at day 7 the pores appeared still open, at day 28 a much higher matrix deposition could be observed (Supplementary Fig. S9B).
The production of collagen was measured as it is the main component of the bone ECM. After 28 days in BM, a roughly five times higher amount of collagen was produced compared with day 7 (Fig. 5C). Like the trends observed in ALP activity, at both days 7 and 28, the D scaffolds showed higher values than the respective S ones. At day 7, TCP0_D and TCP0_S were 234.9 ± 53.1 and 120.1 ± 15.5 µg/(µg/mm3), respectively. When we compared the material effect, we observed higher collagen production for the TCP40 scaffolds. At day 28, TCP40_D and TCP0_D displayed a value of 673.1 ± 63.47 and 605.4 ± 30.5 µg/(µg/mm3), respectively. Similar trends were observed in OM (Supplementary Fig. S9C). In addition, immunostaining at day 28 revealed abundant presence of collagen I in the secreted matrix, without qualitative differences between the samples, proving that bone ECM was deposited (Fig. 5D, Supplementary Fig. S9D).
Mineralization
After having confirmed the deposition of bone collagenous matrix, we assessed mineralization after 28 days of culture. As ARS binds Ca deposits, 63 acellular composite scaffolds were also incubated in media to remove the background values of the scaffolds from the samples (Supplementary Fig. S10A). We found that in the TCP40 scaffolds the matrix mineralized, whereas TCP0 scaffold appeared completely unstained (Fig. 6A, Supplementary Fig. S10B). In BM, the quantification of the staining showed that the TCP40_S samples were significantly higher than TCP40_D (15.4 ± 0.4 and 13.6 ± 0.7 mM/(µg/mm3), respectively) (Fig. 6B). We attributed this to the greater surface area of the S scaffolds compared with the D ones, which probably led to higher area of the exposed calcium phosphate (CaP) particles on the surface of TCP40 scaffolds.
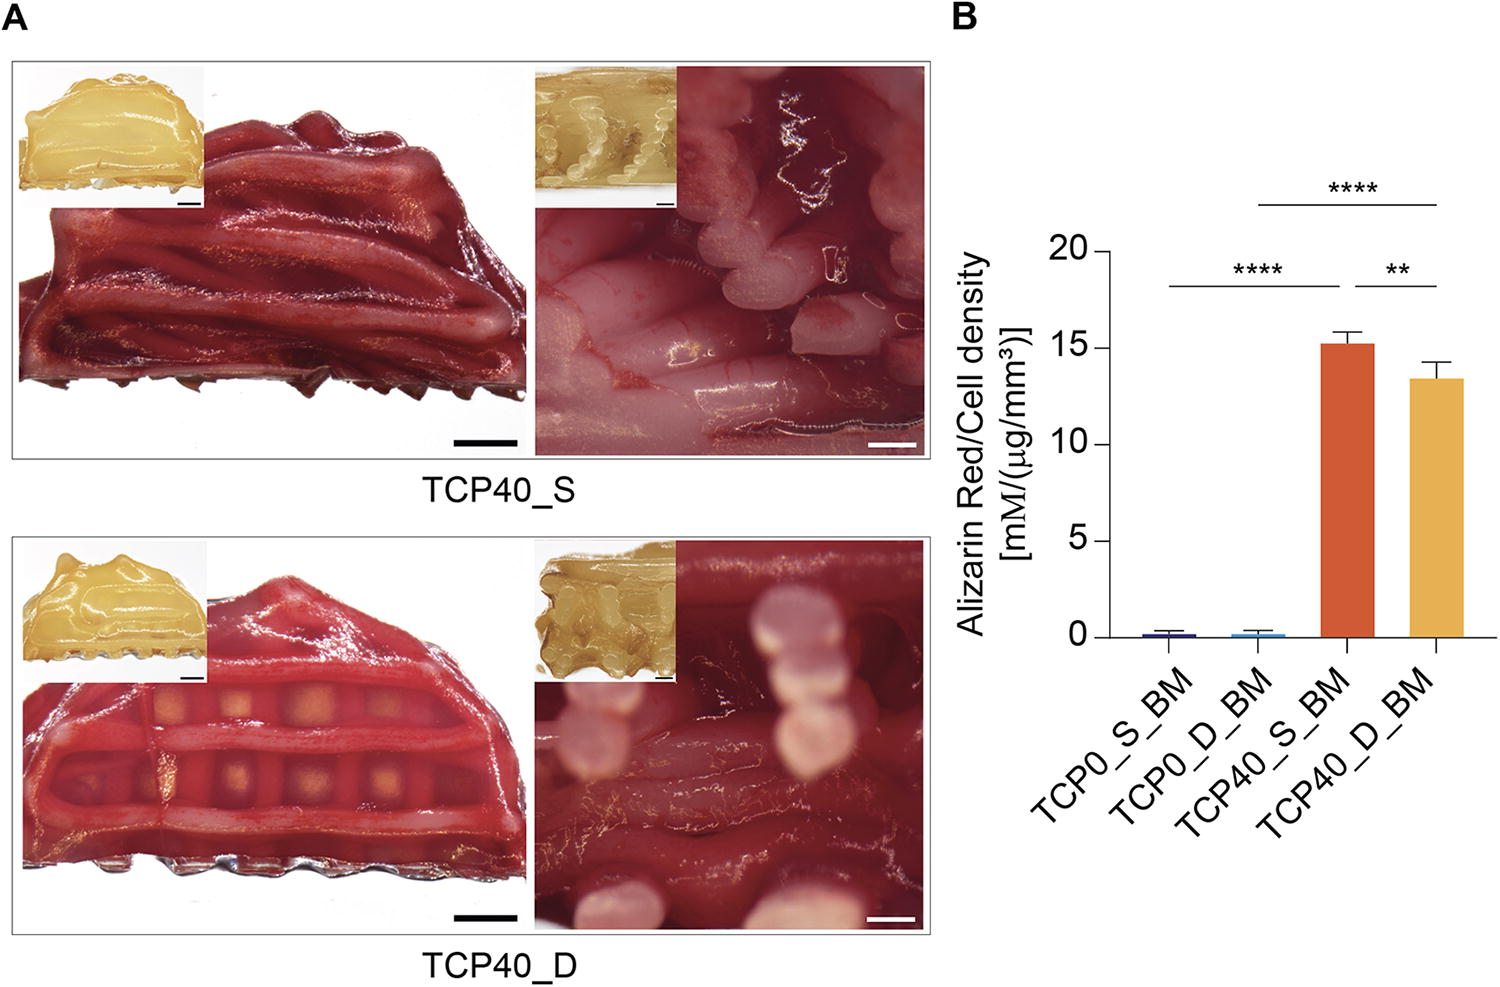
Stereomicroscope images of ARS at day 28 in BM, for TCP40_S and TCP40_D samples, from the top and of the cross section. In the up-left corner, the corresponding TCP0 scaffolds. Scale bar = 200 µm
However, the material composition had a more predominant effect on mineralization than the pore shape. After 28 days, the thin PCL layer initially covering the particles could have slowly degraded, resulting in particle exposition, as previously discussed (see Bioactivity) and reported in literature. 61 In MM, the scaffolds displayed the same behavior (Supplementary Fig. S10C).
Gene expression and immunostaining
As matrix mineralization implied successful progression in the osteogenic differentiation, we assessed the expression of osteogenesis-associated genes at days 7 and 28 in BM (Fig. 7) and OM (Supplementary Fig. S11A, B). The gene activity was normalized to the values of TCP0_S on day 7.

Gene expression of hMSCs cultured in BM on TCP40 and TCP0 scaffolds for 7
As they play a pivotal role in the early phases of osteoblastic differentiation, we assessed RUNX2 and ALP gene expression (Fig. 7A). At day 7, both genes were already expressed with an average fold change of around 1. After 28 days, RUNX2 expression remained constant among all samples, except for a small decrease observed in the TCP40_D construct, whereas ALP expression was 10-fold downregulated. Bone morphogenic protein 2 (BMP2) and Collagen 1A1 (COLL1A1) expression were investigated, as they are typically activated during the middle stage of the osteogenic differentiation and are involved in promoting matrix production and remodeling.64–66 After 28 days, both genes displayed a 1.5- to 2-fold upregulation compared with day 7 (Fig. 7B). Moreover, although minor differences were observed between the shapes, TCP40 scaffolds presented higher BMP2 and lower COLL1A1 expression compared to the respective TCP0. Downregulation of the COLL1A1 gene was attributed to the fact that the protein deposition was probably completed at this time, as supported by the immunofluorescent images (Fig. 5D). In addition, upregulation of BMP2 could indicate that a more active matrix remodeling was ongoing on TCP40 scaffolds.
Finally, we assessed the expression of osteocalcin (OCN), a noncollagenous protein of the bone ECM, secreted by osteoblasts at late stages of maturation. 67 At both time points, OCN gene was not expressed. In addition, OCN was neither observed in immunofluorescent images (Supplementary Fig. S11C). The absence of OCN together with the constant RUNX2 expression over time suggested that the cells did not yet reach the final maturation stage after 28 days.68–71 The slow exposition of CaP may have delayed the tissue maturation.
Taken together, the addition of a high amount of TCP enhanced the deposition of mineralized matrix, whereas the effect on the gene expression and matrix composition was limited. In comparison, our findings align with prior studies that demonstrated that adding ceramic particles to a polymeric matrix did not significantly enhance the osteogenic potential of scaffolds prepared with melt-extrusion additive manufacturing. For example, addition of 20% (w/w) hydroxyapatite to PCL/poly(lactic-coglycolic) acid or 30% (w/w) TCP to PCL scaffolds had limited effect on the expression of osteogenic markers of hMSCs in vitro, compared with pristine polymer scaffolds.72,73 Similarly, poly(ethylene oxide terephthalate)/poly(butylene terephthalate) scaffolds containing 45% w/w HA or 50% w/w TCP did not enhance osteogenic potential of the constructs in vitro.61,74 In these studies, similar to the considerations made in our work, the results were attributed to the low availability of CaP particles to the cells. We believe that degradation of the superficial polymer layer would enhance particle exposure, which may improve the osteogenic potential of these composite scaffolds. To this end, surface modifications have been proposed, such as alkaline etching with NaOH50,75 or coatings with ceramic materials.76,77
Regarding the effect of the S and D scaffolds, the results of biochemical assays and mineralization confirmed the initial hypothesis that different pore geometries influence hMSC differentiation. Notably, the D-shaped scaffolds exhibited increasing trends in ALP activity and collagen production, whereas the S scaffold induced higher mineralization after 28 days. Prior research has explored the impact of pore shape on cell differentiation. For instance, in vitro, higher ALP activity and osteogenic gene expression were found in PCL or titanium scaffolds with rhomboidal or triangular pores, compared with the more traditionally used woodpile geometry.27,78 Other studies have shown that in vivo D-shaped scaffolds exhibited greater bone formation than the square, circular, or triangular pores.79,80 In our study, the overall effect of the shapes appeared limited, namely with the D-shaped scaffolds having an effect on early osteogenic differentiation (i.e., ALP activity increase) and the S-shaped scaffolds on late osteogenic differentiation (i.e., mineralization increase), which we attributed to the static culture conditions. We identified this as a potential limitation of the study, which in future studies could be improved. In fact, Rubert et al. demonstrated that dynamically compressing scaffolds with square or circular pores induced a stronger effect of the geometry on the differentiation of seeded hMSCs. This result was ascribed to mechanical straining of cells and higher nutrient transport under dynamic stimulation. 81 Moreover, static cultures resemble the physiological environment in vivo less than the dynamic conditions. For example, Hutmacher et al. noted that while in vitro triangular-shaped pores supported cell differentiation, in vivo the bone formation was low, which was attributed to the complexity of the in vivo system, where growth factors arrive at the wound site at different stages of healing. 82 Consequently, we believe that future in vivo studies are needed to better conclude on the impact of S and D scaffolds on bone formation.
Conclusion
In this study, scaffolds with a S- or D-like pore shape were fabricated through melt-extrusion-based manufacturing. The scaffolds comprised either pristine PCL (TCP0) or PCL with high amounts of β-TCP (40% w/w, TCP40). The morphological evaluation of the scaffolds revealed a similar total porosity but a higher average pore volume in the D scaffolds. The D scaffolds displayed higher mechanical properties than the S ones, and the addition of TCP acted as reinforcing filler when the different chemical scaffold compositions were compared. Moreover, after 28 days, TCP40 samples favored mineral deposition in SBF solutions, indicating bioactive properties. Thereafter, we evaluated the effect of pore shape and material on osteogenic differentiation of hMSCs. At early time points, expression of RUNX2 implied the commitment of the cells toward osteogenic phenotypes in all scaffolds. The ALP activity and collagen I deposition displayed increasing trends for the D-shaped scaffolds. The gene expression indicated that osteogenic genes were upregulated, and we found that TCP40 scaffolds supported the deposition of mineralized matrix. Notably, a higher deposition of Ca pockets was observed in TCP40_S scaffolds than TCP40_D, which could be a result of the higher surface area of the S scaffolds. Based on the evaluation of the gene and protein expression, we concluded that the cells did not reach full differentiation after 28 days. Thus, to accelerate the biological effect of scaffolds, a surface etching method could be applied to expose the CaP particles to the cells at earlier time points. Nonetheless, taken together, by a thorough physicochemical and biological characterization, we demonstrated the in vitro osteogenic potential of scaffolds with complex pore architectures, especially those comprising a composite material. As the effect of physiological parameters such as dynamic mechanical loading was not assessed, in future studies, we will aim at further investigating these scaffold architectures in a maxillofacial critical-sized bone defect in a porcine model.
Footnotes
Acknowledgments
The authors kindly acknowledge Corbion for providing the PC12 polymer and Kuros for the β-TCP. Micro-CT investigations were possible due to ERDF/COP 2014–2020, ID P_36_611, MySMIS 107066, INOVABIOMED.
Authors’ Contributions
S.D.: Conceptualization (supporting), investigation (lead), data analysis (lead), and writing (lead). E.O.: Investigation (supporting). M.P.: Revision (supporting). P.S.: Revision (supporting). I.S.: Investigation (supporting). G.T.: Supervision (equal), funding acquisition (supporting), and revision (supporting). C.D.: Supervision (equal) and revision (equal). L.M.: conceptualization (lead), supervision (lead), funding acquisition (lead), and revision (lead). All authors have read and approved the article.
Disclosure Statement
The authors declare no conflict of interests.
Funding Information
This study was partially funded by Italian Ministry of Health, Current research IRCCS. The authors also acknowledge the European Union’s Horizon 2020 research and innovation programme under the scope of InterLynk project (grant agreement No. 953169).
References
Supplementary Material
Please find the following supplemental material available below.
For Open Access articles published under a Creative Commons License, all supplemental material carries the same license as the article it is associated with.
For non-Open Access articles published, all supplemental material carries a non-exclusive license, and permission requests for re-use of supplemental material or any part of supplemental material shall be sent directly to the copyright owner as specified in the copyright notice associated with the article.