
Abstract
The periosteum serves as a local source of osteoprogenitor cells and vasculature, therefore influencing the key processes of osteogenesis and neovascularization during bone healing. However, it is often not considered in traditional bone tissue engineering strategies. The periosteum consists of two stratified cell layers, including an inner cambium layer, which serves as a local source of osteoblasts (OBs) and osteoprogenitor cells, and an outer fibrous layer, which hosts vasculature, collagen fibers, and support cells. While several studies have investigated different methodologies to produce tissue-engineered periosteum (TEP) substitutes, few have evaluated the roles of specific cell types within the inner cambium layer and their patterning in 3D environments on underlying bone tissue development. Therefore, we sought to investigate whether mesenchymal stem cells (MSCs) alone, OBs alone, or a 1:1 mixture of the two would result in increased osteogenic differentiation of bone layer MSCs in a 3D bioprinted periosteum-bone coculture model in vitro. We first evaluated these effects in a 2D transwell model, demonstrating that OB-containing cultures, either alone or in a mixed population with MSCs, upregulated alkaline phosphatase activity and runt-related transcription factor 2 (RUNX2) expression. In the 3D bioprinted model, the mixed population showed higher levels of RUNX2 expression and calcium deposition, indicating increased osteogenic differentiation within the bone layer. Results obtained from this study provide evidence that a mixed population of MSCs and OBs within the inner cambium layer of TEP can increase bone regeneration.
Impact Statement
This work seeks to provide insight into each cell type’s effects within the periosteum’s inner cambium layer on surrounding bone tissue regeneration. The findings from this study will provide key biological components necessary to develop functional tissue-engineered periosteum, which can further aid in bone regeneration.
Introduction
Craniofacial bone defects result from congenital disorders, disease, or trauma.1–3 In the United States, approximately 96,000 craniofacial bone graft procedures are performed annually, costing more than 500 million dollars for pediatric patients.4–6 The gold standard treatment is autologous grafting, typically from the iliac crest. 1 While effective, these procedures have risks and limitations like donor site morbidity, insufficient bone volume, and high costs, prompting the search for new therapeutic approaches. Tissue engineering (TE) strategies can address these issues while also producing functional tissue replacements. Traditional bone TE (BTE) strategies deliver mechanically stiff scaffolds containing osteogenic cells and signals, but these approaches rarely replicate the bone’s complex anatomy or include the periosteum, which can be critical for bone development and regeneration in the setting of facial reconstruction.7,8
The periosteum is a 100 µm thick tissue surrounding bones and contains an outer fibrous layer and an inner cambium layer. The outer fibrous layer consists mainly of collagen and elastin fibers, fibroblasts, and rich neural and vascular networks.9,10 The inner cambium layer lies closest to bone tissue and is rich in mesenchymal progenitor cells, osteoprogenitor cells, and osteoblasts (OBs).9,10 Because of the cambium layer’s proximity to the underlying bone tissue, it aids in tissue regeneration processes during injury. Removal of the periosteum creates a hostile wound bed and leads to about a 60% decrease in new bone formation upon implantation of autografts and allografts.10,11 Additionally, flat bone healing is slower than long bones, suggesting that incorporating tissue-engineered periosteum (TEP) into craniofacial BTE approaches could enhance regenerative potential.
Research in TEP has primarily evaluated the osteogenic potential of the inner cambium layer by incorporating osteoconductive materials, scaffold patterning, or osteoprogenitor cell populations.12–16 Hoffman et al. used mesenchymal stem cells (MSCs) and predifferentiated osteoprogenitor cells alone or in a 1:1 ratio in polyethylene glycol hydrogels to create TEP that was wrapped around an allograft and implanted into a murine femur. 12 However, this approach overlooks the critical role of OBs in periosteal tissue. In native periosteum, OBs lie closest to the surrounding bone tissue, allowing them to effectively communicate with cells in both the bone and periosteal tissues to direct the process of new bone formation.9,17–21 Therefore, it is essential to investigate the regenerative potential of OBs within TEP to mimic native anatomy better and improve bone regeneration.
We previously developed a 3D bioprinting strategy to fabricate thin membranous tissues, such as periosteum, alongside large-scale tissues, such as bone, within the same construct.22,23 Here, we apply that strategy to identify cell populations in the periosteum’s inner cambium layer that best support new bone formation through the evaluation of bone-layer MSC osteogenic differentiation in vitro. Before in vivo experimentation, it is essential to elucidate which cell populations are critical to incorporate to understand the underlying molecular mechanisms of the coculture conditions and to reduce sample groups. We evaluated the effects of no periosteum (Np), MSC only (MSCp), osteoblast only (OBp), or a 1:1 mixed population (MIXp) on osteogenic differentiation of bone-layer MSCs in vitro. Specifically, we were interested in investigating the effects of the periosteum cellular makeup on matrix mineralization and osteogenic marker expression. Using the 2D transwell models (Fig. 1), we assessed alkaline phosphatase (ALP) activity, mineralization, transforming growth factor beta 1 (TGFβ-1) release, and expression of runt-related transcription factor 2 (RUNX2) and osteopontin (OPN). Additionally, using our bioprinting strategy to generate these cocultures in 3D, we observed how patterning these cell types at a biomimetic scale influences matrix mineralization and osteogenic marker expression. Scaffold mineralization and RUNX2 expression were analyzed in 3D cultures. Our results highlight the critical role of OBs in bioprinted periosteum, thereby informing future TEP research.

Methods
Cell culture
Human bone marrow-derived MSCs (RoosterBio, Fredrick, MD) were cultured in tissue culture polystyrene (TCPS) flasks (Corning, Corning, NY) in high glucose Dulbecco’s Modified Eagle Medium (Gibco, Grand Island, NY), supplemented with 10% fetal bovine serum (FBS, Gibco), 1% penicillin-streptomycin (pen-strep, Gibco), and 1% nonessential amino acids (Gibco). Cells were grown to confluence, passaged using 0.25% trypsin/ethylenediaminetetraacetic acid (EDTA, ThermoFisher, Grand Island, NY), and used for various experiments. MSCs were used at passages 2–4 for all experiments. Osteogenic media formulation consisted of the same components as MSC growth media, supplemented with 100 nM dexamethasone (Sigma Aldrich, Saint Louis, MO), 100 µM ascorbic acid (Sigma Aldrich), and 10 mM β-glycerophosphate (Sigma Aldrich). All media were sterile filtered before use in culture.
Human OBs (hOBs, Sigma Aldrich) were cultured on TCPS in OB growth media (OGM, Sigma Aldrich), supplemented with 10% FBS and 1% pen-strep. Cells were grown to confluence and then passaged using the OB-specific Detach Kit [4-(2-hydroxyethyl)-1-piperazineethanesulfonic acid (HEPES) buffer wash, trypsin/EDTA, and trypsin neutralizing solution; Sigma Aldrich]. Cells were used at passages 3–6 for all experiments.
2D model seeding
For all 2D experiments, cells were seeded in TCPS 24-well plates (Corning). Periosteum coculture groups were seeded on polyethylene terephthalate (PET) 0.4 µm pore transwells (Corning). Np samples were seeded with MSCs in the bottom well only, MSCp samples included MSCs in the transwell and bottom well, OBp samples included OBs in the transwell and MSCs in the bottom well, and MIXp samples included a 1:1 ratio of MSCs and OBs in the transwell with MSCs in the bottom well (Fig. 1). For ALP and enzyme-linked immunosorbent assays (ELISAs), cells were seeded at 30,000 cells/cm2. For immunofluorescent and Alizarin Red (AR) staining assays, cells were seeded at 5,000 cells/cm2 to minimize potential over-confluence throughout the 21-day studies. Cells were seeded on the plates and transwells in growth media overnight. The media was changed to either growth or osteogenic media conditions. A separate set of samples was seeded per time point, except for the ELISA.
2D alkaline phosphatase assessment
Six wells were seeded per condition per time point for ALP activity, but two wells were combined to generate one sample (n = 3), as the Abcam ALP Colorimetric Assay Kit (Abcam, Waltham, MA) requires a minimum of 100,000 cells per sample. At each time point, bone layer cells were washed with cold phosphate-buffered saline (PBS, Sigma Aldrich), and the ALP assay buffer was added. Cells were scraped, homogenized via rigorous pipetting, and then transferred to 1.5 mL microcentrifuge tubes (Cell Treat, Ayer, MA). Cells were centrifuged at 4°C at top speed (14,000 rpm) for 15 min. The supernatant was transferred to a new tube and stored at −80°C until ready to assay. The colorimetric assay was performed according to the manufacturer’s protocol, and absorbance was read at 405 nm (Tecan Spark, Tecan, Morrisville, NC). ALP activity was calculated using the absorbance values, the standard curve, and an equation provided in the protocol booklet. Two technical replicates were performed for each measurement with three biological replicates.
2D TGFβ-1 ELISA
For ELISA analysis, the same sample wells were used for all time points (i.e., sample media at each time point was measured from the same wells, rather than having a separate sample set per time point). At each time point, both media from the bone layer MSC compartment and periosteum transwell compartment were collected as one sample to observe the total release into the coculture. Media was stored at −80°C and then assayed according to the manufacturer’s protocol for the Abcam Human TGFβ-1 ELISA (Abcam). Absorbance was read with the Tecan Spark plate reader (Tecan, Morrisville, NC), and sample concentration was calculated using the standard curve values. Data are presented per day as the media was changed at different intervals between day 1 and the rest of the study (i.e., media at day 1 shows TGFβ-1 accumulation from 24 h after the start of the experiment, while days 7, 14, and 21 show TGFβ-1 accumulation over 2 days between media changes). Two technical replicates were measured for each assay and five biological replicates were measured per group.
2D immunofluorescent staining
At each time point, periosteum transwells were discarded and bone layer MSCs were washed twice with PBS and then fixed with 10% formalin (Thermo Fisher Scientific, Waltham, MA) for 20 min. Samples were washed three times in tris-buffered saline (TBS, BioRad, Hercules, CA) and then permeabilized in 0.25% Triton X-100 (Sigma Aldrich) for 5 min. Cells were washed twice with TBS and then blocked with 4% weight per volume (w/v) bovine serum albumin (BSA, Thermo Fisher Scientific)/TBS for 1 h at 37°C with gentle shaking. The monolayer was washed once with TBS and the primary antibody was added. The Invitrogen RUNX2 polyclonal antibody (PA5-82787, Host: rabbit; Thermo Fisher Scientific) was diluted 1:160 in TBS. The ProteinTech Osteopontin polyclonal antibody (22952-1-AP, Host: rabbit; Thermo Fisher Scientific) was diluted 1:200 in TBS. The cell monolayer was covered in the primary antibody solution and incubated overnight at 4°C. The following day, the sample was washed five times with TBS, and the secondary antibody was added. The donkey antirabbit Alexa Fluor 647 (ab150075, Abcam) secondary antibody was diluted 1:1000 in TBS for both assays. Samples were incubated in the dark at 37°C with gentle shaking for 1 h. The samples were washed five times with TBS. DAPI or 4′,6-diamidino-2-phenylindole (Thermo Fisher Scientific) was diluted 1:1000 in TBS and was added to the monolayer for 10 min in the dark at room temperature. Cell monolayers were washed with TBS three times for 5 min each with gentle shaking. Cells were stored in the last TBS wash until imaging. Images were taken at 20X magnification on both DAPI and CY5 channels. Three images were taken per sample (top, middle, and bottom of the well) and these were used as technical replicates. Five biological replicates were imaged per condition per time point. Images were then analyzed in ImageJ. Automated cell counting was used on DAPI channel images, while mean fluorescent intensity per image was measured for RUNX2 CY5 images. For OPN staining, the CY5 fluorescent area was obtained via ImageJ analysis.
2D AR staining
The bone layer MSC cell monolayer was washed with PBS once at each time point and then fixed in 10% formalin (Thermo Fisher Scientific) for 20 min. Samples were washed twice with distilled water (dH2O). A 2% w/v solution of AR (Sigma Aldrich) in dH2O was added to each sample, which was incubated on a shaker at room temperature for 10 min. Five washes in dH2O with gentle shaking between were completed. Samples were directly imaged via Brightfield microscopy. Samples were frozen at −20°C until extraction. Five samples (n = 5) were imaged per condition, with one image per well at each time point.
AR staining extraction was performed by adding a solution of 10% w/v cetylpyridinium chloride (Sigma Aldrich) to the cell monolayer. Samples were incubated in the extraction solution for 10 min, homogenized, and then transferred into a black 96-well plate for reading. Absorbance was measured at 570 nm. The extraction solution was used as a blank control. Two technical replicate wells were performed per sample, with five samples per condition per time point.
Gelatin methacrylate bioink synthesis and preparation
Gelatin methacrylate (GelMA) was synthesized according to previously established protocols. 24 Gelatin type A (300 g Bloom, Sigma Aldrich, Saint Louis, MO) from porcine skin was dissolved in PBS at 50°C at 10% w/v. Methacrylic anhydride (MA, Sigma Aldrich, Saint Louis, MO) was added at a proportion of 0.6 g MA/1 g gelatin using a syringe pump set at 250 µL/min. The solution reacted for 1 h under vigorous stirring, then was centrifuged at 1000 g for 5 min. The supernatant was collected, diluted 1:1 with PBS, and placed in a dialysis membrane with a 14 kilodalton (kDa, Cole-Parmer, Vernon Hills, IL) cutoff. The solution was dialyzed against water for 7 days at 50°C. GelMA was flash-frozen overnight at −80°C and lyophilized for 7 days.
For 3D culture studies, dry GelMA was sterilized via UV light for 45 min. To prepare cell-laden bioinks, MSCs, OBs, or a 1:1 ratio of MSCs to OBs were cultured and passaged as previously described, counted, and resuspended in a minimal volume of MSC growth media. These cell solutions, concentrated at 1 million cells/mL, were used to reconstitute the sterilized dry GelMA at a concentration of 10% w/v. This GelMA-cell suspension was vortexed gently in 2-s intervals for 1 min, then incubated at 37°C to allow for dissolution. The suspension was vortexed again, and sterile lithium phenyl-2,4,6-trimethylbenzoylphosphinate (LAP, TOCRIS, Minneapolis, MN) was added to a final concentration of 0.1% w/v. The solution was gently vortexed and transferred to a sterile 30 cc amber printer barrel (Nordson, Westlake, OH) with a 27-gauge conical needle (200 µm inner diameter, Nordson).
3D bioprinting of bone-periosteum model
Cell-laden bioink solutions were placed on ice for 5 min to gel thermally and then equilibrated at room temperature for 1 h before printing. Bone-periosteum models were printed in a concentric circle pattern (Fig. 1D) with an inner circle of 6 mm diameter containing MSCs for the bone layer and an outer periosteal cambium layer of 200 µm width containing MSCs, OBs, or a 1:1 ratio of the two. All cells were suspended in 10% w/v GelMA with 0.1% LAP and printed with the BioAssemblyBot 400 (Advanced Solutions, Louisville, KY). Printing conditions for all solutions included a speed of 6 mm/s and a pressure ranging from 16 to 20 psi. All bioinks were printed at room temperature. A gel-only control was also printed for 3D AR staining studies. Samples were printed for AR and immunofluorescence studies for time points of days 1, 7, 14, and 21 with three samples per group per time point (n = 3). After printing, samples were crosslinked under UV light for 10 min. Sterile alginate (low viscosity, Sigma Aldrich) dissolved at 2% w/v in growth media was applied to every sample for a 2-h incubation period to postprocess the prints. 23 Samples were washed with sterile PBS twice and incubated in growth media overnight. The following day, the media was changed to growth or osteogenic media conditions.
3D immunofluorescent staining
Immunofluorescent staining for RUNX2 expression was conducted as previously described with some modifications. Permeabilization was extended from 5 to 10 min. Images were taken at 10X modification, with one image per sample taken directly at the center of the bone portion of the scaffold. Images were taken on the CY5 channel for RUNX2 quantification and the DAPI channel for nuclei counterstaining. All images were analyzed in ImageJ. In 3D samples, RUNX2 positive nuclei were counted in ImageJ.
3D AR staining
AR staining for calcium deposition was conducted according to the previous protocol, with an extended stain incubation of 30 min. Extraction via cetylpyridinium chloride was not included for 3D samples, as the hydrogels retained the majority of the stain.
Image analysis was conducted in ImageJ on 3D sample images to determine the percent-stained area of the hydrogel cocultures. Images were converted to 8-bit grayscale images, and the threshold was set to a minimum value of 20 and a maximum value of 250. This range was determined by adjusting the threshold values across the whole dataset to eliminate any background stain. The particle analyzer was used to determine the area of the stain. The total area of the gel was also analyzed via ImageJ by manually selecting the boundary line of each gel and using the measure tool. Statistical comparisons for MIXp groups are displayed on the graph, while all other statistical comparisons can be visualized in Supplementary Figure S6.
Statistical analyses
All experimental sample numbers and technical replicates are listed per each protocol. Technical replicates were averaged to generate one value per biological replicate. Statistical analyses were conducted in GraphPad Prism. Normality was assessed via the Shapiro-Wilk test. If data were found to follow or partially follow a normal distribution (i.e., some groups were normally distributed and some were not), datasets underwent parametric two-way analyses of variance (ANOVAs) with subsequent Tukey’s post hoc analysis. If data were found to be partially nonnormal, the ROUT method for outlier detection was utilized, except in the case of 3D RUNX2 analysis, as these data are presented as RUNX2 positive cells and cannot be normalized to a total cell count. Outliers were removed and ANOVAs were performed on the cleaned data. Significance was determined by a p-value <0.05. All values are displayed as mean ± standard deviation of biological replicates.
Results
2D evaluation of osteogenic differentiation
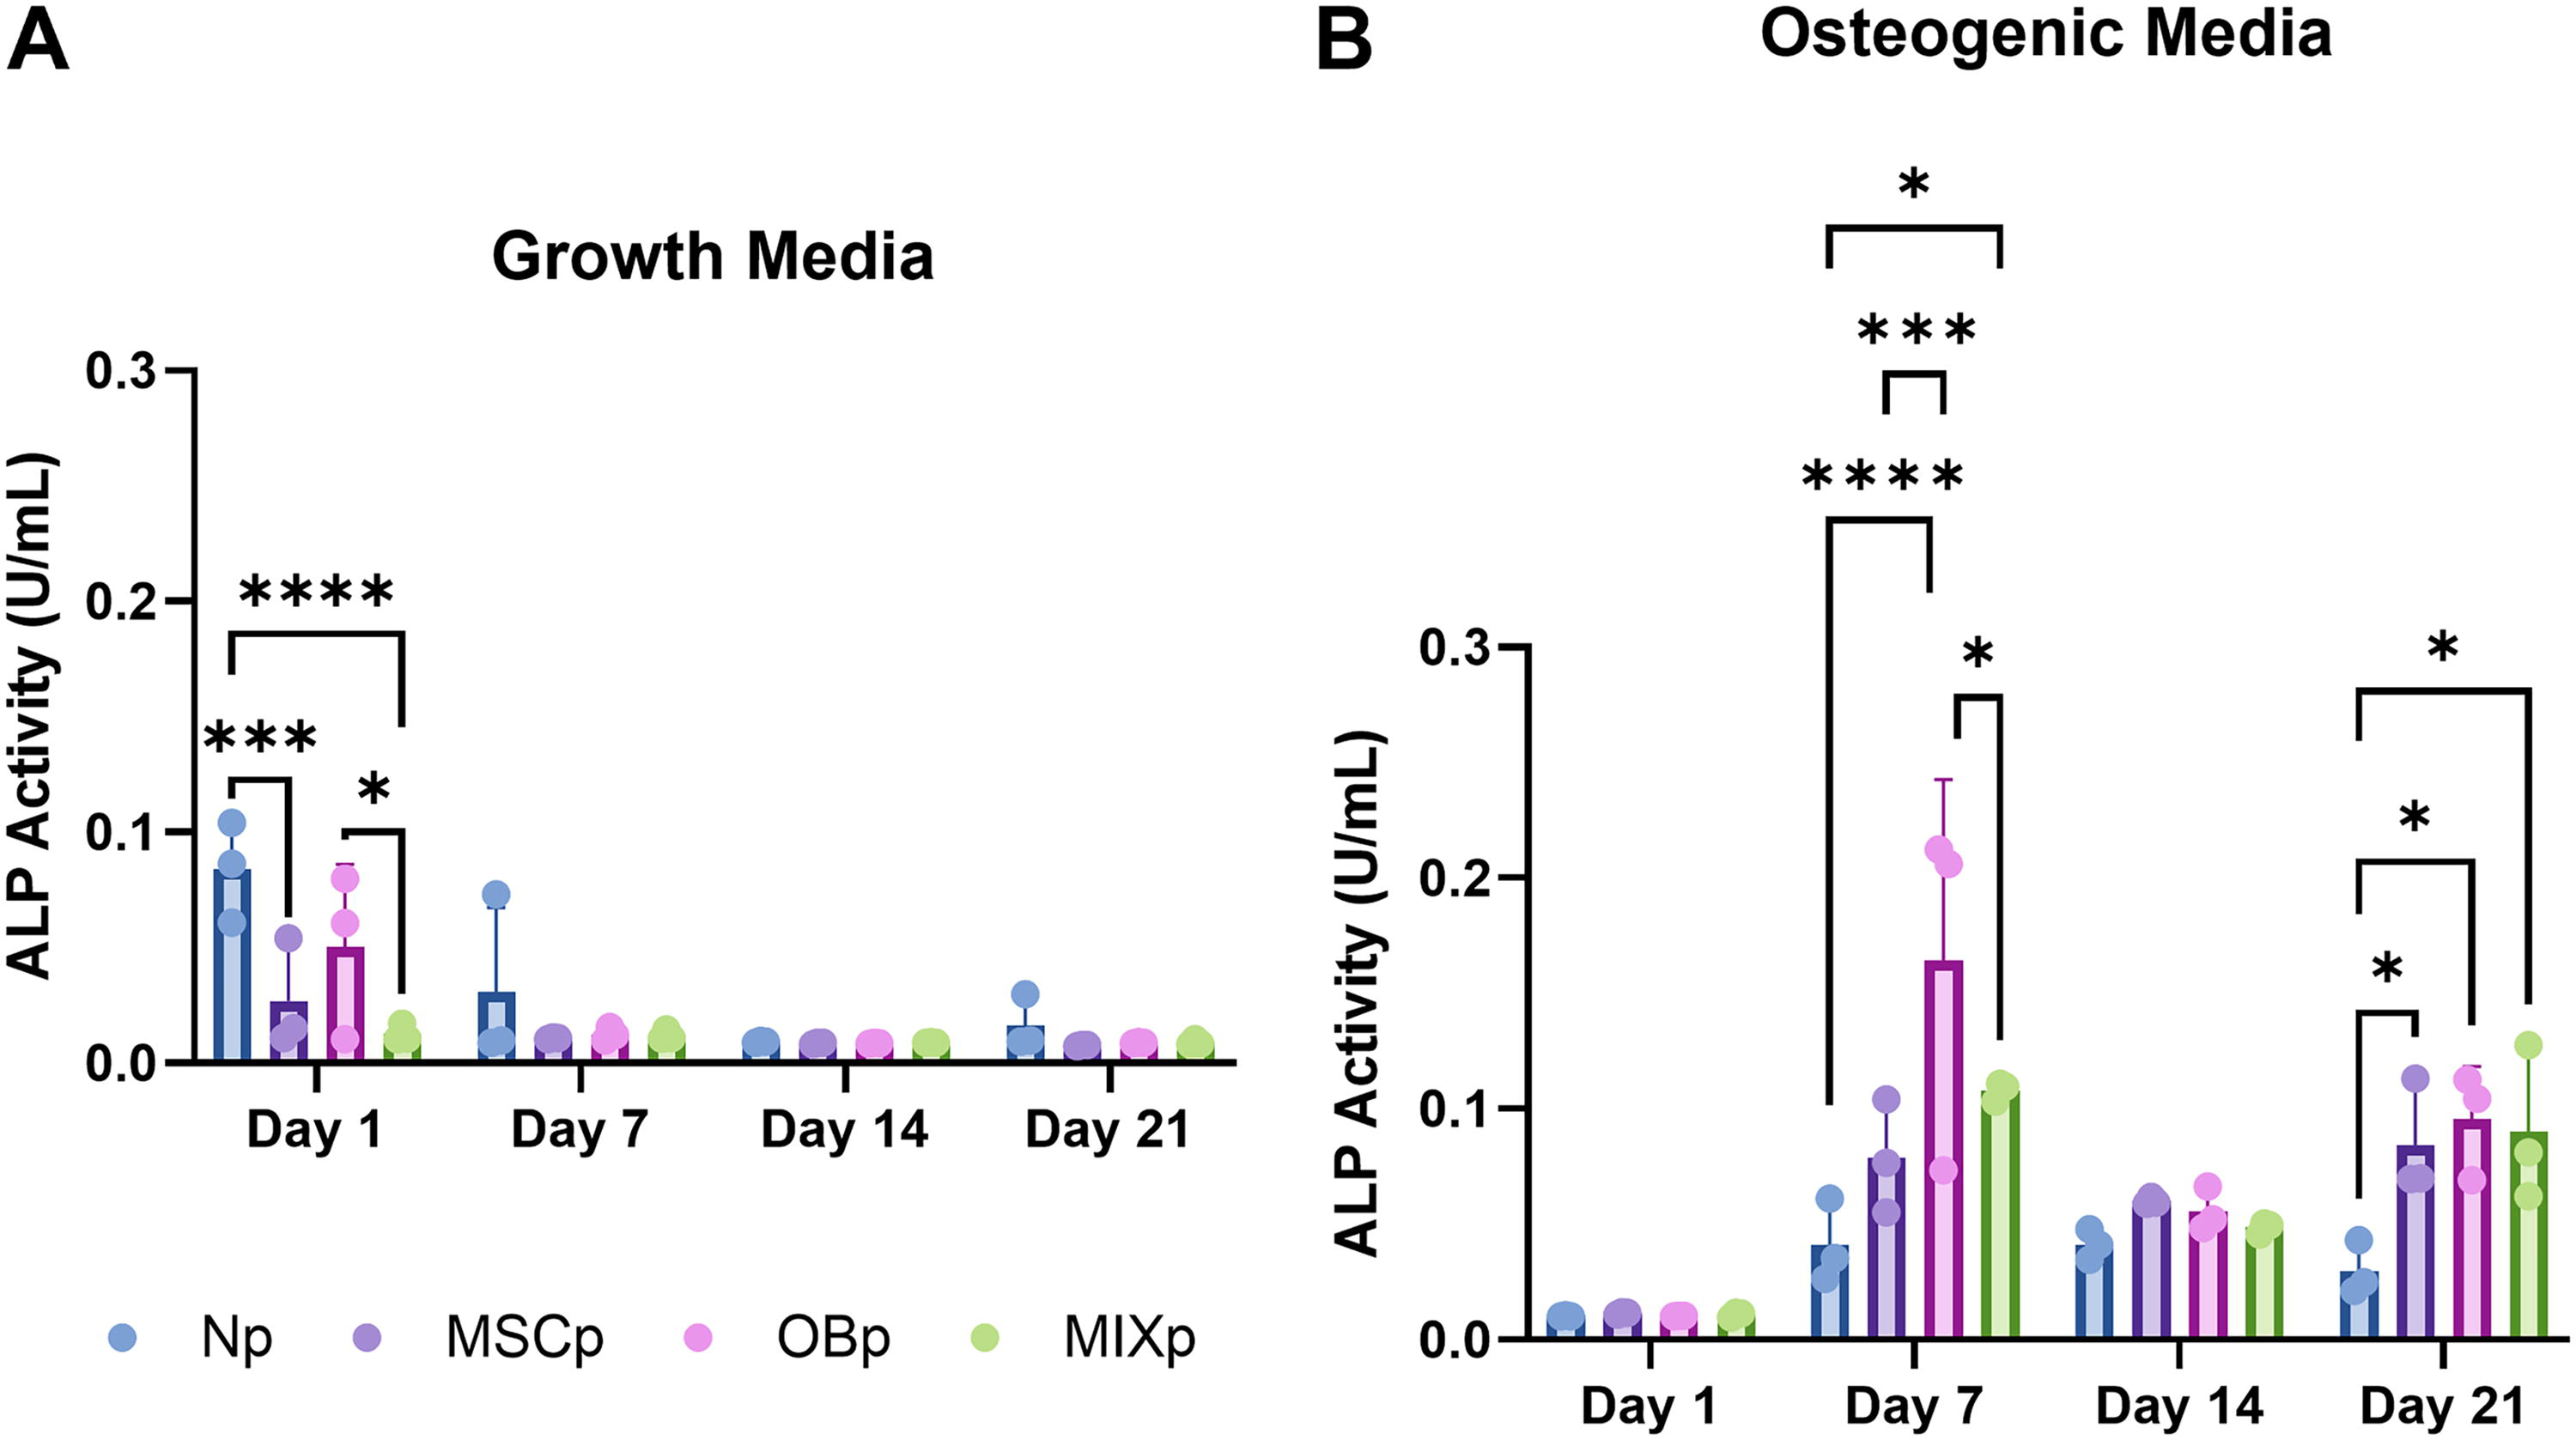
ALP activity is a crucial osteogenic differentiation marker, particularly as a precursor to matrix mineralization. 25 We evaluated ALP activity in bone-layer MSCs in response to periosteum coculture composition using an ALP activity assay from Abcam. In growth media conditions at day 1, both Np (****p < 0.0001) and OBp (*p < 0.05) groups exhibited significantly higher levels of ALP activity compared to the MIXp group (Fig. 2). Furthermore, Np samples displayed increased activity relative to MSCp samples (***p < 0.001). In osteogenic media conditions, ALP activity peaked at day 7, with significantly higher levels in the OBp group compared to Np (****p < 0.0001), MSCp (***p < 0.001), and the MIXp group (*p < 0.05). Additionally, MIXp samples showed elevated ALP activity compared to Np samples (*p < 0.05). At day 21, MSCp, OBp, and MIXp groups presented increased activity compared to Np groups (*p < 0.05).
Two-dimensional ALP activity in
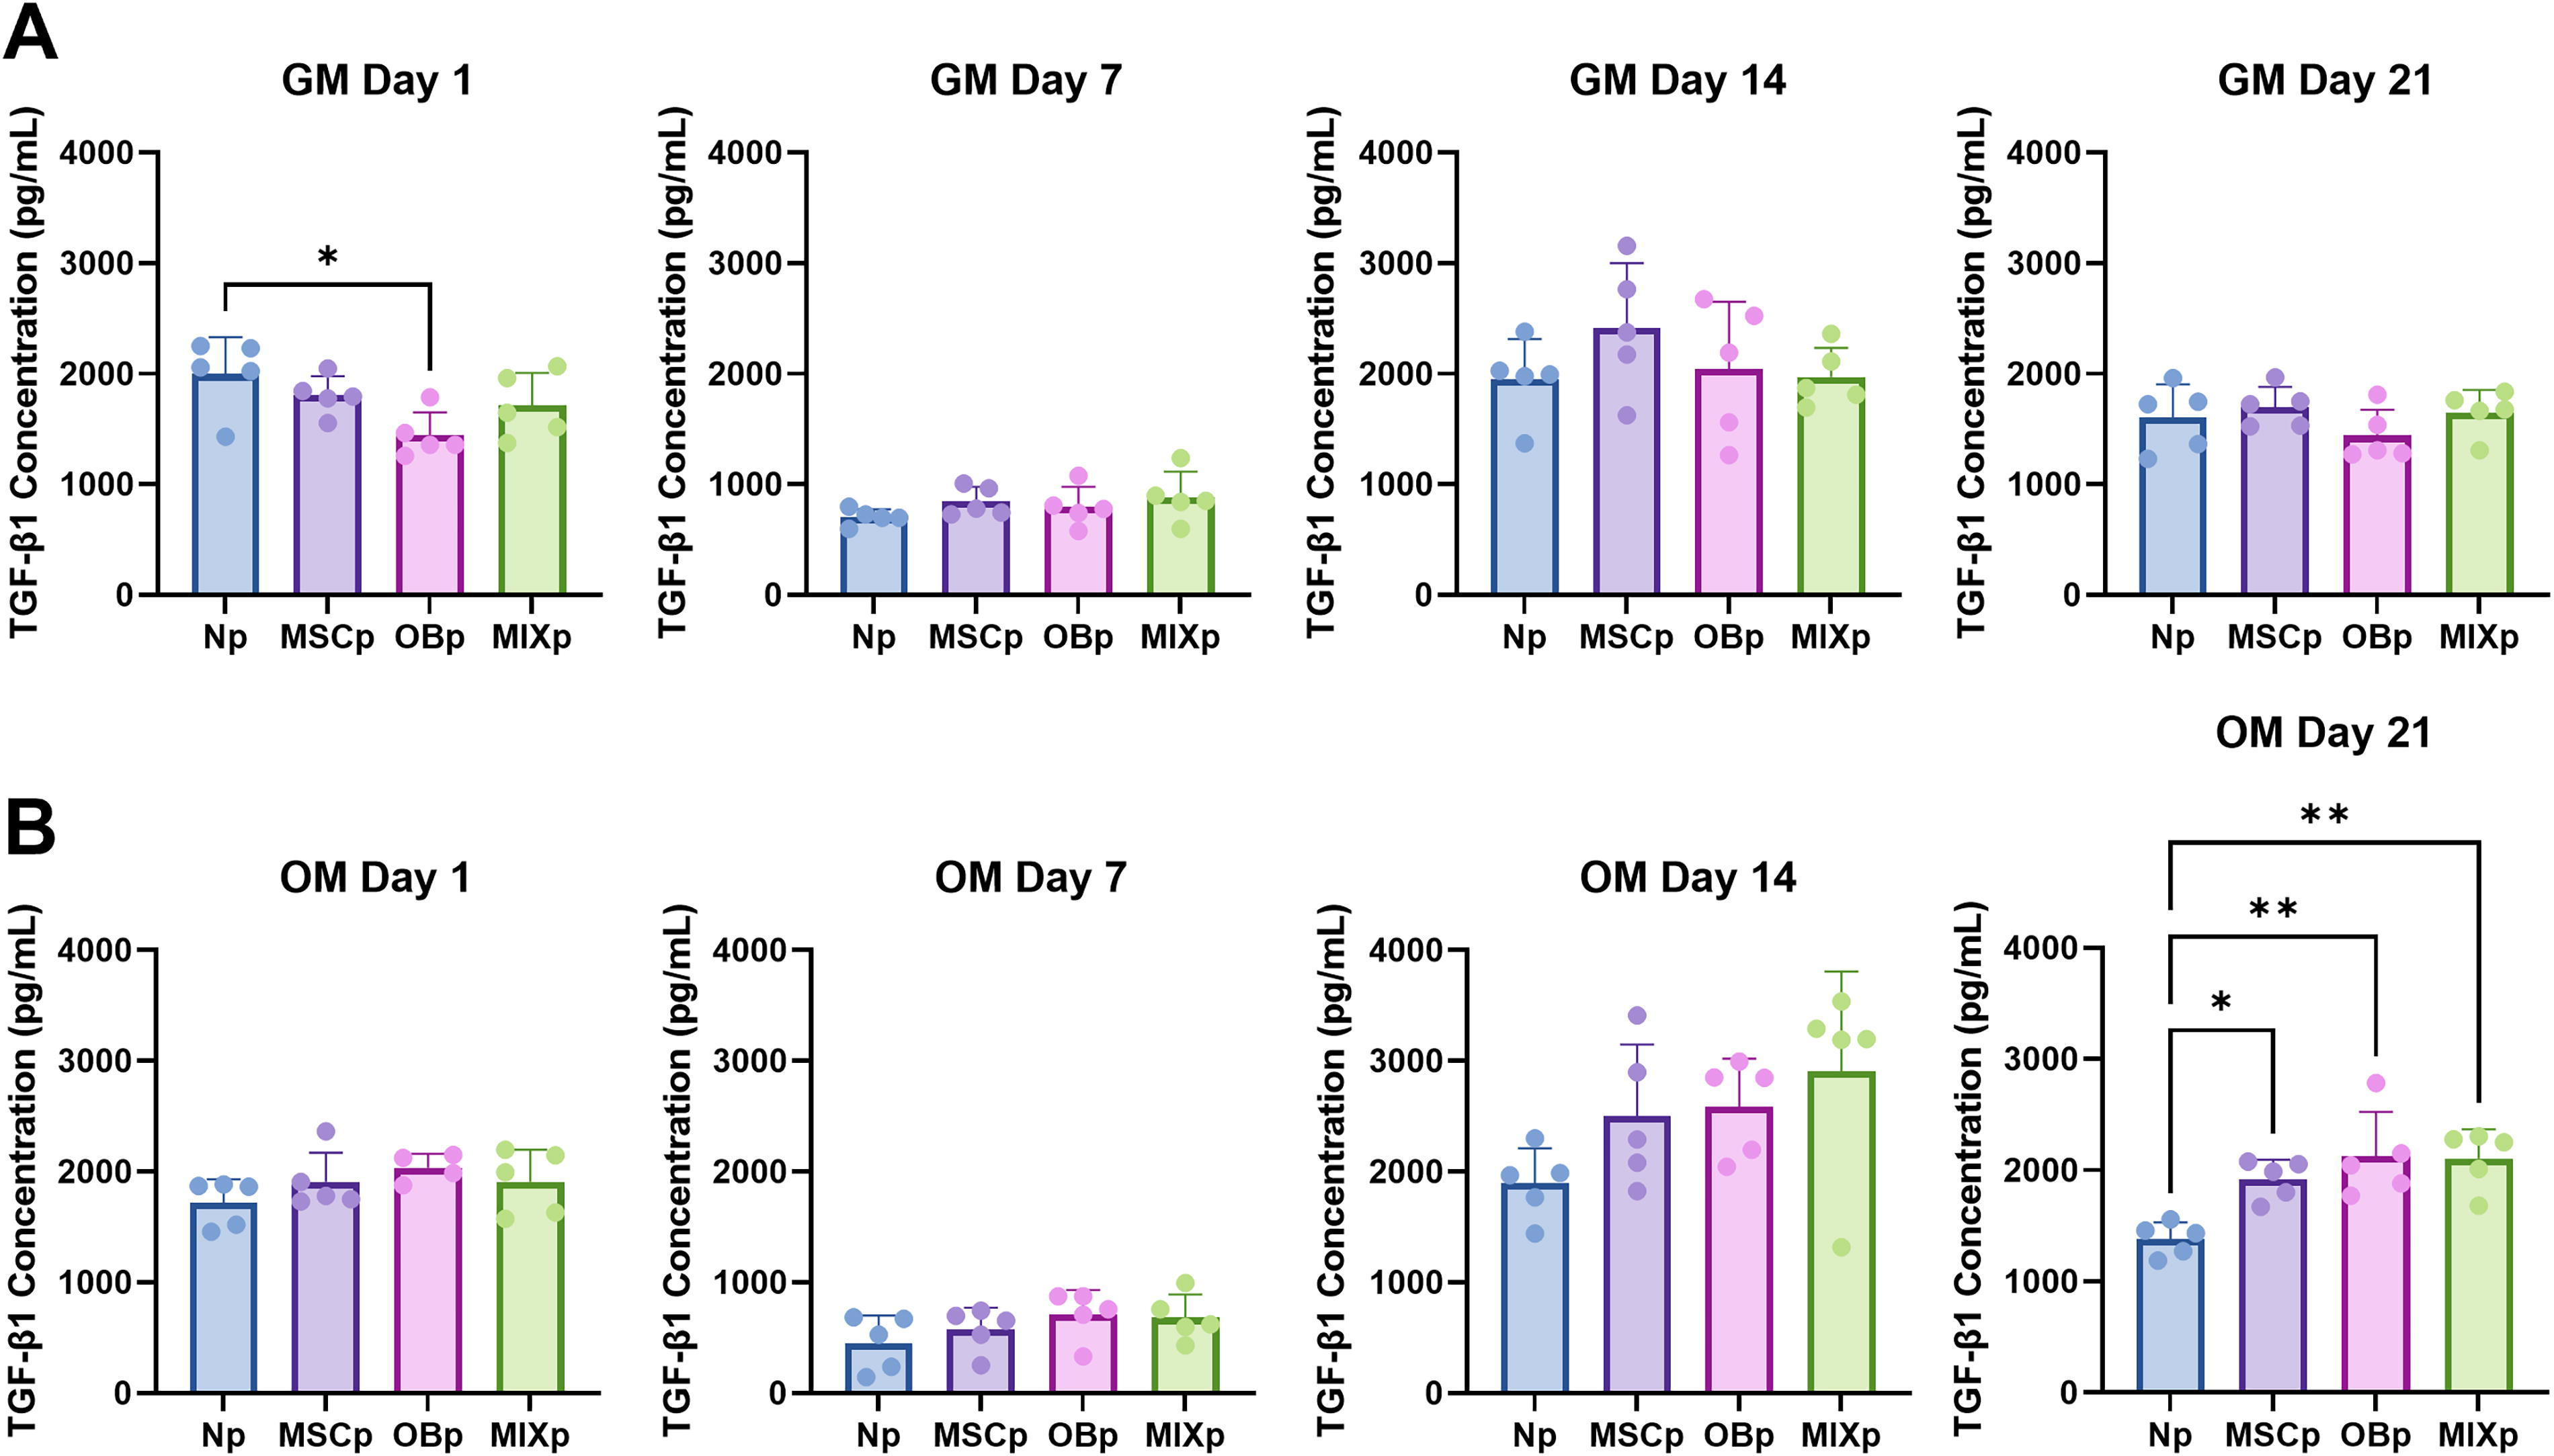
TGFβ-1 signaling has been shown to stimulate the expression of RUNX2, a master regulator and transcription factor in osteogenic differentiation. 26 Thus, we aimed to evaluate how the composition of periosteum cells affects the release of TGFβ-1 in the bone-periosteum coculture system in 2D. In growth media conditions, Np samples showed significantly higher levels of TGFβ-1 release than OBp samples (*p < 0.05) at Day 1 (Fig. 3). In osteogenic media, periosteum-containing cultures showed significantly higher levels of TGFβ-1 release than Np samples (*p < 0.05 for MSCp, **p < 0.01 OBp and MIXp).
Two-dimensional TGFβ-1 culture concentration measured via ELISA in
Since RUNX2 is the primary regulator of osteogenic differentiation, we investigated how the composition of periosteum cells influences its expression in 2D cultures. 27 This analysis was performed through immunofluorescent staining and imaging of bone layer MSCs only. In growth media conditions, the ratio of RUNX2-expressing cells to the total number of cells in the image, quantified via a DAPI counterstain (Supplementary Fig. S1), peaks at day 7 (Fig. 4). At this time, the MIXp culture exhibited a significantly higher ratio of RUNX2 positive cells to total cells compared to Np (**p < 0.01), MSCp (*p < 0.05), and OBp (**p < 0.01) cultures. While RUNX2 expression exhibited a general increasing trend over time in osteogenic and growth media conditions (Supplementary Figs. S1 and S2), few significant patterns emerged when normalized by the number of total cells per image.

OPN protein is a vital factor in bone mineralization and cell adhesion, and the upstream RUNX2 transcription factor heavily regulates its expression. 28 OPN expression was evaluated through immunofluorescent staining and imaging of bone layer MSCs. No significant trends were observed in either growth or osteogenic media conditions regarding the ratio of OPN-positive area to the total number of cells per image (Fig. 4). OPN-positive area was low in growth media conditions (Supplementary Figs. S3 and S4). Still, it demonstrated a significant increase over time in osteogenic media conditions, regardless of the culture composition.
Mineralization is a key late-stage marker of osteogenic differentiation, indicating that OBs are present and capable of depositing calcium and phosphate ions into the newly developed osteoid matrix.29,30 Accordingly, we utilized AR to stain calcium deposition in the 2D culture models, specifically in the bone layer MSCs. In growth media conditions, absorbance values were highest at days 7 and 14. At day 7, OBp and MIXp cultures exhibited increased absorbance levels compared to Np (**p < 0.01) and MSCp (**p < 0.01, *p < 0.05) cultures (Fig. 5). This trend reversed at day 14, with MSCp samples showing higher absorbance levels compared to OBp (*p < 0.05) and MIXp (*p < 0.05) samples. No significant differences were observed between groups at each time point in osteogenic media conditions.

Two-dimensional culture AR staining extraction quantification and images of Np, MSCp, OBp, and MIXp groups in
3D evaluation of osteogenic differentiation
Considering the critical role of RUNX2 in osteogenic differentiation, immunofluorescent staining and imaging of the transcription factor were evaluated in 3D culture conditions, specifically in the bone portion of the coculture scaffolds. No significant trends were observed in the number of RUNX2-positive cells in growth media conditions throughout the experiment (Fig. 6 and Supplementary Fig. S5). However, in osteogenic media conditions at day 14, there were significantly higher levels of RUNX2-positive cells in MIXp scaffolds compared with Np, MSCp, and OBp (**p < 0.01). At day 21, MIXp cultures also demonstrated significantly higher levels of RUNX2 expression compared to MSCp cultures (*p < 0.05).

Three-dimensional bone-periosteum coculture immunofluorescent staining of RUNX2 quantification and 10X images of Np, MSCp, OBp, and MIXp groups in
AR staining was conducted on 3D bioprinted samples to evaluate how periosteum cell makeup and patterning in a 3D environment impacted matrix mineralization. Image analysis was utilized in 3D due to the retention of the stain in the hydrogel matrix, even after extraction. In growth media conditions, the percent-stained area peaked in all groups on day 14 (Fig. 7). On days 1 and 7, MIXp samples demonstrated significantly higher levels of stained area when compared to all other groups (****p < 0.0001). On day 21, the MIXp group showed significantly higher levels of stained area than all other groups. In osteogenic conditions, the most notable trends are evident on day 1, in which MIXp samples showed significantly higher levels of stain than all other groups (****p < 0.0001) (Fig. 8). MIXp samples also demonstrated higher levels of stain area at day 7 compared to the OBp group (*p < 0.05). Statistical comparisons between other experimental groups can be seen in Supplementary Figure S6.

Three-dimensional bone-periosteum coculture AR staining and image analysis data of Np, MSCp, OBp, and MIXp, and cell-free gel groups in growth media conditions on days 1, 7, 14, and 21. Deep red stain in images indicates calcium deposition. Data is presented as % stained area. n = 3 biological replicates with one image taken per sample. ****p < 0.0001. Statistical differences between MIXp group and other experimental groups are shown here. Additional statistical differences can be found in Supplementary Figure S6. Scale bars 1,000 µm.

Three-dimensional bone-periosteum coculture AR staining and image analysis data of Np, MSCp, OBp, and MIXp, and cell-free gel groups in osteogenic media conditions on days 1, 7, 14, and 21. Deep red stain in images indicates calcium deposition. Data is presented as % stained area. n = 3 biological replicates with one image taken per sample. *p < 0.05, ****p < 0.0001. Statistical differences between MIXp group and other experimental groups are shown here. Additional statistical differences can be found in Supplementary Figure S6. Scale bars 1,000 µm.
Discussion
Although traditional BTE approaches focus on developing mechanically strong, vascularized regenerative constructs, these strategies often neglect the critical role of the periosteum in the maintenance and regeneration of bone tissue.9,10,31 Several approaches to periosteum TE have utilized various fabrication methodologies, including cell sheet engineering, electrospinning, decellularization, and casting. 32 Our previous studies developed a 3D printing and post-processing strategy to generate thin-scale membranous tissues, like periosteum, and their macroscale tissue counterparts, like bone, within the same print with biomimetic scale resolution.22,23 Additionally, researchers have investigated osteoconductive materials, MSCs, and osteoprogenitor cells within the inner cambium layer to enhance new bone formation in vivo.12,14–16,33–37 However, no previous studies have investigated the roles of each cell type within the inner cambium layer and their patterning within a 3D construct on bone tissue development. We sought to address these issues in the current study. Specifically, we evaluated the periosteum cell composition on bone matrix mineralization and osteogenic marker expression in vitro to elucidate which groups would be critical to evaluate in future in vivo studies. We also utilized our 3D bioprinting and post-processing strategy to print a biomimetic-scale periosteum with an MSC-laden bone layer to evaluate the effects of TEP composition and 3D patterning on the regenerative potential of the underlying bone tissue.
We first evaluated the effects of the different periosteum compositions on ALP activity within the bone layer MSCs in 2D. ALP is a precursor to the mineralization of newly developed bone matrix and is considered an early osteogenic differentiation marker. 38 While growth media conditions did not present significant trends, OB-containing cultures (OBp and MIXp) demonstrated increased levels of ALP activity. These results indicate that OBs within the periosteum can significantly impact matrix mineralization within the bone layer, providing a critical design component for TEP studies.
We then investigated the effects of the periosteum composition on TGFβ-1 release into the 2D coculture. TGFβ-1 has been shown to upregulate the expression of RUNX2, the master regulator of all osteogenic gene expression, in the early stages of osteogenic differentiation.39–41 In osteogenic media conditions at day 21, TGFβ-1 release was significantly greater in periosteum-containing groups compared to Np samples. These results indicate that the periosteum layer can lead to increased TGFβ-1 release and, therefore, influence the expression of RUNX2 downstream. However, given that the release fluctuates in the early stages between days 1, 7, and 14, increased RUNX2 expression may be impacted by other factors that further drive the bone layer MSC osteogenic differentiation, such as bone morphogenetic proteins. 41
As RUNX2 has been widely established as the master regulator of osteogenic differentiation, we sought to understand how the periosteum layer cell composition impacted the expression of this transcription factor. RUNX2 expression continued to increase in both media conditions over time in 2D, particularly in MIXp and OBp groups (Supplementary Figs. S1 and S2). We observed that the MIXp population, the most biomimetic representation of native periosteum, resulted in a significantly higher ratio of RUNX2+ cells to total cells at day 7 in growth media conditions. 9 Previous studies have indicated that coculturing OBs with MSCs can lead to upregulated RUNX2 expression, specifically with increased ratios of OBs to MSCs within the culture. 42 These data indicate that the MIXp population is the most promising in influencing bone layer osteogenic differentiation. Additionally, the incorporation of increased ratios of OBs to MSCs in future studies could further enhance the regenerative potential of this TEP approach.
To evaluate the downstream effects of increased RUNX2 expression due to the periosteal layer composition, we investigated the expression of OPN via immunofluorescence in bone layer MSCs in 2D. 43 While no particular trends were observed between groups in terms of the ratio of fluorescent area to total number of cells, the OBp group did demonstrate the highest levels of fluorescent area at day 21 (Supplementary Fig. S3), indicating that the inclusion of OBs within the coculture shows the greatest potential to increase bone layer MSC osteogenic differentiation. As previous research has shown, OBs cultured in proximity to undifferentiated MSCs can initiate their commitment toward an osteoblastic lineage through paracrine signaling mechanisms.17,21 However, an increased ratio of OBs to MSCs may be more beneficial to upregulate later-term osteogenic markers. 42
We then utilized the 2D coculture model to determine the impact of periosteal cell composition on mineral deposition of the bone layer MSCs. The early phase of osteogenic differentiation is marked by matrix deposition, and matrix mineralization appears as a later-stage marker. 44 In growth media conditions, OBp and MIXp groups demonstrate higher absorbance levels at day 7, and Np and MSCp show higher levels at day 14. These results indicate that the OBs in the OBp and MIXp cultures may increase the rate of osteogenic differentiation within the bone layer MSCs, further highlighting the OBs’ key role in the periosteum. Previous studies have shown that OB presence in direct coculture with MSCs can accelerate the process of matrix mineralization, particularly in osteogenic media conditions. 42
As OB-containing cultures showed significant promise in promoting osteogenic differentiation of bone layer MSCs in the 2D coculture model, we translated these same groups to a 3D model to investigate the cell population composition and patterning on bone layer MSC differentiation. While previous research in TEP has produced biomimetic-scale tissues through methods like cell sheet engineering and electrospinning, these techniques require significant handling of delicate cellular materials and do not offer precise control over periosteum and bone cell population distances. 32 Cell-cell population distances can greatly impact paracrine signaling mechanisms and subsequent regenerative potential, so we endeavored to control this variable through extrusion bioprinting. 45 Our previous research developed a 3D bioprinting and post-processing strategy for generating macroscale and microscale tissues within the same construct.22,23 We then applied this strategy to our bone-periosteum cocultures to generate biomimetic-scale periosteum within the same print as a macroscale bone structure (Fig. 1).
We first evaluated the effects of the periosteum makeup and 3D environment on RUNX2 expression within bone layer MSCs. DAPI counterstain was not included in the 3D analysis, as mineralization of the 3D construct led to significant background signal in this channel, particularly at later time points. In osteogenic media, at days 14 and 21, the MIXp population showed a significantly higher count of RUNX2+ cells. While the peak in expression of RUNX2 is observed at later time points compared to the 2D study, this could be due to the difference in cell density utilized in 3D experiments. 46 Additionally, the GelMA bioink properties may have hindered MSC differentiation in a 3D environment. It is well established in previous research that MSCs cultured on stiffer substrates show an increased tendency toward an osteoblastic lineage compared to those cultured on softer substrates. 47 Including stiffer support materials, such as polycaprolactone (PCL), co-printed with GelMA as a cell delivery material could mitigate these issues. These data indicate that the biomimetic 1:1 ratio of MSCs and OBs within the periosteum has the greatest potential for increasing bone layer MSC differentiation in vitro and potentially new bone formation in vivo.
Finally, we investigated the impact of periosteum cellular composition and 3D patterning on matrix mineralization in 3D within bone layer MSCs. The MIXp group shows the highest amount of percent-stained area throughout the experiment in growth media conditions (Figs. 7 and 8). Interestingly, the stain peaks at day 14. Several studies have shown that peak mineralization can range from 14 to 28 days, depending on the cells assayed.30,48 In osteogenic conditions, the MIXp group also maintains the highest percentage of stained area at day 1, but all other time points demonstrate similar levels of stained area between all groups. We incorporated a cell-free hydrogel control, which also exhibited increased levels of stained area over time. This could be due to the passive absorption of calcium from the cell culture media throughout the experiment. The results from this study also provide further evidence that incorporating a 1:1 ratio of MSCs to OBs within the periosteum has the greatest potential for increasing bone matrix mineralization.
This study’s results indicate that OBs within TEP, specifically in combination with MSCs, demonstrate the greatest potential for upregulating osteogenic marker expression and matrix mineralization within bone layer MSCs. In both 2D and 3D culture systems, the MIXp population showed higher levels of RUNX2 expression and matrix mineralization, which are key markers of early and late osteogenic differentiation. Previous studies in TEP have mainly focused on delivering MSCs alone in conjunction with allografts.12–16 However, the data presented in this study indicate that OB incorporation within the inner cambium layer enhances bone tissue regeneration potential compared to MSCs alone or cultures that do not contain TEP.
Conclusion
This study examined the role of MSCs and OBs in the periosteum on bone layer MSC osteogenic differentiation in vitro in 2D and 3D environments. We evaluated pathways such as ALP and its downstream effects on mineralization, as well as TGFβ-1 release and its impact on RUNX2 and OPN expression. Additionally, we investigated how the key markers of RUNX2 expression and mineralization were affected in the 3D environment in response to these cocultures. The MIXp population, a 1:1 ratio of MSCs and OBs, which is the most biomimetic representation of native periosteum, resulted in increased expression of RUNX2 and matrix mineralization. However, previous research suggests that a higher ratio of OBs to MSCs could further augment TEP osteogenic potential. 42 Future studies should explore print patterning of inner cambium layer cells, as OBs within the periosteum lie closest to the underlying bone tissue, while other cell types lie further away. 9 Additionally, evaluating the effects of these constructs on new bone formation in vivo, delivered in conjunction with engineered bone tissue or allograft materials, would provide a greater understanding of the critical role of periosteum in bone healing.
Authors’ Contributions
S.T.M. and P.W. designed and conducted experiments and data analysis and prepared the article. J.F.C. and J.P.F. oversaw experiments, data analysis, and article preparation.
Footnotes
Author Disclosure Statement
No competing financial interests exist.
Funding Information
This research was supported by the Osteo Science Foundation’s Peter Geistlich Grant (23052316), The National Institutes of Health (NIH) R01 (HD112031), The Royal Society of New Zealand Catalyst Fund, and the Fischell Doctoral Fellowship from the University of Maryland.