
Abstract
The objective of this work was to use a functional gait analysis technique to evaluate sciatic nerve repair through tissue-engineered nerve guides in a rodent animal model. The nerve guides were fabricated by blending collagen with chitosan material and evaluated over a 12-week period for motor and sensory nerve recovery assessed by gait analysis and behavioral testing. Gastrocnemius muscle weight measurements were obtained at the end of each experimental time point and correlated to motor nerve recovery. Functional gait analysis studied both the stance and swing phase angle formations during a normal gait cycle. During the stance phase, functional results revealed that blended nerve guides promoted increased motor nerve recovery than unblended chitosan nerve guides. Similar results were obtained from behavioral tests, indicating that blended nerve guides created increased sensitivity to applied stimulus compared to unblended nerve guides. Muscle strength also correlated with functional recovery and was significantly higher when compared to the unblended nerve guides. From this study, we conclude that collagen-blended chitosan nerve guides enhanced motor and sensory nerve recovery assayed through gait and behavioral testing compared to unblended nerve guides.
Introduction
In our current study, we have evaluated collagen-blended chitosan nerve guides by using functional gait analysis, behavioral testing, and muscle mass measurements. Chitosan, which is biocompatible and biodegradable, does not evoke a strong immune response and is versatile due to the availability of diverse methods of chemical processing.7–11 Modifications of structural and mechanical properties of both collagen and chitosan can result in scaffolds that can promote cellular regeneration.12–19 Cheng et al. 20 suggested that collagen chitosan membranes provided increased PC-12 cellular attachment, differentiation, and growth compared to unblended chitosan membranes. Collagen chitosan nerve conduits have also been evaluated using electrophysiological and histological techniques. Sensory nerve recovery occurred in 10 mm conduits at 8 weeks and in 5 mm conduits at 5 weeks. Histologically, 5 mm conduits showed better results compared to 10 mm conduits. 21 This study did not evaluate functional restoration or motor nerve recovery. The primary aim of our current study was to measure and compare gait angle changes between collagen-blended chitosan nerve guides, unblended chitosan nerve guides, and autograft groups. The second aim was to measure gastrocnemius muscle mass over the course of sciatic nerve repair period. Our final aim studied effects of blended nerve guides on sensory recovery using mechanical withdrawal threshold testing. We hypothesize that collagen chitosan nerve guides can promote functional and sensory recovery.
Materials and Methods
Fabrication of nerve guides
Chitosan solution (2%) was prepared by dissolving chitosan powder (80% N-deacetylated, 600,000 molecular weight; Biosyntech, Quebec, Canada) in 2% acetic acid. Collagen (Sigma-Aldrich, St. Louis, MO) was dissolved into this solution at a 2% concentration to yield a collagen-blended chitosan solution. This mixture was injected into a concentric tubular mold consisting of a glass outer tube and a stainless steel-polytetrafluorethylene (PTFE) inner rod. The mold was dipped into ammonia solution (30%) overnight to gel. After gelling, the mold construct was directly frozen in liquid nitrogen and lyophilized overnight. After lyophilization, the outer and inner mold was removed, resulting in the tubular collagen chitosan (CC) nerve guide. Nerve guides used in this study had an internal diameter of 1.6 mm, 1 mm wall thickness, and 12 mm length as measured with a micrometer (Fig. 1a). These dimensions were selected as they do not compress the sciatic nerve and retain tubular structures in vivo without collapsing. 18 Conduits were re-hydrated by immersion in 100% ethanol for an hour followed by subsequent immersion in an ethanol series consisting of 50%, 60%, 70%, and 80% ethanol solutions. Final conduits were stored in 80% ethanol until implantation, prior to which the guides were equilibrated in distilled water and rinsed in phosphate-buffered saline.
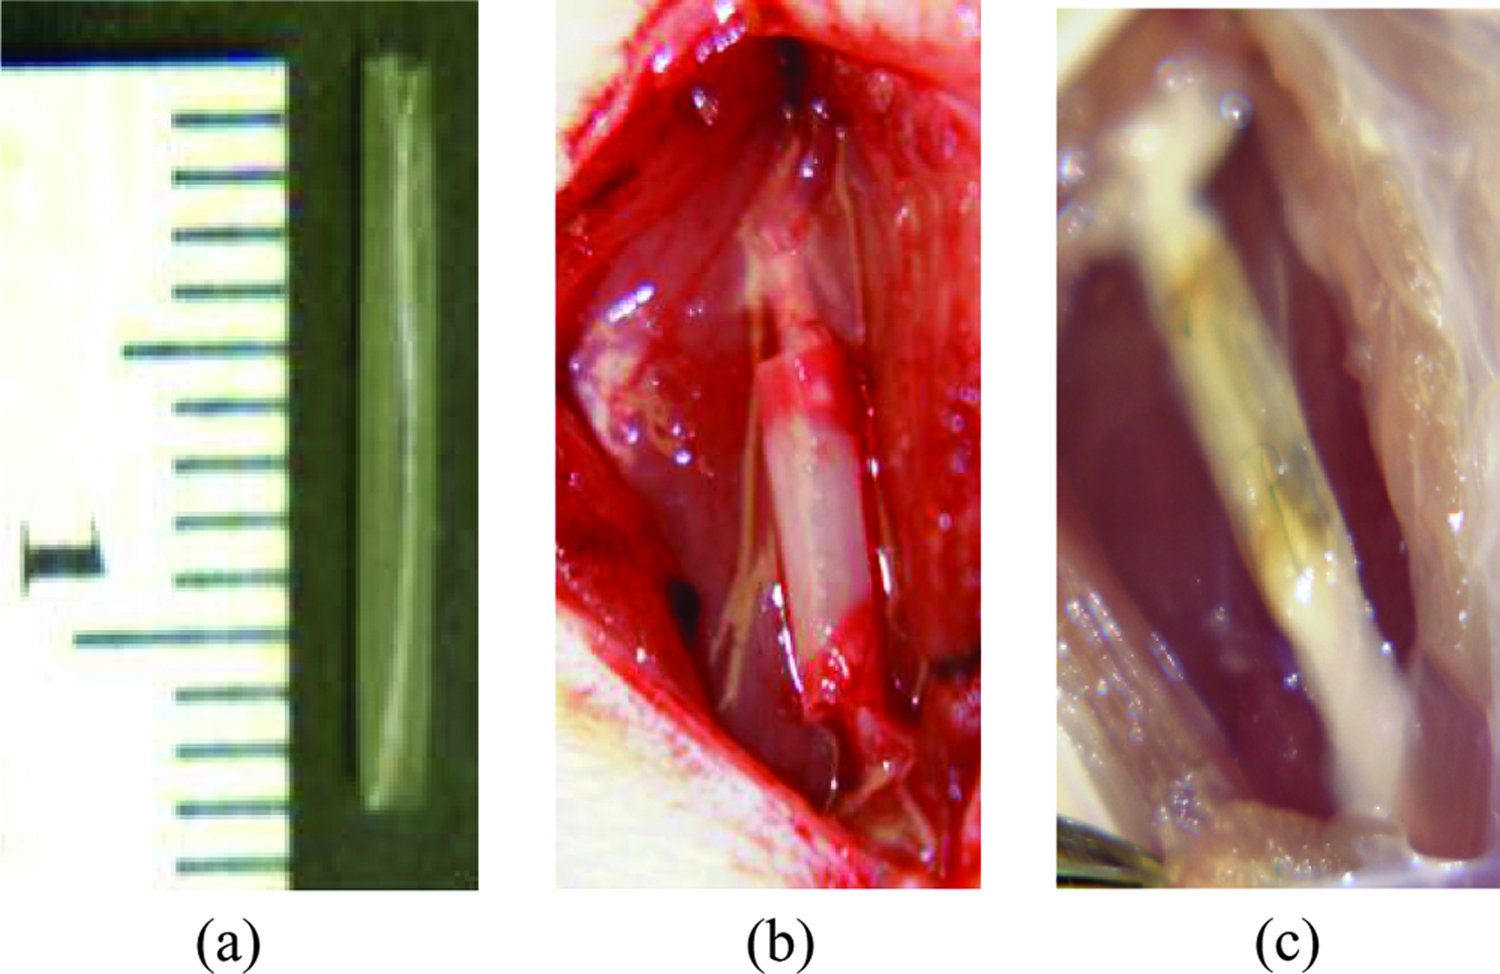
Collagen chitosan nerve guide (
Animals and implantation of nerve guides
Fifty-four female Lewis rats (225–250 g) were equally divided into the CC nerve guide group, the autograft group, and the chitosan (C) nerve guide group. Nine rats were also used for an unrepaired negative control group. During implantation surgery, the left rat sciatic nerve was exposed under anesthesia. A nerve gap was created between the proximal and distal nerve stumps after removing and discarding a 1 cm section. Both transected proximal and distal nerve stumps were inserted into the nerve guide up to a distance of 0.1 cm and secured in place by a single suture (Fig. 1b). For the autograft rats, 1 cm section of the sciatic nerve was removed, reversed, and sutured back in place. In the unrepaired rats, 1 cm of the sciatic nerve was transected, but the gap was not bridged. Implants remained in the animal postoperatively for a period of 6, 9, and 12 weeks until sacrifice. Wayne State University Animal Investigation Committee approved all procedures.
Functional gait analysis
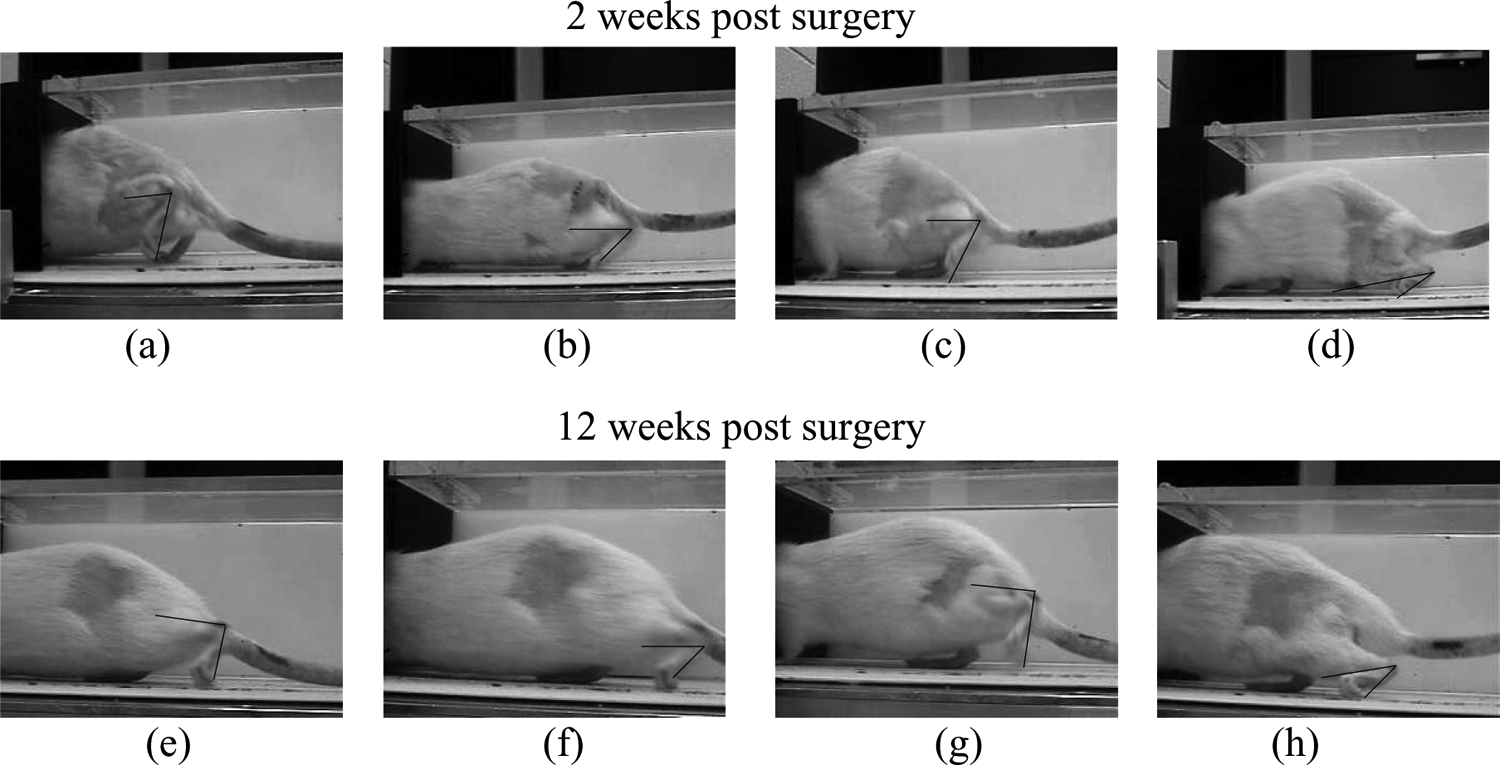
Rat treadmill training prior to surgery was performed according to a previously described protocol. 2 Once the rats were trained to walk on a treadmill, functional recovery of rats was evaluated by using video gait analysis technique. Digital images of rats walking on a treadmill were used to study the angle formed by the knee joint, ankle, and metatarsals. Digital videos were captured both pre- and postsurgery from the left side of the treadmill until steady continuous walking patterns were obtained for each rat. Ulead Video Software (Torrance, CA) was used to transfer the video files to a computer and convert them to single-frame digital images. Each individual frame was further analyzed using the Image analysis software (Image-Pro Plus; Media Cybernetics, San Diego, CA). Ankle angle changes of the rat's hind limb were measured over the nerve regeneration period. Mid stance, terminal stance, and mid swing phase of the rat gait cycle were used to measure the angle (in degrees) formed by the horizontal foot, ankle, and vertical knee. As nerve repair occurs, functional recovery is attained, and angle measurement changes can be observed from preimplant to postsurgery.
Gastrocnemius muscle analysis
Axonal re-innervation of muscle was evaluated by measuring the wet gastrocnemius muscle mass at 6, 9, and 12 weeks postsurgery. Absolute muscle mass was measured from both operated and nonoperated contralateral side.
Sensitivity testing
Sensitivity testing protocol was adapted from Chaplan et al.
22
During von Frey hair sensitivity testing, the rats were placed in plastic cages and allowed to acclimatize for 10 min. Cages were equipped with a wire mesh bottom, which allowed full access to the midplantar hind paw testing area. Both before and after surgery, testing was performed by touching the paw area with a series of six von Frey hairs with logarithmically incremental stiffness (2.0, 4.0, 6.0, 8.0, 10.0, and 15.0 g) (Stoelting, Wood Dale, IL). Each hair was applied to the surface of the paw until buckling was noted, and then held for 6–8 s. Testing was started with the 2.0 g hair and continued in the ascending order. A positive response was noted if the paw was sharply withdrawn. A negative response was recorded if there was no paw withdrawal. Following the occurrence of a positive response, the value of the previous weaker stimulus was assigned to the test. A total of six responses were obtained to determine the 50% withdrawal response. The final count of positive and negative responses were tabulated and scored according to X = withdrawal and 0 = no withdrawal. The 50% withdrawal threshold response was calculated using the below formula:
Statistical analyses
Statistical analyses were conducted using SPSS (SPSS, Chicago, IL). To evaluate differences between or among groups, analysis of variance (ANOVA) was performed with Scheffé post hoc pair-wise testing; when appropriate, an α level of 0.05 was selected for significance for all of the statistical tests.
Results
Functional gait analysis
At 2 weeks postsurgery, for mid stance phase, the autograft (29 ± 6) group had a significantly higher angle measurement compared to C (20 ± 2) and unrepaired (15 ± 3) groups (p < 0.05). For terminal stance phase, the CC (57 ± 23) group was similar to autograft (69 ± 13) and C (47 ± 12) groups, but significantly higher when compared to the unrepaired (26 ± 6) group (p < 0.05). For mid swing phase, the unrepaired (49 ± 13) group was significantly higher when compared to the autograft (20 ± 6), C (30 ± 11), and CC (19 ± 4) groups (p < 0.05) (Table 1).
p < 0.05 when CC and autograft groups compared with C group.
p < 0.05 when autograft group compared with C and unrepaired groups.
p < 0.05 when CC and autograft groups compared with unrepaired group.
p < 0.05 when CC group compared with all groups.
p < 0.05 when CC group compared with C and unrepaired groups.
p < 0.05 when autograft group compared with CC and unrepaired groups.
p < 0.05 when autograft group compared with CC and unrepaired groups.
At 4 weeks postsurgery, for both mid stance and terminal stance phases, CC angle values increased and were significantly higher than all groups (p < 0.05). For mid swing phase, the unrepaired (39 ± 12) and C (32 ± 6) groups were significantly higher when compared to the CC (23 ± 9) and autograft (23 ± 17) groups (p < 0.05) (Table 1).
At 6 weeks postsurgery, for mid stance phase, autograft (32 ± 10) group values increased from the 4th week time point. Thus, they were significantly higher when compared to C (22 ± 8) and unrepaired (21 ± 8) groups (p < 0.05). For terminal stance phase, CC (78 ± 16) group angle values did not significantly decrease and were still higher compared to unrepaired (36 ± 4) and C (42 ± 20) groups (p < 0.05). Similar results were noted for autograft group angle measurements. For mid swing phase, at both 6 and 10 weeks postsurgery, unrepaired group was significantly higher than remaining groups (p < 0.05) (Table 1).
At 8 weeks postsurgery, for both mid and terminal stance angle values, CC group was significantly higher when compared to all groups (p < 0.05). However, during mid swing phase, CC group had the lowest angle measurement (Table 1).
At 10 weeks postsurgery, for mid and terminal stance phases, CC group had an increased angle value compared to remaining groups (Table 1).
At 12 weeks postsurgery, for both mid swing and terminal stance phases, both the CC and autograft groups were significantly higher when compared to C and unrepaired groups (p < 0.05). For mid swing phase, both C (34 ± 4) and unrepaired (35 ± 9) groups were higher than CC (20 ± 5) and autograft (21 ± 7) groups (p < 0.05) (Table 1) (Fig. 2).
Terminal stance phase angle of rat gait cycle at 2 and 12 weeks postsurgery for (
Gastrocnemius muscle analysis
Gastrocnemius muscle mass for CC group at all time points had a higher muscle mass value only when compared to the unrepaired and C groups (p < 0.05). At 6 and 9 weeks postsurgery, the autograft group had the highest muscle mass value and was significantly higher when compared to the unrepaired, C, and CC groups (p < 0.05) (Fig. 3). However, after 12 weeks the autograft group was only significantly higher when compared to the unrepaired and C groups (p < 0.05) (Fig. 3), while both the CC and autograft groups had similar muscle mass values.
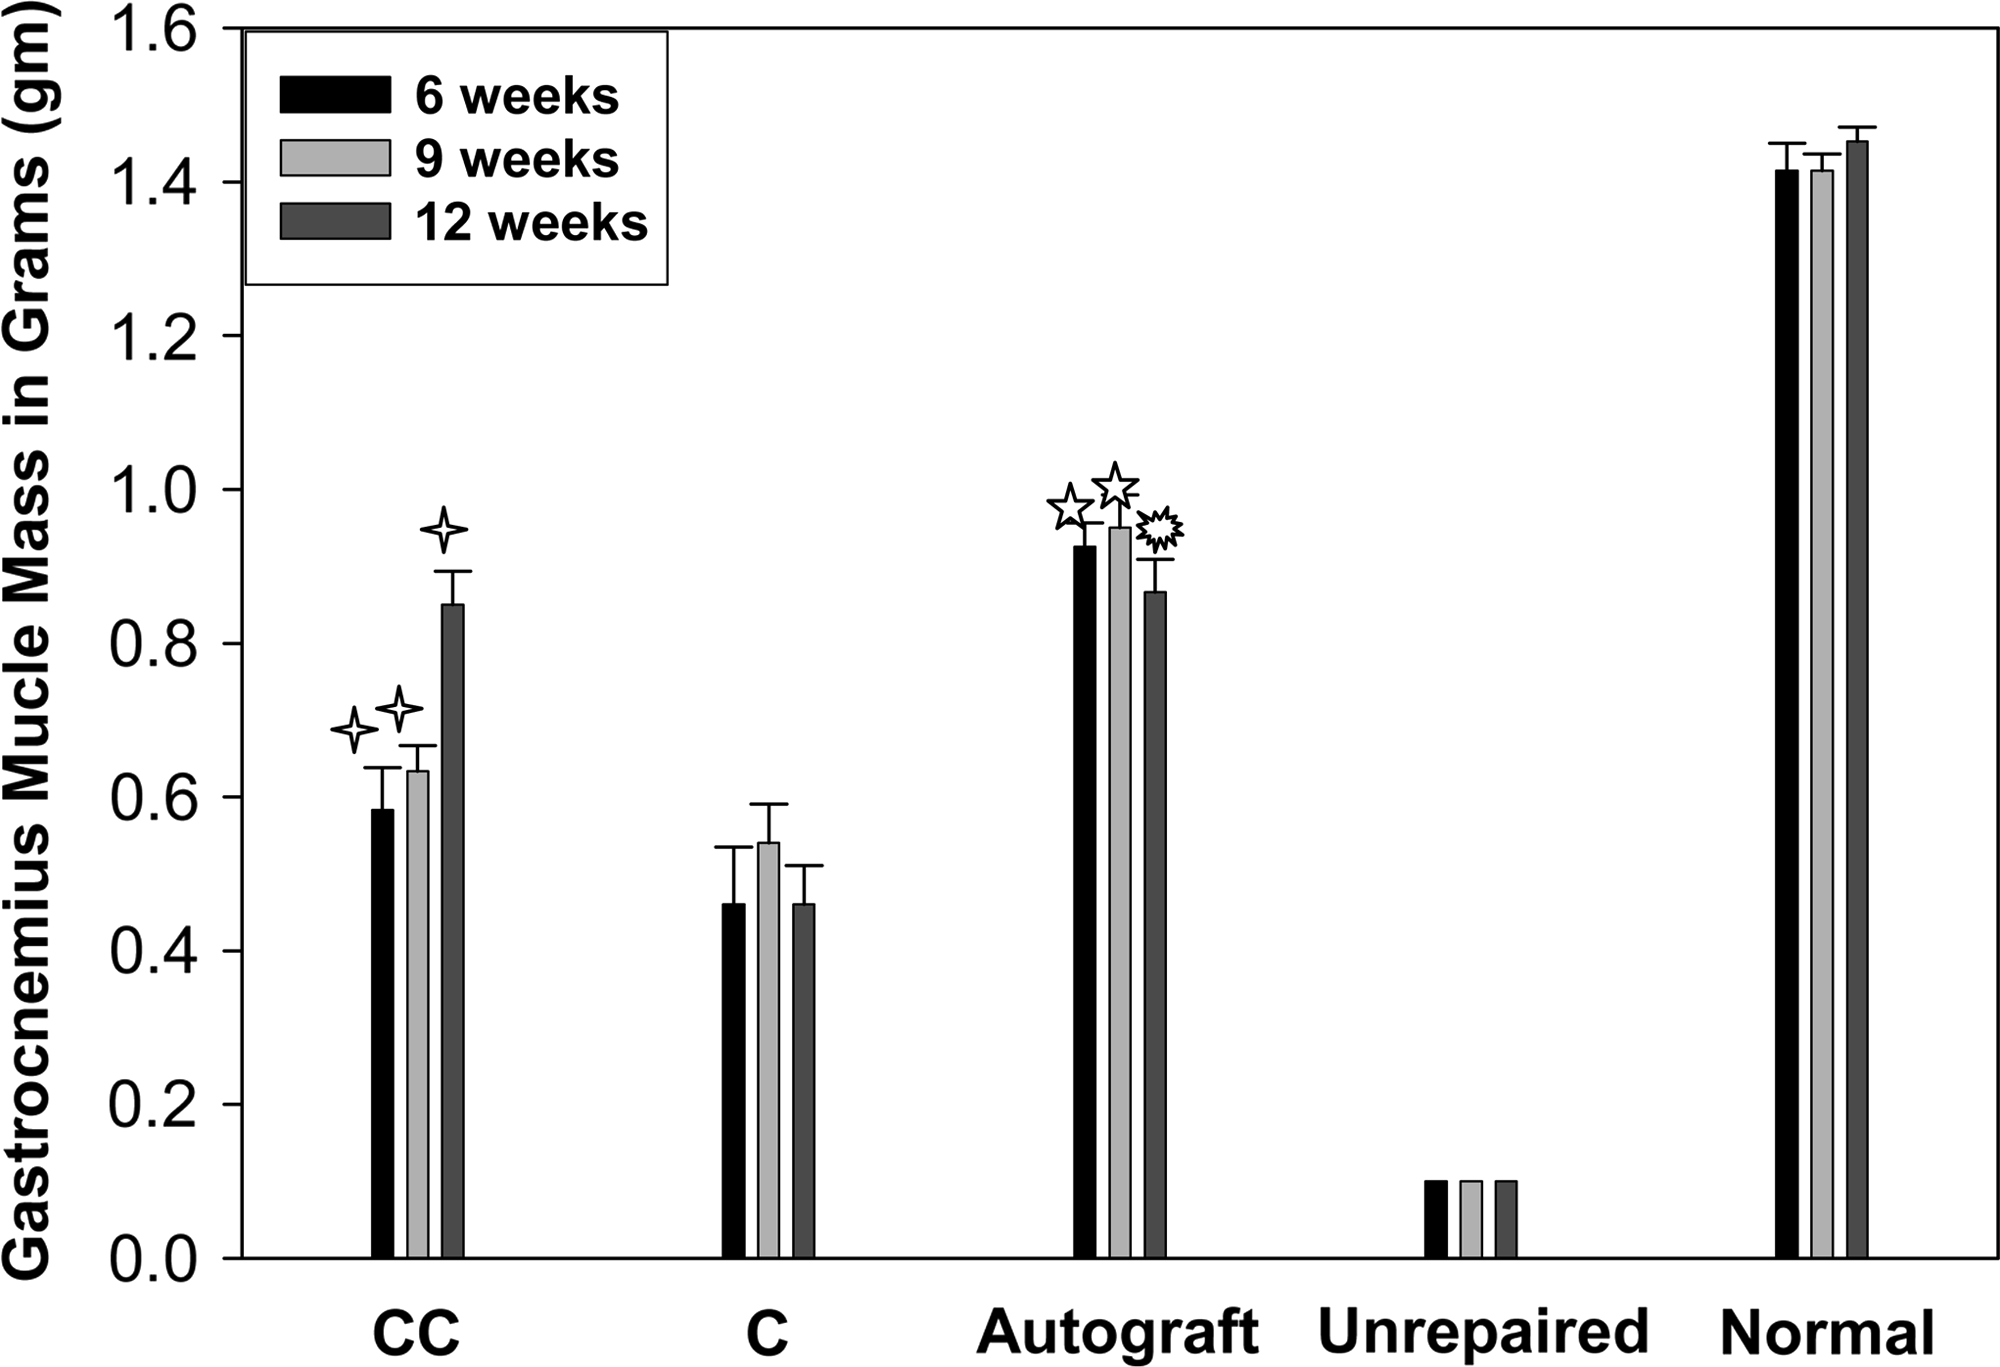
Gastrocnemius muscle wet weights measured for collagen chitosan (CC), chitosan (C), unrepaired, autograft, and normal groups (mean ± SD error) at the 6th, 9th, and 12th week time points. ✧p < 0.05 when CC group compared to unrepaired and C groups, ★p < 0.05 when autograft group compared to remaining groups, and ☼p < 0.05 when autograft group compared to unrepaired and C groups.
Sensitivity testing
Prior to surgery, the left hind paw had a median withdrawal threshold value of 14.2 ± 0.34 g. This indicates the threshold value in normal rats at 0 week time point. At 6 weeks postsurgery, the CC group had a withdrawal threshold value of 13.1 ± 2.3 g. At 9 weeks, a drop in threshold value was seen to 12.3 ± 3.8, after which at the 12th week time point, threshold value increased to 13.7 ± 2.5 (Fig. 4). For the unrepaired group, the median threshold value of 15.0 g remained constant from 6 to 12 weeks. At 6 weeks, C and autograft groups had low median threshold values of 13.4 ± 2.1 and 12.1 ± 2.7 g. For the autograft group at 9 weeks, an increase was seen to 13.6 ± 0.82 g (median value), whereas for the C group a decrease was seen to 12.9 ± 2.2 g. (Fig. 4). At 12 weeks, the autograft group value remained constant at 13.5 ± 1.7 g, whereas the C group value increased to 14.3 ± 2.4 g. Thus, for the CC group at 6, 9, and 12 weeks, no significant difference was seen between groups (Fig. 4).

The mean 50% withdrawal threshold of the left hind paw in grams at 0, 6, 9, and 12 weeks for presurgery, autograft, collagen chitosan (CC), chitosan (C), and unrepaired groups.
Discussion
Collagen has been blended with chitosan in previous studies, but nerve repair with respect to video gait analysis has not been studied. Chamberlain et al. 23 studied functional gait by applying the SFI to compare collagen verses silicone nerve guides. However, they saw no difference between groups and concluded that SFI could not be applied to their study, due to the formation of rat toe contractures. Comparatively, in our study, development of toe contractures did not influence angle measurements during gait analysis, and collagen chitosan group showed a significant difference during both stance and swing phase compared to chitosan (alone) group. During both mid and terminal stance phase, angle value for collagen chitosan group increased gradually over the 12-week period, indicating functional recovery. The transition from postimplantation to recovery is reflected in increasing angle value during stance phase. We hypothesize that as regenerating axons establish functional connections, distal muscle strength increases, which leads to an increase in muscle mass and area. Increased muscle strength allows metatarsals to flex from the ground and maintain the heel in a raised position, yielding an increase in stance angle value. Swing phase angles did not show a difference in values from postimplantation to recovery. Throughout the 12-week period, angle value remained constant and could not be correlated to functional recovery. A limitation in measuring mid swing angles is the ability to mark the exact location of the knee joint, due to the presence of loose skin around the knee and thigh area. Previous studies have indicated that during mid swing phase the limb is held in the air, and increased movement of skin instead of bone was noted. 24 Studies have shown to have an increased swing phase angle value postinjury, which reduces over time and serves to indicate functional recovery. However, in our study, the angle value was low from the initial time point and remained low throughout the entire study period for collagen chitosan group. A related study comparing swing phase angle with myelinated axon counts found no correlation between swing phase angle scoring and increase in myelinated nerve fibers. 25 As a result, we concluded that stance phase angle measurements were more accurate for correlating functional nerve recovery with angle measurements.
Previously, von Frey hair testing method has been applied to quantify neuropathic pain in a complete sciatic nerve transection model. 26 Threshold values were obtained at 1 and 3 days and weekly until 9 weeks. In this model, a significant decrease in threshold value was noted after day 1. This value remained constant at 18.73 ± 1.97 until the final (9th week) time point. Similar results were noted in our study for unrepaired group, where threshold value remained constant at 15 g throughout the 12-week period. An increase in threshold value indicates increased resistance to applied force, leading to decreased sensitivity. After 12 weeks, unrepaired group was unable to lift its foot to applied stimuli, thus displaying decrease in sensory nerve regeneration resulting in lowered sensitivity. We are not aware of previous studies evaluating repair of sciatic transection with nerve guides using the von Frey testing method, except for a previous study by our group evaluating glial-derived nerve growth factor–blended chitosan nerve guides. 1 In our current study, for chitosan nerve guide group, decreased sensory nerve regeneration was observed, since threshold value significantly increased from 6th to 12th week. This was correlated with low muscle mass values for both groups, apparently due to decrease in axonal muscle re-innervations. It should be noted that even if these animals felt any stimulus, due to low muscle strength they may be unable to lift their foot in response. The autograft and collagen chitosan nerve guide groups had similar lower threshold value at 12 weeks. Both groups were able to lift their foot in response to stimulus, displaying decreased resistance to applied force and increased sensitivity. Both groups thus exhibited successful axonal connections leading to an increase in sensory nerve regeneration. This in turn leads to an increase in axon muscle re-innervation and a subsequent increase in overall muscle mass. A previous study by our group has evaluated these collagen chitosan nerve guides histologically and measured significant increase in axon diameter and area. 18 Thus, this correlates with an increase in muscle mass, leading to an increase in functional strength. Collagen tubules have been shown to promote better sensory nerve over motor nerve recovery. 27 Moreover, collagen-blended chitosan matrices have also been shown to enhance cellular attachment and growth compared to unblended chitosan matrices.28,29 Therefore, we can conclude that collagen chitosan–blended nerve guides were successful in enhancing motor and sensory nerve recovery, and may represent an alternative biomaterial when compared to unblended chitosan nerve guides.
Footnotes
Acknowledgments
This study was funded by a grant from the Department of Orthopedic Surgery, Funds for Medical Research, Wayne State University, Detroit, MI. We would also like to acknowledge Drs. Joshua E. Adler and Anne M. Skoff for their sensitivity testing expertise.