
Abstract
Effective cell seeding throughout the tissue scaffold often determines the success of tissue-engineering products, although most current methods focus on determining the total number, not the distribution, of the cells associated with tissue-engineering constructs. The purpose of this investigation was to establish a quick, convenient, and efficient method to quantify cell survival, distribution, and infiltration into degradable scaffolds using a combination of fluorescence cell staining and cryosectioning techniques. After cell seeding and culture for different periods of time, seeded scaffolds were stained with a live cell dye and then cryosectioned. Cryosectioned scaffolds were then recompiled into a three-dimensional (3D) image to visualize cell behavior after seeding. To test the effectiveness of this imaging method, four common seeding methods, including static surface seeding, cell injection, orbital shaker seeding, and centrifuge seeding, were investigated for their seeding efficacy. Using this new method, we were able to visualize the benefits and drawbacks of each seeding method with regard to the cell behavior in 3D within the scaffolds. This method is likely to provide useful information to assist the development of novel materials or cell-seeding methods for producing full-thickness tissue grafts.
Introduction
Much prior research has relied on different seeding methods to improve seeding efficiency and distribution in scaffold.9–11 These methods can be simply divided into two approaches: static and dynamic seeding techniques.12,13 The most common static seeding techniques include surface seeding14,15 and direct injection16,17 into the scaffold. Dynamic seeding methods, involving movement of the cell solution through and around the scaffold, have been shown to provide better cell coverage and subsequent growth than static seeding.12,13 Also, even cell distribution, leading to cell growth on the surface and the interior of the scaffold, may limit the formation of a necrotic core inside the scaffold.8,18
The most common approach to assess cell seeding in tissue-engineering constructs is by quantification of total cell numbers.19–21 Cell quantification can be performed using many different methods, including trypsinizing adhered cells and counting,22–24 3-(4,5-dimethylthiazol-2-yl)-2,5-diphenyltetrazolium bromide (MTT) or 3-(4,5-dimethylthiazol-2-yl)-5-(3-carboxymethoxyphenyl)-2-(4-sulfophenyl)-2H-tetrazolium (MTS) assay,23–25 and DNA assay of cell lysates.24,26,27 Unfortunately, none of these methods can provide critical information about the degree of cell distribution and infiltration throughout tissue scaffolds.28,29
The morphology of the adherent cells on the surfaces of tissue-engineering constructs can be observed using scanning electron microscopy23,24 and confocal fluorescent microscopy after labeling adherent live cells. 27 Transmission electron microscopy has been used to observe detailed cellular–scaffold information. 30 However, it would be difficult to translate such high-resolution images into reliable cell-distribution results. Because of the light reflection, opacity, or both of the tissue-engineering constructs, microscopic visualization of viable and apoptotic or necrotic cells without disruption of the scaffold structure is limited to the surface layers of the scaffold. In addition, the visual depth of the confocal microscope is often limited to less than 500 μm depending on the material.31,32 As a result, new methods are needed to analyze the behavior of cells at much deeper depths in the scaffold construct. Some recent approaches to quantify cell distribution in tissue-engineered scaffolds include micro-computed tomography and magnetic resonance imaging of magnetic iron oxide nanoparticles entrapped in seeded cells.33,34 Although these and other studies have investigated the distribution of cells within constructs, the need still exists for a quick and economical method that allows visualization of the three-dimensional (3D) distribution of cells while also allowing quantification of distribution and infiltration in the scaffold.
Using a combination of fluorescence cell staining, cryosectioning, and 3D image compilation, a novel method has been established to quantitatively evaluate cell-seeding efficiency, survival, distribution, and long-term infiltration into PLGA salt-leached scaffolds. Using this technique, we investigated dynamic and static cell seeding methods with PLGA salt-leached scaffolds to monitor the short-term and long-term distribution and infiltration of cells into the polymeric construct. Briefly, after culture, the scaffolds were stained for live cells, fixed, and sectioned, after which all of the individual scaffold sections were imaged for live cell fluorescence and and the images compiled to form a 3D rendering of the living cells in the scaffold. The densities and distributions of cells within the individual sections were then analyzed. Our results have shown that a limited amount of cells infiltrate and that low cell densities exist with increasing depth into the center of the scaffold. This is in agreement with previous observations/assumptions.
Methods
PLGA salt-leached scaffold fabrication
All chemicals were purchased from Sigma-Aldrich (St. Louis, MO) unless otherwise specified. PLGA salt-leached scaffolds were fabricated following established procedure. 35 Briefly, PLGA (75:25, 113kDa, Medisorb Inc., Birmingham, AL) was dissolved in chloroform at 10% (w/v). The PLGA polymer solution was then added evenly over a Petri dish. Sodium chloride (porogen weight fraction of 90%, sieved at 150–250 μm) was then spread evenly on PLGA solution with continuous stirring in a fume hood until the solvent–polymer solution became pasty. After 72 h, the scaffold was placed under vacuum to complete solvent evaporation overnight. For the salt-leaching process, all scaffolds were submersed in distilled water and placed on an orbital shaker at 100 rpm. The water was changed every 30 min at room temperature until chlorides could not be detected by addition of 0.1 M silver nitrate. 36 After salt leaching, the scaffolds (3-4 mm thick) were dried and cut into circular pieces 5 mm in diameter. The scaffolds were then sterilized by submersion in 70% ethanol. After 24 h, the ethanol was exchanged by submerging the scaffolds in phosphate buffered saline (PBS) and orbital shaking three times for 5 to 10 min. The scaffold was then incubated with protein free Dulbecco's modified Eagle medium (DMEM) for 24 h.
Scaffold characterization
Before cell seeding, scanning electron microscopy (SEM) was used to observe the cross-sectional morphology of the 3D PLGA scaffolds. The scaffolds were freeze fractured to expose the cross-section. Briefly, the scaffolds were immersed in liquid nitrogen and then cut using a sharp blade along their cross-sections. The scaffold specimens were sputter coated with silver before observation using a Hitachi S3000N scanning electron microscope (Hitachi High Tech Inc., Tokyo, Japan). The pore sizes were calculated from SEM images using the Image J program (Public Domain Image Processing Program, National Institutes of Health, Bethesda, MD).
Cell culture and scaffold seeding
Mouse 3T3-Swiss albino fibroblasts were obtained from ATCC (CCL-92, Manassas, VA). The cells were cultured in DMEM containing 10% fetal bovine serum (Atlanta Biologicals, Lawrenceville, GA) and 1% antibiotic solution (100 U/mL penicillin, 100μg/mL streptomycin, Atlanta Biologicals), henceforth referred to as complete DMEM. After expansion for four passages, the cells were detached for the cell-seeding experiments. To determine cell-seeding efficiency on unmodified PLGA salt-leached scaffolds, four common seeding methods (static surface seeding, cell suspension injection, cell seeding with an orbital shaker, and cell seeding using a centrifuge) were investigated. A cell density of 1 × 10⁶ cells/scaffold was used for all methods. Static surface seeding was performed as described in many previous works.37–39 Briefly, a concentrated cell solution (100 μL) containing complete DMEM was evenly added on top of the scaffold. The scaffold was allowed to incubate for 3 h, which is the time required for cell attachment, as observed in control wells. At the end of incubation, the scaffold was submersed in complete DMEM. Cell suspension injection was performed by injecting a concentrated cell solution (1 × 10⁶ cells/10 μL) into the center of the scaffold using a 25-gauge needle, as described in other reports.16,17 Cell seeding with the use of an orbital shaker was performed similar to previous reports.40,41 Scaffolds were incubated with the cell solution (in complete medium containing 1 × 10⁶ cells/3 mL per scaffold) in a 50-mL tube that was placed on an orbital shaker for 1 h at room temperature. After orbital shaking, the scaffold was returned to a well plate and submersed in complete medium. Centrifuge seeding was accomplished as described previously. 42 The scaffold was mixed with a cell solution containing complete medium (1 × 10⁶ cells/5 mL) in a 50-mL tube. The tube was then centrifuged at 2000 rpm at room temperature for 1 min. The process was performed three times, with re-suspension of the test tube–bound cells after each centrifuge cycle. The scaffold was then returned to a well plate with complete culture medium.
MTS assay
To determine cell-seeding efficacy, cell numbers on some seeded scaffolds were determined after 6 h of incubation using an MTS assay (Aqueous One Cell Proliferation Assay, Promega, Madison, WI). Cells in 2D culture seeded with equivalent numbers were used as total cell number controls. The cell-seeded scaffolds and controls (cells seeded on culture plates) (n = 3 for all groups) were thoroughly rinsed in PBS and then submersed in 20 μL of MTS solution with 200 μL of fresh medium. For the subtraction of medium background, three wells were filled with 200 μL of medium and 20 μL of MTS only. The samples were then incubated for 2.5 h to begin the formation of the soluble formazan product. The optical density (OD) of the formed product was then analyzed using a microplate reader (SpectraMAX 340, Molecular Devices, Sunnyvale, CA) at 490 nm with background subtraction at 630 nm. The average medium background was then subtracted from the OD. The OD of the formazan product produced by the scaffolds was compared with that of control cultures seeded with numbers equivalent to the scaffold seeding density to determine percentage of cell-seeding efficiency following manufacture recommended procedures.
To determine the long-term effects of the cell-seeding method, similar experiments were conducted with a 7-day culture time. To avoid cell migration from tissue culture plate to scaffold, the scaffolds were moved into a new well plate after 3 days of culture. The medium was refreshed every third day until the 7-day time point was reached. At this point an MTS assay was performed to determine total cell numbers for each scaffold, as described above.
Fixable live cell staining and scaffold sectioning
To observe the effects of seeding method on cell viability, scaffolds were stained using a Live/Dead Cytotoxicity/Viability kit (Invitrogen, Carlsbad, CA) 3 h after seeding and imaged on the top and bottom surfaces. The numbers of live and dead cells, expressing green and red fluorescence, respectively, were counted. Live and dead cell percentages were determined based on the cell counts as described in the manufacturer's instructions. Three scaffolds for each seeding method were cryosectioned and stained for live cells using a modification of the manufacturer's protocol. Stock solutions were prepared for carboxylfluorescein diacetate, succinimidyl ester (CFDA-SE) (5 mM in dimethylsulfoxide, Invitrogen). At the end of the experiments, scaffolds were rinsed and then submersed in 3 mL of PBS. CFDA-SE (final concentration 2.5 μM) was then added to the PBS and incubated for 15 min to label live cells green (emission at 517 nm) by labeling intracellular esterase as recommended by the manufacturer. After verification of live cells using a fluorescent microscope, the scaffolds were rinsed in PBS and then fixed in methanol for 10 min. After multiple rinses in PBS, the scaffolds were frozen and embedded in OCT and then sectioned using a cryostat (CM 1850 Leica Microsystems, Bannockburn, IL) at 20 μm. The scaffold sections were then used in image analyses.
Image compilation and data analysis
The stained scaffold sections were imaged using a Leica DMLP microscope equipped with a Nikon E500 camera (8.4V, 0.9A, Nikon Corp., Japan). The optimal camera exposure settings and microscope settings were fixed and remained the same for all scaffold groups and time points. Two-dimensional images of each section were then taken using a 4× objective. The scaffolds were cut to a specific diameter (5 mm) and thickness (3-4 mm) so as to fit in the visible area of the 4× objective as determined using hemacytometer measurements of the visible area. For imaging scaffold sections, the oval scaffold sections were centered in the 4× visible area, and a centering mark on the Nikon E500 camera image output was verified before imaging.
The 2D cross-sections of the scaffold were built into 3D images using the following protocol. To eliminate any edge effects and to focus on cell behavior in the bulk of the scaffold, the edge exterior sections were removed from the image sets. The sections of the scaffold were loaded and then stacked using ImageJ. 43 To visualize cell distribution in the center of the scaffold, the low-surface-area cross-sections on the ends of the scaffold were removed from the stack. Approximately 100 sections at 20 μm per section were compiled for each scaffold, representing the bulk of the scaffold. The pre-aligned image sections were then stacked and recompiled using the Volume Builder plug-in. The optimal Volume Builder plug-in settings were determined in pilot experiments and remained fixed throughout the experiments. The image was then converted to 16-bit and thresholded to remove any background fluorescence. The threshold values were then set for the duration of the scaffold sections. The particle counter settings were adjusted to account for only a specified range consistent with 3T3 cell sizes determined by measuring the maximum pixilated area of individual cells on the scaffold sections. The circularity was left at default value to account for spherical and oval-shaped areas. Each scaffold section was then scanned using the particle counter. Data for total particle number were acquired for each section and compared with physical cell counts to verify correct program settings. Using these settings, cell density counts were taken for each scaffold section for all four methods after 7 days.
Two methods were used to assess the location of cells within the sections. Emphasis was placed on analyzing the vertical penetration of cells into the scaffold. First, the stacked scaffold sections were organized into five vertical zones of equivalent dimensions measuring 650 μm horizontally across the cross-sections and 1000 μm vertically on the sections. The process was repeated for each replicate scaffold of the same seeding method (n = 3). Each zone was then individually scanned using the particle counter to determine the number of cells occupying the particular zone. Total cell values were expressed as cell density based on the zone area. The process was repeated for each zone and the zones compared to assess vertical cell density through the vertical depth of the scaffold. The sections were then scanned for live cells with recording of the vertical distance of each cell from the scaffold top surfaces. The values for each scaffold and seeding method were then collected and expressed as a percentage of the total penetration distance to the center of the scaffold. A flowchart depicting image compilation and data analysis is shown in Figure 1.

Flowchart of three-dimensional (3D) cell distribution and infiltration analyses. After culture, the live cells were fluorescent stained and the scaffold cryosectioned. Aligned sections were then compiled and stacked. These stacked images were then rendered into a 3D object depicting the distribution of cells throughout the scaffold. Finally, the stacked images were analyzed for cell horizontal distribution in the x-y plan and cell vertical penetration through the scaffold in the z-plane. Color images available online at
Statistical analyses
One-way analysis of variance (ANOVA) was used to compare groups (p < 0.05). Afterward, Student t-tests were used to compare each method, with surface seeding assigned as control with Bonferroni adjustment (p < 0.05).
Results
Scaffold morphology
SEM images of the PLGA scaffold surface and cross-sections were collected at different magnifications (Fig. 2A, B). The scaffolds exhibited well-defined, interconnected pore structures. Pore sizes were measured using ImageJ from 10 different cross-sectional SEM micrographs representing different regions of the scaffold. The dimensions of more than 30 pores were measured and averaged to obtain a mean pore size of 212.87 ± 35.9 μm. This was in good agreement with the 150- to 250-μm range of salt sizes used to fabricate these scaffolds.
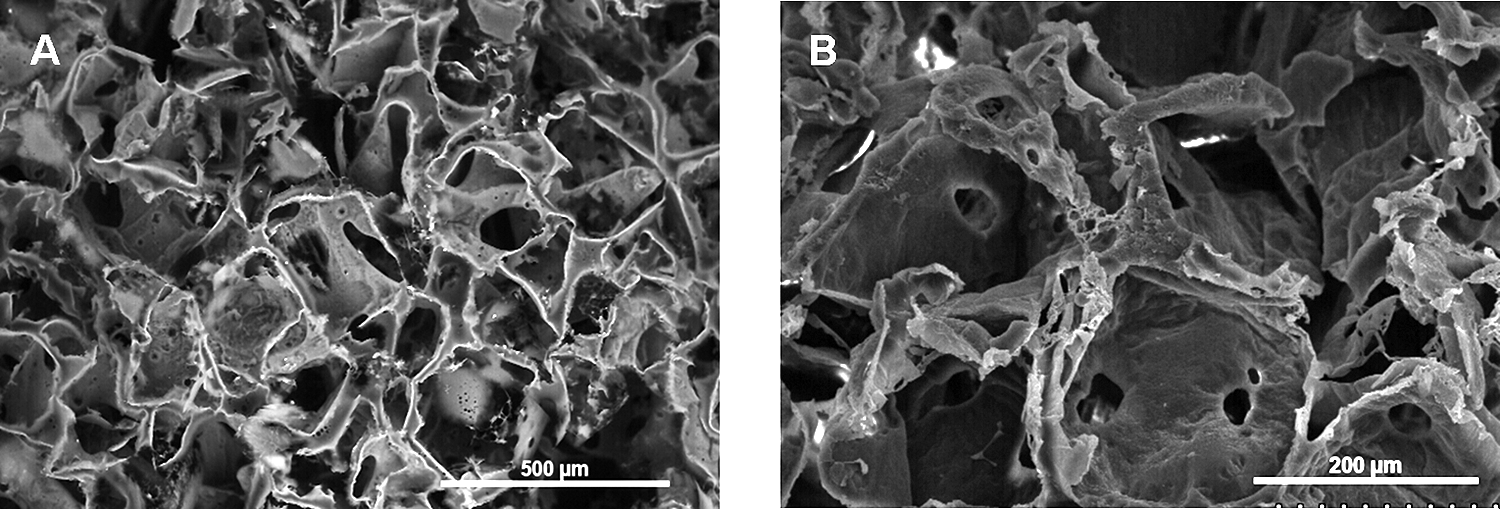
Scanning electron micrographs of the cross section of poly(lactide-co-glycolide) (scaffolds prepared by salt leaching at different magnifications. (
Conventional evaluation of scaffold seeding
Scaffolds were seeded using four different methods with the same seeding density (1 × 10⁶ cells/scaffold), and initial cell seeding efficiency was determined using MTS assay 6 h after seeding. Surface seeding, orbital seeding, and centrifuge seeding all had respectable efficiencies (62%, 55%, and 52%, respectively, Fig. 3A). Although the seeding efficiency of injection seeding was 39%, the differences between various cell-seeding methods were not statistically significant. Cell numbers on the scaffolds were also determined at 1 week (Fig. 3A). Overall, despite minor differences in early cell-seeding efficiencies, cell-seeding methods had insignificant influences on cell growth in all scaffolds based on the assay.

Effect of seeding methods on cell accumulation in scaffolds. (
To determine the effects of seeding method on cell viability, the scaffolds were also stained for live and dead cells (Fig. 3B). Cells seeded on well plates were used as controls and represent 100% viability. The seeding methods affected the survival of seeded cells. Specifically, scaffolds seeded using surface, injection, and orbital seeding methods resulted in approximately 25% cell death 3 h after seeding. Rather unexpectedly, the centrifuge seeding method led to the greatest reduction in viability, with an average cell death of more than 50% (Fig. 3B). Representative images used to determine live and dead cell percentages are presented in (Fig. 4).

Image of live and dead cells on scaffolds using different cell seeding methods. Areas depicted are those of the densest regions for each seeding method. (
3D cell organization and central distribution in scaffolds
Surface seeding method
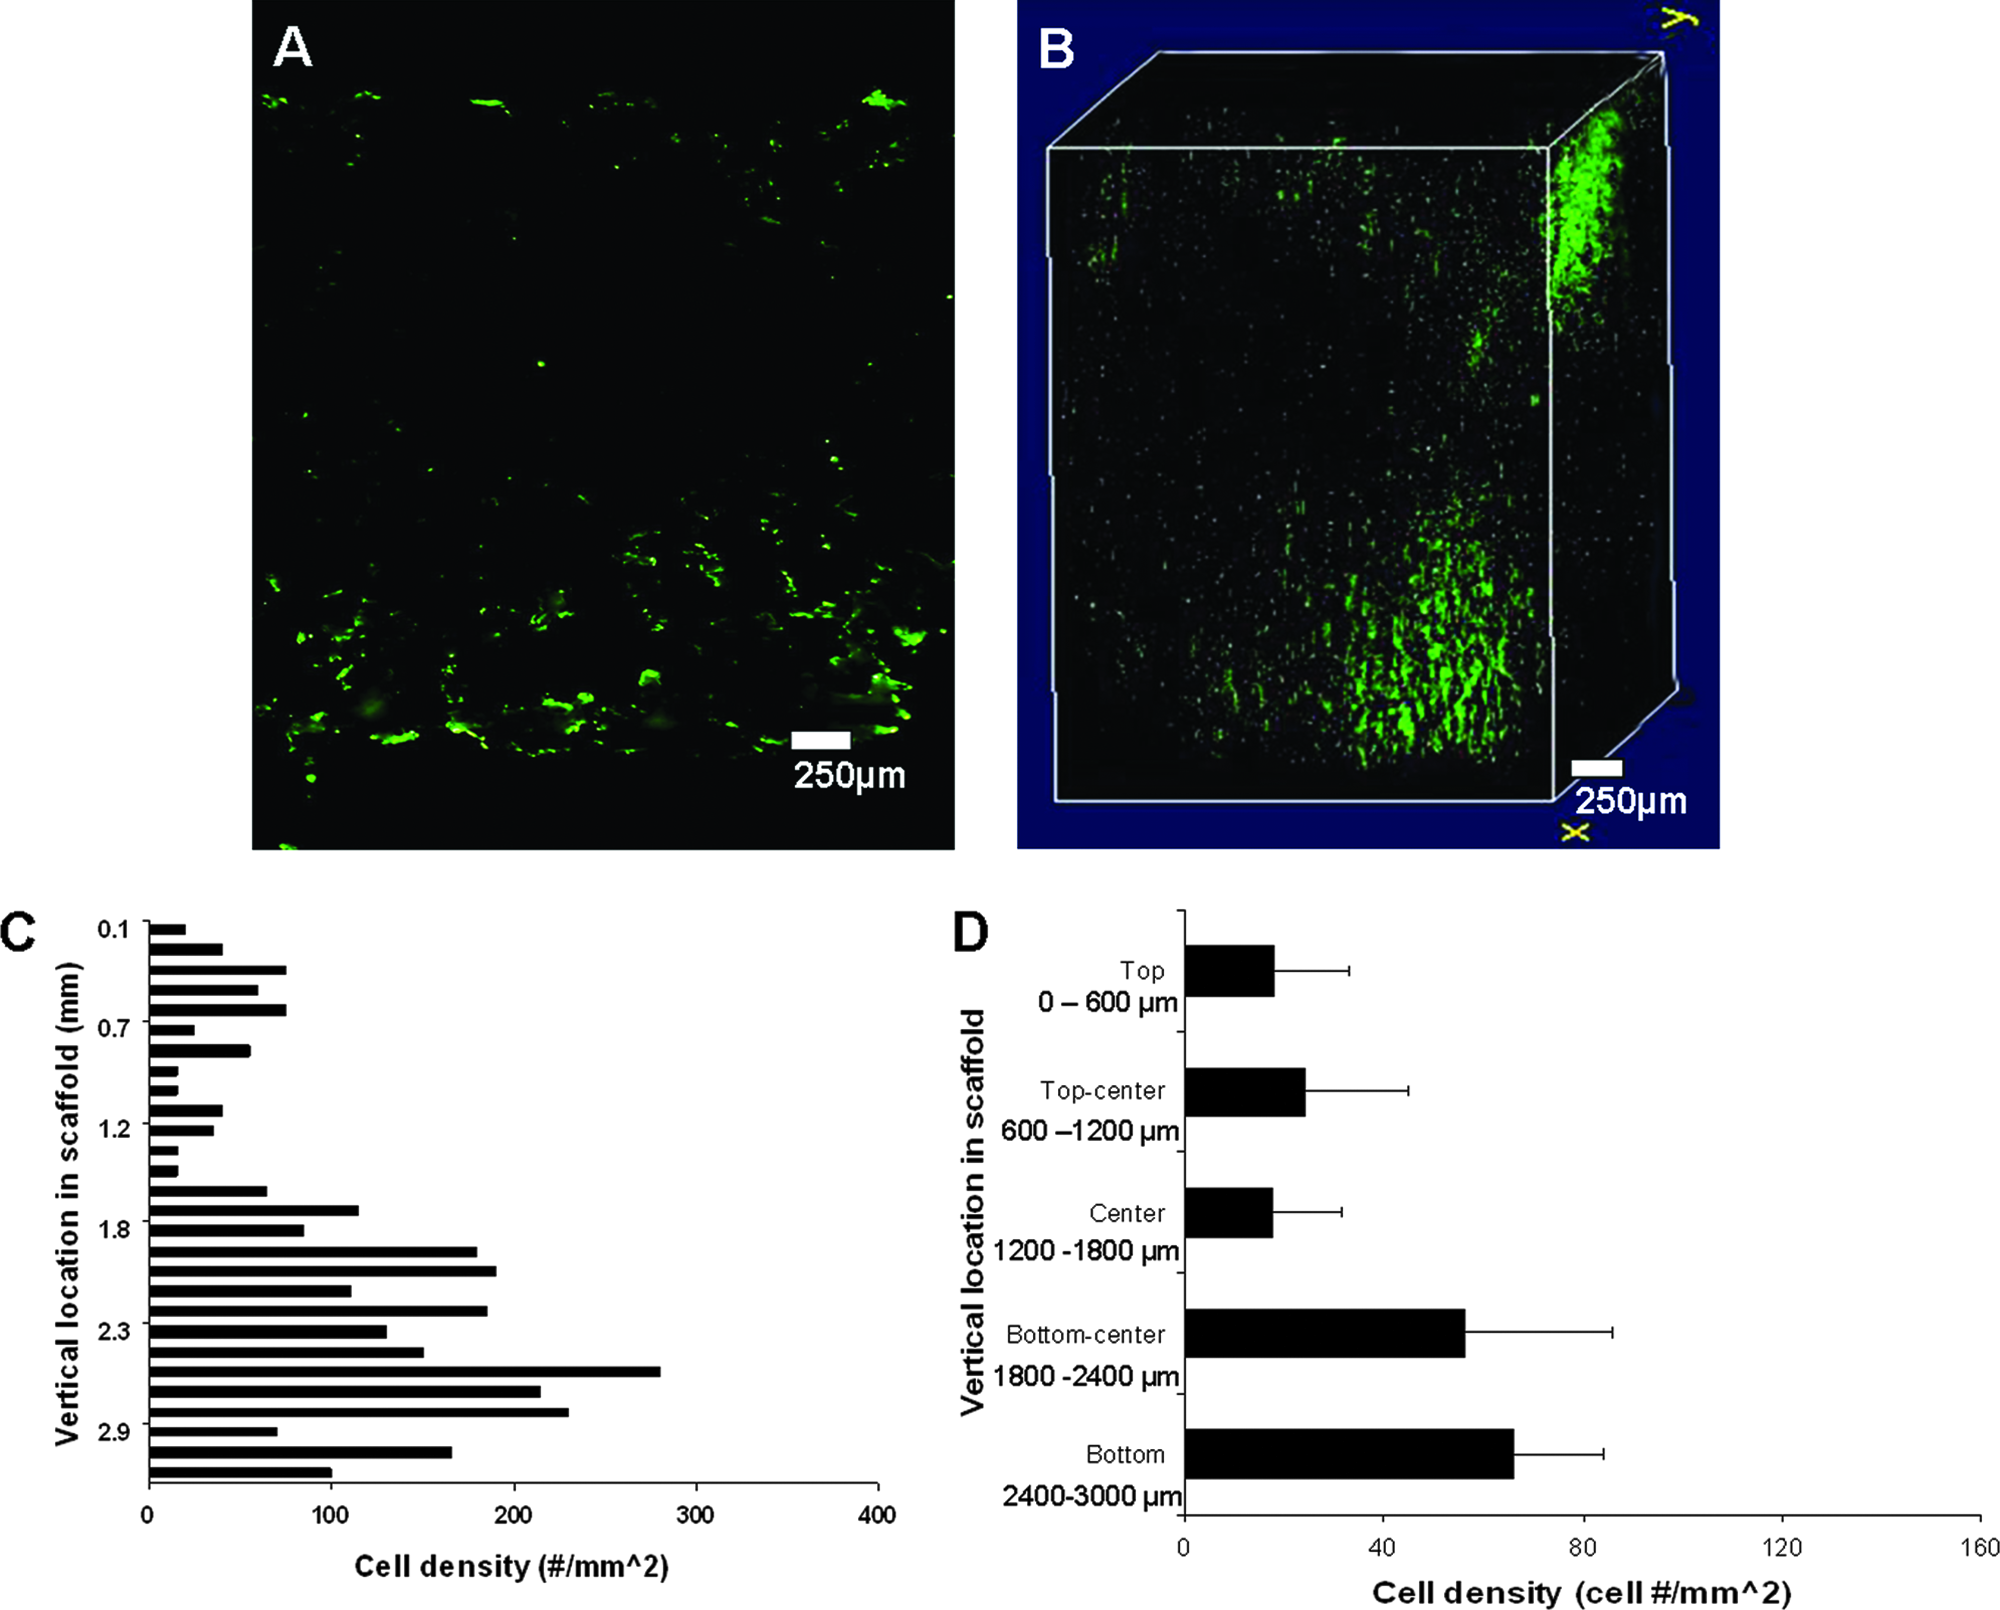
To visualize cell distribution in the center of the scaffold, a section representing the exact middle of the scaffold (top, through the center, to the bottom) was imaged (Fig. 5A). We find a dense layer of cells on the top of scaffold and, to a lesser extent, on the bottom of the scaffold. As expected, few cells were found in the center of the scaffold. Next, we compared this central distribution with a 3D compiled live cell image (Fig. 5B). From this merged image, we observed a thick and spread-out distribution of cells along the upper (seeded side) surface of the scaffold. In the center, a large void space was observed, whereas the bottom (non-seeded side) had a sporadic distribution of cells, with a density lower than observed on the seeded side. Finally, the vertical distribution through the center was determined (Fig. 5C). Consistent with the 3D images, we detected a high cell density (120 cells/mm2) in the surface (top) layer where the cells were seeded (Fig. 5D). This density diminished toward the center of the scaffold (18 cells/mm2) and rose slightly at the bottom edge (65 cells/mm2).

Cell images and distribution of surface seeded scaffolds. (
Injection seeding method
For injection seeding, we observed a dense cell presence along the bottom of the scaffold, with a few cells located near the central region (Fig. 6A). The 3D image showed a dense collection of cells in an isolated area on the top right corner of the scaffold which coincided with the needle entry point into the scaffold. The center portion of the 3D image showed another collection of cells slightly shifted from the scaffold center, with a dense pocket of cells close to the bottom portion of the scaffold that corresponded to the area below the injection site (Fig. 6B). Vertical distribution (Fig. 6C) showed a minimal cell presence in the upper layers through the center, with cell density never exceeding 20 cell/mm2 (Fig. 6D). However, the cell density increased in lower half of the scaffold, rising to 50 cells/mm2 and finally to 70 cells/mm2 in the bottom layer.
Cell images and distribution of injection seeded scaffold. (
Centrifuge seeding method
In contrast to the static seeding methods investigated, the centrifuge seeding method distributed cells evenly throughout the scaffold, although at a low density, as evident in the 2D center image (Fig. 7A). The 3D image shows that most of the cells were present in the left side of the scaffold, which corresponds to the bottom of the scaffold as oriented in the centrifuge tubes after seeding (Fig. 7B). A different vertical cell distribution trend was observed with dynamic seeding (Fig. 7C). For centrifuge seeding, the upper exterior surface showed a low cell density of 25 cells/mm2 (Fig. 7D). However, the cell density inside the scaffold was more than twice that, ranging from 55 to 70 cells/mm2 through the center zones. The lower surface density remained moderate, with slightly more than 40 cells/mm2.

Cell images and distribution of centrifuge-seeded scaffold. (
Orbital seeding method
The central 2D section of orbital-seeded scaffolds showed a dense cell presence throughout the entire section (Fig. 8A). Upon merging the sections into a 3D image, we observed that orbital seeding evenly distributed the cells throughout the bulk of the section in large numbers (Fig. 8B). For orbital seeding, all zones had an appreciable cell density (Fig. 8C), with no layer less than 40 cells/mm2 (Fig. 8D). The interior of the scaffold showed enhanced cell penetration, with cell density values greater than 80 cells/mm2 for these zones. The cell density decreased slightly on the bottom surface of the scaffold, with a density of just over 70 cells/mm2.

Cell images and distribution of orbital seeded scaffolds. (
Comparison of cell distribution between the seeding methods
Finally, we compared the central cell density and cell infiltration of all of the seeding methods tested to compare the distribution of cells within the construct after 7 days of incubation. Differing levels of cell in-growth were seen for each method (Fig. 9). ANOVA testing of all groups revealed that there was a significant difference (p < 0.01) for the groups. Surface seeding led to the highest cell density on the top layer. However, as we descended through the scaffold center to the bottom, orbital seeding appeared to achieve the highest cell density through the construct. For all layers analyzed below the surface layer, orbital seeding attained the highest cell density average for each layer. All other methods tested showed variability in cell density in these layers, with only the bottom layer showing little difference between the seeding methods.

Comparison of cell vertical distribution with all seeding methods. The upper surface showed the highest cell density for surface seeding, as expected. As depth decreased, the density of surface seeding diminished, as centrifuge and orbital seeding rose to values significantly higher than static seeding methods in the center of the scaffold. The cell density values for all methods were similar with increasing depth to the bottom. Vertical lines denote ± 1 standard deviation (n = 3 in all cases), *p < 0.05 versus surface-seeded scaffolds.
The infiltration distance in both vertical directions toward the center was quantified as a measure of the ability of each seeding method to influence cell penetration. The average vertical cell location was determined for each scaffold for each seeding method (n = 3) as a representation of the average vertical cell location in the scaffold (Fig. 10). The upper surface, representing the seeded side of the scaffold for surface seeding, showed minimal penetration of the cells toward the center, with penetration slightly greater than 25% at 1 week. Minimal penetration was observed from the scaffold bottom toward the center, with infiltration less than 25% toward the center of the scaffold. For injection seeding, where cells were dense, cell solution was introduced into the center of the scaffold, and infiltration was slightly higher from both directions, with both values slightly greater than 40% depth from the exterior surfaces. Centrifuge seeding led to a location similar to surface seeding for the upper portion of the scaffold, at slightly greater than 25%, similar to the location for the bottom portion, also approximately 25%. However, the average vertical location of orbital seeded cells was higher than with other methods for the upper portion of the scaffold: greater than 50% of the distance from the exterior surface to the center of the scaffold. Location in the lower portion of the scaffold was approximately 40% of the distance.

Average vertical cell location in scaffolds using different seeding methods. The top graph shows the average cell location for all seeding methods in terms of percentage distance toward the center of the scaffold. Similar values are observed for surface, injection, and centrifuge seeding, whereas the orbital seeding value was nearly twice as far into the scaffold. The bottom graph shows the average cell location as percentage distance from the bottom exterior surface toward the center of the scaffold. Most of the cells in surface-seeded scaffolds resided close to the bottom, whereas the injection, centrifuge, and orbital seeding showed modest cell penetration, between 25% and 50% of the distance toward the center of the scaffold. Vertical lines denote ± 1 standard deviation (n = 3 in all cases), *p < 0.05 versus surface-seeded scaffolds.
Discussion
For analysis of seeded tissue-engineered scaffolds, many studies have not adequately investigated seeded cell distribution and infiltration in in vitro and in vivo settings.44–46 The importance of cell behavior on scaffolds provides the key to ensuring the ultimate functionality in tissue-engineered constructs.47,48 It is specifically important to understand how seeding method selection affects cell distribution. 9 It is likely that an even distribution of cells throughout the scaffold and across the exterior surfaces will lead to the most efficient distribution, growth, and infiltration.9,49 Many reports have highlighted the importance of cell organization, orientation, and differentiation state in dictating tissue-engineering implant functionality.9,47,48 As a result, there is a renewed interest in visualizing and quantifying the behavior of cells on 3D scaffolds.8,50 Thus, the purpose of this study was to investigate a novel method of monitoring cell survival, distribution, and infiltration in polymeric tissue-engineered scaffolds.
Recently, several methods have been investigated as tools to qualitatively analyze the distribution of seeded cells in scaffolds. For example, synchrotron radiation micro-computed tomography was used to quantify the 3D distribution of cells on yarn-fiber scaffolds. 33 Magnetic resonance microscopy has also been used to visualize interior slices of scaffolds to analyze cell distribution in different seeding methods. 51 Magnetic nanoparticles and conventional magnetic resonance imaging have also been used to visualize cell distribution on tissue-engineered scaffolds. 34 However, these methods require the use of sophisticated equipment that may not be accessible to some tissue engineers. Thus, there is still a need for a simple, cost effective method to visualize 3D cell distribution and infiltration on a constant basis.
Without a convenient approach to determine cell distribution and penetration, most studies have limited their scope to MTT and MTS assays and trypsinizing scaffold-associated cells to assess cell behavior on tissue-engineered scaffolds.22,24,52,53 Unfortunately, these methods fail to provide information on the location, distribution, and infiltration of cells into constructs. In fact, early research conducted for each seeding method showed little variation, with efficiencies of approximately 50%, consistent with unmodified PLGA salt-leached scaffolds using these methods, although in disagreement with analysis of the sections of the scaffold.19,54–57 In addition, such assays, designed for assaying cell toxicity and cell growth in 96 wells, may not adequately scale up to large 3D constructs, leading to inadequate perfusion of the compound within the large scaffold. This may obscure dye conversion results, failing to provide accurate total cell numbers for cells on the exterior of the scaffold and within the scaffold.
The recent development of fluorescent labeling dyes such as CFDA-SE has provided a simple method of labeling and tracking cell migration and location, as well as determining the total number of scaffold-associated cells.21,46 Results have shown that fluorescence labeling is a powerful tool to investigate cell distribution in tissue constructs.21,58 By expanding the use of fluorescent dye to visualize cell–scaffold interactions, this new method not only analyzes cell density by calculating total cell numbers for each section of the scaffold using the dye CFDA-SE, but also determines how the cells are distributed and, most importantly, how far they infiltrate into the scaffolds. This technique may allow the reconstruction of scaffolds to 3D images after single or multiple immunohistochemical staining to view the distribution and infiltration of different cells types within a scaffold construct in vitro or in vivo.
After labeling scaffolds with CFDA-SE to visualize live cells, we saw differences in the total number of scaffold-associated cells based on the choice of cell-seeding method, inconsistent with our MTS observations. Because most of the scaffold-associated cells were on the top, bottom, and side of scaffold, it is likely that the total cell number measurement according to MTS assay would not be able to assess the infiltrated cells, which are composed of only small numbers of total adherent cells.
Surface seeding has been the most commonly used seeding method in tissue engineering because of its ease of application.14,15,59 Our 3D images and cell location data have shown that cells tend to reside on the seeded surface, with slight penetration into the scaffold. Analysis of cell density in the central regions shows a light cell presence after seeding for 7 days. The lack of cell infiltration into the center of the constructs may be due to excess cell solution flow around the scaffold and pooling at the bottom. Such findings are in agreement with recent published work, suggesting that the localized attachment and growth of seeded cells on scaffold surfaces would hinder the development of large constructs for potential clinical applications.42,59,60
Injection seeding was proposed as a method of delivering cells to the center portions of the scaffold, in hopes that better cell distribution throughout the construct could be achieved.16,17,61 Our results show that few cells were present in the exact center of the constructs. However, analysis of cell density in areas slightly offset from the center showed a spike in cell density consistent with what would be expected with a cell injection to that region. It is possible that, during seeding, the solution injection was slightly off from the exact center of the scaffold. In addition, from the 3D images of live cells on the injection-seeded scaffolds, we observed that cells appeared to be concentrated at the point of needle entry site along the upper surface and densely located in a region below the injection point on the bottom surface of the scaffold. This may be due to the cell solution leaking through the porous scaffold to the bottom of the scaffold and pooling there, resulting in high cell density on the bottom below the injection point, as reported in other cell-injection studies. 61 Therefore our results support that cell injection into scaffolds may be a viable method of delivering cells to a specific location within the scaffold, as suggested previously. 62 However, this method may not provide the even and reproducible cell distribution needed to facilitate cell organization throughout the scaffold, as desired for most tissue-engineering applications, such as tissue-engineered vasculature, heart, tendon, and muscle.9,63–65
Because of the need for a more-efficient cell delivery method, dynamic seeding techniques were developed based on the principle that moving a cell solution throughout the construct would lead to high cell deposition in the scaffold porosity, as well as on the exterior surfaces.12,66,67 Many investigations of dynamic seeding methods support the ability of dynamic seeding methods to more efficiently seed scaffolds.12,60,66,67 One such commonly investigated dynamic seeding method is centrifuge seeding.19,42,61 After centrifuge seeding, we observed even, improved cell distribution throughout the construct and sections for 3D volumes and 2D sections, consistent with previous observations. 19 Analysis of cell density throughout the center of these constructs support our image observations showing greater cell density than with static methods. However, the harshness of this method may limit it during the seeding procedure. Our results have revealed that centrifuge seeding leads to significant levels of cell death after the centrifuge procedure. The potential influence of a large number of dead cells on subsequent cell growth in the tissue scaffold has yet to be determined. The centrifugal force–associated cell death may perhaps be avoided by lessening the speeds used during the procedure, as indicated in previous work. 42
The most successful seeding method used in our investigation was orbital seeding. This method provides the benefits of dynamic centrifuge seeding but uses much lower speeds and provides a continuous perfusion of the cell suspension through and around the scaffold. Recent investigations using orbital seeding support that this method can efficiently deliver cells throughout small-scale scaffolds.41,68 Indeed, our 2D and 3D images showed greater cell density and more-even distribution than with all other seeding methods tested. In addition, cell survival after orbital seeding appears to be consistent with other static seeding methods investigated.
In summary, all seeding methods have their unique benefits and drawbacks (Table 1). In the development and characterization of new tissue-engineered scaffolds and seeding methods, the ability to detect and analyze how cells are distributed initially and over the long term in these structures is critically important. Thus, a convenient method of analyzing cell distribution and penetration will aid tissue engineers in evaluating how well cells integrate with their scaffolds, what seeding methods will be required, and how well cells constitute the scaffolds. By analyzing some common seeding methods with PLGA salt-leached scaffolds, we have demonstrated the ability of this method to characterize the distribution and penetration of cells within the scaffolds.
In conclusion, we have demonstrated the feasibility of a new method of constructing 3D images from live cell–stained scaffold sections. This method provides a quick and efficient method to visualize and quantify cell distribution in polymeric scaffolds using materials accessible to a wide range of researchers. In addition to visualizing live cell distribution and infiltration in tissue-engineered scaffolds, this method can also be used in conjunction with other methods to acquire data on cell infiltration and distribution in tissue-engineered constructs. Such information cannot be obtained using commonly used cell quantification methods, including trypsinization and MTT and MTS methods. A more comprehensive understanding of cell distribution throughout the tissue construct may lead to a better design of better tissue-engineered products and applications.
Footnotes
Acknowledgments
This work was supported by National Institutes of Health Grant RO1 GM074021.