
Abstract
Spatiotemporal organized patterns of cell surface–associated and extracellular matrix (ECM)-embedded molecules play important roles in the development and functioning of tissues. ECM proteins interact with the surface of bioscaffold polymers and influence material-driven control of cell differentiation., Using X-ray phase-contrast micro computed tomography (microCT), we visualized the three-dimensional (3D) image of ECM organization after in vitro seeding of bone marrow–derived human and murine mesenchymal stem cells (MSCs) induced to myogenic differentiation, labelled with iron oxide nanoparticles, and seeded onto polyglycolic acid–polylactic acid scaffolds. X-ray microCT enabled us to detect with high spatial resolution the 3D structural organization of ECM within the bioscaffold and how the presence of cells modified the construct arrangement. Species-specific differences between the matrix produced by human and murine cells were observed. In conclusion, X-ray synchrotron radiation microCT analysis appeared to be a useful tool to identify the spatiotemporal pattern of organization of ECM fibers within a bioscaffold.
Introduction
Micro computed tomography (microCT) is one of the most advanced non-invasive techniques aimed at the qualitative and quantitative three-dimensional (3D) evaluation of tissue growth under different conditions. It has been mostly used to evaluate bone tissue development and regeneration in bone fracture healing,1,2 skeletal development,3,4 and bone tissue engineering.5–7 We showed the possibility of using microCT as an experimental technique with high spatial resolution (1.65 μm) for the detection of stem cells labelled with iron oxide nanoparticles after their intra-arterial transplantation into skeletal muscles of dystrophic mice ex vivo. 8 This technique also offers the possibility of obtaining 3D visualization of cell distribution. Data in our study showed that the distribution of intra-arterially administered CD133+ stem cells within muscle biopsies can be visualized using microCT, providing biological insights into the early processes of muscle stem cell homing.
Different types of myoprogenitor cells have been used to engineer skeletal muscle tissue, including muscle-derived stem cells, bone marrow-derived MSCs, neuronal stem cells, and circulating CD133+ cells.9,10 Combining our previous experience using X-ray microCT to analyze MSC/bioscaffold constructs for tissue engineering purposes5–7 and to detect in vivo the fate of myoprogenitor cells, 8 we tested the feasibility of using synchrotron analysis to unravel the structural interactions between the three components of an engineered tissue: the biomaterial, the cells, and the extracellular matrix (ECM).
A bioscaffold provides a template for cell attachment and tissue development. Ideally, scaffold structure determines the transport of nutrients and metabolites to and from the cells. The scaffold spatial structure and chemistry have a role in the intracellular signaling and gene expression. 11
Different materials have been used as scaffolds for muscle tissue engineering, in particular naturally derived materials such as collagen 12 and alginate; 13 cellular tissue matrices such as bladder submucosa and small intestinal submucosa; 14 and synthetic polymers, in particular polyglycolic acid (PGA), polylactic acid (PLLA), and polylactic-co-glycolic acid (PLGA).15–17 Synthetic polymers have some advantages, such as polymer degradation using non-enzymatic hydrolysis and the production of nontoxic molecules derived from PGA, PLLA, and PLGA, naturally metabolized and eventually eliminated from the body in the form of carbon dioxide and water.18,19 Based on data from the literature 20 and on the results of our preliminary tests on cell viability after loading on different biomaterials, we selected PGA/PLLA (a mixture of PGA and PLLA at 50%) as a suitable bioscaffold.
Materials and Methods
Cells
Human mesenchymal stem cells (hMSCs) were obtained from iliac crest marrow aspirates of healthy donors (aged range 31–42) after obtaining informed consent. Murine mesenchymal stem cells (mMSCs) were obtained from C57Bl/6 mice as previously described. 21 Briefly, mice were killed, and bone marrow cells were collected by flushing nucleate cells out of femurs and tibiae with cold phosphate buffered saline (PBS). The care and use of the animals were in compliance with laws of the Italian Ministry of Health and the guidelines of the European Community.
Nucleated cells were purified on a Ficoll separating solution (Seromed, Biochrome AG, Berlin, Germany). Murine and human cells were cultured (10 × 106 nucleated cells/10-cm Petri dish) in Coon's modified F12 medium (Biochrom AG, Berlin, Germany) supplemented with 10% fetal calf serum (FCS) (GIBCO, S. Giuliano Milanese, Milan, Italy), 2 mM of L-glutamine, and 50 μg/mL of penicillin/streptomycin (complete medium). No cytokines were added at any stage. Cultures were incubated at 37°C in a 5% carbon dioxide (CO2) atmosphere. After 3 days, nonadherent cells were removed to eliminate contaminating cells of hematopoietic origin. When there was 90% confluence, the adherent cells were trypsinized (0.05% trypsin/ethylenediaminetetraacetic acid at 37°C for 10 min) and expanded (P1 stage).
Induction of myogenic differentiation of MSCs and cell labeling
mMSCs and hMSC were induced to in vitro differentiate into myogenic lineages as previously described. 22 Briefly, MSCs were collected at the first culture passage (P1), replated in 6-well plates, and cultured in complete medium in presence of 1 ng/mL of basic fibroblast growth factor (bFGF) at a density of 5 × 10³ cells/well.
When cells reached confluence, myogenic differentiation was induced by treating them with 10 μM/L of 5-azacytidine (5-Aza) (Sigma) for 24 h (conditioned medium). At the end of the treatment, conditioned medium was removed, and cells were cultured in complete medium for 2 weeks and then labelled. To test the distribution and myogenic commitment of the MSCs within the PGA/PLLA scaffold, we labelled the MSCs using nanoparticles of iron oxide (Endorem, Guerbet, Paris, France), which allows their 3D visualization using microCT. Endorem is a black to reddish-brown aqueous colloid of superparamagnetic iron oxide associated with dextran for intravenous administration. Cells were labelled with 250 μg/mL nanoparticles of iron oxide with a total iron content of 11.2 mg mL−1, consisting of small superparamagnetic iron oxide particles. The crystal size varies from 4.3 to 5.6 nm, and the mean particle diameter is 150 nm. Labelling was performed using co-incubation of the iron oxide particles in the standard cell culture medium for 24 h at 37°C in a 5% CO2 atmosphere.
At the end of the labelling experiments, the culture medium containing excess particles was removed, and the mesenchymal cells were washed three times with sterile phosphate buffered saline (PBS) as previously described 8 by addition of Endorem to the culture medium at a concentration of 250 μg/mL. Labelled cells were cultured (37°C, 5% CO2) for 24 h.
Scaffold
The scaffold consisted of a biofelt of non-woven fibers of PGA and PLLA each present at a percentage of 50% (now BIOFELT, Concordia Fibers, Coventry RI). The scaffold was 0.5 mm thick and 50 mg/cc dense, with an average diameter of 18 μm. The scaffold was a highly porous felt structure (>97% porosity), with interconnected pores with a size typically in the range of 50 to 200 μm.
The material was cut in slices measuring approximately 1 cm2 in are and 500 μm thick.
Cell seeding
After incubation and treatment with 5-Aza, 50 × 104 Endorem-labelled MSCs were seeded using gravity onto PGA/PLLA scaffolds.
Cell–scaffold constructs were maintained in culture for 15 days in Coon's F12 medium supplemented with a decreasing amount of FCS, starting from a concentration of 5% serum and decreasing to 1% serum (starving condition) to promote the myogenic commitment of the MSCs.
To check whether the seeded cells underwent myoblast differentiation, some of the samples were put into lysis buffer (Qiagen, Milan, Italy), and total RNA was extracted using an RNeasy Mini kit (Qiagen). RNA was treated with DNAse (Rnase-free Dnase set, Qiagen) to avoid contamination of genomic DNA. We used a Superscript II First Strand Synthesis System (Invitrogen) to synthesize complementary DNA (cDNA).
We performed reverse transcriptase polymerase chain reaction using primers for the markers MyoD forward: 5′-ATCCGCTACATCGAAGGTCT-3′, reverse: 5′-CTCTGGTGGTGCATCTGCCA-3′; Myogenin forward: 5′-CAGTACATTGAGCGCCTACA-3′, reverse: 5′-ACATATCCTCCACCGTGATG-3′, Desmin forward: 5′-ATCTCTGAGGCTGAAGAATGG-3′, reverse: 5′-GAGCAGAGAAGGTCTGGATAG-3′. We compared gene expression levels with the expression of the housekeeping gene glyceraldehyde-3-phosphate dehydrogenase (GAPDH). Human GAPDH forward primer: 5′-GAAGGTGAAGGTCGGAGTC-3′, reverse primer: 5′-GAAGATGGTGATGGGATTTC-3′. Mouse GAPDH forward primer: 5′-CCATCTTCCAGGAGCGAGAC-3′, reverse primer: 5′-GGCTAAGCAGTTGGTGGTGC-3′.
Other samples were then washed in phosphate buffered saline (PBS) 1X, fixed in 3.7% paraformaldehyde for 30 min, and maintained in 70% ethanol for morphological analysis.
Morphological investigations
Formalin-fixed specimens were paraffin embedded using standard histological techniques. Two months after fixation, serial sections of 4 μm were cut. Sections were stained with hematoxylin and eosin (HE) and periodic acid Schiff (PAS) to examine morphology.
For transmission electron microscopy (TEM) analysis, specimens were fixed in 2% glutaraldehyde in 0.1 M cacodylate buffer (pH 7.4), post-fixed in 1% osmium tetroxide, dehydrated in increasing ethanol concentrations, and embedded in Araldite. Semi-thin sections stained with toluidine blue were observed using an Eclipse E600 microscope (Nikon, Tokyo, Japan) at 400X, using a 40X objective with N.A. 0.75. Images from sections were obtained using Nikon Coolpix digital camera at 40X. Ultra-thin sections, counterstained with uranyl acetate and lead citrate, were observed using a Philips (Amsterdam, The Netherlands) CM10 TEM operating at 80 KV.
X-ray phase-contrast microCT imaging and image reconstruction
A microCT system (Beamline BM05, European Synchrotron Radiation Facility (ESRF) Grenoble, France) was used to non-invasively image and quantify the 3D structural morphology of each sample. MicroCT experiments were performed using a monochromatic beam of 20 KeV energy and a sample-to-detector distance of 20 mm. The samples, kept in 70% ethanol, were air dried before data acquisition.
The acquisition setup was based on previously described 3D parallel tomography.23,24 The total radiation absorbed by the sample during the synchrotron imaging sequence was limited to 0.2 Gy. The samples were scanned, and 1500 projections were obtained for each sample over 180°. The exposure time was 1 s per projection. A Gadox scintillator associated with a FReLoN 2048 × 2048 CCD camera (ATEG, ESRF Instrument Support Group, Grenoble, France) was used as a detector, with the pixel size set to approximately 0.7 μm, yielding a visual field of approximately 1.5 mm. The system obtained isotropic slice data, and reconstructed them into 2D images.
Three-dimensional reconstruction of the samples was obtained from the series of 2D projections using a 3D filtered back projection algorithm implemented at ESRF. Furthermore, different grey phases were colored using 3D display software to make them more easily recognizable. Several subvolumes of approximately (1000) 3 voxels were reconstructed for each sample, where a voxel is a cube with a 0.7-μm size in the three directions of space.
3D visualization
Volume rendering is a 3D visualization method by which the data volume is rendered directly without decomposing it into geometric primitives. A 2 GHz Pentium (Intel, Santa Clara, CA) with 1 Gb of random access memory and commercial software VGStudio MAX 1.1 were used to generate 3D images and to visualize the distribution of phases in 3D. To achieve an optimal settings for the image quality, we used a Scatter HQ algorithm with an over-sampling factor of 5.0 and activated color rendering.
Extraction of quantitative parameters
Quantification was then performed concerning the different phases using the implementation of the 3D mean intercept length (MIL) method described in detail elsewhere.23–25 The different volumes were computed by counting the number of voxels labeled by the algorithm that automatically separates the different phases. Scaffold transport properties of interest such as tortuosity index, average Young curvature, bending energy, circularity, convexity, eccentricity, and solidity were measured using the algorithms proposed in 26 and. 27
Statistical analysis
Results were expressed as means ± standard errors of the mean. An unpaired Student t-test was performed using Sigma Stat 4.0 software (Jandel Corp, San Rafael, CA) and statistical significance was defined as p < 0.05.
Results
3D characterization of scaffold structure
Different PGA/PLLA samples were imaged before MSC seeding. No significant differences in the internal microarchitecture between the samples were observed when the subvolumes of scaffolds were analyzed using light microscopy, scanning electron microscopy, of microCT (Fig. 1), indicating that the images correlated with one another. PGA/PLLA scaffolds (BIOFELT) were confirmed using microCT to be composed of fibers (Fig. 1C). The 3D microCT of the PGA/PLLA fibers images were then quantified using spatial computational analysis techniques. Structural and functional characteristics such as fiber surface to fiber volume (FS/FV), fiber volume to total volume (FV/TV), mean diameter fiber, and average length across fiber phase of the scaffolds are reported in Table 1 as extracted from the 3D microCT scans. The mean value ± standard deviation of fiber diameter was 15.5 ± 4.7 μm. The mean total porosity was approximately 95%. The quantitative parameters measured for these scaffolds were in agreement with those reported by the manufacturer. Because the transport properties can affect tissue formation, we considered also the related parameters. 28 The measured transport properties according to microCT for the scaffolds are shown in Table 2. It appeared that the tortuosity index for all of the scaffold samples favored tissue growth, considering that tortuosity in the 1.41 to 1.78 range is optimal for mass transport through the globally interconnected porous space.29,30

Pure fiber polyglycolic acid–polylactic acid scaffolds. Optical (
Modification of PGA/PLLA scaffold upon cell seeding
The 3D microCT analysis was able to easily distinguish empty PGA/PLLA structures from cell-loaded PGA/PLLA scaffolds (Fig. 2). Cell–scaffold interactions produced modification of the PGA/PLLA structure, producing images in which two different phases with different attenuation coefficients were evident (Fig. 2). The different phases were colored using 3D display software to make them more easily recognizable. Unmodified PGA/PLLA fibers were shown in green, and thin layers of fibrillar matrix produced by cells grown on the bioscaffold were depicted in red. The layers were partially connected to fibers and covered some regions in the network of the fiber itself (Fig. 2B, C). The measured average thickness of the layers was 5.4 ± 1.3 μm and 2.7 ± 0.7 μm for the scaffolds seeded with mMSCs and hMSCs, both labelled with iron nanoparticles, respectively (Fig. 2B, C). Frontal sections of scaffolds reinforced the information given by the 3D imaging (Fig. 3A–C). It is easily recognizable that, although in the scaffold cultured without cells there was no evidence of the red-layered phase (Fig. 3A), this phase was visible in both of the scaffolds cultured with hMSCs (Fig. 3B) and mMSCs (Fig. 3C). To make such evidence clearer, the profile of the “Number of Voxels vs the Experimental Attenuation Coefficient” was drawn (Fig. 3D).

Fiber polyglycolic acid–polylactic acid scaffolds before and after seeding with mesenchymal stem cells (MSCs). Three-dimensional (3D) display of subvolume of scaffolds cultured without cells (

Evidences of new extracellular matrix formation. Two-dimensional (2D) (micro computed tomography frontal section) display of subvolume of scaffolds cultured without cells (
To obtain quantitative data from the analyzed sample, a comparison was performed (Fig. 4) between the newly formed layered structure in scaffolds loaded with hMSCs and with mMSCs. The amount of the new structure (red in Fig. 3) intertwined between scaffold fibers (green) was calculated by counting its corresponding voxels, using an algorithm that automatically separated it from the other phases. The data obtained were expressed as number of voxels (Fig. 4A) and as a volume fraction (cell-derived structure volume/total volume = CV/TV) (Fig. 4B) in the analyzed sample volume (1.5 mm × 1.5 mm × 1.5 mm).
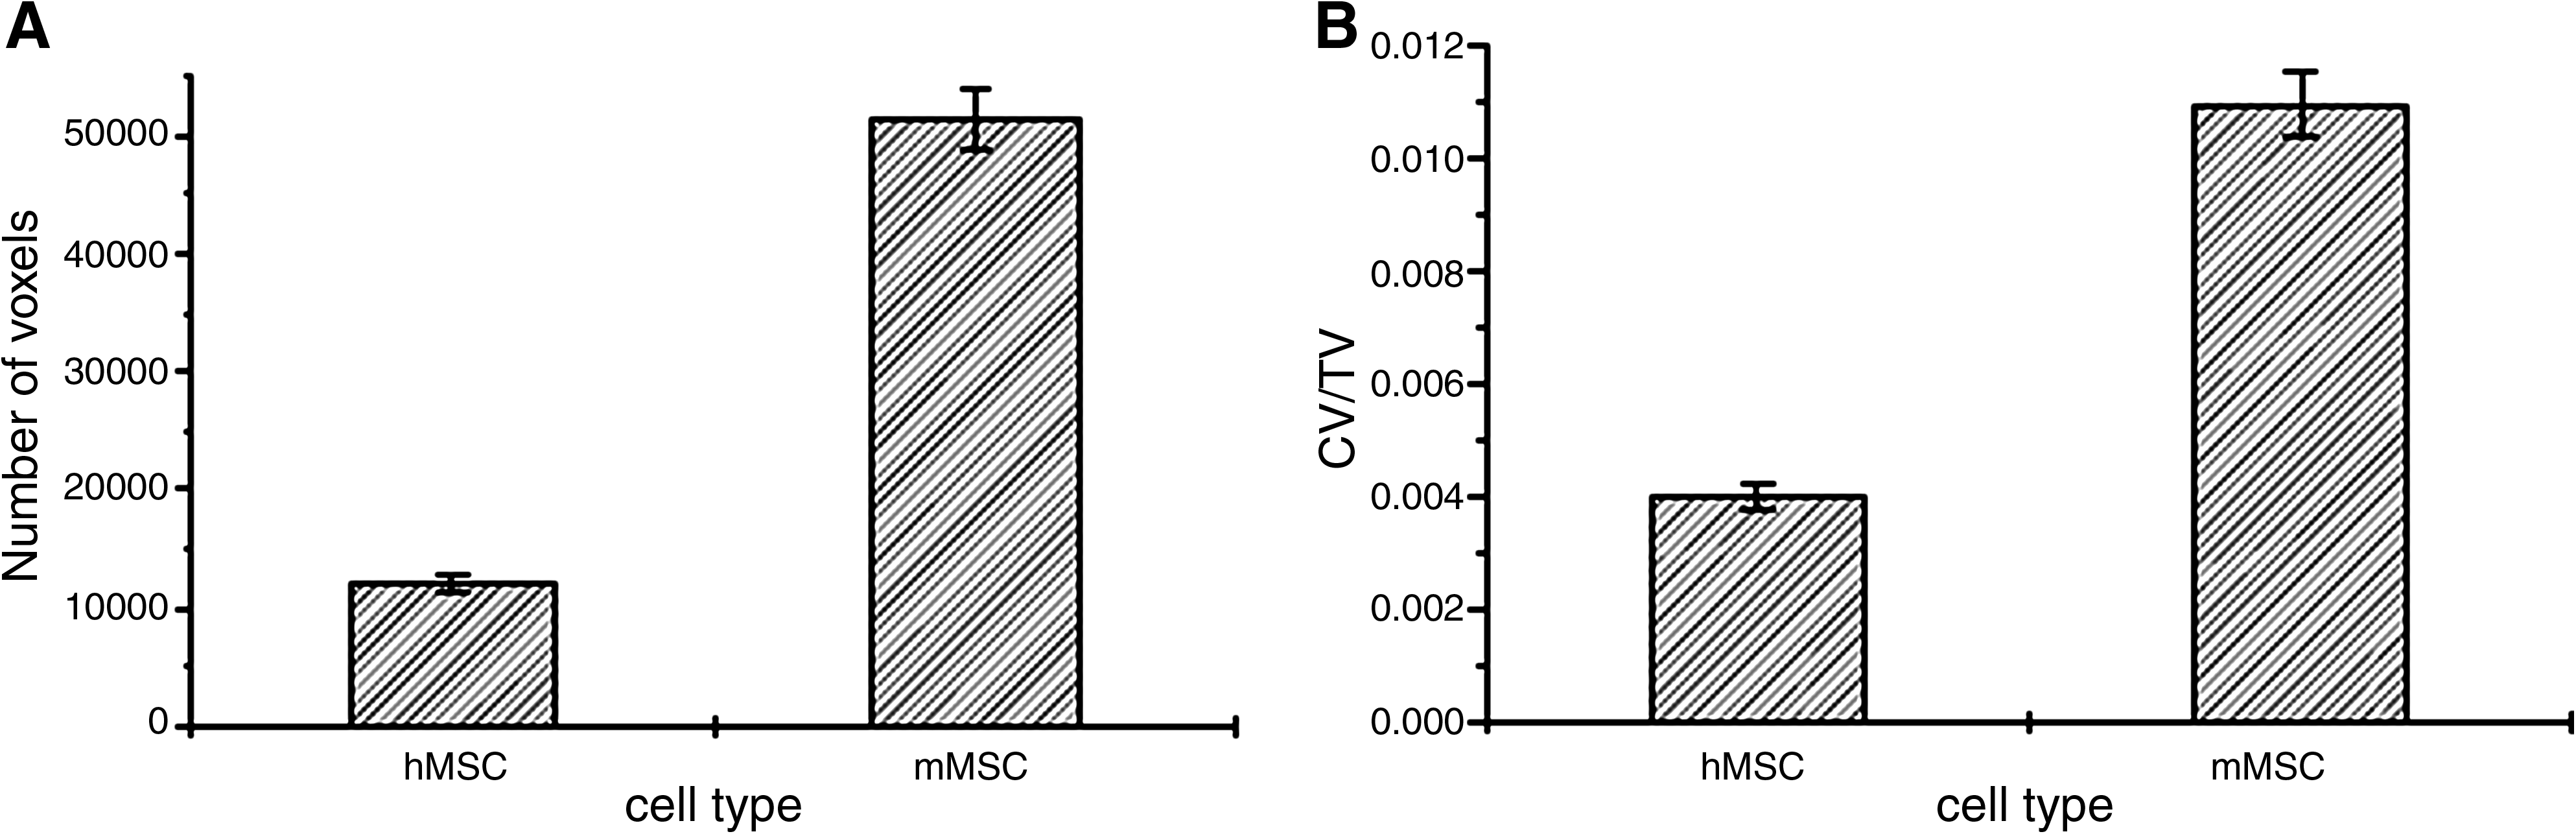
Quantitative evaluation of matrix fibers within the scaffold. (
Species-specific quantitative differences determined the amount of tissue produced by hMSCs and mMSCs; the same number of loaded mMSCs produced a significantly greater quantity of deposited matrix.
Elaboration of the 3D image (Fig. 5) revealed the presence of thin layers of fibrillar matrix, possibly corresponding to specific spatio-temporal patterns of fibril organization. Initially, a few filaments were deposited onto the scaffold fibers, creating a sparse structure (Stage I); then they appeared to be organized in chains (Stage II), and finally layers of filament chains appeared to be organized in the form of a thicker structure (Stage III). The fiber organization and its connection with the scaffold were similar in samples loaded with hMSCs and mMSCs.
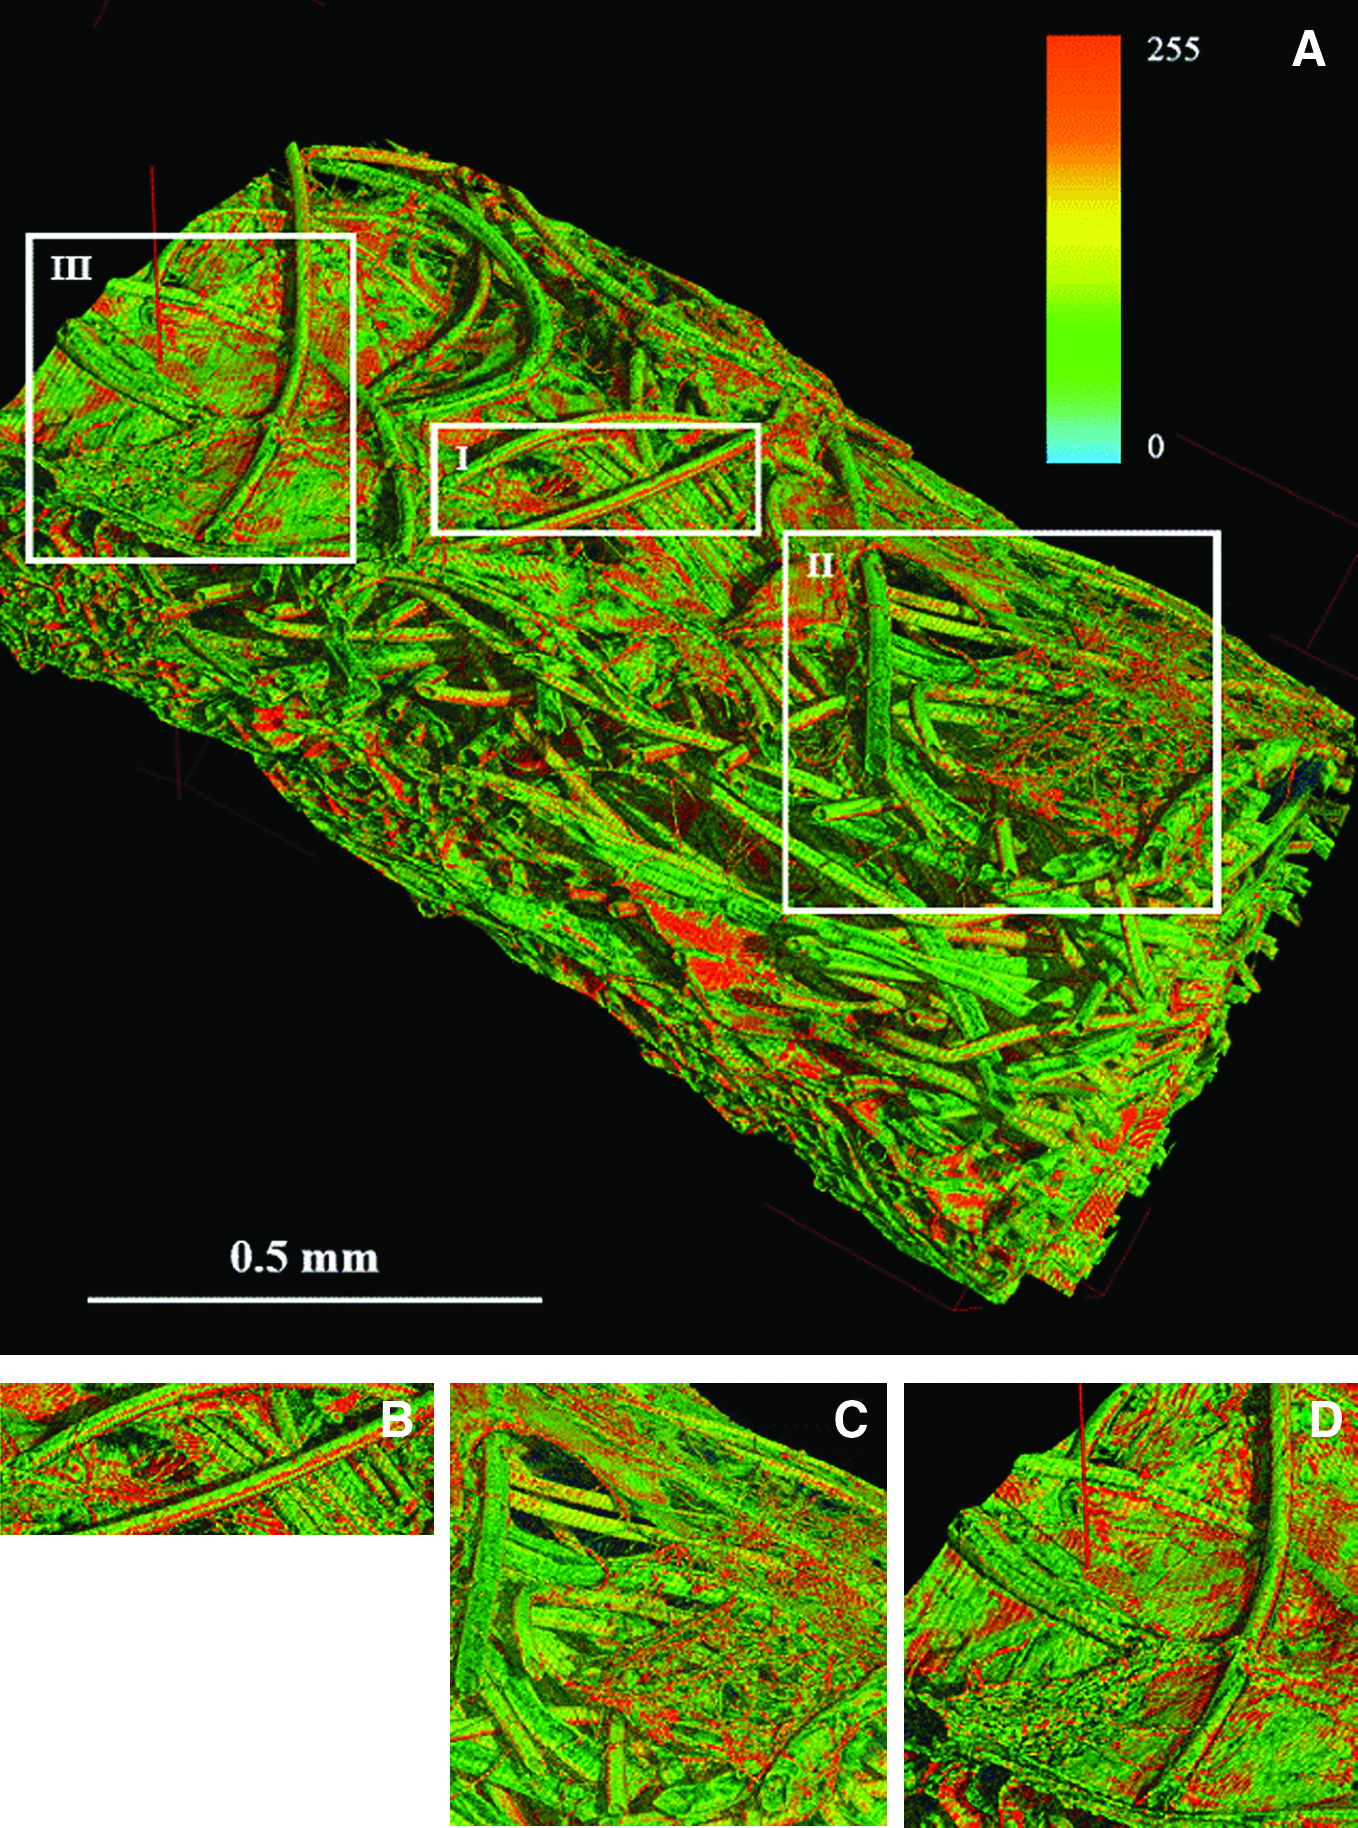
Extracellular matrix detection using X-ray micro computed tomography. Three-dimensional display of the scaffold fibers and of the deposited matrix (
Characterization of structure newly organized within PGA/PLLA scaffold
Because cells were induced into myoblast differentiation, our first attempt was focused on checking whether the new structure could correspond to initials steps of muscle formation. Total RNA was extracted from the cell–bioscaffold constructs after 15 days in culture (data not shown), and the expression analysis of the markers MyoD, myogenin, and desmin showed the absence of cDNA specific for the myogenic differentiation of the hMSCs and mMSCs (data not shown), supporting the idea that loaded cells remained within the scaffold and did not undergo myoblast differentiation (data not shown).
Morphological analysis showed the presence of MSCs in HE- and PAS-stained sections. The newly formed tissue was described as a hyaline matrix with a PAS-positive fibrillar texture that appeared more dense in some portions of the section (data not shown), indicating the presence of a high proportion of carbohydrate macromolecules such as glycogen, glycoprotein, and proteoglycans, typically found in the ECM of connective tissues.
Light microscopy analysis identified the tissue as connective tissue made of ECM fibers connected to the scaffold structure (Fig. 6a). Some cells containing iron particles were spread throughout the matrix (Fig. 6c). No evidence of an organized skeletal muscle tissue (myotubes or myofibers) was found.
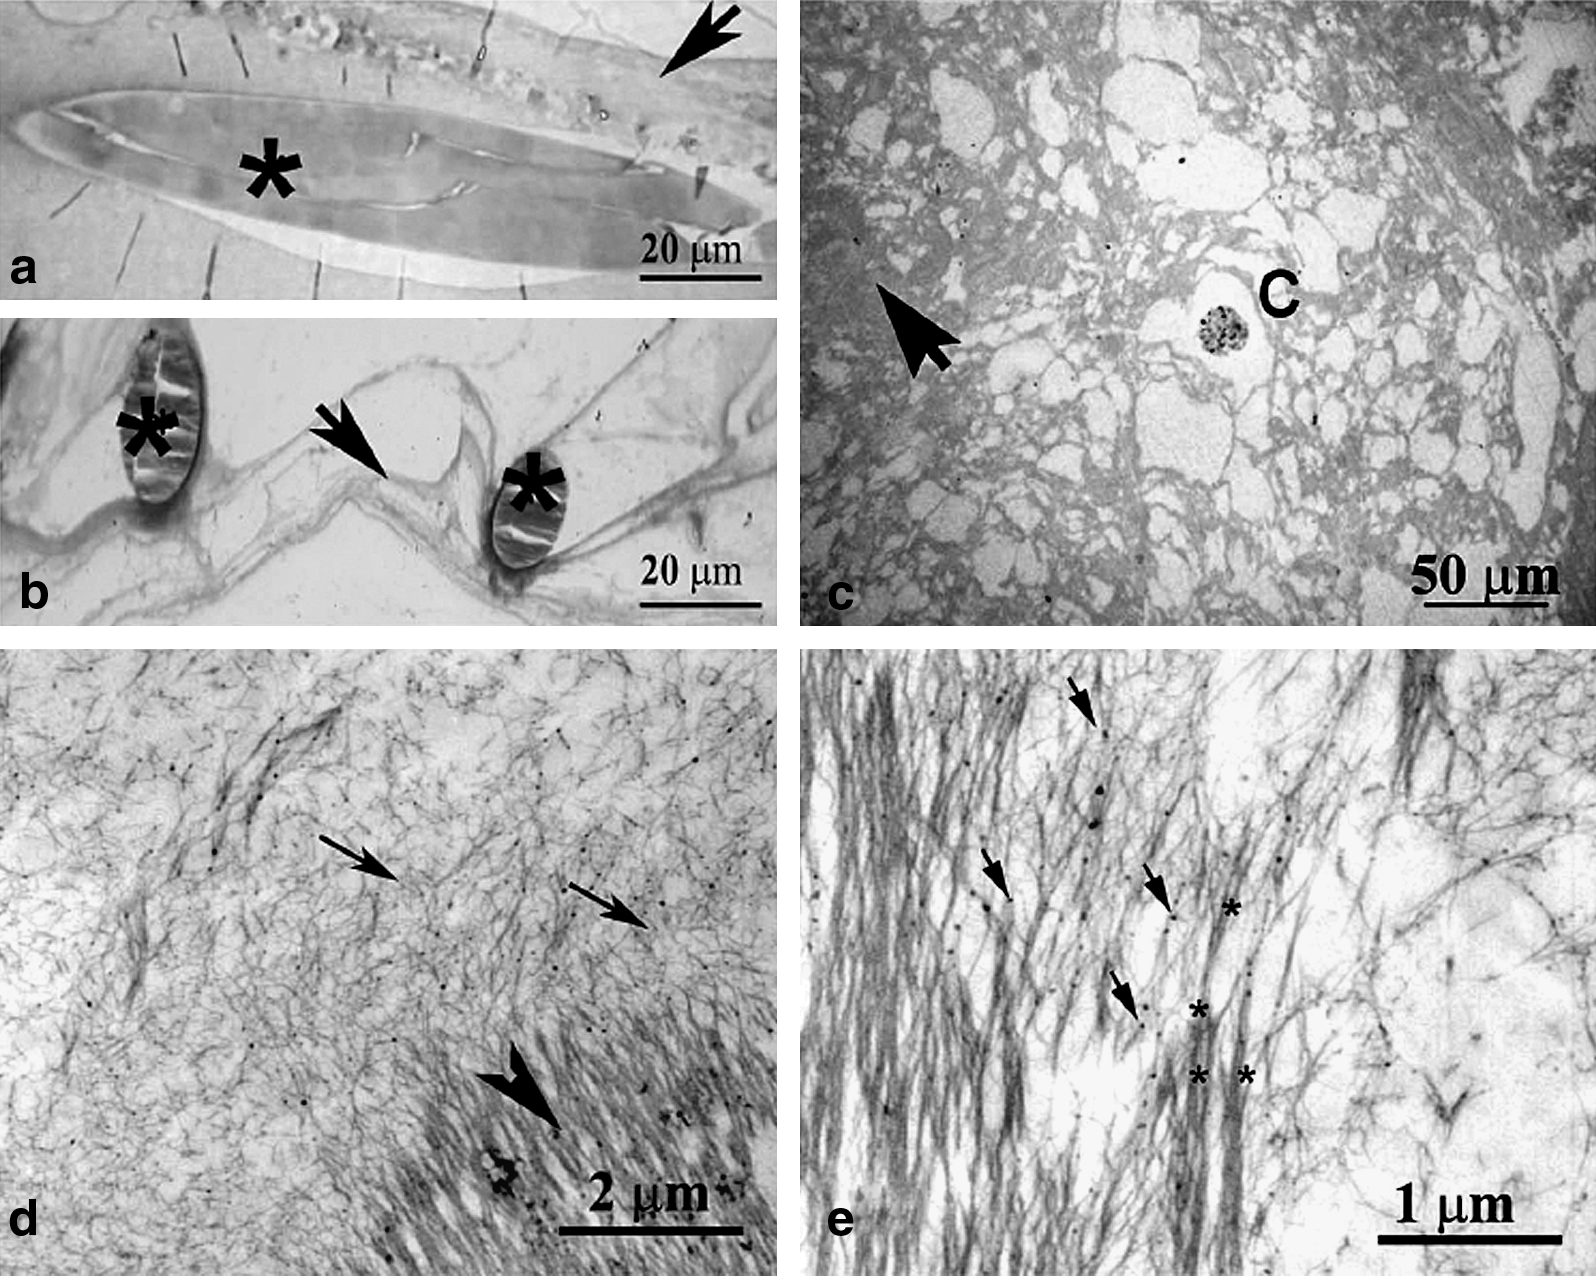
Organization of extracellular matrix (ECM) fibers within a polyglycolic acid–polylactic acid (PGA/PLLA) scaffold. Morphological investigations using light (
Echoing synchrotron images, TEM analysis of thin sections (Fig. 6d, e) indicated that two different components consisting of highly oriented, long, fibrous structures and poorly organized fibrils shorter in length and randomly oriented, with similar ultrastructural aspects in dense and loose areas, respectively, reflecting different degrees of matrix organization, mostly made collagen-like fibers from ECM. Progression of fibril assembly in dense ordered matrix was observed at higher magnification (Fig. 6e) in interfacing zones. Electron-dense bodies, probably related to iron nanoparticles, were also detectable within the ECM fibrils.
Discussion
The aim of tissue engineering is to develop suitable combinations of biomaterials and cells for replacing defective tissues. Current research is focusing on controlling cell differentiation within a bioscaffold structure where progenitor cells can find a microenvironment conducive to tissue development. An important potentially confounding element involves the secretory responses of cells to these materials and their microenvironment. Cells continually secrete complex mixtures of ECM proteins and other regulators of cell behavior, which may affect what happens when exogenous cells or material are implanted. 31
Our study revealed that PGA/PLLA skewed MSCs toward secretion of ECM proteins, possibly delaying or impeding their differentiation into skeletal muscle cells despite treatment with 5-Aza, a factor used to induce myogenic differentiation. 22 The absence of a myogenic environment and of mechanical forces could have contributed to the failure of loaded MSCs to differentiate into muscle cells. Moreover, the 3D structure of the PGA/PLLA scaffold may influence the behavior of the MSCs because they remain dispersed within the scaffold without cell-to-cell contact. mMSCs secreted a higher amount of ECM proteins than hMSCs, confirming the species-specific behavior of MSCs.21,32
Despite the fact that microCT alone is not recommended for analysis of soft tissues present in the samples because of such low X-ray absorption, 7 we were able to detect the organization of ECM between the scaffold fibers using a special set-up described below. The use of synchrotron X-rays has several advantages over laboratory or industrial X-ray sources, including a high photon flux, which permits measurements at high spatial resolution; a tunable X-ray source, allowing measurements at different energies; the use of monochromatic X-ray radiation, which eliminates beam hardening effects; and parallel beam acquisition, which allows the use of exact tomographic reconstruction algorithms. Furthermore, we performed the experiment with a semi-phase contrast set-up that enhances the possibility of visualizing the interfaces between different phases, highlighting in our experiment the organization of the ECM. The images extrapolated from the synchrotron analysis indicated that ECM fibers aggregated according to a spatio-temporal pattern. Isolated collagen-like fibers that, in other portions of the scaffolds, appeared aggregated in progressively thicker layers, indicating a continuous secretion of matrix by the seeded cells, covered a few scaffold areas. The presence of iron-labelled cells or iron nanoparticles appeared not to have interfered with the detection of ECM structures by X-ray microCT. In this context, non-invasive and quantitative X-ray microCT can be considered a potentially important tool for challenging new applications in tissue engineering research. Current microscopy techniques (such as the TEM also used in the present work for comparative analysis) are limited to 2D local information or otherwise require laborious 3D reconstruction of serial sections. Here, we determined the feasibility of using synchrotron analysis to depict the fine spatio-temporal organization of the net of matrix fibers layered by MSCs in contact with PGA/PLLA bioscaffolds.
Footnotes
Acknowledgments
The authors acknowledge the ESRF User Office for kindly providing beam-time, Dr. P. Coan for the technical support during the experiments, the EU Network of Excellence project Knowledge based Multicomponent Materials for Durable and Safe Performance (KMM-NoE) under contract NMP3-CT-2004-502243, and the Program PRIN N2005022411 for financial support.
Disclosure Statement
No competing financial interests exist.