
Abstract
Several publications have shown approaches for the optimization of tissue engineering constructs by magnetic resonance imaging (MRI). However, the technology is still scarcely used, probably because of the poor spatial resolution of clinical scanners and their temporally limited availability for many researchers. The new benchtop-MRI (BT-MRI) equipment used in the present study is much more affordable, for example, because of the low static magnetic field strength of 0.5 T and the absence of a helium cooling system. In this study, the method of BT-MRI was evaluated for the characterization of a tissue engineering scaffold. Hollow cylinder scaffolds were made of hydroxyapatite (HA), collagen, and chitosan and wrapped in a polyglycolic acid mesh. Mass transport between construct and surrounding medium was investigated by dynamic contrast agent–enhanced MRI with gadolinium(III)-diethylaminepentaacetic acid. The results demonstrate that BT-MRI permits detailed, space-resolved insights into diffusion processes within the three-dimensional matrices, enabling a comparison of the mass transport inside different scaffold types. Inhomogeneities of the HA distribution in scaffolds caused by the fabrication were also visible in MR images. The fate of cells, labeled with superparamagnetic iron oxide nanoparticles and seeded on the scaffold surface, was monitored. For the first time, it was shown that mass transport, inhomogeneities of the HA distribution, and localization of superparamagnetic iron oxide nanoparticle–labeled cells are accessible in a tissue engineering scaffold by BT-MRI. Hence, it is demonstrated that BT-MRI is a powerful analytic method for the noninvasive evaluation of tissue engineering constructs.
Introduction
Further systematic development necessitates advanced analytical tools, especially imaging modalities suitable for monitoring processes inside the scaffolds in vitro and in vivo. The conventional method for characterization of the constructs is histology. The main drawback of this method is the destruction of the sample, precluding further proceeding of the experiment with the same sample.5–8 Alternatively, some noninvasive optical imaging techniques are providing continuous analytics of one sample. The fate of cells seeded on scaffolds can be monitored by fluorescent dyes penetrating into the matrix, 9 but with increasing size of the constructs, the analysis of processes inside becomes more complicated. Because of interference with autofluorescence and its limited penetration depth, the use of fluorescence techniques is restricted to small or thin samples, especially for optically opaque scaffolds and in vivo experiments.5,10 Single-photon emission computed tomography and positron emission tomography are noninvasive and have high penetration depth, but both use radioactive labels, which can affect living cells adversely. 11 Magnetic resonance imaging (MRI) possesses none of the three discussed drawbacks and represents an already established technique in clinical diagnostics. Recent publications show progress in the field of regenerative medicine using MRI. The studies are predominantly cell-tracking experiments, including the monitoring of transplanted stem cells in vivo.12–15 Only a few can be found that deal with the characterization of scaffolds. For example, approaches for the determination of the porosity of biodegradable matrices were reported.16,17 Peptan et al. showed that the osteogenic differentiation of bone marrow stromal cells on scaffolds is evaluable by MRI. 6 The mineral deposition in scaffolds associated with bone formation was examined using magnetic resonance microscopy.5,8 In vivo experiments analyzing an implanted, demineralized bone matrix were carried out by Hartman et al. 18 Fluid transport measured by MR flow imaging was performed by the group of Bechtold.17,19 Several groups have investigated important properties of constructs for cartilage repair, for example, the content of negatively charged glucosaminoglycans and the perfusion or alterations resulting from mechanical stress.7,20,21 Cell-tracking experiments on collagen scaffolds were reported by Terrovitis et al. 22 However, all these studies are carried out by standard or high-resolution MRI or by magnetic resonance microscopy with field strengths ranging from 1.5 to 11.7 T using superconducting magnets.
Apparently, the method has still not reached the state to be used as standard laboratory equipment, especially for in vitro experiments. The reasons are mainly high investment and maintenance costs of superconducting MRI devices and very strong gradients for sufficient spatial resolution or the need of special designed coils for the excitation and detection of small samples. 18
The recently developed benchtop-MRI (BT-MRI) equipment is much more affordable due to a low static magnetic field strength of 0.5 T, a small pole shoe gap of 30 mm, a small gradient coil gap and therefore a high gradient strength ensuring an in-plane resolution better than 0.35 mm, and the absence of a helium cooling system. 23 This study explored the possibilities to monitor cell seeding on three-dimensional matrices, scaffold properties like homogeneity of hydroxyapatite (HA) distribution, and mass transfer through the porous constructs by means of BT-MRI.
Materials and Methods
All chemicals used were at least of reagent grade and purchased from Sigma (Taufkirchen, Germany) or Roth (Karlsruhe, Germany) unless otherwise stated.
Scaffold fabrication
According to the methods described by Itoh and Hu, a HA/collagen composite material was fabricated.24,25 A dispersion of 0.125 g equine collagen type I (Lohmann & Rauscher GmbH & Co. KG, Neuwied, Germany) in 60 mM aqueous phosphoric acid containing 0.063% hydrogen peroxide and a 99.6 mM aqueous solution of calcium chloride was simultaneously dropped into a reaction vessel. The temperature of the system was set to 40 ± 5°C. Twenty milliliters of deionized water was used as a reaction medium. A pH of 8.3 ± 0.8 was maintained for 5 h by a 0.3 M solution of sodium hydroxide using an automatic titration unit (DL21; Mettler-Toledo GmbH, Giessen, Germany). The resulting dispersion was shaken for at least 13 h at 40 ± 2°C and subsequently centrifuged at 800 rpm for 3 min, three times washed with deionized water, and centrifuged again under the same conditions. The precipitate was dried and stored in a desiccator over phosphorus pentoxide under reduced pressure.
For further processing of the obtained composite material, methods of Guo and Zhang were modified.26,27 Fifty milligrams of Chitosan (Chitoclear FG95; Primex, Siglufjordur, Iceland) was dissolved in 7 mL of 0.25 M aqueous acetic acid solution. Three grams of 1% collagen dispersion containing 0.5% of hydrogen peroxide (Lohmann & Rauscher) was added. The mixture was stirred at 50 ± 5°C for 2 h. Subsequently, 100 mg of the dry HA/collagen composite was added followed by vigorous shaking. Aluminium tubes were lined by a glycolic acid mesh (Safil; B. Braun Melsungen AG, Melsungen, Germany) and closed from one side with a plastic cap fixing a central iron stick. The tubes were filled with the suspension and closed from top with a second plastic cap, followed by quick freezing in liquid nitrogen and storage in a freezer at −80°C. After the removal of the plastic caps, the frozen suspension was lyophilized. According to the method described by Ueda, the resulting sponges were filled in a test tube, closed by a valve, evacuated to 9 ± 3 mbar, and incubated in an oil bath of 145 ± 5°C for 6 h. 28 Subsequently, the scaffolds were stored for at least 3 days in isopropanol and dried under reduced pressure before further experiments.
Two modifications were applied to the fabrication procedure to obtain different samples. These were used to evaluate the suitability of BT-MRI for different approaches. At first, it was assessed whether the method is capable to show an inhomogenous distribution of HA within the scaffold. Therefore, the aluminium tube containing the suspension was placed for 3 min on the lateral surface before freezing. The composite material precipitates if a delay occurs between filling the aluminium tubes and the fast freezing, which was intentionally done for one sample to achieve an inhomogeneous distribution of HA. All the other scaffold production steps were carried out like described above.
Second, for imaging velocity differences in the mass transport between scaffold and surrounding medium, some samples were perforated using a 21-gauge canula (Fig. 1).

(
Magnetic resonance imaging
1H NMR imaging experiments were performed on the benchtop NMR spectrometer MARAN DRX2 (Oxford Instruments Molecular Biotools Ltd, Abingdon, United Kingdom) with an operating frequency of 20 MHz and static magnetic field strength (B0) of 0.5 T. The scaffolds, incubated in different media, were fixed in a test tube with sample holder (Fig. 1). Three 3-mm-thick slices perpendicular to the main magnetic field were selected. The recovery time was set to 300 ms and the echo time to 9.4 ms. Obtained images were composed of 128 × 128 pixels on a field of view of 40 × 40 mm.
For cell-free experiments the scaffolds were incubated in phosphate buffer pH 7.4 containing 0.1% of sodium azide as a preservative.
Mass transport between scaffolds and surrounding medium was observed by means of dynamic contrast agent–enhanced MRI using phosphate buffer containing 1 mM gadolinium(III)-diethylaminepentaacetic acid (Gd-DTPA). Images were recorded after replacing the incubation buffer with Gd-DTPA buffer. Averages of 16 single scans were used resulting in a complete measuring time of about 10 min. By means of the IDL type RI Image Display software version 1.0.2. (Oxford Instruments), the obtained image data were used to generate intensity profiles for the quantification of velocity differences of the contrast agent penetration. An average of 12 parallel profiles, all matching the central hole, were created for each image (Fig. 3).
For investigation of scaffold colonization by MG63 cells, the samples were taken out of the well and transferred with 4 mL of incubation medium into a test tube with sample holder. A capillary containing silicon oil (Dimeticon 350; Caesar & Loretz GmbH, Hilden, Germany) was positioned next to the scaffold, as an internal standard for setting the maximum intensity in the MR images. Averages of 128 single scans were used resulting in a complete measuring time of about 90 min. After the imaging procedure, the samples were transferred back into the well plates for further cultivation.
Culture of MG63 cells
MG63 human osteosarcoma cells (LGC Promochem, London, United Kingdom) were used because they are known to be a relevant model for osteoblast behavior and because of the ease of their cultivation. 29 The cells were cultured at 37°C and 5% CO2 aeration in Dulbecco's modified Eagle's medium (DMEM; Biochrom AG, Berlin, Germany) containing 10% fetal bovine serum (Biochrom AG) and 1% penicillin/streptomycin (PromoCell GmbH, Heidelberg, Germany).
Iron oxide labeling of MG63 cells
For the labeling procedure as well as for the examination of the labeling efficiency, modified standard protocols were applied.11,22,30 Carboxydextran-coated superparamagnetic iron oxide nanoparticles (SPIOs; Resovist®, Schering Deutschland GmbH, Berlin, Germany) and poly-(L)-lysine (PLL) were added to DMEM yielding concentrations of 84 μg Fe/mL and 2.25 μg PLL/mL and shaken at room temperature for 120 min. MG63 cells growing to 70% confluency were incubated with the labeling medium for 20 h. After three washing steps with phosphate buffered saline, the cells were trypsinized with an aqueous solution of 0.25% trypsin and 0.1% EDTA for 5 min, counted, and used for further experiments.
Light microscopy for the examination of labeling efficiency
Prussian blue staining of iron oxides and nuclear fast red counterstaining of the cellular structures were applied for light microscopy. Labeled or nonlabeled cells were seeded and cultured on coverslips in 12-well plates. After 16 h, the cells were fixed with 2% glutaraldehyde for 10 min and subsequently incubated for 30 min with 1% potassium ferrocyanide in 3% aqueous hydrochloric acid. Next to the washing steps, the slides were immersed in nuclear fast red solution for 10 min and rinsed with water. After dehydration in ascending alcohol series, the slides were cleaned with xylene and covered with Clarion mounting medium.
Transmission electron microscopy for the examination of labeling efficiency
Labeled or nonlabeled cells were centrifuged, and after removal of the culture medium the cells were fixed with 3% glutaraldehyde in 0.1 M sodium cacodylate buffer (SCB; pH 7.2) for 2 h at room temperature. After fixation, the cells were rinsed in SCB, immobilized with 4% Agar in SCB, and postfixed with 1% osmiumtetroxide in SCB for 1 h at room temperature. Subsequently, the samples were rinsed with water, dehydrated in a graded ethanol series (70% ethanol contained 1% uranyl acetate [Chemapol, Prague, Czech Republic]), infiltrated with epoxy resin according to Spurr, and polymerized at 70°C for 24 h. 31
Ultrathin sections (80 nm) were made with an Ultracut R ultramicrotome (Leica, Wetzlar, Germany). Sections were poststained with uranyl acetate and lead citrate in an EM-Stain apparatus (Leica) and subsequently observed with an EM 900 transmission electron microscope (Carl Zeiss SMT, Oberkochen, Germany). Micrographs were taken with a Variospeed SSCCD (Tröndle, Moorenweis, Germany).
Cell seeding and cultivation in scaffolds
A suspension volume of 1.0 mL, containing 1.5 million labeled or nonlabeled cells in DMEM, was gradually dropped on the lateral surface area or into the central hole of a dry scaffold. After soaking up the cell suspension, the scaffold was transferred into a well of a six-well plate and cultured in 8 mL DMEM. One day later, the sample was removed into a new well with fresh medium. Medium exchange was performed three times a week.
Histological sections of colonized scaffolds
After 4 weeks of cell cultivation, the samples were fixed in 4% buffered formalin solution for 2 h, dehydrated in an ascending alcohol series, and embedded in paraffin. Thin sections (5 μm) were prepared by means of a microtome (Microm HM340E, Thermo Fisher Scientific Inc., Walldorf, Germany) and transferred on glass slides. The paraffin was removed by incubation in Roti-Histol, followed by sample rehydration in a descending alcohol series. The sections were stained and subsequently embedded like the samples for the light microscopic examination of labeling efficiency.
Results
Hollow cylinder scaffolds with a height of 30 mm, an outer diameter of 8 mm, and a central hole with 1.7 mm in diameter were produced (Fig. 1). The calculated mass fractions (w/w) of the scaffold components were 27.7% chitosan, 27.7% collagen, and 44.4% HA. An average pore size of around 5 to 50 μm was estimated from scanning electron microscopic images (data not shown). The calculated pore volume fraction was approximately 99%.
Scaffold properties investigated by MRI
The intended inhomogeneity of the HA/collagen composite distribution inside the scaffold resulting from the modified production was observed using MRI. The 3 min delay before freezing caused a higher composite concentration in one site of the hollow cylinder scaffold, visible as a brighter area in the MR image (Fig. 2).
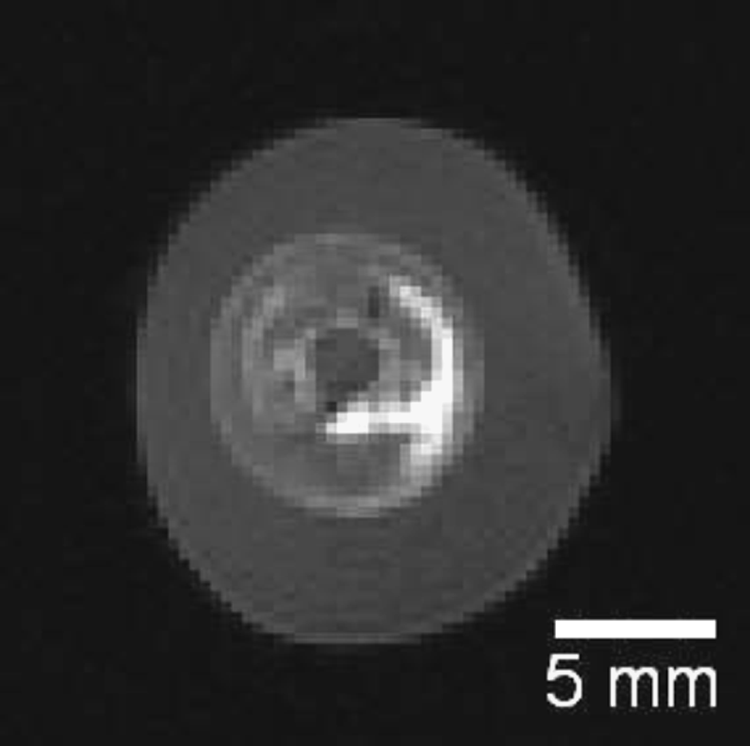
MR image of the scaffold with inhomogeneous distribution of the HA/collagen composite material. Bright areas represent regions of higher HA concentration.
The results of the dynamic contrast agent–enhanced MRI experiments are shown in Figure 3. It is obvious that the contrast relations in the images are strongly changing through the addition of the contrast agent. Before buffer exchange, the highest signal intensity was generated by the protons of bound water inside the scaffold, visible as more bright area in the MR image. After replacing the buffer by Gd-DTPA buffer, the inverse situation was observed. The water protons of the surrounding medium have generated higher signal intensity because of the presence of the positive contrast agent Gd-DTPA, which reduces the T1 relaxation time of the water protons drastically. The delay of the contrast agent penetration into the scaffold is indicated by its darker appearance. Through the progression of the Gd-DTPA penetration, the intensity of the signal within the scaffold enhances. Hence, the contrast decreases, as observed in the images of the following time periods. An acceleration of the contrast agent penetration for the perforated scaffold compared to the nonperforated one can be assumed from the images (Fig. 3). About 1 h after the Gd-DTPA buffer addition, almost complete permeation of the perforated scaffold is apparent. In the nonperforated scaffold, more or less contrast agent–free regions can still be seen as dark spots after 1 h.
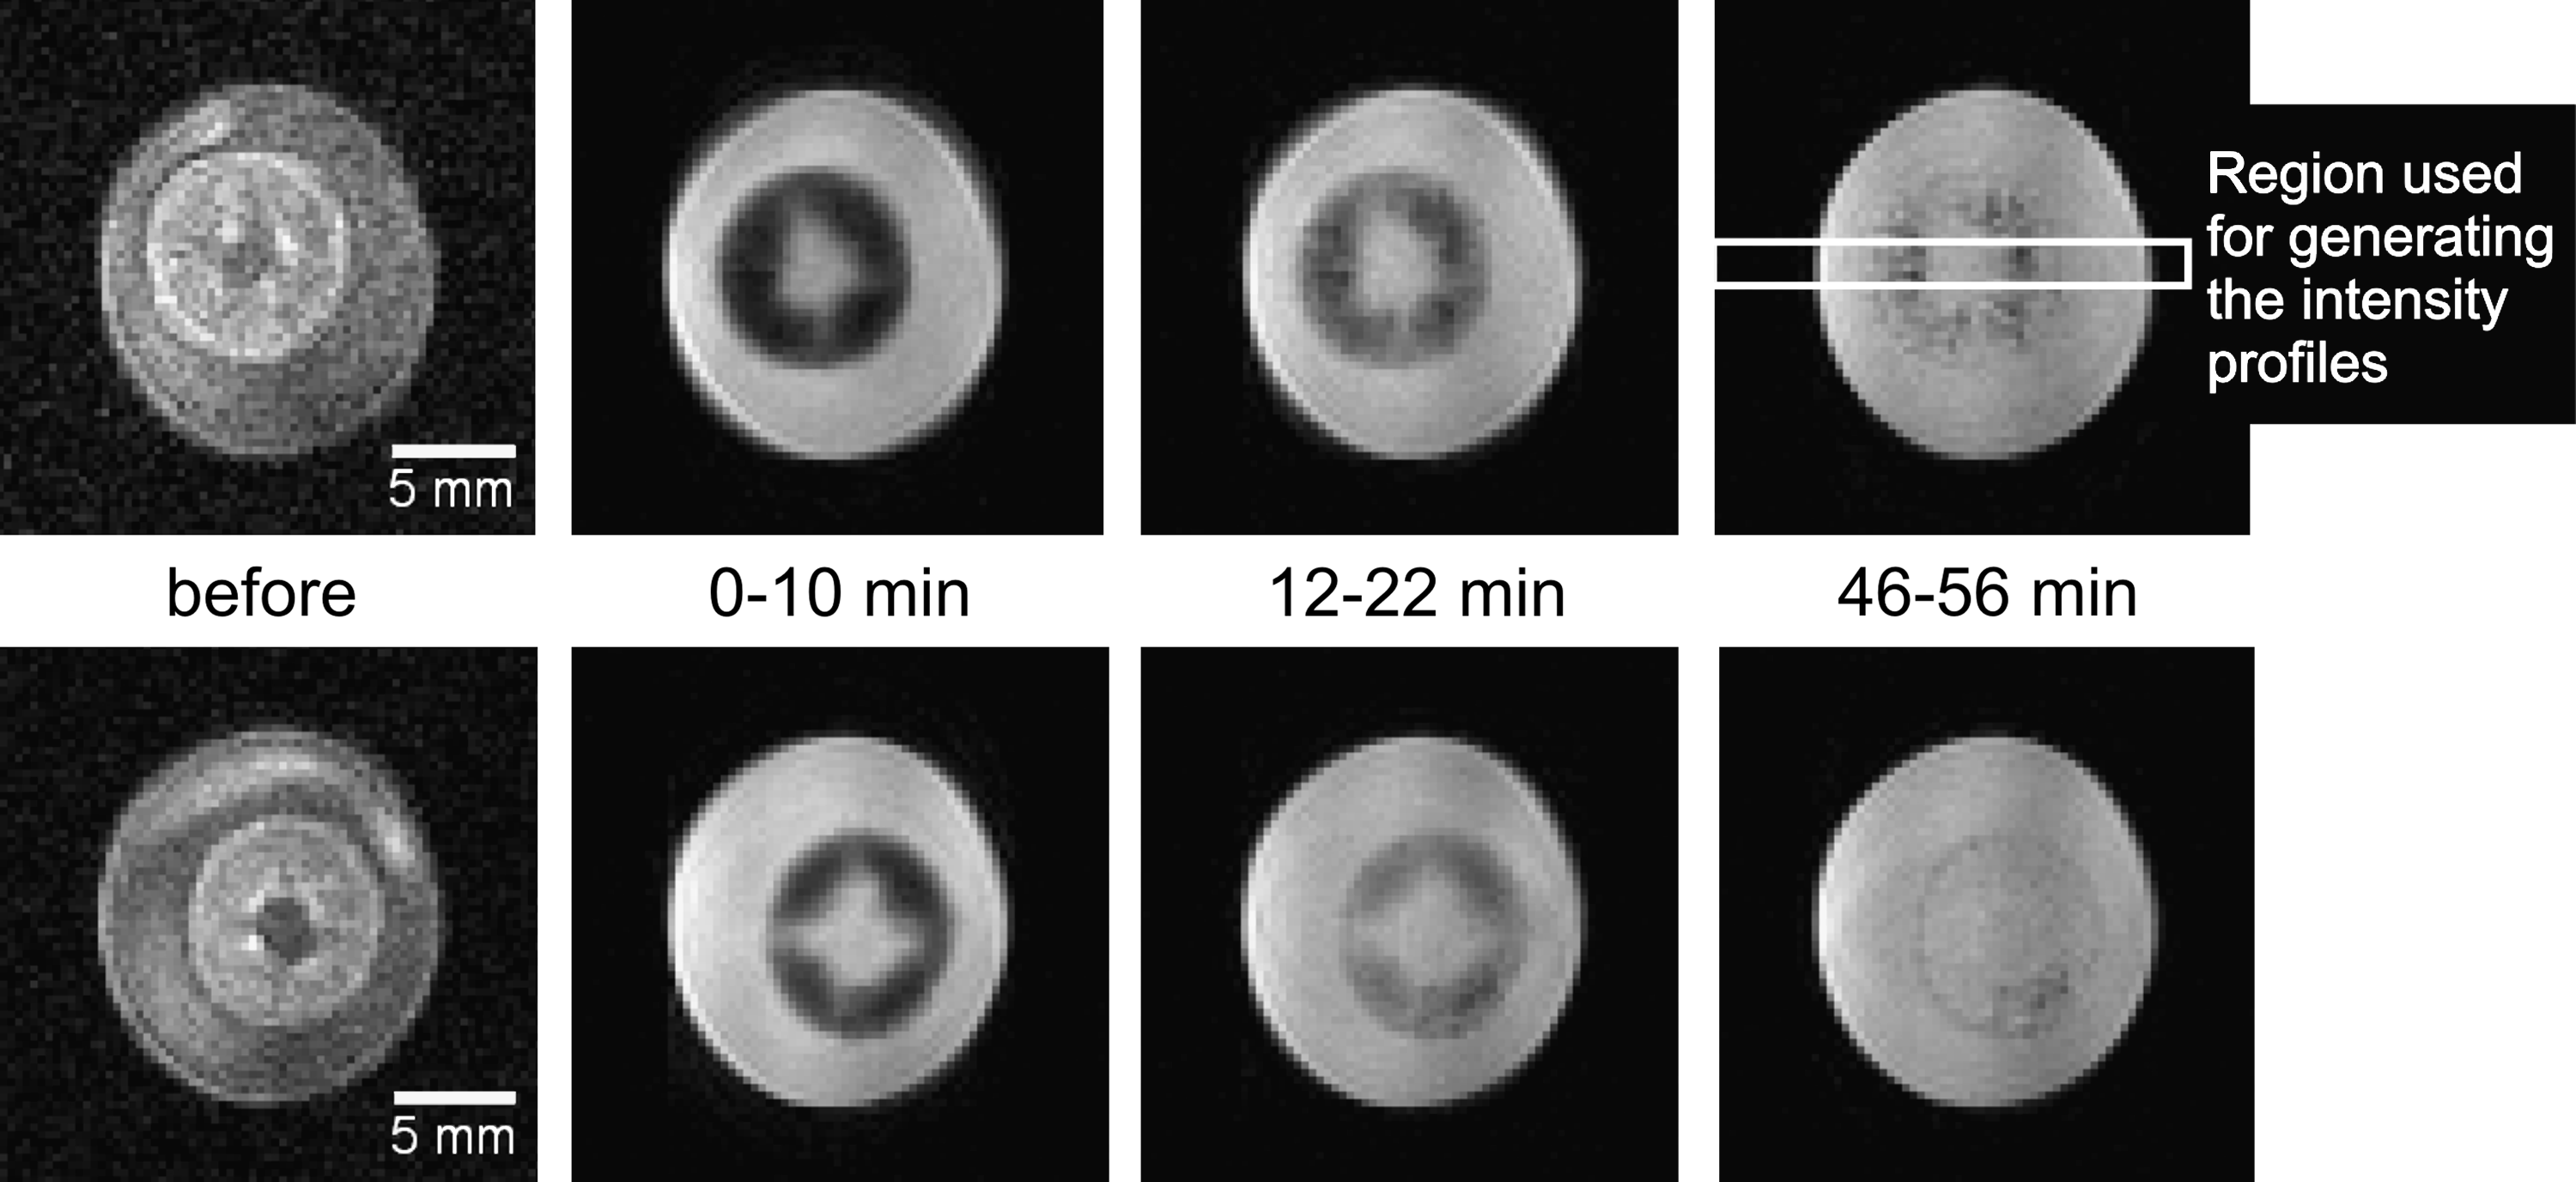
Penetration of Gd-DTPA into scaffolds. MR images averaged before and at different time periods after the contrast agent addition. Top row, not perforated scaffold; bottom row, perforated scaffold.
The profiles also show the equalization between the intensities of the buffer and the scaffold by time, reflecting the contrast decrease in the images (Fig. 4). The declining signal intensity of the buffer is caused by the concentration decrease of the contrast agent. This is caused by Gd-DTPA–free buffer leaving the scaffold during the experiment, whereas the signal enhancement of the scaffold is the result of the proceeding penetration of Gd-DTPA. After 1 day of incubation with the contrast agent, there are still differences in the signal intensity between the scaffold and the surrounding medium. Nevertheless, these profiles are representative for the stage of the full penetration into the matrix. The reason for the differences in the signal intensity is the density effect of the scaffold. In other words, the volume taken up by the scaffold material is not accessible for protons and Gd-DTPA, which are responsible for the intensity. The differences between the perforated scaffold and the nonperforated one become more obvious in the profiles. The intensity values for the perforated scaffold at around 1 h and at 1 day after the contrast agent addition are nearly the same. In the profiles of the nonperforated sample an alteration of the intensities is still visible between these time points, representative for the incomplete penetration after 1 h. Additionally, the intensity of the perforated scaffold at 12 to 22 min after the contrast agent addition has already reached around half of the rate between the 0 to 10 min and the 1 day values, whereas the intensity of the nonperforated scaffold has just one-third of the values between the same time points. Both observations indicate clearly the higher penetration velocity of Gd-DTPA into the perforated scaffold. The mass transport between scaffolds and surrounding medium can be estimated, revealing the duration of the hindered Brownian motion.
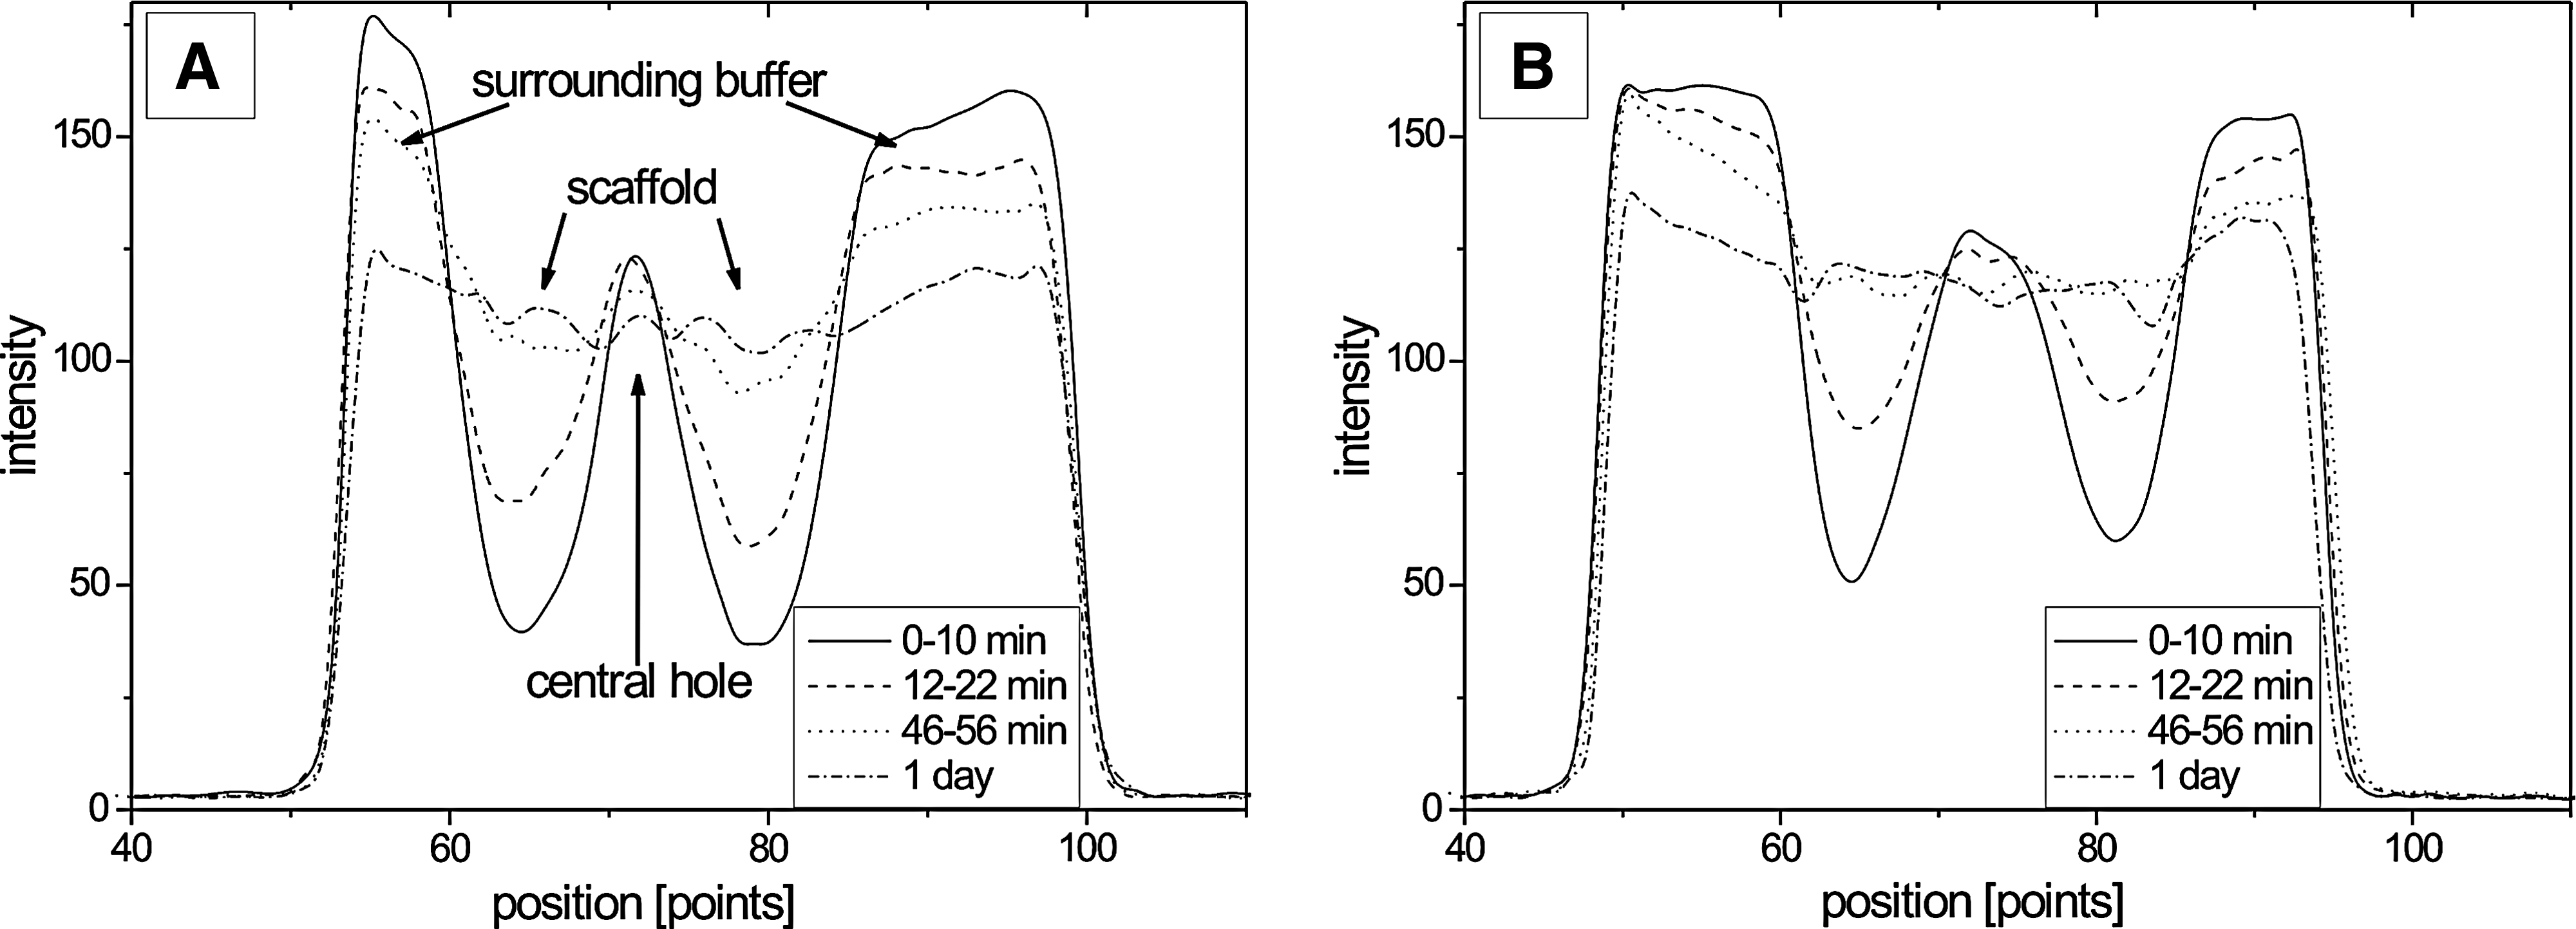
Penetration of Gd-DTPA into scaffolds. Intensity profiles averaged from 12 slices through each image of the different time intervals after the contrast agent addition. (
Efficiency of cell labeling
The Prussian blue–stained iron depositions appear blue in light microscopy. Because of the nuclear fast red counterstaining, cellular structures are red, and the cell nuclei are stained more intensely (Fig. 5). The absence of the blue inclusions in the nonlabeled cells indicates that the observed iron deposits in the labeled cells originate from the incubation with SPIO and PLL. The outspread cell shape in the images is related to the preparation technique using cells cultivated on the coverslips. In the electron microscopic images, a more round cell shape was observed, caused by trypsinization before glutaraldehyde fixation, preventing cell attachment to a surface. Dark units, indicating a more electron dense material, can be seen inside compartments of the labeled cells in the TEM image (Fig. 5). Regarding the dark appearance and the absence in nonlabeled cells, these spots are supposed to originate from iron oxide. Those particles are mainly attached to membranes of the compartments. Both microscopic techniques showed that the SPIOs were internalized into the MG63 cells by the applied labeling procedure.
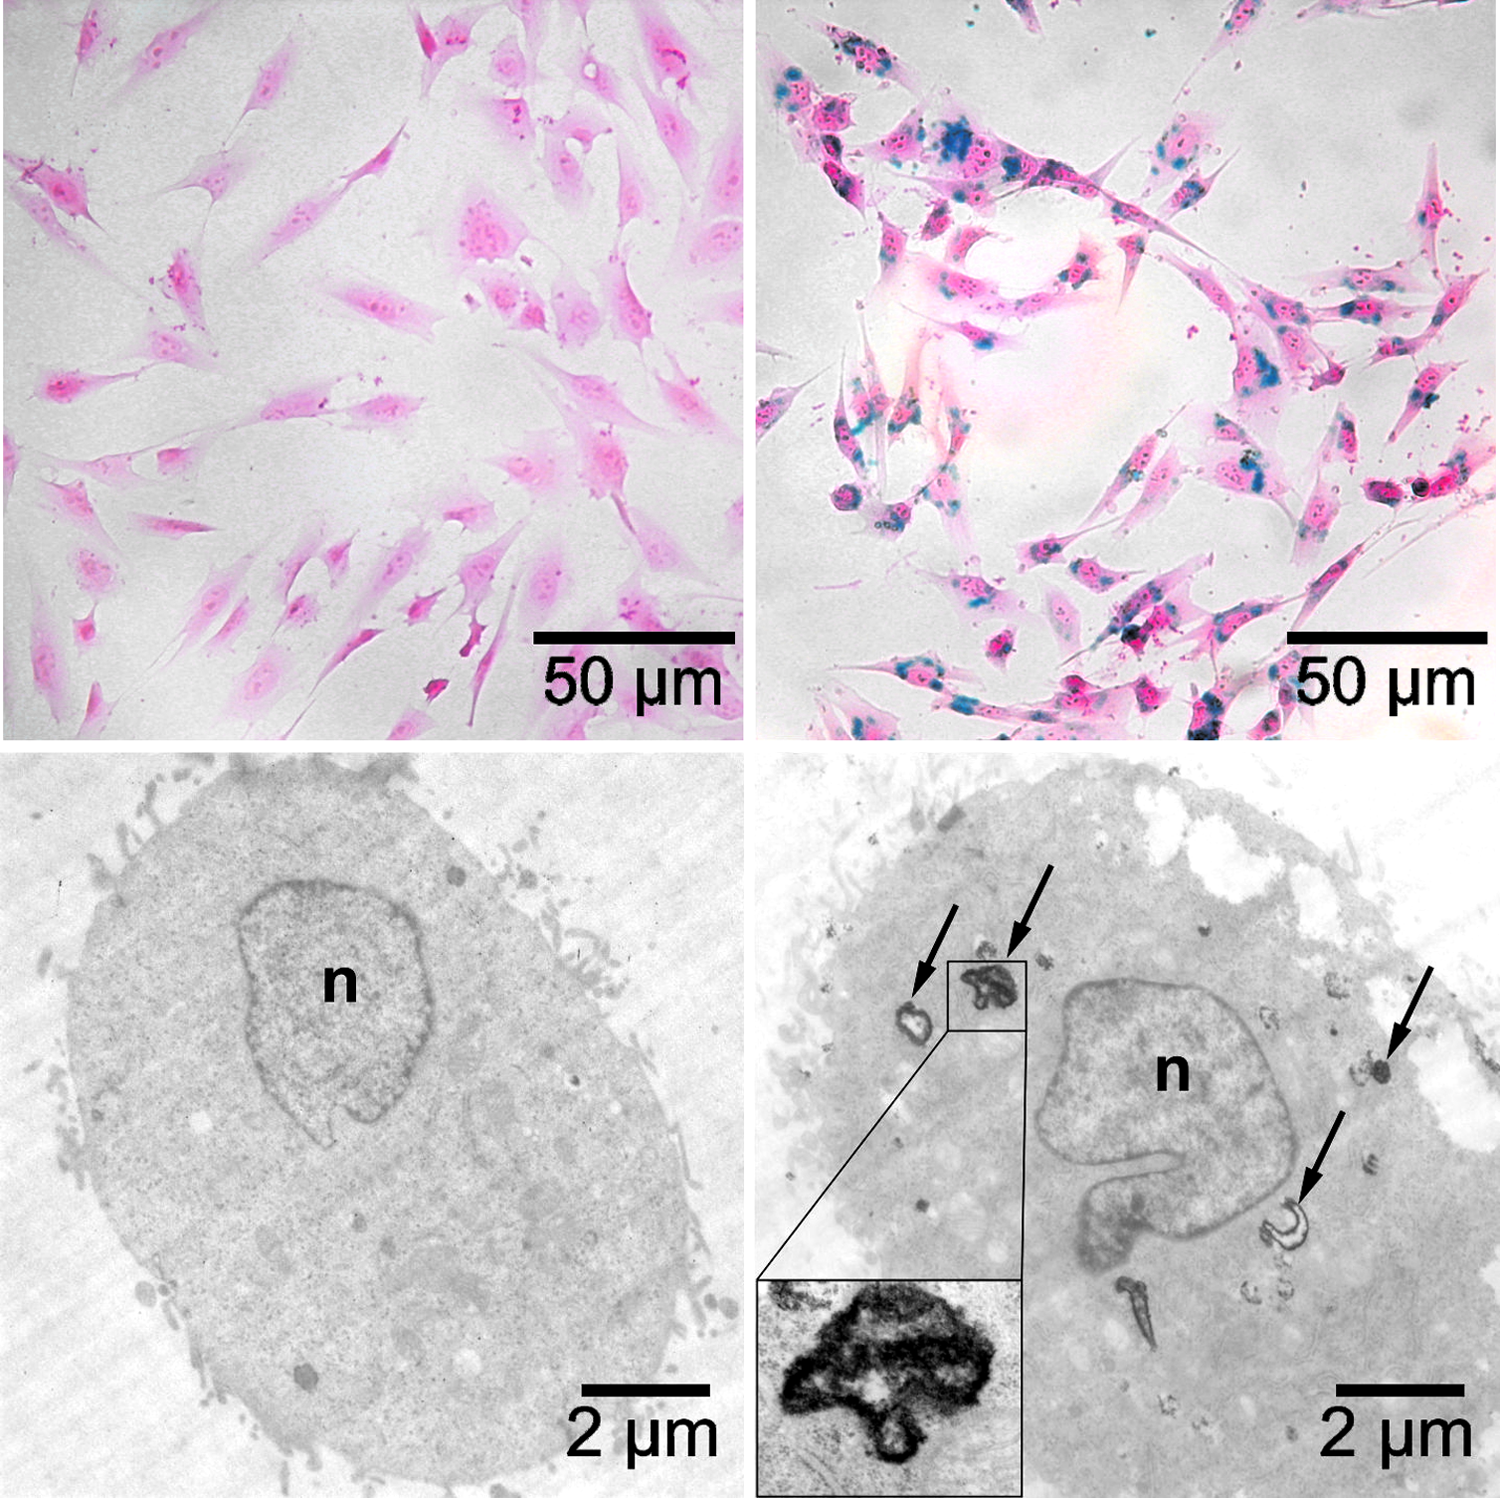
(Top) Light microscopic images of MG63 cells stained with Prussian blue and counterstained with nuclear fast red. (Bottom) TEM images of MG63 cells: left, nonlabeled control; right, SPIO-labeled cells. Blue stain or arrows indicate the iron depositions. Color images available online at
Cell seeding and cultivation on scaffolds investigated by MRI
A comparison of MR images of cells seeded on the lateral surface area of the hollow cylinder scaffolds shows that only the magnetite-labeled cells can be seen (Fig. 6). The SPIOs act as the so-called negative contrast agents. Labeled cells appear as dark areas, while there is no contrast between the scaffold and nonlabeled cells. The MR images show that a homogenous cell distribution within the scaffold was not achieved. Even the seeding inside the central hole resulted in an accumulation of the cells on the inner surface area of the hollow cylinder (Fig. 7). For the scaffolds colonized on the lateral surface area, no growth or migration of cells into the matrices was observed by MRI even after 4 weeks of culture (Fig. 8).

MR images of scaffolds colonized with MG63 cells on the lateral surface area. Left, nonlabeled cells; right, SPIO-labeled cells.

MR image of a scaffold with SPIO-labeled MG63 cells seeded into the central hole.

MR images of the same scaffold colonized with SPIO/PLL-labeled MG63 cells on the lateral surface area after different time periods of culturing.
Histological sections of colonized scaffolds
The light microscopic image of the scaffold cross section shows that the predominant amount of cells and of iron depositions is located on the scaffold surface (Fig. 9). Inside the scaffold, in a distance of 400 to 500 μm from the surface, almost no cell or iron deposition can be seen. This result was confirmed by vital staining of cells with fluorescein diacetate and confocal laser scanning microscopy (see Supplemental Material, available online at
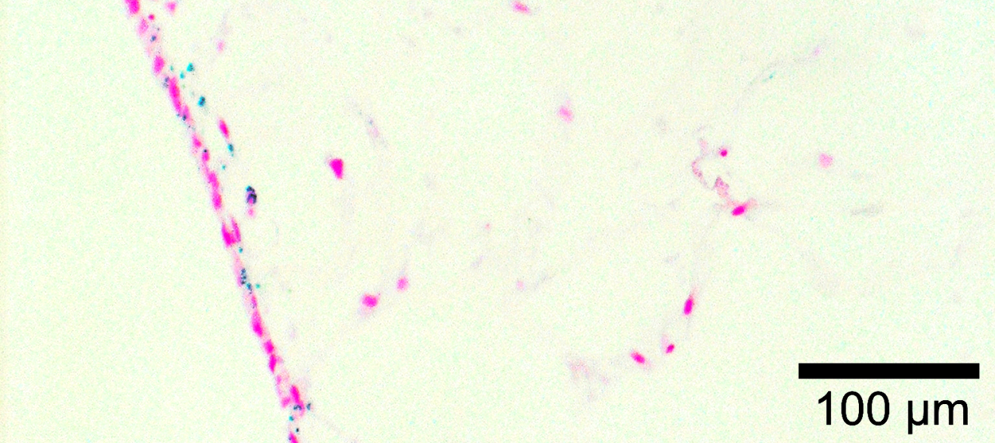
Light microscopic image of the border area of a scaffold cross section with SPIO-labeled MG63 cells colonized on the lateral surface area, stained with Prussian blue, and counterstained with nuclear fast red. Red stain indicates cell nuclei, and blue stain indicates iron depositions. Color images available online at
Discussion
It has been shown that BT-MRI is an excellent method to characterize scaffolds for tissue engineering applications for a number of reasons:
Certain inhomogeneities of scaffolds can be seen using MRI in case of HA. In the experiments, a higher HA concentration resulted in an increased signal intensity in T1-weighted MR images. In clinical MRI applications calcium deposits usually have no effect on signal intensity or even reduce it. Henkelman and coworkers investigated the influence of HA on the contrast relations in MR images and showed that this effect is depending on the concentration and the surface area of the calcium salt particles.
32
It is hypothesized that the signal enhancement in T1-weighted MR images is attributable to the interaction of water protons with the surface of the calcium salt particles.6,33 Appropriate to the bounded state on the crystal surface, the water protons relax more quickly than those distant from the particle, which results in a faster T1-relaxation process leading to enhanced signal intensity in the images.
7
Consequently, a higher concentration of HA would cause a more intensive signal, but there are two limitations. With the rising HA concentration, the proton density is decreasing and the T2 relaxivity is enhanced.
8
Both effects are contrary to the signal enhancement in T1-weighted MR images. A domination of the T1 decreasing effect is caused by a high surface area of the mineral phase, resulting in high signal intensity.
32
Hence, a small particle size of the incorporated HA could be responsible for the bright appearance of the locations with higher HA concentration in the obtained images. By small-angle X-ray scattering and environmental scanning electron microscopy, the particle size of the HA in the composite material was shown to be within the lower nm scale (data not shown). Additional to information about the HA distribution, BT-MRI may also provide hints about its surface area, but the concentration ranges for these analytics still have to be evaluated. BT-MRI can be used to measure mass transport between scaffold and surrounding media. It is well established that the pore size in scaffolds should be larger than 100 μm to prevent cells from deficiencies in oxygen and nutrient supply.
18
However, the pore size is typically measured microscopically in dry state. During incubation in culture medium or body fluids, many scaffold materials are in a swollen state. Hence, the actual space for diffusion processes may vary between two scaffold samples of the same nominal pore size because of different composition. Dynamic contrast agent–enhanced MRI experiments can provide more relevant data, because a direct observation of the velocity of mass transport throughout the matrix is obtained.
20
In this study, such processes inside the scaffold have been followed up by means of Gd-DTPA, achieving the proof of principle that dynamic contrast agent–enhanced experiments are feasible by BT-MRI. The enhancement of penetration by large interconnected pores was clearly demonstrated. Passive diffusion is sufficient for mass transfer from capillaries to cells over a distance up to 200 μm.
1
For more complex constructs, a vascularization of the matrices is essential as angiogenesis is a prerequisite for bone formation in general.
29
Large interconnected pores not only ensure the sufficient oxygen and nutrient supply and metabolite removal by passive diffusion, but also provide space for growing blood vessels. Experiments with contrast agents of higher molecular weight provide more insight in this field. The perfusion through a vascular system can be examined by macromolecular contrast agents, which are barely penetrating the endothelium of the vessels.
34
The migration of signaling proteins like growth factors throughout a matrix could also be simulated by this method delivering a contrast agent of comparable properties direct into the matrix. BT-MRI can be used to see local accumulations of labeled cells within scaffolds. In general, the sensitivity depends on the quality of the MRI apparatus and the contrast between the cells (their magnetite load) and the scaffold (water content and rigidity). Effective precultivation of scaffolds with cells is a precondition in many tissue engineering approaches for the development of artificial substitutes for human tissues.
2
Noninvasive analytical tools are required to gain insight into the cell distribution in these matrices. For the assessment of the cell position by BT-MRI after seeding, the magnetic cell labeling was shown to be obligatory. Nonlabeled cells cannot be seen using BT-MRI in aqueous culture media. The interaction of water protons in the cytoplasm with macromolecular cellular components does not sufficiently decrease the T1 relaxation time to obtain a visible contrast. Hence, an established protocol was modified and employed for cellular labeling by PLL as a transfecting agent and a clinically approved contrast agent.11,22 For most related studies, dextran-coated SPIOs have been used. The applicability of these particles in combination with the common transfecting agents is well approved and interferences altering cell viability, function, and differentiation can be precluded to a high extent.15,30 Only a few reports are available about cell labeling with the carboxydextran-coated SPIOs used in this study. The given iron concentrations vary between 0.9 and 933 μg/mL. Other experimental details, for example, incubation time, application of transfecting agent, and cell population, do also differ strongly in the literature.35–38
Compared with the established protocol for cell labeling with dextran-coated SPIOs, in our study a three- to fourfold higher concentration of iron oxides and a three to six times higher concentration of PLL were used.11,13,22 For further experiments, interferences altering cell viability, function, and differentiation have to be examined. Both methods applied for the investigation of the labeling efficiency showed that substantial amounts of the SPIOs were taken up by MG63 cells. In the TEM images, an endosomal accumulation of the SPIOs was visible, as already reported in the literature for other cell populations.11,30,39 For cell seeding on scaffolds the used “dropping on” technique is a common method. Usually, a prewetting of the scaffolds is necessary.40,41 Because of the good wettability of the chitosan–collagen–HA scaffolds, the cell suspension is soaked up by the dry matrix. By adjusting the volume of the cell suspension, a complete uptake by the scaffold is achieved. This procedure may increase the amount of adherent cells because an outflow of redundant cell suspension is avoided. The theoretically possible maximum cell load inside the scaffold of around 1000 cells/mm3 for 100% cell adhesion is below the typical range in tissue engineering approaches.22,40,41 For a cell distribution limited to the lateral surface, a density of around 2000 cells/mm2 was calculated. For a smooth surface, this would be already in the range of confluency. It was possible to monitor the result of the seeding procedure, revealing that the cells attach close to or on the surface and did not penetrate deeply into the scaffold, even after 4 weeks of further cultivation. A probable reason for this is the small pore size, which may keep the cells on the surface during seeding and also delimited the mass transfer during further cultivation.
3
Maybe this effect was enhanced by static culture conditions and cells on the surface shielding the scaffold.
Overall, the results show that scaffold properties, culture system, and seeding technique have to be improved whereby it is demonstrated that BT-MRI is the right equipment for this optimization task.
Conclusions
BT-MRI is a powerful tool for the characterization of scaffolds for tissue engineering applications in several aspects: first, to show the presence and distribution of MRI-positive materials within scaffolds; second, to follow the mass transfer between scaffold and surrounding liquids by dynamic contrast agent–enhanced MRI; and third, to show local accumulations of labeled cells within the scaffold with a nondestructive technique. The importance of noninvasive analyses of successful cell seeding on scaffolds and the more lab-oriented setup of BT-MRI compared to clinical scanners may lead this equipment to be a standard tool for optimization tasks in tissue engineering.
Footnotes
Disclosure Statement
The Martin Luther University Halle-Wittenberg has a project with Oxford Instruments on the development of BT-MRI.
References
Supplementary Material
Please find the following supplemental material available below.
For Open Access articles published under a Creative Commons License, all supplemental material carries the same license as the article it is associated with.
For non-Open Access articles published, all supplemental material carries a non-exclusive license, and permission requests for re-use of supplemental material or any part of supplemental material shall be sent directly to the copyright owner as specified in the copyright notice associated with the article.