
Abstract
Regenerative medicine requires noninvasive evaluation. Our objective is to investigate the application of time-resolved laser-induced fluorescence spectroscopy (TR-LIFS) using a nano-second-pulsed laser for evaluation of tissue-engineered cartilage (TEC). To prepare scaffold-free TEC, articular chondrocytes from 4-week-old Japanese white rabbits were harvested, and were inoculated at a high density in a mold. Cells were cultured for 5 weeks by rotating culture (RC) or static culture (SC). The RC group and SC group at each week (n = 5), as well as normal articular cartilage and purified collagen type II (as controls), were analyzed by TR-LIFS. The peak wavelength was compared with those of type II collagen immunostaining and type II collagen quantification by enzyme-linked immunosorbent assay and tensile testing. The fluorescence peak wavelength of the TEC analyzed by this method shifted significantly in the RC group at 3 weeks, and in the SC group at 5 weeks (p < 0.01). These results correlated with changes in type II collagen (enzyme-linked immunosorbent assay) and changes in Young's modulus on tensile testing. The results were also supported by immunohistologic findings (type II collagen staining). Our findings show that TR-LIFS is useful for evaluating TEC.
Introduction
Materials and Methods
TR-LIFS setup, spectroscopic measurements, and data analysis
Figure 1 depicts the experimental setup. The beam was concentrated with a lens attached to a quartz fiber with a core diameter of 400 μm. Fluorescence was induced using the third harmonic wave of a Q switch Nd:YAG laser (wavelength 355 nm, frequency 5 Hz). The pulsed laser was directed onto the sample at a 45° angle of incidence, with a beam diameter of about 5 mm, through a laser transmission optical fiber. Induced fluorescence was collected perpendicularly to this beam. Distance between the probe and sample was 20 mm. The output energy of the optical fiber was adjusted to 50 μJ/pulse, 3 which is substantially lower than the biological damage threshold. Time-resolved fluorescent spectroscopy of the fluorescence induced by pulsed laser was obtained using a photonic multi-channel analyzer with an image intensifier detector coupled to a charge coupled device (CCD) camera (wavelength range, 200–860 nm; resolution, 3 nm; gate time, 10 ns). Samples were washed with purified water, and at room temperature, each sample was subjected to measurement at 10 locations.1–5 We used a sharp cut filter to intercept excitation light (SCF-50S-38L; Sigma–Koki, Tokyo, Japan).
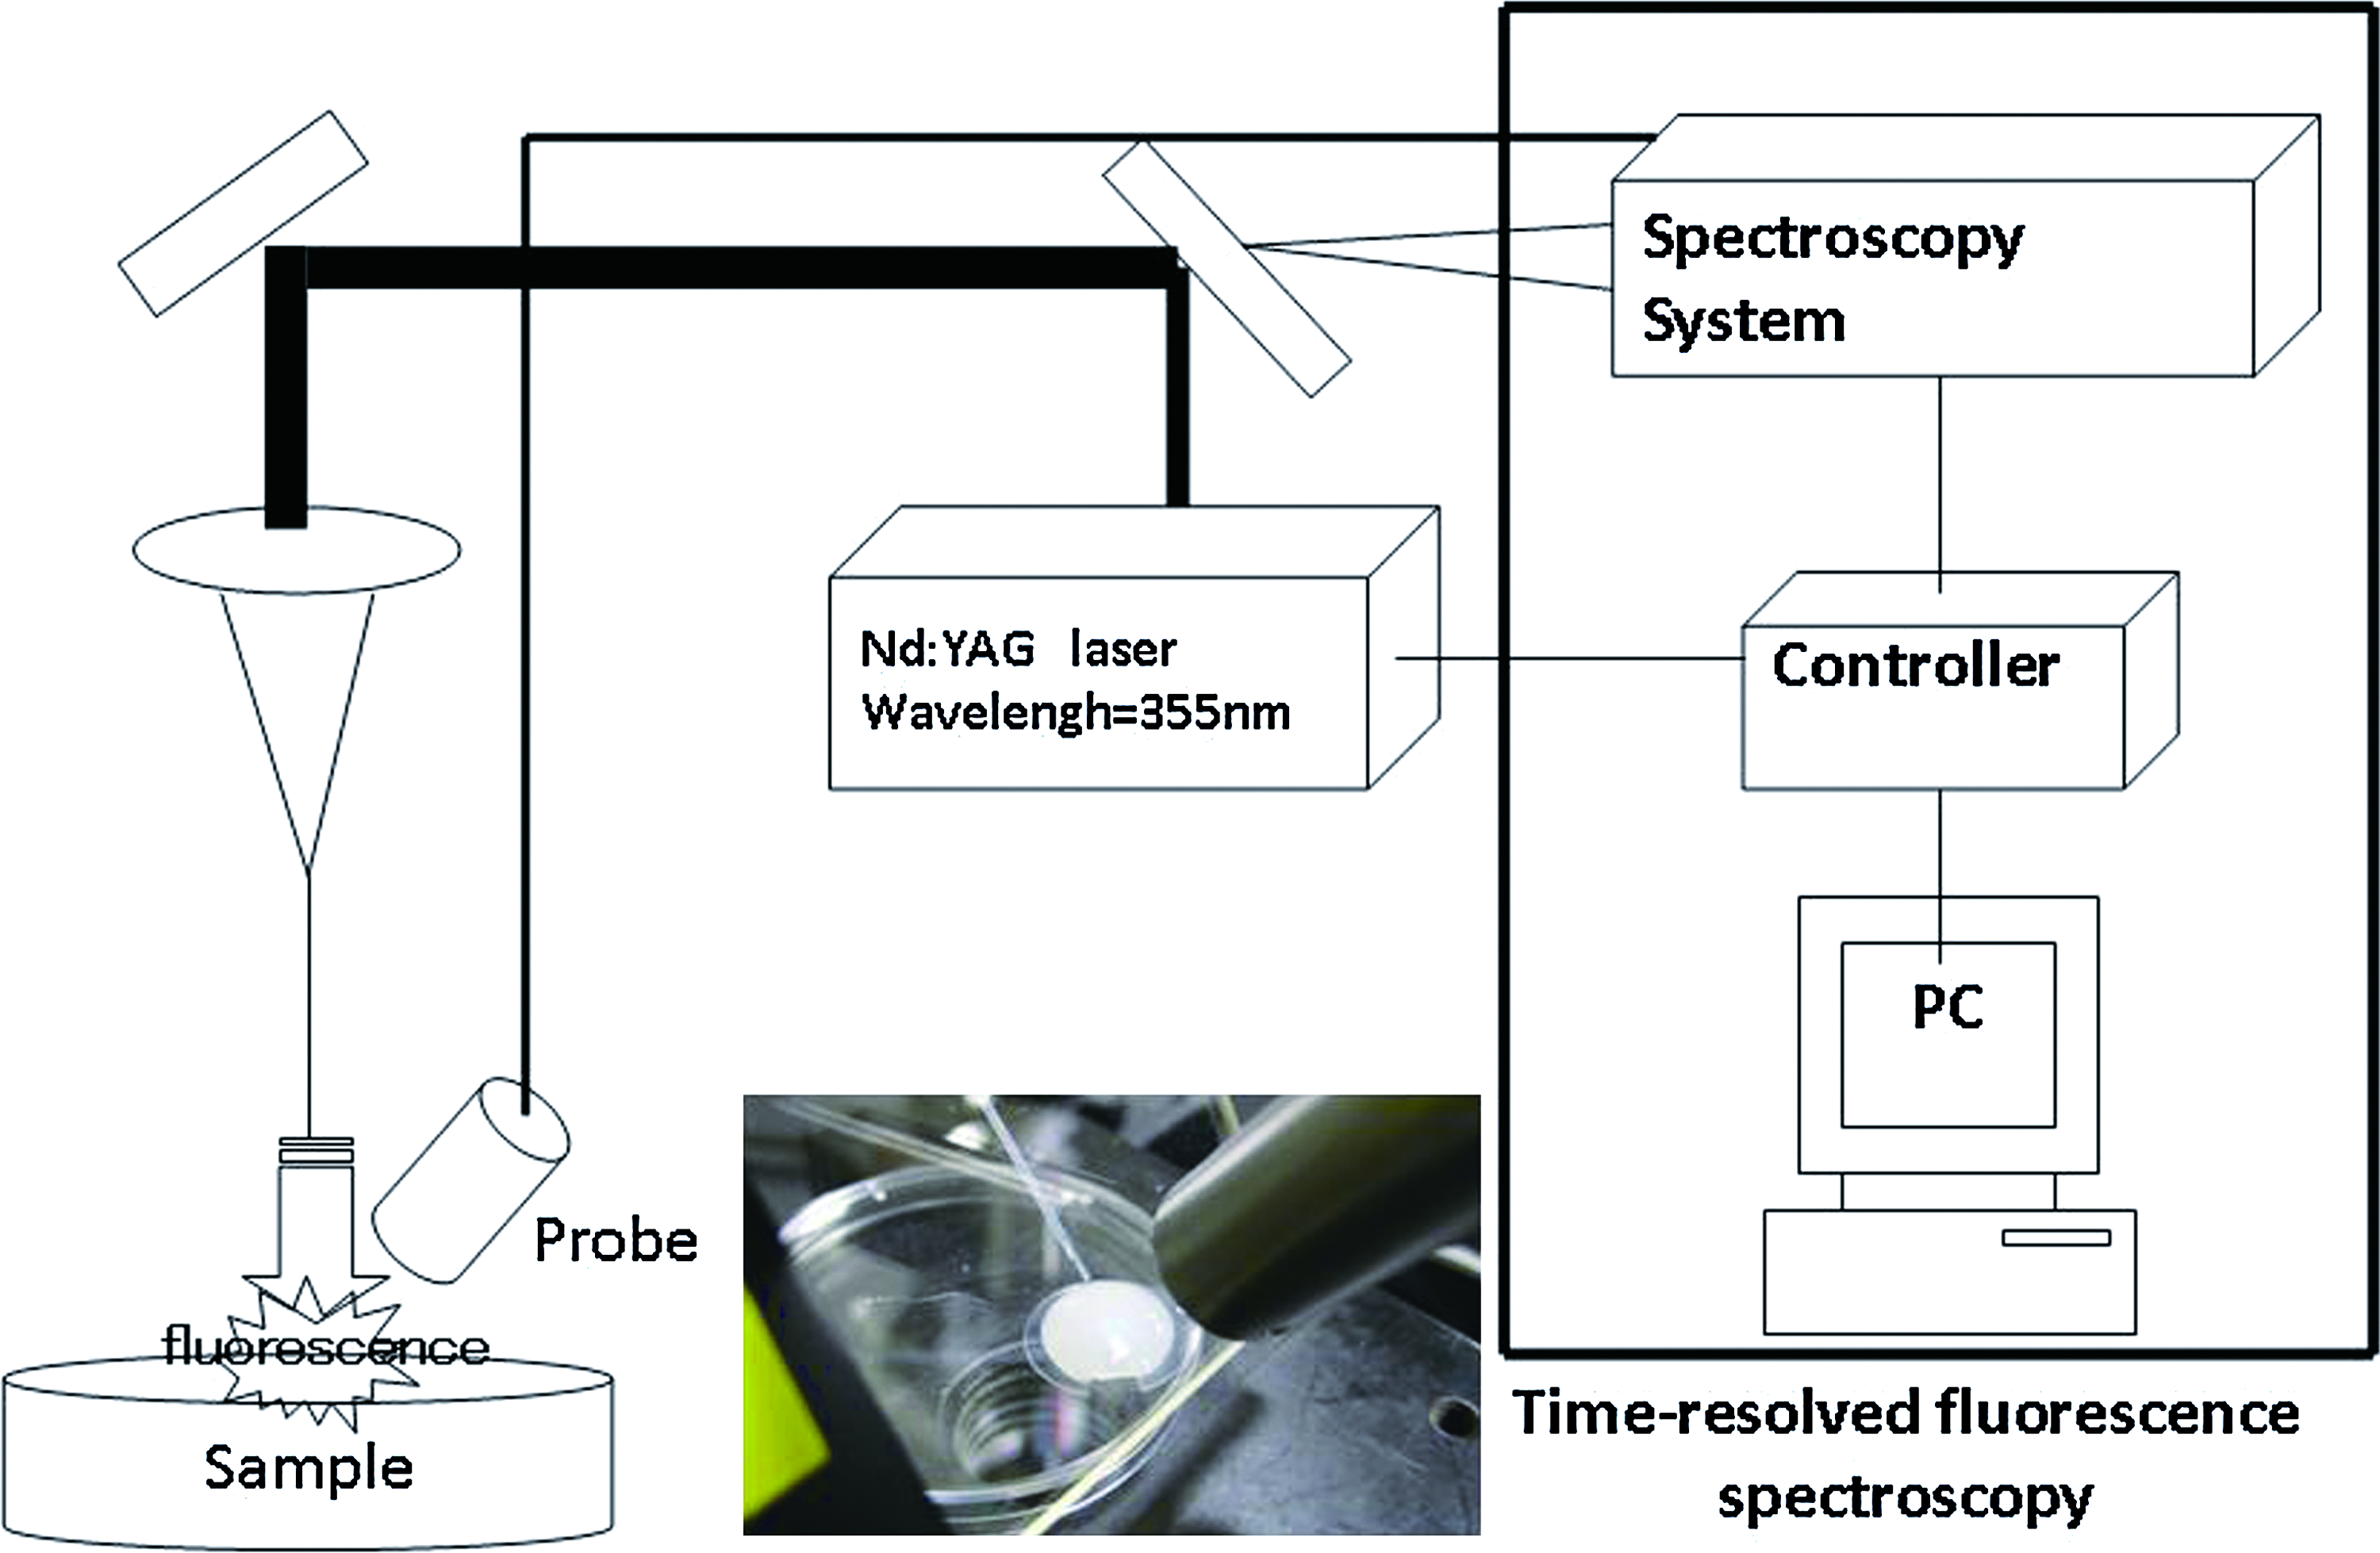
System for fluorescent measurement. Time-resolved fluorescent spectroscopy was performed using a photonic multi-channel analyzer with a 4-Ch digital signal generator. The fluorescent features of the developed measurement system are as follows: wavelength range, 200–860 nm; wavelength resolution, <3 nm; exposure time, 19 ms; gate time, 10 ns. The parameters of measured fluorescence obtained using MatLab software were peak wavelength at fluorescence maximum, fluorescent spectral bandwidth at half-maximal amplitude (FWHM), and integrated intensity of time-resolved spectrum. Color images available online at
The measured fluorescence was displayed in 3D, and peak wavelength was used as parameters. All calculations were performed using MatLab software (MathWorks Inc., Natic, MA).
Cell culture
Articular chondrocytes were harvested from the shoulders and knees of 4-week-old Japanese white rabbits weighing about 1 kg (n = 12). Cartilage was digested in Dulbecco's modified Eagle's medium (DMEM/F12; Gibco–Invitrogen, Carlsbad, CA) containing 0.4% (w/v) actinase E (Kaken Pharmaceutical, Tokyo, Japan) for 1 h, and in DMEM/F12 containing 0.016% (w/v) bacterial collagenase P (Roche Diagnostics GmbH, Mannheim, Germany) for 3 h. The digested cartilage was passed through a 70-μm cell strainer (Becton Dickinson Labware, Franklin Lakes, NJ) and was centrifuged at 1500 rpm for 5 min. The pellet was suspended in DMEM/F12, 10% fetal bovine serum (Gibco, Invitrogen Corporation, Carlsbad, CA), 100 U/mL penicillin (Gibco), 100 μg/mL streptomycin (Gibco), 0.25 μg/mL fungizone (Gibco), and 50 μg/mL ascorbic acid (Wako Pure Chemical Industries, Osaka, Japan). Chondrocytes were inoculated on 500-cm2 dishes at 1 × 10⁴ cells/cm2 and cultured at 37°C with 5% CO2 and 95% humidity. After 1 week, the primary culture cells (P0) (70% confluence monolayer) were detached using 0.05% trypsin/EDTA (Gibco) at 37°C for 10 min. Cells were then washed with phosphate-buffered saline (PBS), resuspended in medium, and cultured at 1 × 10⁴ cells/cm2 for two passages. Medium was replaced every 3 days.15,16
Cartilage tissue formation
Second-passage chondrocytes were resuspended at a density of 1.0 × 10⁷ cells/mL in DMEM/F12, 20% fetal bovine serum (Gibco), 100 U/mL penicillin (Gibco), 100 μg/mL streptomycin (Gibco), 0.25 μg/mL fungizone (Gibco), and 50 μg/mL ascorbic acid (Wako Pure Chemical Industries). Cylindrical glass molds (diameter, 10 mm; height, 10 mm) were placed into a culture insert with a pore size of 0.4 μm (Corning Costar Japan, Tokyo, Japan) to permit oxygen and nutrient diffusion. First, 15 mL of culture medium was added under the culture insert, and 15 mL of culture medium was added onto the culture insert. Next, 0.6 mL of the cell suspension was inoculated onto the mold, and was allowed to stand for 30 min. Gravity-assisted sedimentation of the cell suspension on the insert was confirmed, and about 30 mL of culture medium was then added to the culture insert until the mold was completely filled. This was cultured for 8 h at 37°C under 5% CO2 and 95% humidity. The mold was then removed, and the cell mass (chondrocyte plate) with a form similar to the mold was cultured for 7 days under the same conditions. Constructs, shaped like the mold, were removed using a medicine spoon and moved to a nonadherent six-well culture dish, where they were cultured with 6 mL of medium per plate. Rotating culture (RC) was performed for 5 weeks using an orbital shaker (Taitec; 70 rpm; turn radius, 25 mm). Static culture (SC) and RC were performed at 37°C under 5% CO2 and 95% humidity. Culture medium was replaced every 3 days.15,16
Fixation and sectioning
Samples were washed with PBS and fixed in 4% formalin solution. After ethanol dehydration, samples were immersed in isoamyl alcohol, embedded in paraffin, cut into 4-μm sections, and stained with safranin-O and toluidine blue for proteoglycans. Sections were deparaffinized for immunohistochemistry using standard procedures. Sections were then treated with 0.005% proteinase (type XXIV; Sigma–Aldrich, St. Louis, MO) for 30 min at 37°C before incubation with primary antibody. After the slides were washed with PBS, endogenous peroxidase activity was blocked with 0.3% hydrogen peroxide in methanol for 15–20 min at room temperature. Next, sections were rinsed with PBS and incubated with normal goat serum (diluted 1:20 in PBS) for 30 min at room temperature. Primary mouse monoclonal antibody directed against human collagen types I and II (Daiichi Fine Chemical, Toyama, Japan) was diluted 1:200 in PBS–1% bovine serum albumin (BSA; Sigma Aldrich, St. Louis, MO). Slides were incubated overnight at 4°C, washed 10 times with PBS, and incubated with biotin-conjugated goat anti-mouse secondary antibody (diluted 1:100 in PBS-1% BSA) in a humidified chamber for 1 h at room temperature. Slides were then treated with horseradish peroxidase–labeled streptavidin (streptavidin–horseradish peroxidase) for 1 h. Finally, slides were immersed in a 0.05% solution of diaminobenzidine in Tris-HCl buffer (pH 7.6) containing 0.005% hydrogen peroxide for 2–4 min until the color developed. To improve cell observation, the slides were counterstained with Mayer's hematoxylin. Transverse sections were observed and recorded with an inverted microscope and digital camera (objective lens, × 20).
Biochemical analysis
Type II collagen ELISA
Wet weight and weight after freeze-drying were measured to calculate moisture content. The freeze-dried sample and 0.5 mL of cold distilled water were added to an Eppendorf tube and incubated overnight at 4°C. The sample was centrifuged (10000 rpm, 3 min), and the supernatant was removed. Next, 0.5 mL of 3 M guanidine/0.5 M Tris-HCl (pH 7.5) was added to the sample tube, and this was mixed on a rotator/rocker overnight at 4°C. The sample was homogenized using a small electric homogenizer and centrifuged (10000 rpm, 3 min). The precipitate was washed with cold distilled water, and was then resuspended in 0.8 mL of 0.05 M acetic acid containing 0.5 M NaCl (adjusted to pH 2.9–3.0 with formic acid). Next, 0.1 mL of pepsin (10 mg/mL) dissolved in 0.05 M acetic acid was added and mixed, and this was incubated at 4°C for 48 h. Then, 0.1 mL of 10 × TBS (1.0 M Tris-2.0 M NaCl-50 mM CaCl2, pH 7.8–8.0) was added (adjusted to pH 8.0 with 1 N NaOH). In addition, 0.1 mL of pancreatic elastase (1 mg/mL dissolved in 1 × TBS, pH 7.8–8.0) was added, followed by mixing on a rotator/rocker overnight at 4°C. The sample was centrifuged (10000 rpm, 5 min), and the supernatant was collected. Type II collagen was assayed by ELISA (Native Type II Collagen ELISA Kit, Catalogue No. 6009; Chondrex NE, Redmond, WA) according to the manufacturer's protocol. ELISA samples were measured by spectrophotometry at 490 nm. The results were compared with the standard curve for type II collagen in the kit.
Measurement of thickness and tensile properties
Sample thickness was measured using a digital micrometer (minimum display, 0.001 mm; error, ± 1 μm; degree of parallelization, 1 μm). Tensile testing was performed with the sample set in a grip and at a pulling speed of 4 mm/min. Young's modulus was calculated from the slope of the linear portion of the load–deflection curve.
Statistical analysis
Samples were divided into the SC and RC groups, with comparisons at each week. All data are shown as means ± standard error (SE). Factorial analysis of variance was used for comparisons. Each significant difference on analysis of variance was analyzed by multiple comparison using Scheffe's test. The level of statistical significance was p < 0.01.
Results
Macroscopic appearance
The TEC after 1 week of primary SC retained a form similar to the mold (Fig. 2A). However, after removal from the culture medium, this shape could no longer be maintained (Fig. 2E). With RC and SC, thickness of the chondrocyte plate increased with culture duration (Fig. 2B–D). After 2 weeks of culture, the construct retained its shape even when handled with forceps (Fig. 2F, G).
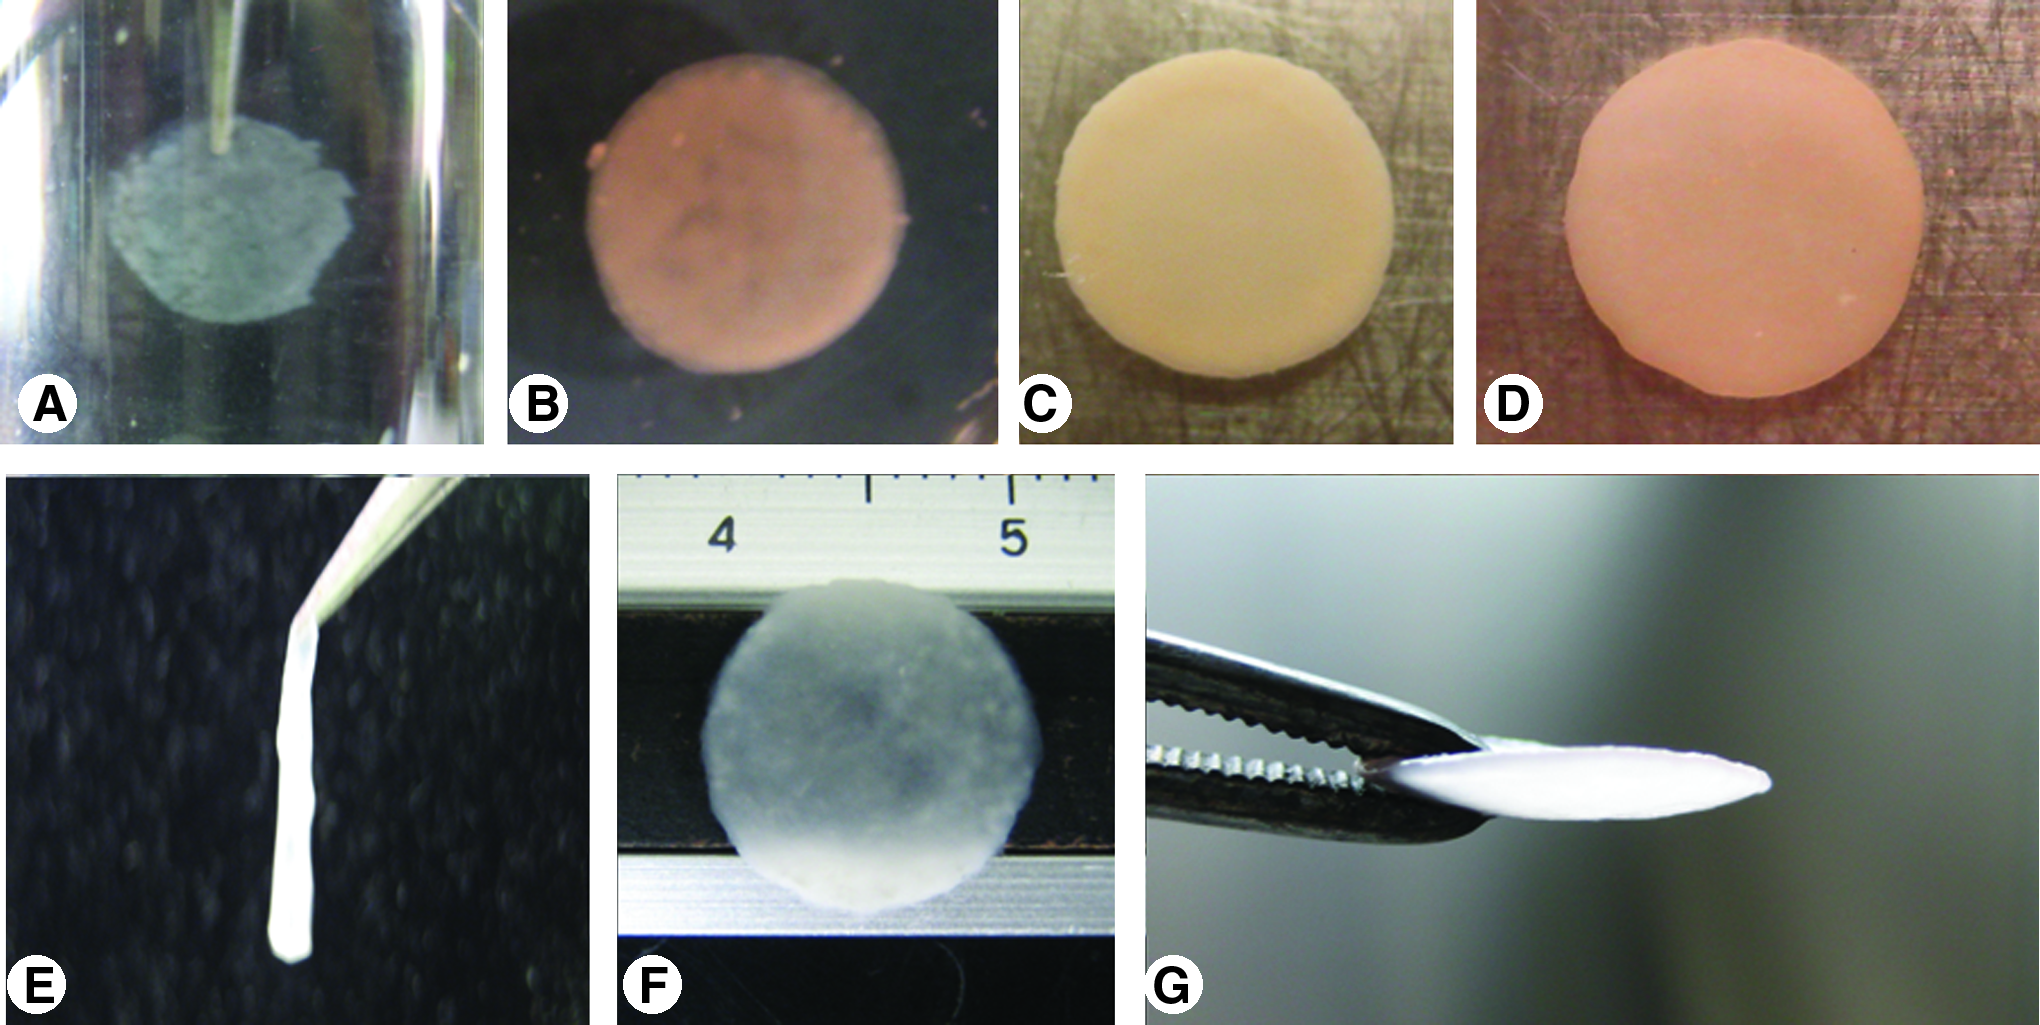
Macroscopic appearance of the chondrocyte plate, which formed after 7 days of primary static culture (SC) (
Histology and immunohistochemistry
Figures 3-1H and 3-2H show the normal articular cartilage of knee from 4-week-old Japanese white rabbits. Figure 3-1A shows the toluidine blue staining during the primary 1 week of SC. Cells are uniformly distributed, and the ECM also stains uniformly. In the SCs at 1, 3, and 5 weeks (Fig. 3-1B, B′, C, C′, D, D′); as compared with rotational cultures at 1, 3, and 5 weeks (Fig. 3-1E, E′, F, F′, G, G′); cell distribution was uneven, cell density was lower, and numerous enlarged cells were observed. In addition, staining was uneven near the surface and, overall, tended to be weaker. On the other hand, in the rotational cultures at 1, 3, and 5 weeks (Fig. 3-1E, E′, F, F′, G, G′), cell distribution was uniform, and cell morphology was nearly uniform, with only a few enlarged cells. Further, staining, with the exception of superficial fibroblastic cells, was uniform and tended to be stronger. The superficial fibrous layer, compared to the SCs (Fig. 3-1B, B′, C, C′, D, D′), was thicker and increased in thickness with culture duration (weeks). For the initial 1 week of SC, the SCs at 1, 3, and 5 weeks (Fig. 3-1B, B′, C, C′, D, D′), the rotational cultures at 1, 3, and 5 weeks (Fig. 3-1E, E′, F, F′, G, G′), and the staining characteristics for safranin-O were similar. In the SC group, immunostaining for type II collagen did not clearly differ up to 3 weeks of culture, but at 5 weeks of culture, staining was intense. In the RC group, staining did not clearly differ up to 2 weeks of culture, but staining was intense by 3 weeks of culture and remained so at week 5. In addition, overall staining for type II collagen, as compared to the SC group, tended to be more uniform and intense (Fig. 4). The results were similar to safranin-O and toluidine blue staining.
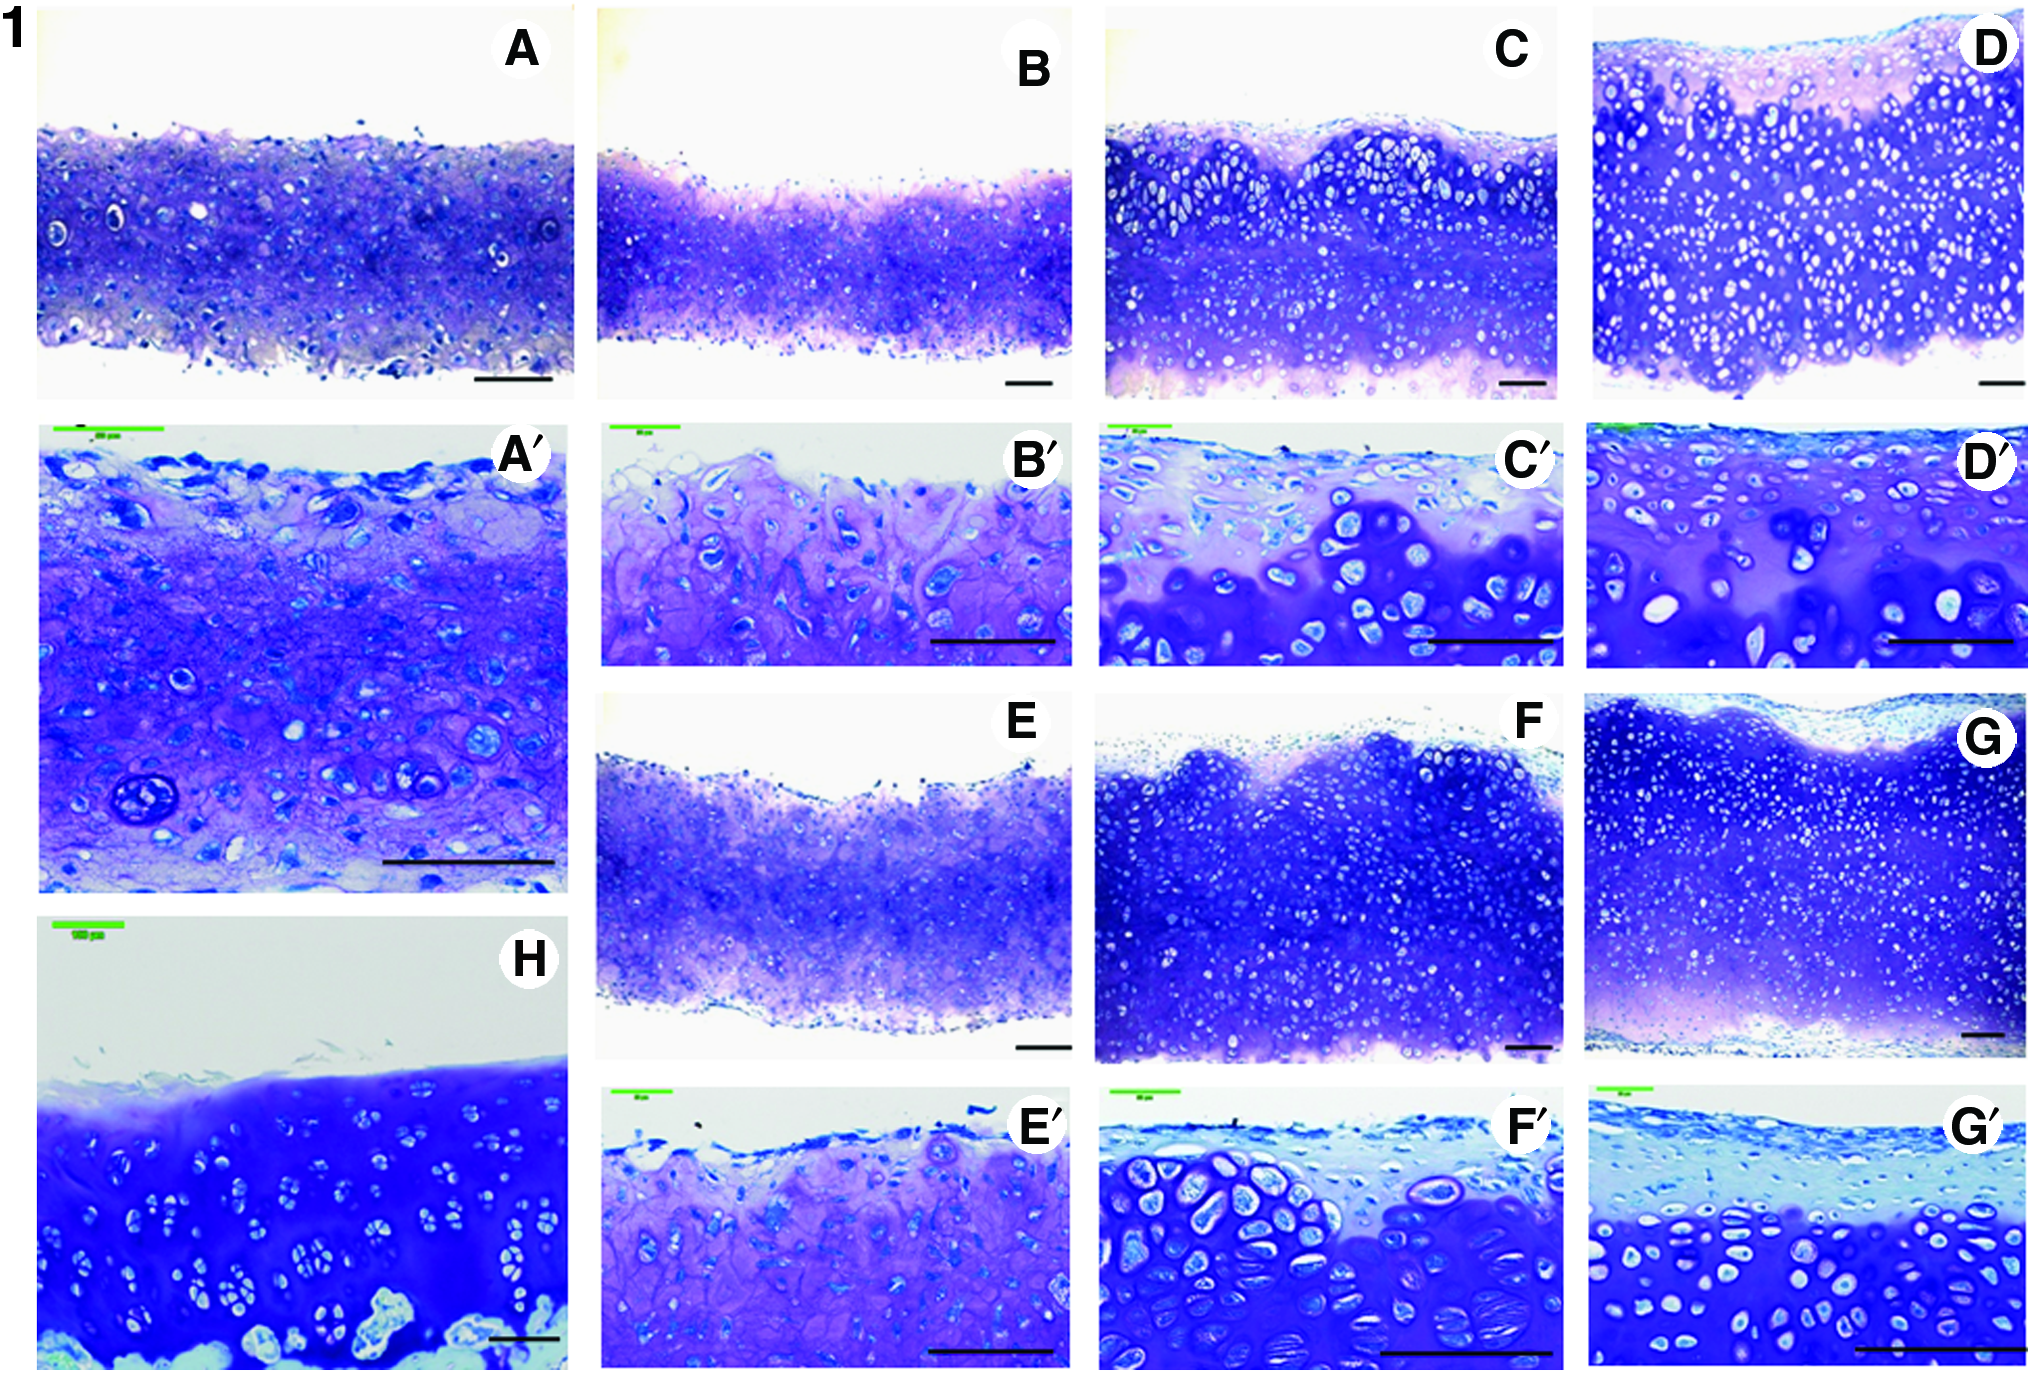
Distribution of proteoglycans was investigated. Chondrocyte plate formed after 1 week of primary SC was stained with toluidine blue and safranin-O (
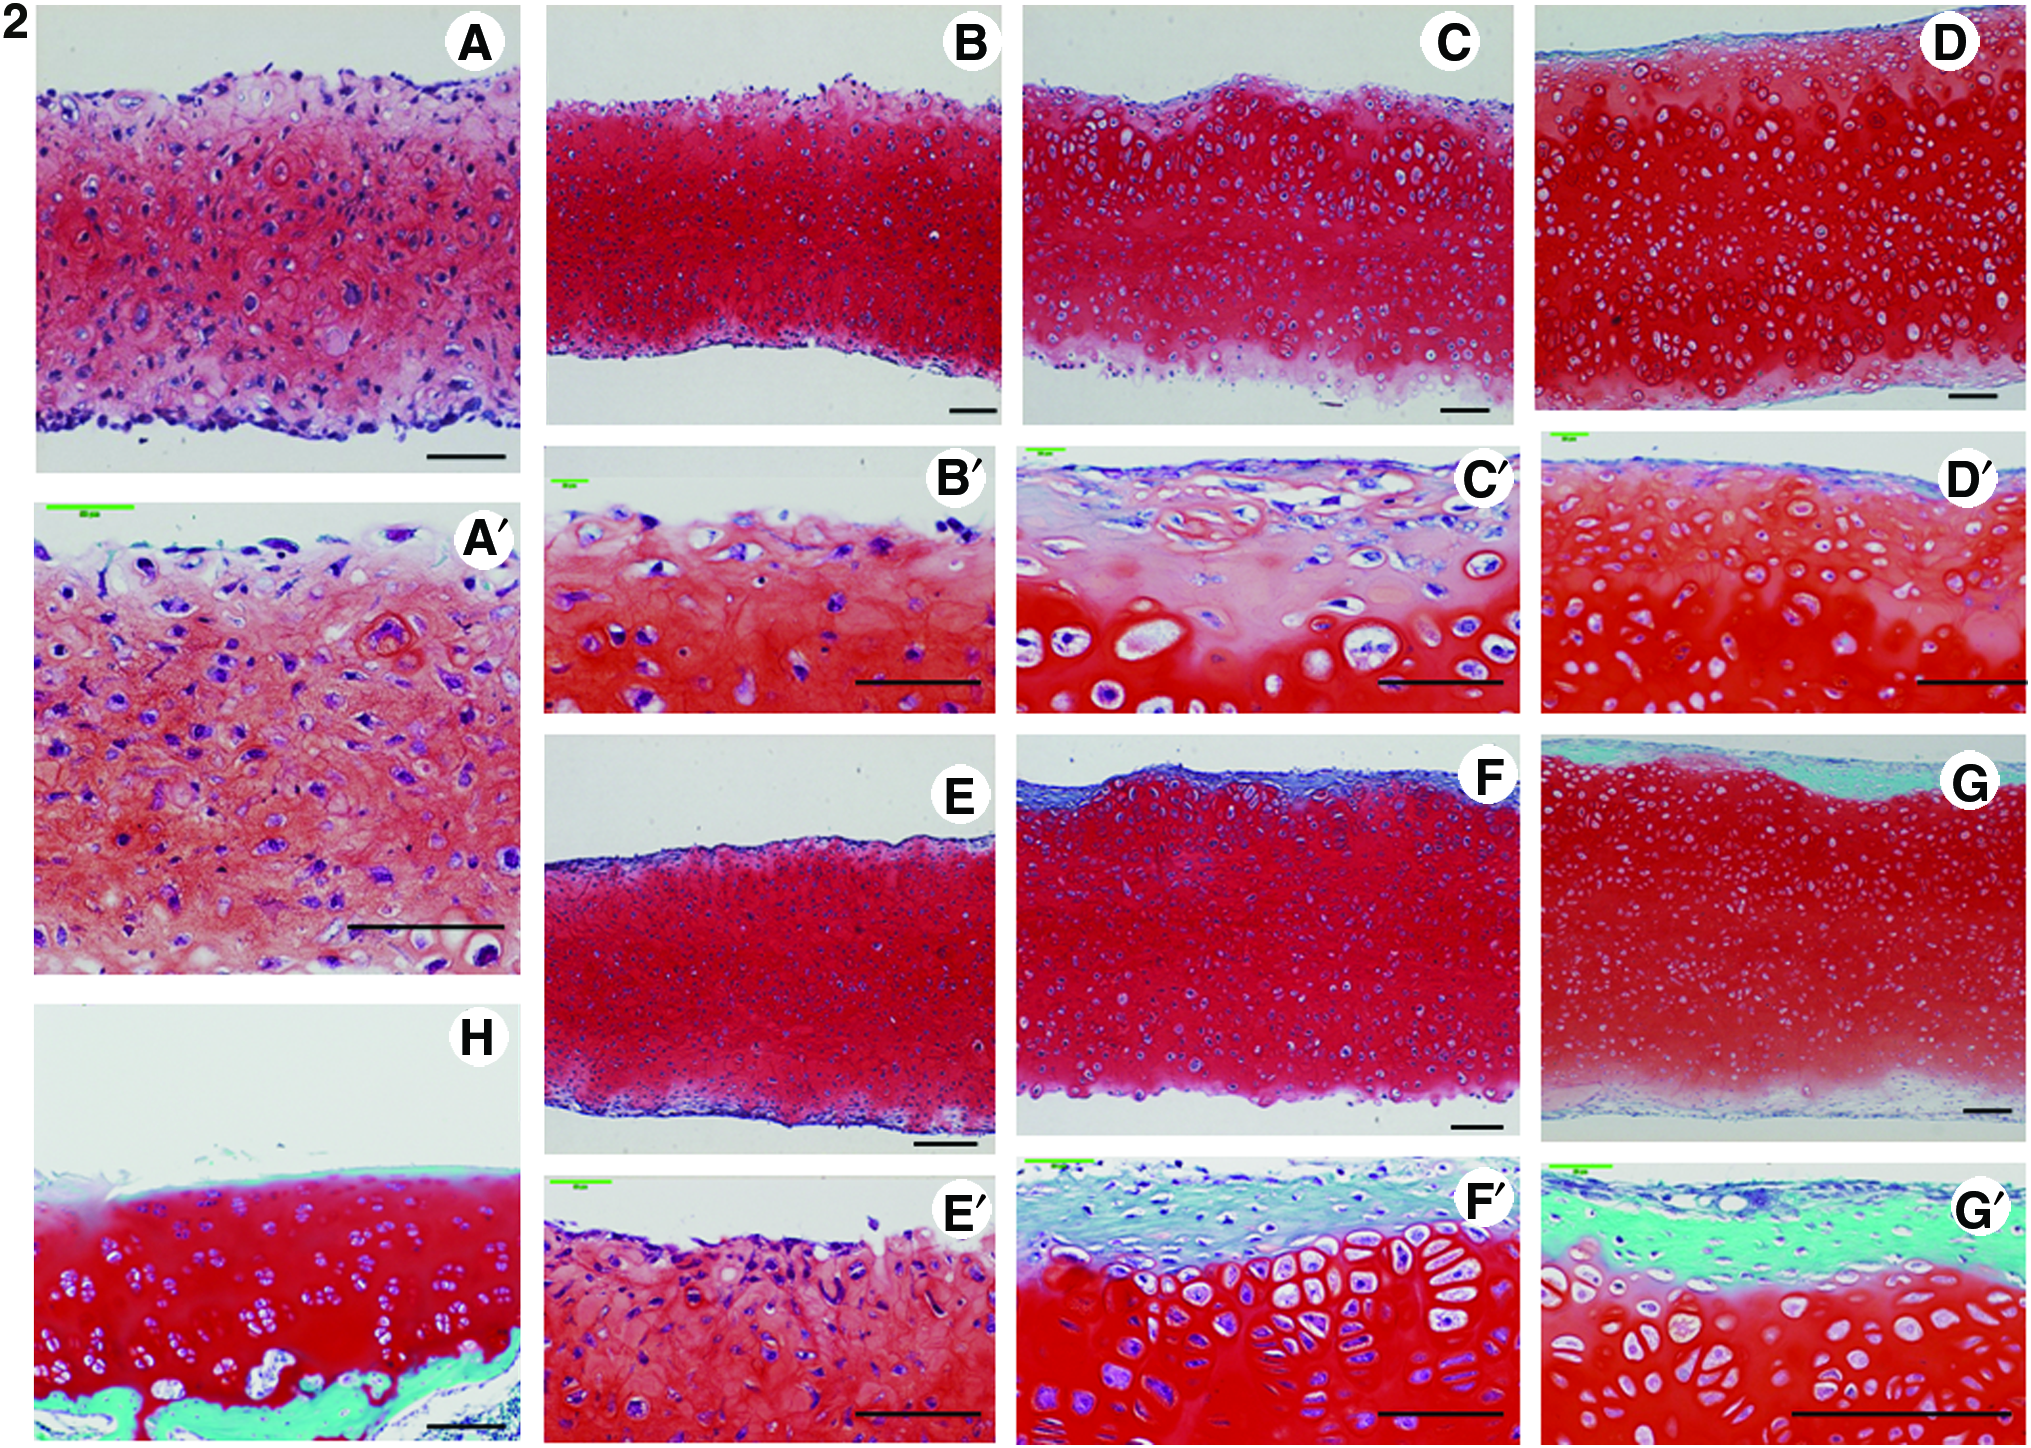

Immunohistochemistry of paraffin sections of chondrocyte plate formed after 7 days of primary SC (
Biochemical analysis
Type II collagen ELISA
Type II collagen content did not significantly differ between the groups at 2 weeks of culture, but at week 3 and later, type II collagen content was significantly greater in the RC group than in the SC group. In the SC group, there was no significant increase by 3 weeks, but the increase was significant at 5 weeks. In the RC group, there was no significant increase at 2 weeks, but by 3 weeks, there was a significant increase (Fig. 5).
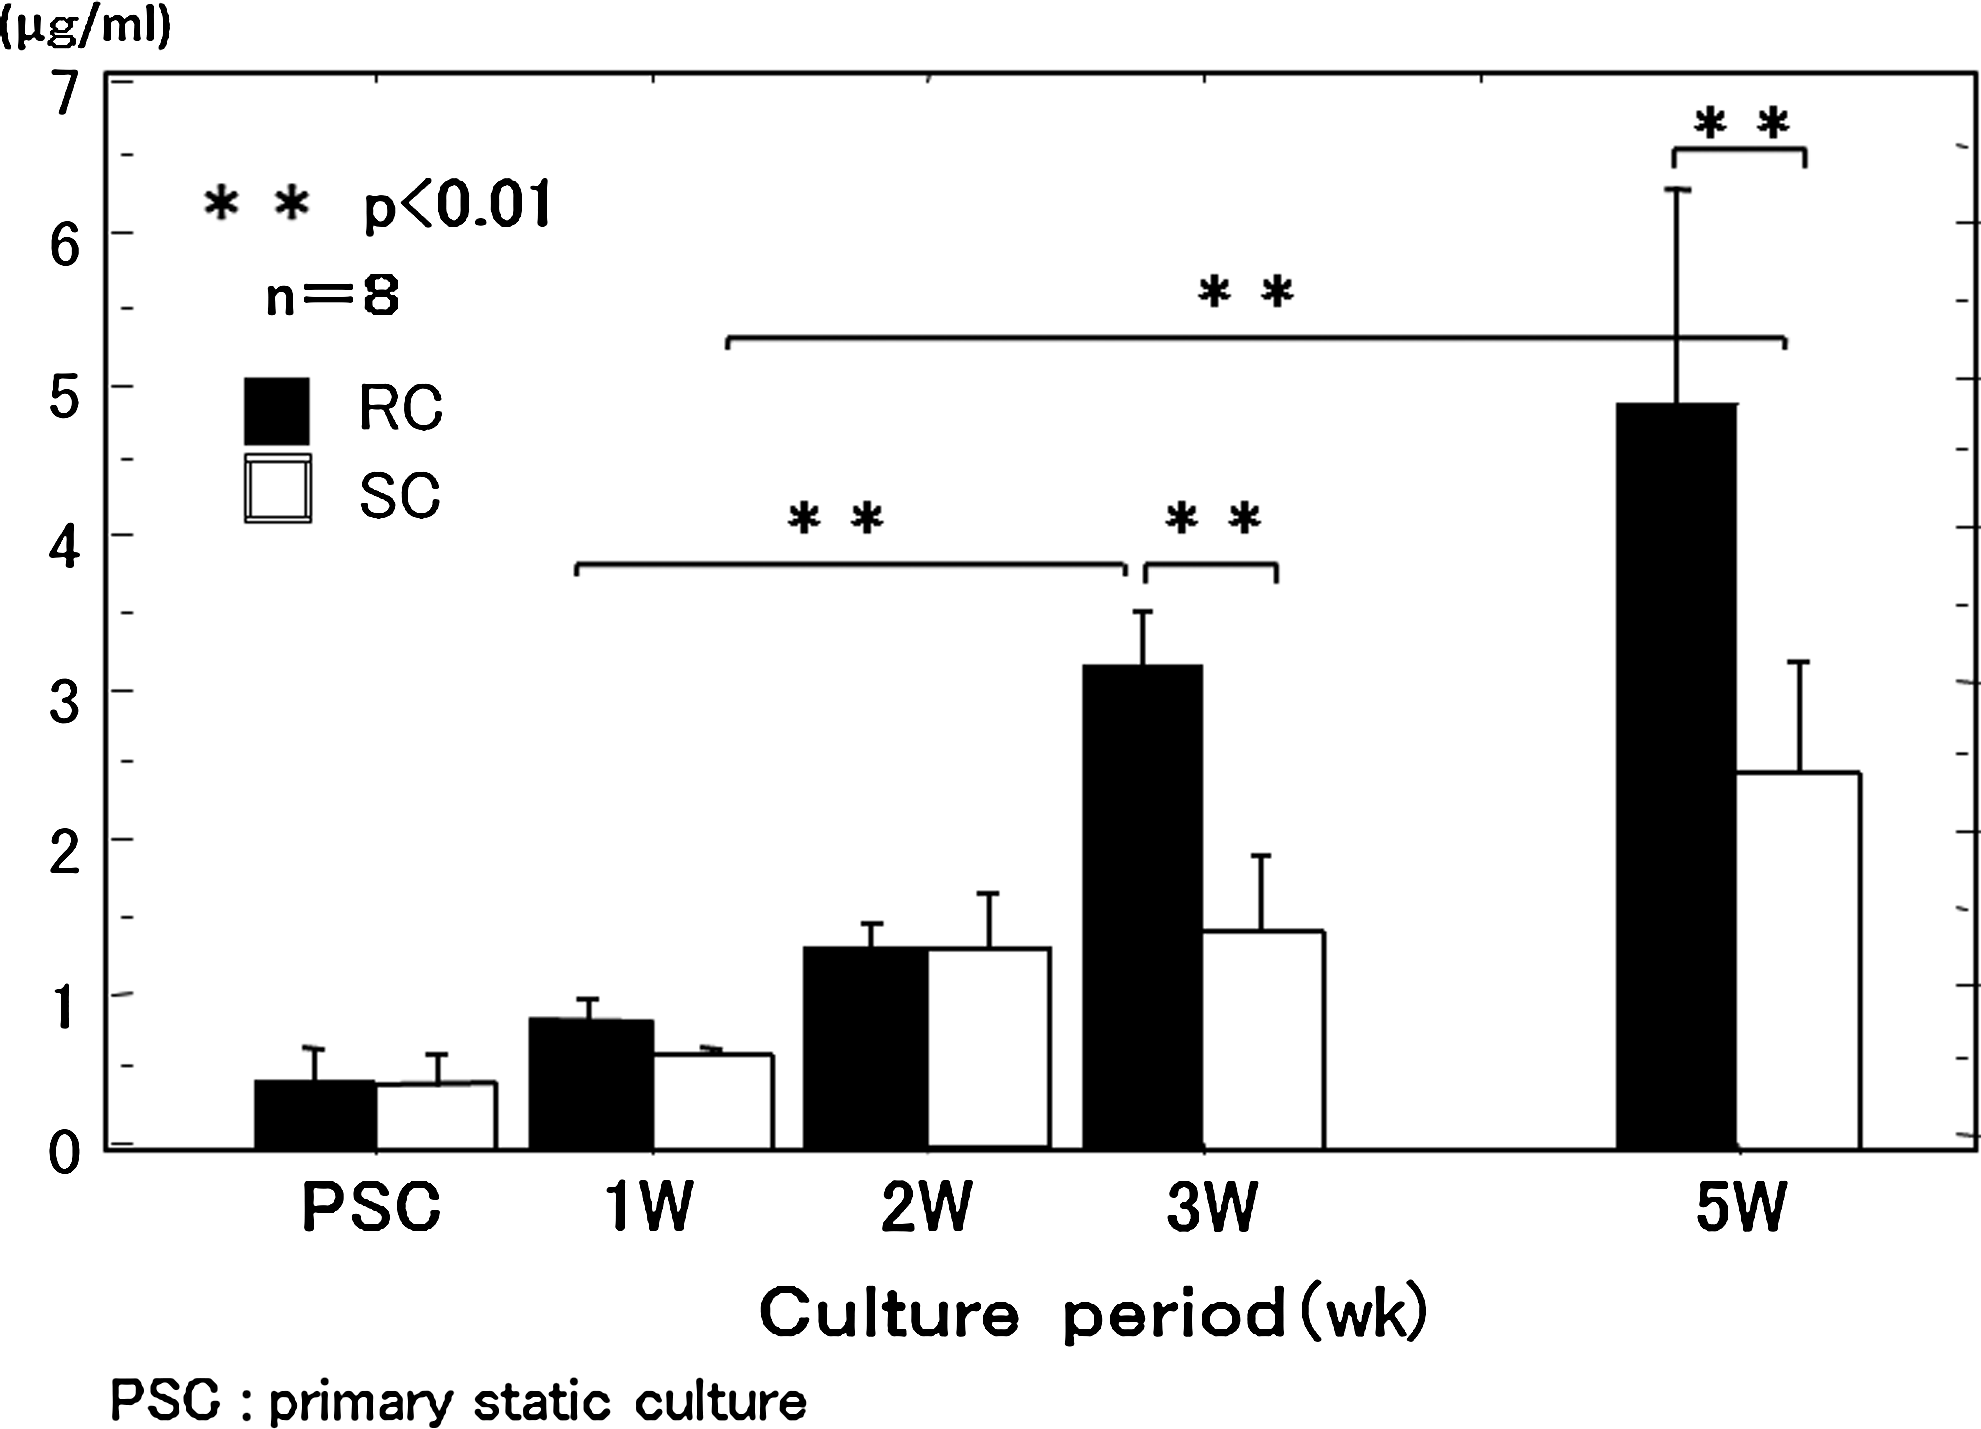
Collagen type II expression of the chondrocyte plate during 5 weeks of culture was measured by enzyme-linked immunosorbent assay. Collagen type II expression was increased at 3 weeks of RC and at 5 weeks of SC. Error bars: standard error. PSC, primary SC.
Thickness and tensile properties
In both the RC and SC groups, thickness increased rapidly from 1 to 2 weeks. The rate of increase in thickness in the RC group was maintained up to week 5 of culture, whereas in the SC group, it tended to decrease (Fig. 6).
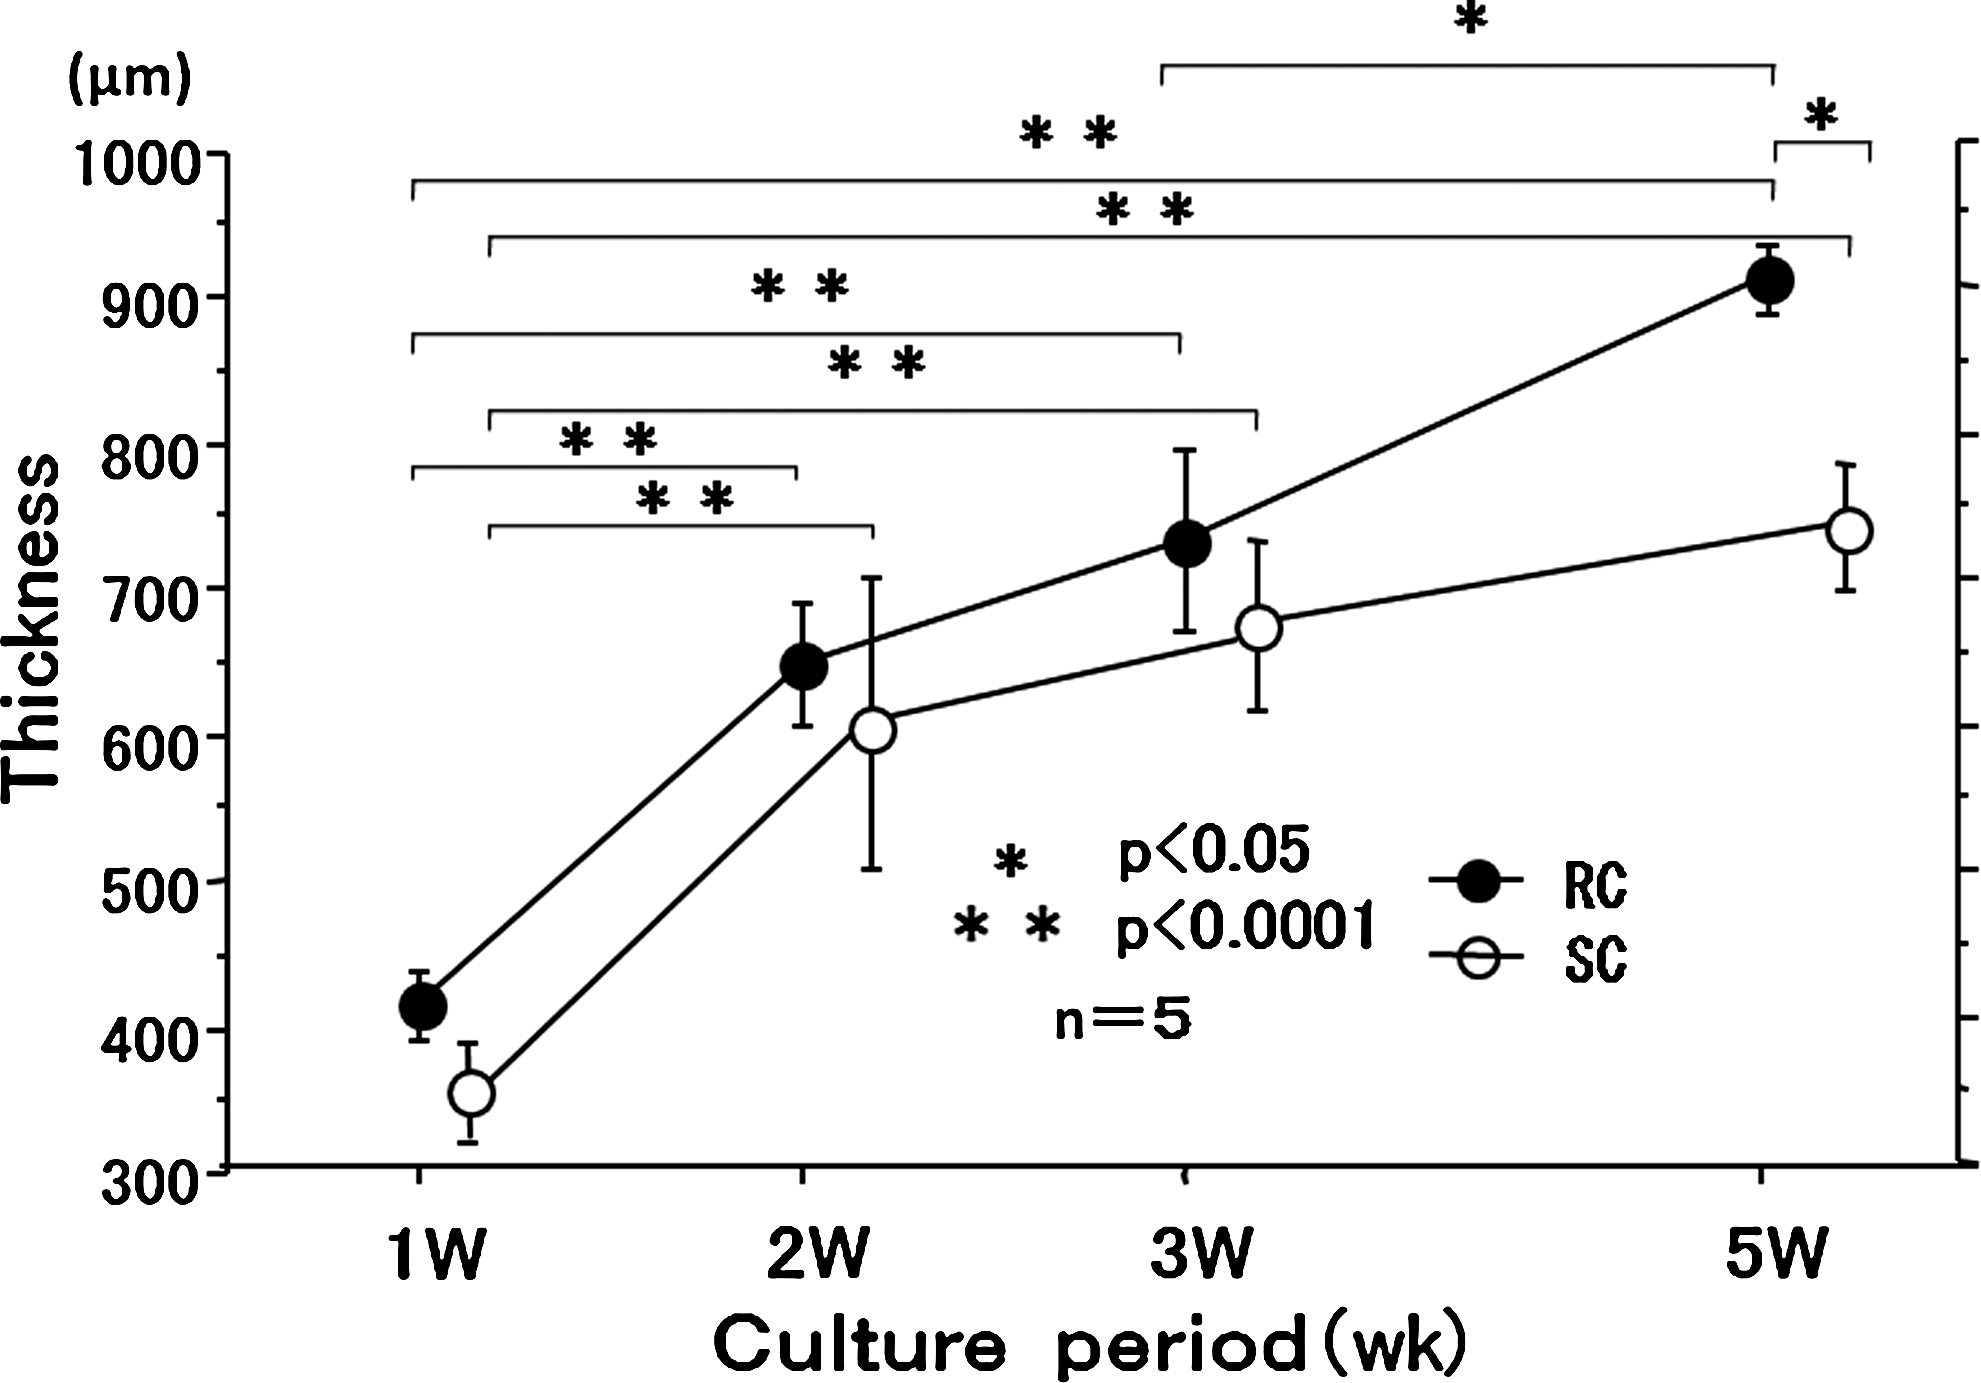
Time changes in thickness of the chondrocyte plate during 5-week RC. Thickness of the cartilage plate was measured using a digital micrometer.
Young's modulus tended to increase after each week of culture in the RC group when compared with the SC group. In the SC group, there was no significant increase by 3 weeks, but the increase was significant at 5 weeks. In the RC group, there was no significant increase at 2 weeks, but the increase was significant by 3 weeks (Fig. 7).
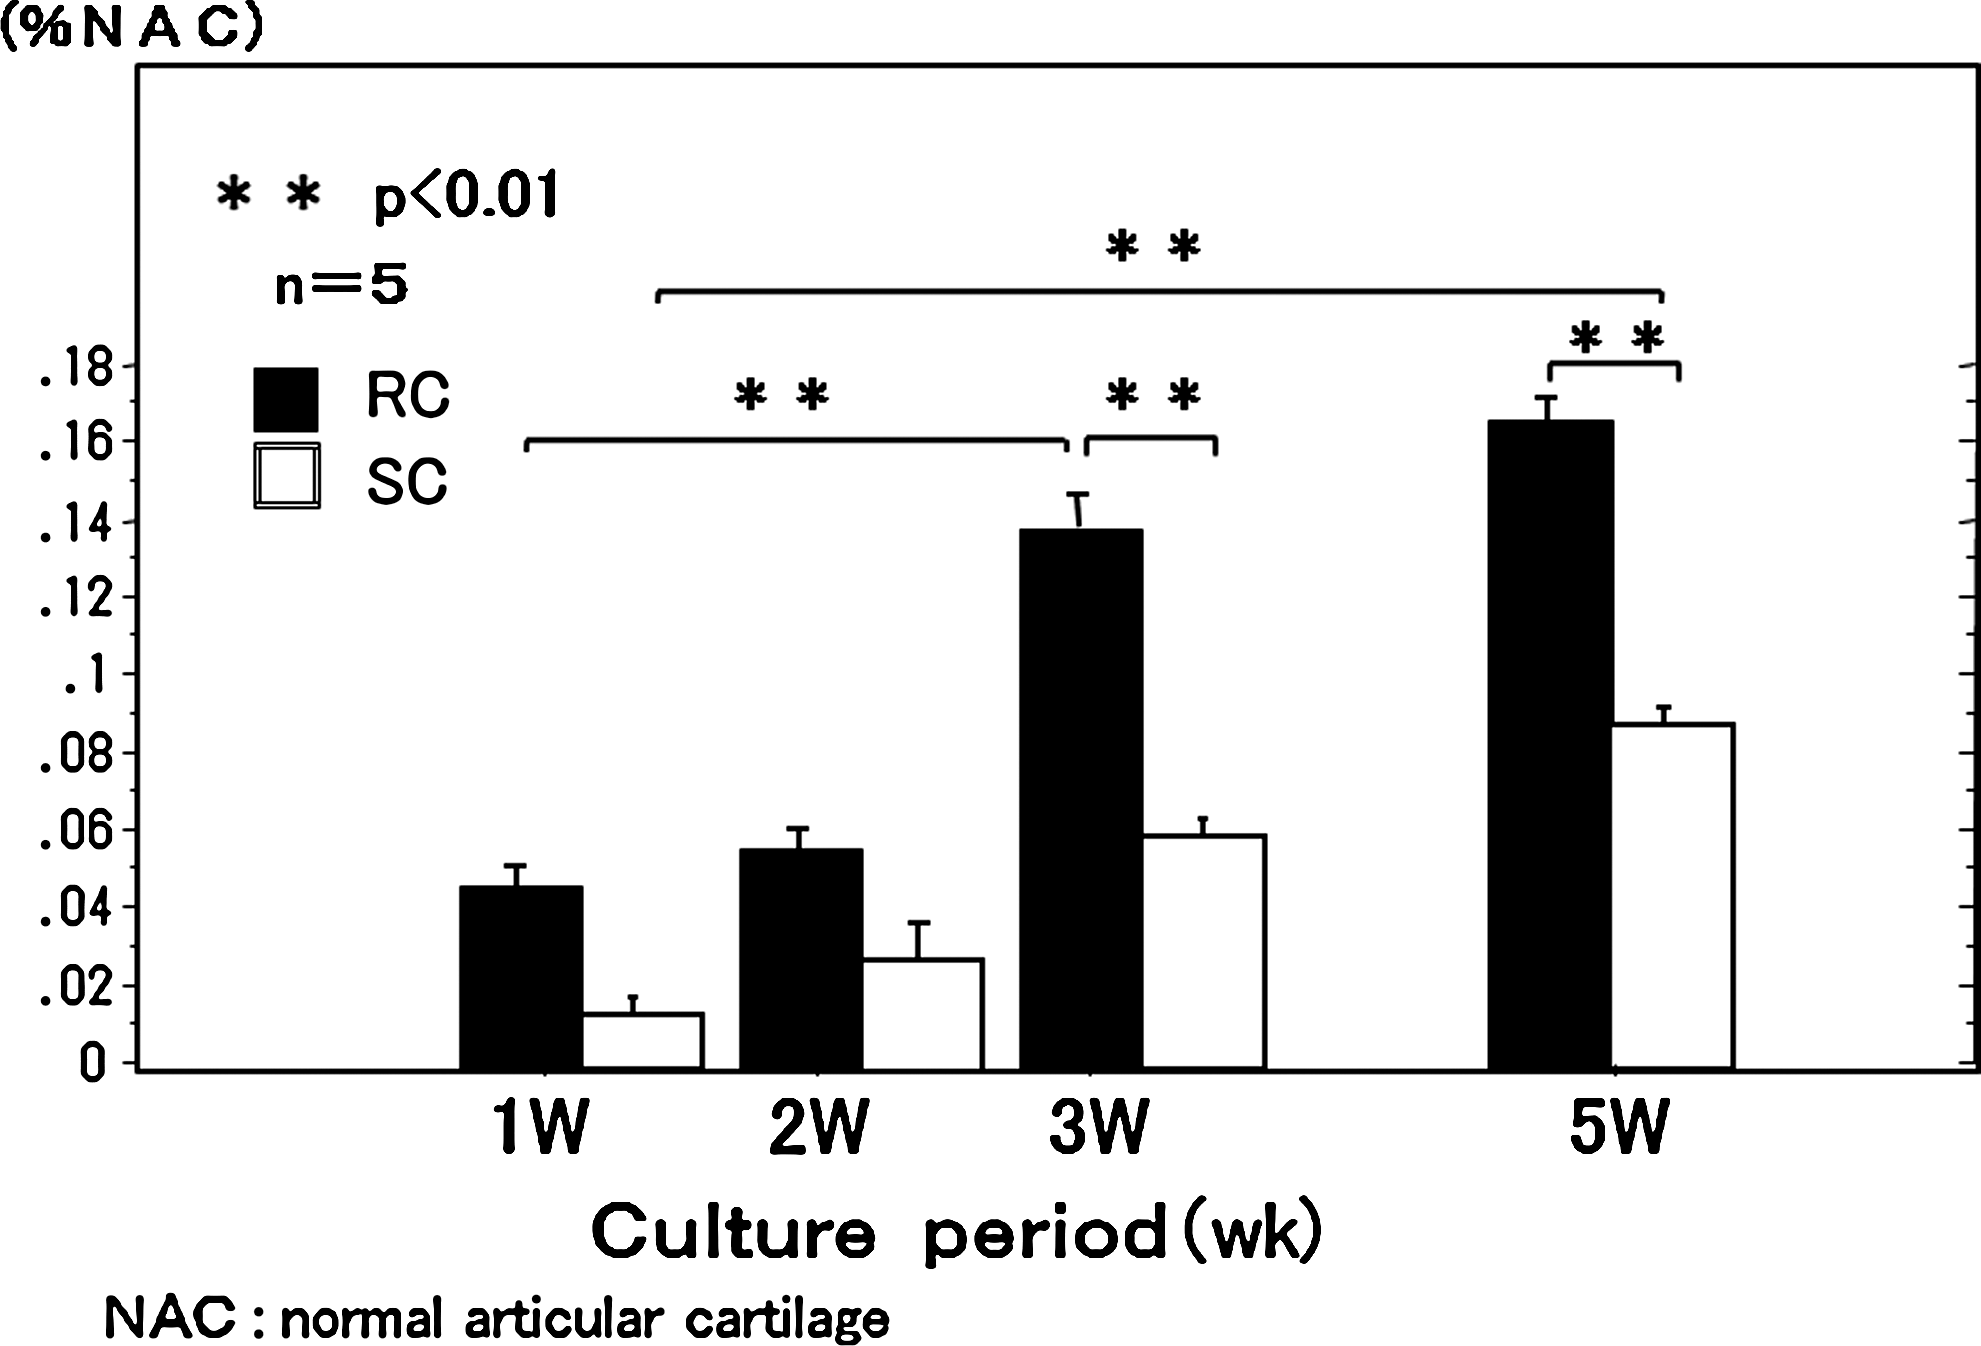
Time changes in Young's modulus of the chondrocyte plate during 5 weeks of culture. Young's modulus of the chondrocyte plate was increased at 3 weeks of RC and at 5 weeks of SC. Error bars: standard error. NAC, normal articular cartilage.
Time-resolved laser-induced fluorescence spectroscopy
Changes were evaluated in peak wavelength at each week of culture of the TEC. In the SC group, there was no significant change at 3 weeks, but there was a significant change at 5 weeks. In the RC group, there was no significant change at 2 weeks, but at 3 weeks, there was a significant change (Fig. 8).

Time changes in peak wavelength of the chondrocyte plate during 5-week RC. Peak wavelength of the chondrocyte plate decreased at 3 weeks of RC and at 5 weeks of SC.
Discussion
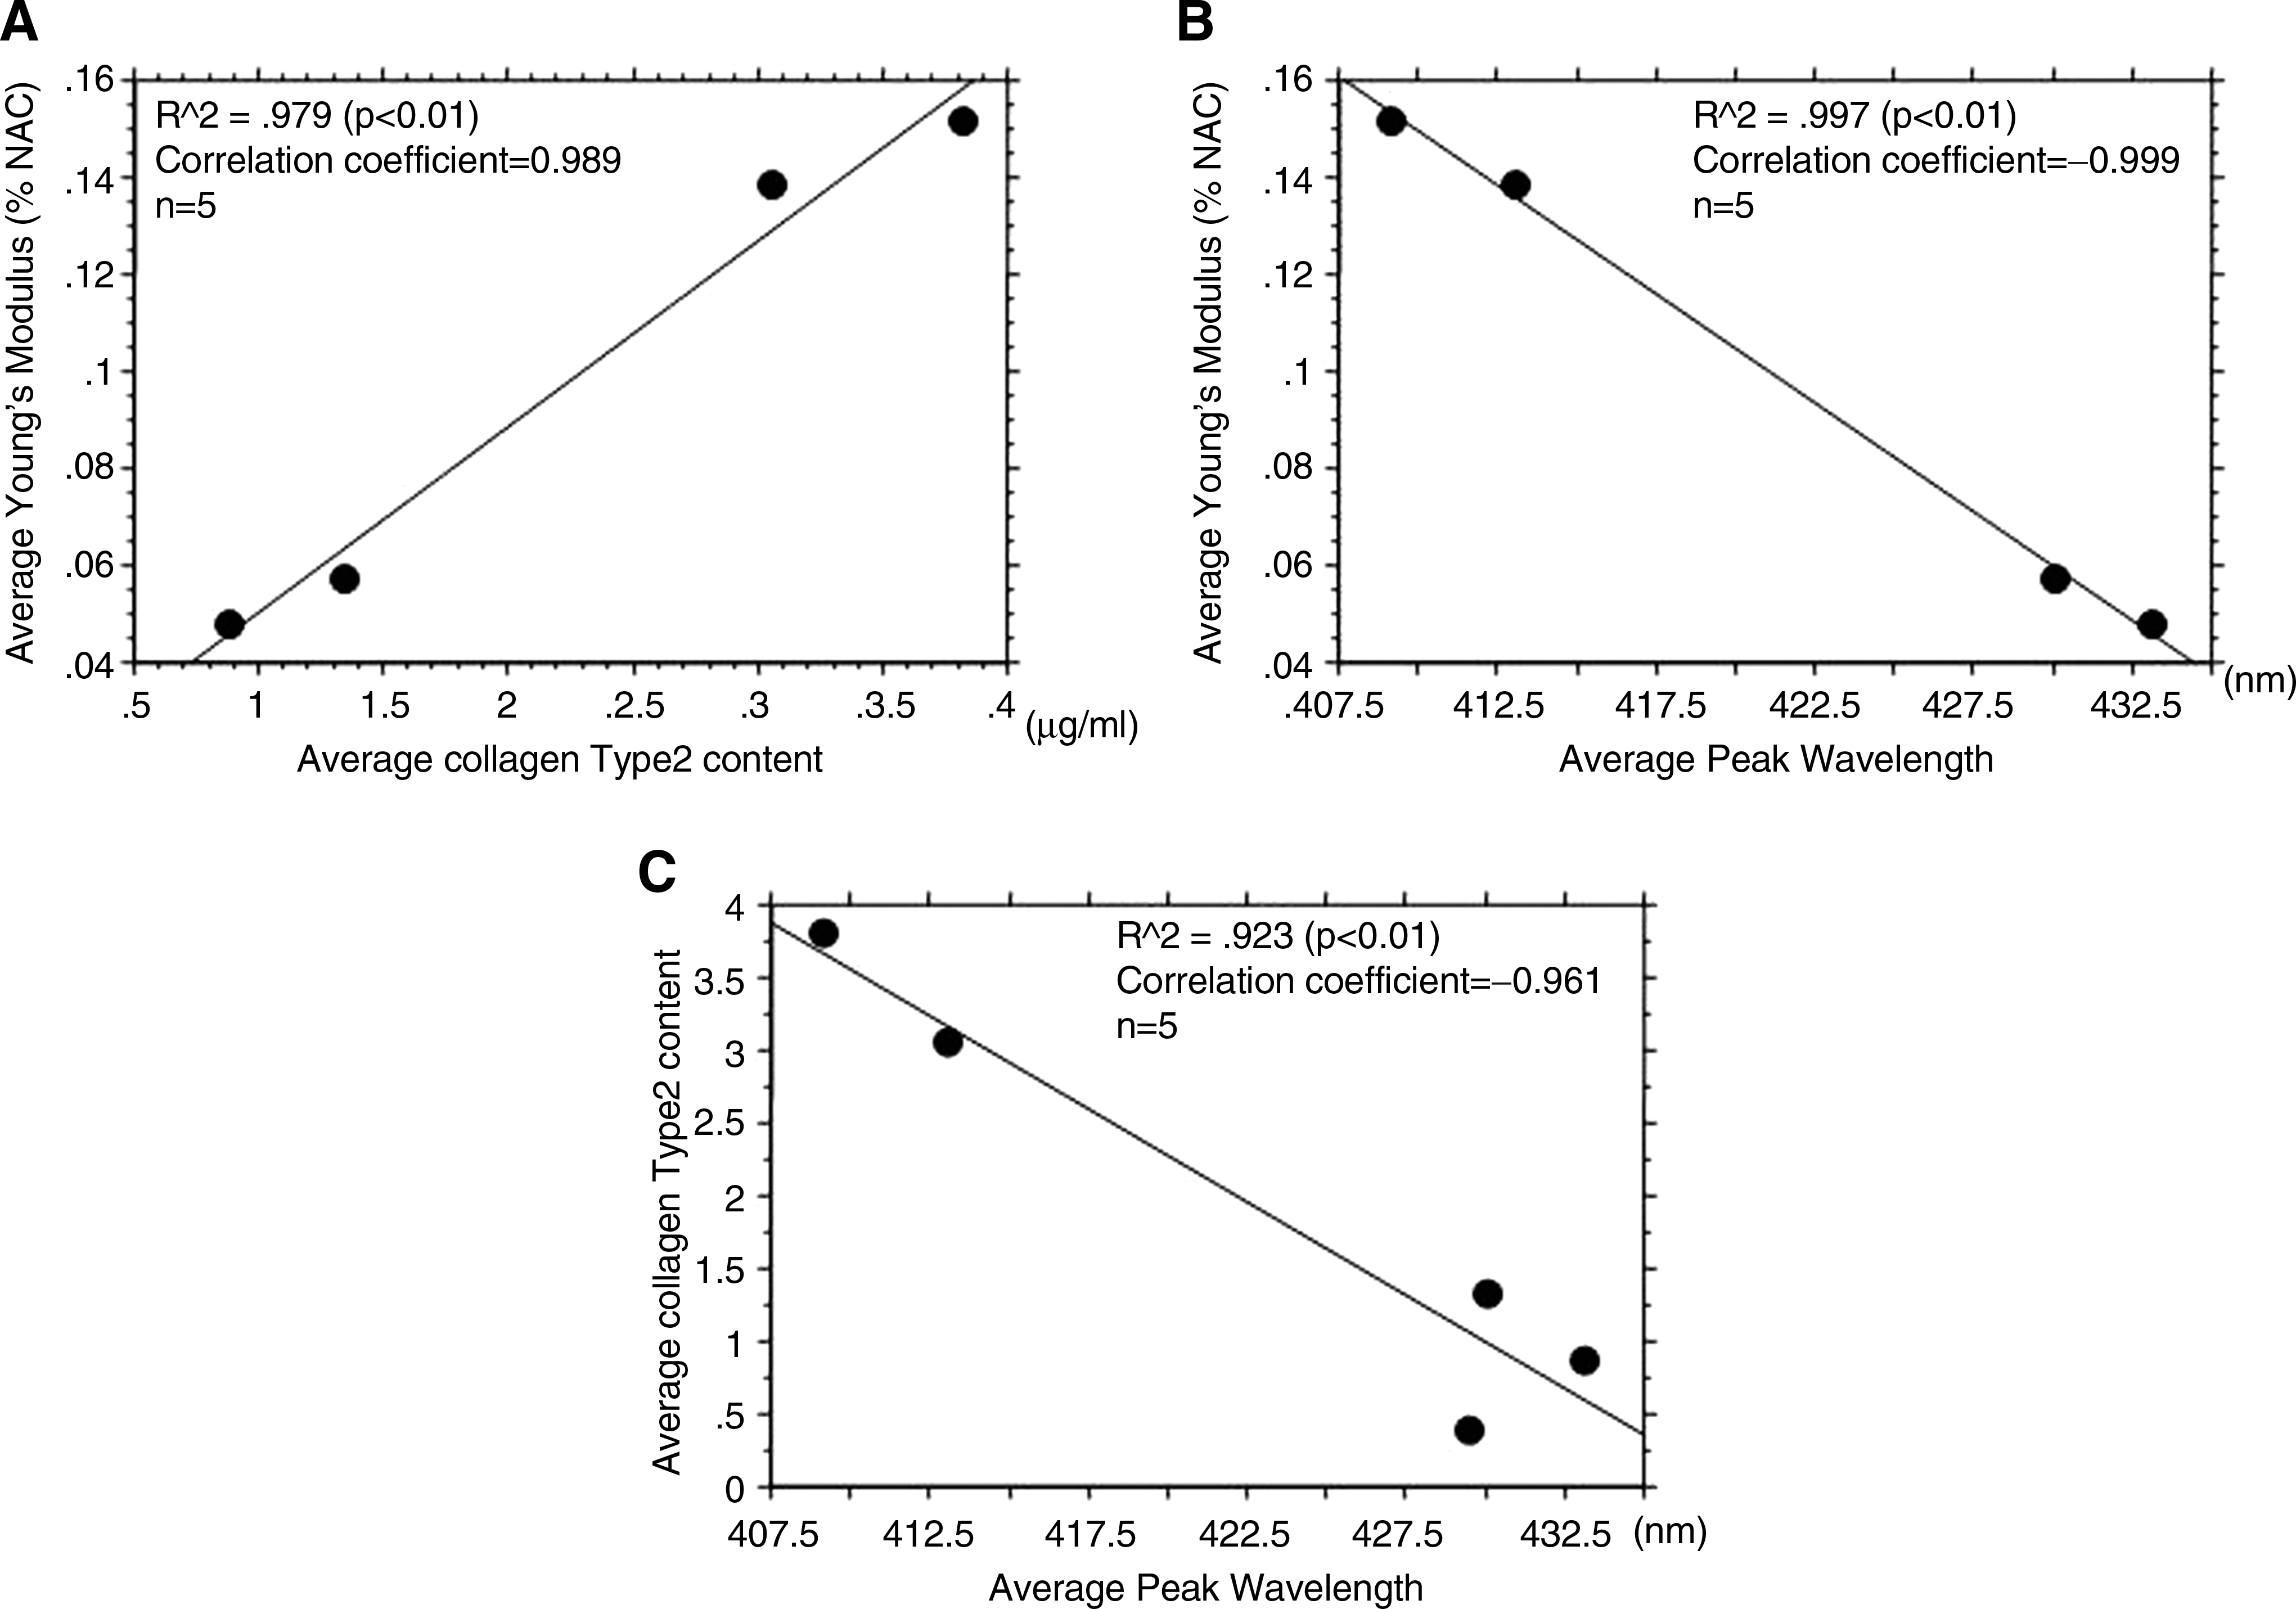
The increasingly common clinical application of regenerative medicine has become a reality with advances in technology. Therefore, noninvasive methods are essential for real-time monitoring of tissue constructs, from the time of production to before, during, and after implantation. In our study, scaffold-free TEC was produced by simple RC, based on the principle that chondrocytes dedifferentiated in high-density cell culture (due to cell–cell adhesions and interaction) will redifferentiate, and that mechanical stress is required for chondrocyte redifferentiation. Furukawa et al. and Nagai et al. have reported the usefulness of RC based on assays for proteoglycans, DNA, collagen, and collagen type I and II mRNA, and based on physical characteristics (tensile testing).13–16 In our study, ELISA quantification of type II collagen also showed that RC significantly increased type II collagen production. These results were confirmed by fluorescence spectroscopy. Articular cartilage is hyaline cartilage, a tissue composed of about 2% chondrocytes and abundant ECM. ECM is composed of about 70% water, 20% collagen, and 10% proteoglycans or cell components. In addition, of the collagen that comprises 20% of hyaline cartilage, 80–90% is type II collagen. In other words, most articular cartilage tissue is type II collagen. The autofluorescence within the tissue is caused by collagen and coenzyme NAD(P)H in cell components. Thus, fluorescence emissions from cartilage are mostly due to type II collagen. Type II collagen has attracted interest as an autofluorescent substance and for its important role in the viscoelastic properties of chondrocytes.9,18 In our study, 5-week culture and serial fluorescence spectroscopy were performed. Changes in quantitative results and fluorescence peak wavelength of the TEC were compared. Type II collagen was significantly increased in the RC group at 3 weeks, and in the SC group at 5 weeks. Fluorescence peak wavelength also changed significantly in the RC group at 3 weeks (shifted to shorter wavelength), and in the SC group at 5 weeks. These findings indicate that in the RC group, type II collagen production was significantly increased as compared to the SC group. This occurred from weeks 2 to 3 of culture, and was easily discerned by changes in peak wavelength. Physical properties were also evaluated. Tensile strength of tissue generally correlated with collagen content, and compression strength generally correlated with proteoglycan content.18,19 In this study, we measured tensile strength of the TEC. The results correlated both with changes in type II collagen content and changes in peak wavelength. Further, correlation analysis regarding type II collagen content, peak wavelength, and Young's modulus revealed significant correlations among all parameters. Peak wavelength reflected the type II collagen content of the sample, and it was clarified that it is possible to quantitatively evaluate the constituent representing the largest component ratio (Fig. 9). These results suggest the possibility of quantitatively evaluating other autofluorescent materials through analysis of the substance-specific fluorescence wavelength.
(
These changes also correlated with the immunostaining results for type II collagen. The peak wavelength data obtained by TR-LIFS were thought to reflect autofluorescence at the highest composition ratios among the sample autofluorescence substances. Tensile strength increased with culture duration (weeks); this increase corresponds to a rise in the type II collagen composition ratio.
The reason for the considerably lower strength, as compared to normal cartilage, is because tensile strength is influenced not only by type 2 collagen content but also by fiber orientation, tissue proteoglycan content, and cell density. In our study samples, Nagai, from our research group, measured proteoglycan (PG) content. This was markedly higher in 3-week cultures than in normal cartilage. 15 In addition, our study sample considerably has a higher cell density than has a normal articular cartilage tissue. Based on our results, changes in peak wavelength on fluorescence spectroscopy can be used to validate a tissue engineering cartilage culturing process. In 2004, Ashjian et al. measured autofluorescence of osteoinduced processed lipoaspirate cells (PLA) and performed a detailed analysis. 16 Spectroscopy of PLA cells not osteoinduced showed broad emission with a peak wavelength of 420–430 nm. This wavelength corresponded to the spectrum of skin-derived type I collagen and placenta-derived types IV and V collagen. Their results showed characteristics similar to the fluorescence spectrum of juvenile rabbit chondrocytes immediately after isolation. Although they reported no significant changes, spectroscopy of the osteoinduced PLA cells showed that the peak wavelength shifted toward 450 nm at 3, 5, and 7 weeks. This shift in peak wavelength was thought to indirectly represent differentiation of PLA cells to bone. They also analyzed the decay time using TR-LIFS and reported that spectroscopy of the osteoinduced PLA cells was characteristic for mainly type I collagen, and they stated that based on decay characteristics alone, collagen expression could be monitored. However, our study results suggest that when there is a specific tissue composition like hyaline cartilage, the changes in peak wavelength permit monitoring of type II collagen production. In addition, the serial changes in the fluorescence spectrum of osteoinduced PLA cells are similar to changes in the fluorescence spectrum associated with passages of juvenile rabbit chondrocytes in monolayer culture. Chondrocytes with a peak wavelength of 420–430 nm just after isolation that maintained differentiation produced collagen and formed TEC. The fluorescence peak wavelength shifted to 400 nm during culture, whereas the fluorescence peak wavelength of juvenile rabbit chondrocytes in monolayer culture shifted to 440–450 nm as the number passages increased (data not shown). At the excitation wavelength of NAD(P)H (290–350 nm), the fluorescence wavelength is 440–464 nm.20–22 In addition, a decrease in collagen fluorescence and marked increase in NAD(P)H fluorescence have been reported with increased cell number and tissue dysplasia.20,23 Therefore, the shift toward shorter wavelengths and the shift toward longer wavelengths represent collagen production when cell differentiation is maintained, and a decreased ability to produce collagen during cell dedifferentiation, respectively. When evaluating known tissue characteristics, tissue autofluorescence can be identified by peak wavelengths alone. However, when detecting autofluorescence in unknown tissues, as noted, a shift toward a shorter peak wavelength does not necessarily indicate chondrogenesis, and a shift toward a longer peak wavelength does not necessarily indicate osteogenesis. For example, type I collagen from bovine Achilles tendon (peak 380 nm, decay time 5.2 ± 0.2 ns) and calf skin (peak 420 nm, decay time 1.05 ± 0.1 ns) have markedly different peak wavelengths and decay times. 12 If the peak wavelength of a tissue at the measurement start time is, for example, 390 nm, whether this is a shift to a longer wavelength representing chondrogenesis or osteogenesis cannot be assessed based on peak wavelength alone. In this case, assessing the decay time of each wavelength using TR-LIFS will help to distinguish chondrogenesis from osteogenesis based on lengthening or shortening. In our study, although the data are not shown, decay time was calculated, and characteristic lengthening or shortening of decay times at each wavelength was found based on culture duration (weeks) and culture method. For example, our data showed that the decay time of the type II collagen peak wavelength at 402 nm, with the initial SC (PSC1W) as a reference, shortened at week 1, was significantly prolonged at week 2, and remained the same at week 3. This finding suggests a process by which dedifferentiated monolayer cultured chondrocytes redifferentiate in a 3D culture, and to identify phenotypic modulations at a specific time, decay time must also be assessed. The above parameters must be comprehensively considered. When peak wavelength alone is used as a parameter, it can only be confirmed by the variability pattern. Thus, deviations from this variability pattern suggest a material that may not be ideal for regenerative tissue.
In our study, changes in fluorescence peak wavelength of the TEC were correlated with changes in type II collagen content. This demonstrates that monitoring changes in peak wavelength enables noninvasive evaluation of cartilage formation. This method of analysis may be useful in the advancing field of cartilage regenerative medicine.
Footnotes
Acknowledgments
We thank Ms. Aya Saito, Ms. Mami Kokubo, and Ms. Tomoko Nakai for their expert technical assistance. This work was partially supported by New Energy and Industrial Technology Development Organization and Japan Foundation for Aging and Health.
Disclosure Statement
No competing financial interests exist.