
Abstract
Structural characterization of porous tissue scaffolds is challenging due to their complexity. Most investigators report the porosity of the material together with an estimate of the mean pore size and the pore size distribution. The usefulness of these measures is limited, especially in predicting the time-dependent permeation characteristics of a biodegradable, cell-seeded scaffold. A potential solution to this problem is to measure the permeability of the matrix and determine the Darcy permeability coefficient. Darcy permeability coefficients of 3.1 × 10⁻¹⁴ and 6.3 × 10⁻¹⁴ m2 were measured for air and water, respectively, in microporous polycaprolactone scaffolds by monitoring fluid flow in response to a range of pressure differentials. Permeability coefficients for phosphate-buffered saline (5.3 × 10⁻¹⁴ m2), glucose (5.7 × 10⁻¹⁴ m2), and bovine serum albumin (1.8 × 10⁻¹⁴ m2) were obtained by monitoring the change in concentration of molecular probes. This approach revealed the efficiency of transport of glucose molecules through the porous material and the existence of protein–scaffold interactions that resulted in protein retention and a reduction in fluid permeation rate. Darcy permeability measurements can provide valuable insights concerning the transport properties of nutrients, metabolites, and polypeptide growth factors in porous tissue engineering scaffolds and a method of quality assurance in scaffold processing.
Introduction
The porosity, that is, the percentage of void volume in the material, is also used as a means of quantifying the structure of a tissue scaffold. The porosity of a porous matrix can be determined using a variety of techniques, including density measurement, volumetric displacement, and calculations based on image analysis. 7 Attempts to link scaffold porosity to performance have not been particularly successful. Toth et al. 8 report that improvements in bone ingrowth occur with increasing porosity of macroporous biphasic calcium phosphate ceramic samples. However, they also report no discernible differences in bone union after 6-month implantation between scaffolds that have 30%, 50%, and 70% porosity. This observation could be attributed to the complicated internal structure of scaffolds that consist of pores of different types (open, closed, and blind-end), sizes, and geometry (Fig. 1). These parameters control the key processes of cell migration through the scaffold and tissue ingrowth, nutrient supply to cells, metabolite dispersal, local pH stability, and cell signaling. 9

Schematic of the different pore types found in tissue scaffolds. Fluid flow through the structure is via the open pores. Color images available online at
Given the importance of scaffold micro- and macroporosity on tissue regeneration, perhaps a focus for research should be on defining measures that quantify the performance of the scaffold in terms of its permeability since this property governs nutrient and metabolite dispersal. The permeability coefficient is a measure of the resistance of a porous material to flow of a fluid through it that is governed by the dimensions and density of open (or through) pores and on the tortuosity of the structure. Tortuosity may be defined simply as the ratio of the actual path length through connected pores to the Euclidean distance (shortest linear distance). In its simplest form the permeability of the scaffold can be determined by measuring the flow of gas through the material in a given time under a known pressure gradient through Darcy's law
10
Permeability coefficients are routinely used in assessing soils and other porous materials and have also been measured to characterize polymeric scaffolds and hard tissues. 11 Lee et al. 12 used water and a continuously changing pressure drop to determine the permeability coefficients of poly(propylene fumarate) scaffolds. Li et al., 13 using demineralized water with a constant pressure drop, reported permeability coefficients for a range of calcium phosphate scaffolds between 0.01 × 10⁻⁹ and 0.32 × 10⁻⁹ m2. Kohles et al. 14 used water under constant pressure to determine the permeability coefficients of a range of cancellous bone samples. A Darcy permeability coefficient of 1.96 × 10⁻⁹ m2 was obtained for Bioglass (90–95% porosity) compared with 5.1 × 10⁻⁹ m2 for human cancellous bone. 15 Ochoa et al. used these measurements to conclude that the pore structure and transport properties of their Bioglass scaffolds were similar to trabecular bone.
Darcy permeability also features prominently in mixture theory, which was developed to explain the dynamic interaction between the solid and liquid phases in soft tissue such as articular cartilage, arterial tissue, and skin, which contain a significant amount of unbound interstitial fluid.16–18 In particular, the hydraulic permeability (obtained by dividing the Darcy permeability by the fluid viscosity) plays a pivotal role in the biorheological functioning of such materials. Viscous or frictional drag associated with interstitial fluid flow through the porous material causes tissue compaction, a decrease in permeability, and a subsequent change in the viscoelastic compressive behavior.
The focus of this study was to compare different methods for determining permeability coefficients in a microporous tubular scaffold produced from PCL. This polymer continues to be widely investigated for production of drug delivery devices and tissue engineering scaffolds. The permeability coefficient was derived from measurements of the amount of fluid (air and water) that flowed through the material in a specified time for a given pressure differential. Investigations of the permeation rate of molecular probes (lactose and albumin) through the scaffold provided additional information relevant to the transport of nutrients and polypeptide growth factors that initiate and sustain tissue development.
Materials and Methods
Manufacture of porous, tubular scaffolds
Tubular tissue engineering scaffolds were produced from PCL (Mw 115,000 Da, Capa 650; Solvay Interox, Warrington, United Kingdom) using the precipitation casting method. 19 Briefly, PCL (1.7 g) was dissolved in 10 mL acetone at approximately 50°C to give a final solution concentration of 17% w/v. The solution was then transferred into a mould comprising of a 1 mL polypropylene syringe body centrally located within a 3 mL polypropylene body. Following crystallization and hardening of the PCL phase, the tube was removed from the mould and immersed in methanol (200 mL) for 24 h to extract the acetone. This produced a flexible, soft-textured, microporous tube free of large-scale cracks and voids. Finally, the tube was allowed to dry under ambient conditions. The tubes were ≈55–60 mm long with an external diameter of ≈7.5 mm and a wall thickness of ≈1 mm. The crystalline melting point of PCL in the formed tube was found to be 68°C (TA Instruments DSC 2920, Crawley, United Kingdom), a value comparable with that reported elsewhere, and their mean crystallinity was 71.5 ± 0.7% assuming a heat of fusion of 139.5 J/g. 20
Measuring Darcy permeability coefficients
Determination of the Darcy permeability coefficient for air
The permeability coefficient of the PCL scaffold material was obtained by passing air through a microporous PCL sample in the form of a 1 cm diameter disc, approximately 1 mm thick, at rates ranging from 100 to 800 cm3/min and measuring the pressure drop across the disc as shown in Figure 2. Samples were mounted onto a filter holder using two O-rings and connected to a compressed air supply. The airflow rate was controlled using a mass flow controller (Chell instruments, North Walsham, Norfolk), and the pressure drop was measured using a DPI 520 ATE pressure controller (Druck Limited, Leicester, United Kingdom). According to ASTM D 6539-00, the validity of Darcy's law can be established by plotting the volumetric flow through a specimen versus the pressure differential across it. If the test data lie within 25% of a linear fit that passes through the origin, then Darcy's law is deemed to apply.
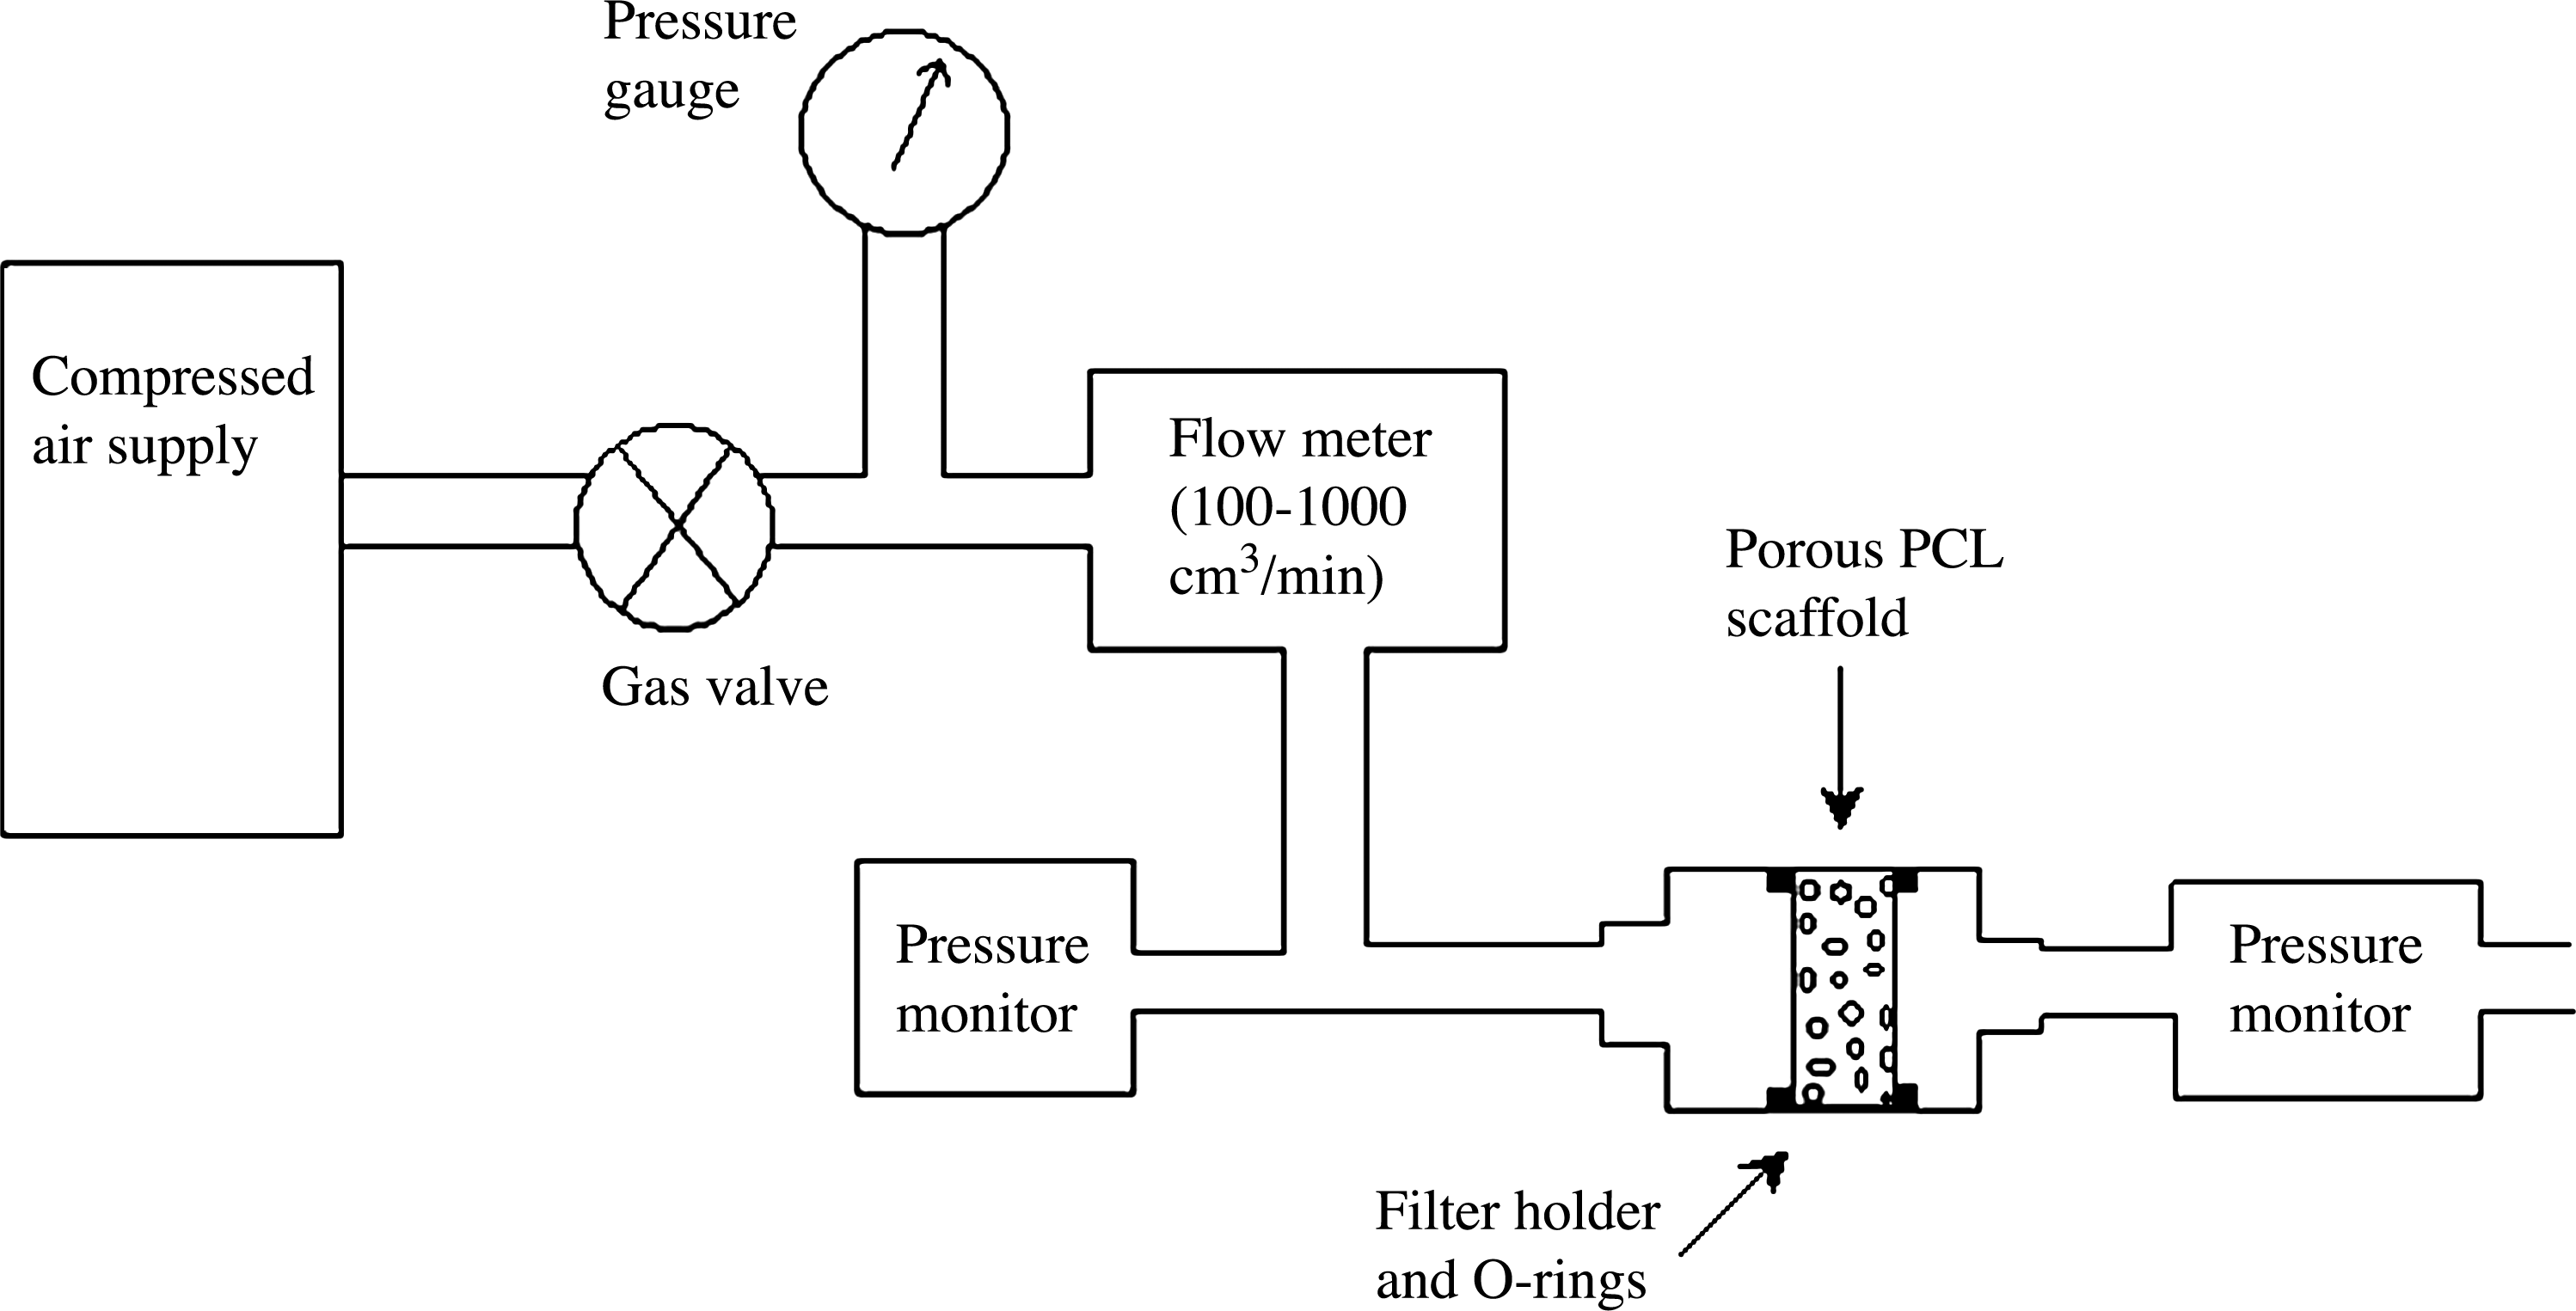
Measuring the pressure differential across a disc of microporous polycaprolactone (PCL) scaffold material produced by the controlled flow of gas through the disc.
Determination of the Darcy permeability coefficient for water
PCL is a hydrophobic material, and the microporous PCL tubes were found to be impermeable to water at moderate pressures of 12,000 Pa. This limitation was overcome by immersing the PCL tubes in a 20% v/v ethanol/water mixture for 30 min, followed by two washes (each of 20 min) in distilled water before testing.
The permeability coefficient of water through the microporous PCL scaffold was determined from Darcy's law using measurements of the weight of water that permeated through the tube wall in a given time under a given pressure. Tubes were mounted in a Bose-Enduratec BioDynamic chamber (Bose, Eden Prairie, MN) (Fig. 3). Fluid was pumped from a reservoir to a mixing chamber before passing through the tube at selected flow rates in the range 0–1500 mL/min. All measurements were performed at 37°C. The sample chamber was filled with degassed distilled water to maintain a constant pressure head (Fig. 4). Two pressure transducers, one positioned inside the tube mid-way along the tube length and the second located external to the PCL tube (Fig. 4), were used to continuously record the pressure drop across the tube wall. Fluid that passed through the wall of the PCL tube was collected as overflow from the sample chamber over a specific time interval to determine the permeation flow rate (Q) under various pressures.

The Bose-Enduratec BioDynamic chamber.

Passage of fluid through the wall of a microporous PCL tubular scaffold in a closed loop pumped system determined by either weighing the permeant or measuring the change in concentration of a molecular probe.
Determination of the Darcy permeability coefficient for molecular probes
Molecular probes such as ions, glucose, or proteins may be used to determine the rate of fluid flow, Q, through a permeable matrix. This approach is advantageous in that measurements of the permeability of small molecules could provide useful data on nutrient and metabolite transport through a scaffold. In addition, the rate of movement and distribution of polypeptide growth factors such as vascular endothelial growth factor and chemoattractants through the scaffold are relevant to processes of cell development and tissue ingrowth.
A solution containing the selected molecular probe was circulated through the sample tube mounted in the Bose-Enduratec BioDynamic chamber. The concentration of each selected molecular species was determined in the fluid that overflowed from the sample chamber at intervals ranging from 10 to 60 s, depending on the pressure differential across the tube wall. The cumulative amount of the molecular probe that passed through the tube wall over time was subsequently calculated from the volume of the sample chamber and the overflow. All measurements were performed at 37°C under constant flow rate conditions through the tube (300 mL/min) and at pressure differentials ranging from 10 to 80 mm Hg (1.3–10.6 kPa). A small magnetic stirrer was placed in the sample chamber to avoid any concentration gradients that may otherwise have developed.
Phosphate-buffered saline (PBS) contains charged species (sodium and potassium cations, hydrogen phosphate, dihydrogen phosphate, and chloride anions) that can be used as molecular probes to determine the permeability of microporous materials. PBS was circulated through a microporous PCL tube mounted in the BioDynamic chamber, and the movement of charged species across the tube wall into the surrounding deionized water medium was detected as a change in resistivity or conductivity. Measurements were made between a 50 mm platinum wire electrode located within the sample tube and a second electrode positioned within the sample chamber. Changes in conductivity were measured using a Precision impedance analyzer (Model 4294A; Agilent Technologies, Wokingham, United Kingdom), and the data were recorded using Labview 8.0. Although not strictly a measure of “conductivity” due to the direct current nature of charge movement, changes in the measured current can be used to estimate ion flow through the polymer matrix.
Glucose: The BioDynamic sample chamber was filled with degassed distilled water and a 1 mg/mL solution of glucose (D-(+)-glucose) (99.5% purity, code G7528; Sigma, Poole, United Kingdom) in PBS was circulated through the microporous PCL sample tube. The overflow from the BioDynamic chamber caused by permeation of glucose solution across the tube wall under varying pressures was collected over time periods ranging from 50 to 120 s. The concentration of glucose in the fluid samples was assayed using an Amplex® Red Glucose/Glucose Oxidase Assay kit (Fisher Scientific, Loughborough, United Kingdom). The cumulative amount of glucose solution passing across the tube wall over time was calculated based on the volume of fluid contained in the sample chamber and the overflow.
Protein: A 1 mg/mL solution of bovine serum albumin (BSA) (A7906 Sigma-Aldrich Chemicals, Poole, United Kingdom) in PBS was circulated through a microporous PCL tube mounted in the BioDynamic chamber. A QuantiPro™ BCA assay kit was used to assay the time-dependent changes in BSA concentration in the chamber due to fluid permeation through the scaffold wall.
Measurement of tube dilation under steady flow conditions
Fluid flow through the tubular scaffold will create a pressure within the system that may be sufficient to cause the tube to dilate, resulting in a reduction in wall thickness and consequently affecting the porosity, pore geometry, and matrix permeability (Equation 1). This factor was assessed by measuring the amount of tube dilation at different pressure differentials across the tube wall. A Bose-Enduratec BioDynamic chamber configured for cardiovascular applications was used to produce flow rates in the range from 0 to 1500 mL/min through the sample tube. The pressure differential was monitored via two pressure transducers. Changes in the outer diameter of the PCL tubes induced by the fluid flow were measured using a laser-scanning micrometer (Mitutoyo LSM 301, Andover, United Kingdom) configured as a shadowgraph detector. Data were captured at a rate of 10 measurements per second at 16 bit resolution and logged via a Labview 8.0–based program (National Instruments, Newbury, United Kingdom). The flow rate was increased by 250 mL/min increments at 5 min intervals to a maximum rate of 1500 mL/min. The diameter of the PCL tube at each flow rate was recorded for 1 min to obtain an average value. After 5 min at 1500 mL/min, the flow rate was reduced to the initial flow rate of 250 mL/min and the test was repeated.
Scanning electron microscopy
Specimens of PCL tubes were mounted on aluminum sample stubs and sputter coated with platinum using an Edward E30GA automatic mounting press before examination at a voltage of 15 kV in a scanning electron microscope (Philips XL30, Guildford, United Kingdom).
Measurement of shear viscosity
Shear viscosity measurements were performed at 37°C using a rotational rheometer (TA Instruments AR-G2) in steady shear mode using a cone and plate geometry of 40 mm diameter and 1° cone angle.
Results
Scanning electron microscopy examination of the PCL matrix revealed a complex microporous morphology with a lamellar exterior (Fig. 5A, B) and an open-nodular core (Fig. 5C). Although such structures are usually described in terms of pores, a more appropriate description might be as a series of interconnected channels that permeate through the matrix. Although it is difficult to quantify this type of structure, the diameter of the channels within the tube wall is typically 5–15 μm.

Scanning electron micrographs of the external surface of the PCL tube at two different magnifications, (
Tube dilation
Figure 6 shows the dependence of the outer diameter of a microporous PCL tube on the flow rate for three successive runs on the same tube conducted using the Bose-Enduratec BioDynamic chamber. While these results highlight some differences in the dilation behavior of the tube between the initial run and subsequent runs, the point to note is that the increase in tube diameter is approximately 20 μm for a pressure difference of 55 mm Hg (7300 Pa). This response corresponds to an expected decrease in wall thickness of approximately 0.26%, which can be considered negligible in terms of calculating Darcy permeability coefficients.

The changes in outer diameter of a microporous PCL tube and internal pressure caused by increasing the flow rate at 37°C. Data were obtained from three repeat measurements on each of the three specimens. The arrows indicate changes due to increasing or decreasing flow rate.
Shear viscosity
The shear viscosity of PBS and a solution of BSA in PBS (1 mg/mL) as a function of shear rate are shown in Figure 7. The values for PBS were close to that of water, obtained from Kaye and Laby 21 and remained constant with increasing shear rate as expected for a Newtonian fluid. However, the measured shear viscosity of the BSA solution was higher than PBS by approximately 25% at a shear rate of 100 s−1, decreasing to 10% at a shear rate of 1000 s−1, reflecting the pseudoplastic, non-Newtonian behavior of the protein solution.
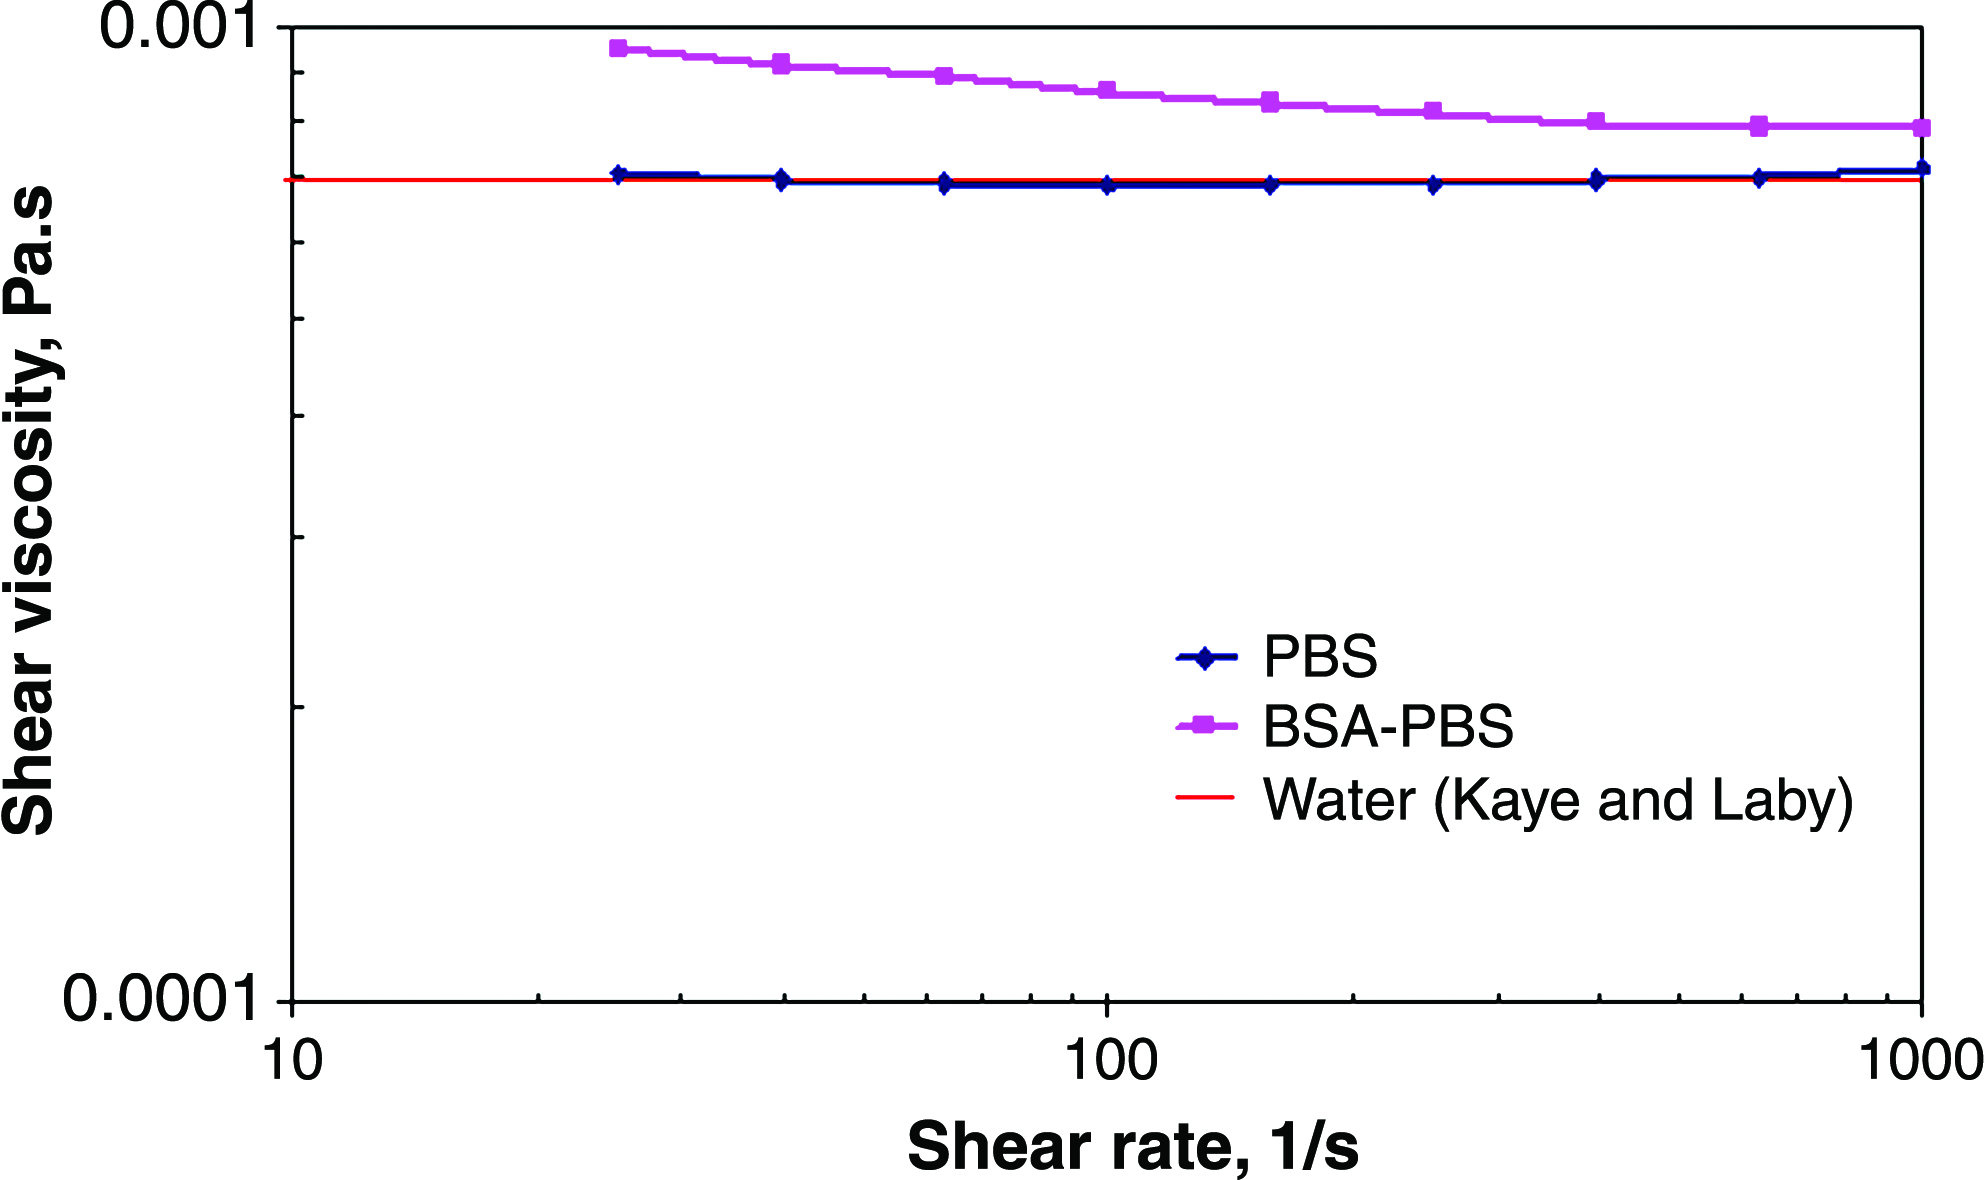
The shear rate dependency of viscosity for water, phosphate-buffered saline (PBS), and a 1 mg/mL solution of bovine serum albumin (BSA) in PBS at 37°C. Color images available online at
Permeability coefficients
A linear relationship between the rate of air flow through a microporous PCL disc and pressure differential was observed (Fig. 8) following Darcy's law (Equation 1). No ruptures or cracks were observed in the specimen as a result of the test. The permeability coefficient was obtained from a linear fit to the data that passed through the origin and was found to be (3.12 ± 0.11) × 10−14 m2 assuming the viscosity of air to be 1.85 × 10⁻⁵ Ns/m2 at 25°C. 17

The relationship between air flow rate through a disc of microporous PCL scaffold material and pressure differential at 25°C. The solid line is a linear fit to the data following Equation 1, and the dashed lines correspond to the ±25% boundaries that limit the applicability of Darcy's law (ASTM D6539).
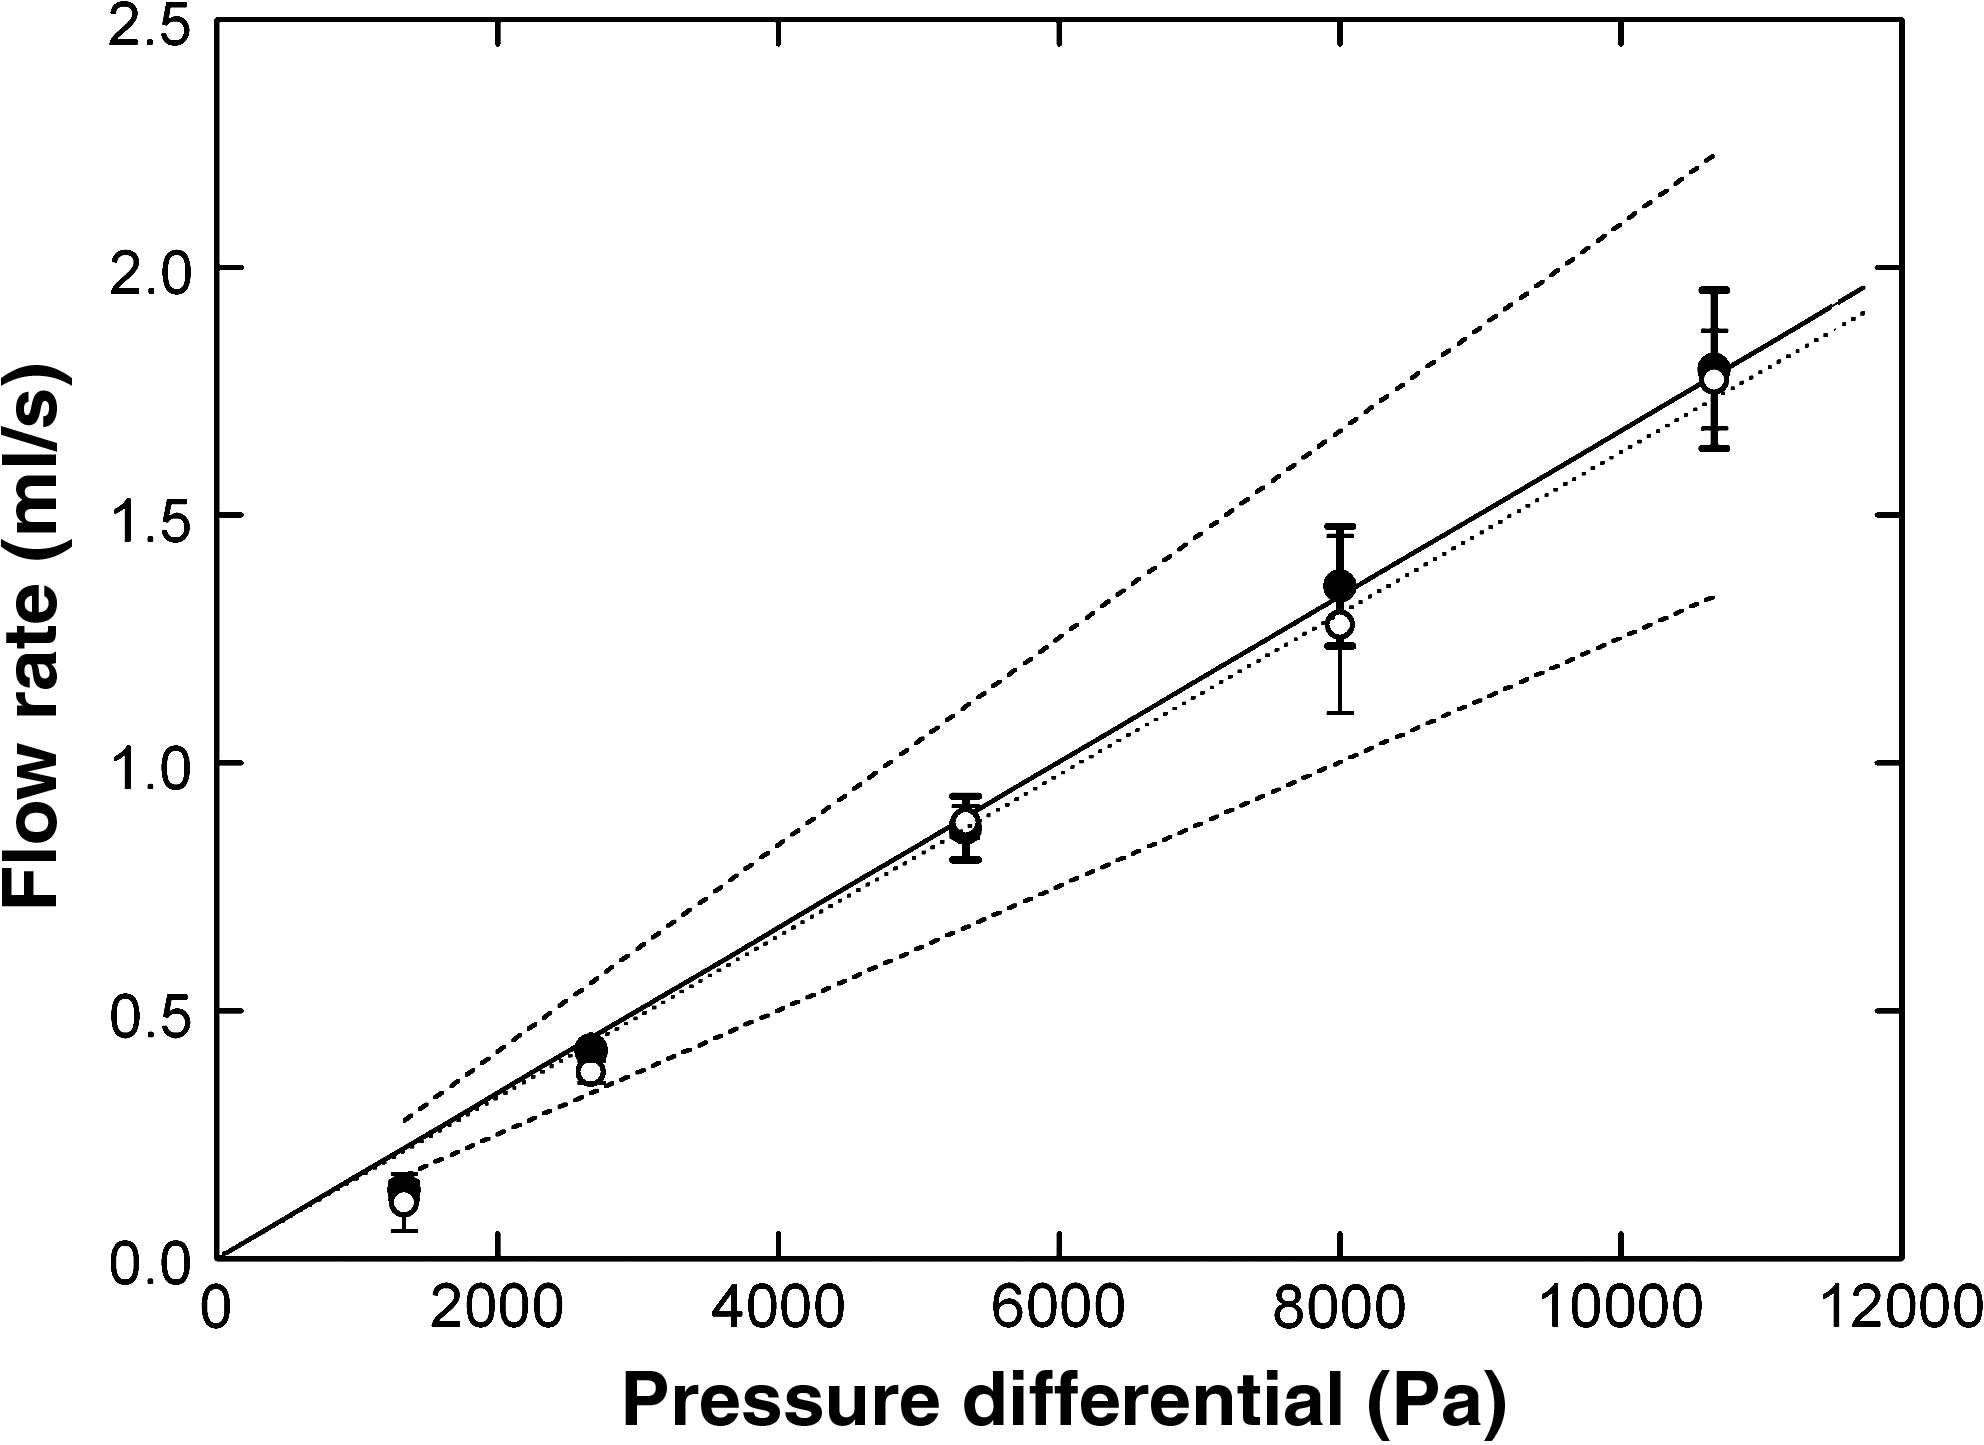
Figure 9 shows a plot of permeation rate versus differential pressure for degassed deionized water derived from measurements of fluid transfer through the wall of a microporous PCL tubular scaffold. The permeability coefficient for water was determined as (6.27 ± 0.35) × 10−14 m2 using Darcy's law, Equation 1. If the PCL tubular scaffold is considered as an array of uniform cylindrical channels (square-packed) of diameter 10 μm over the area of a tube of 7 mm diameter and 50 mm length and experiences a flow rate through the tube wall of 100 mL/min (close to the upper limit achieved in the tests), then a shear rate of approximately 1500 s−1 is generated in theory within each cylindrical channel of the model array. In practice the scaffold geometry will be significantly more complex than this representation due to varying pore size and geometry, converging and diverging connecting channels, and restrictions to flow leading to even higher shear rates. Nevertheless this estimation indicates that very high shear rates are generated for permeating fluids within the scaffold structure.

The relationship between the permeation rate of water through the wall of a microporous PCL tubular scaffold and pressure differential at 37°C. The solid line is a linear fit to the data following Equation 1, and the dashed lines correspond to the ±25% boundaries.
Molecular probes
The Darcy plot shown in Figure 10 shows excellent agreement between pressure differential and the permeation rate of PBS (determined either from conductivity measurements or weight measurements) through the walls of a microporous PCL tubular scaffold. This finding indicates that conductivity measurements provide a reliable, simple way of determining the Darcy permeability coefficient.
Darcy plots for the rate of permeation of PBS through the wall of a microporous PCL scaffold measured by the weight of permeant (○) and conductivity measurements ( ). The solid line is a fit to the data following Equation 1, and the dashed lines correspond to the ±25% boundaries.
Figure 11A shows the cumulative increase in glucose concentration in the BioDynamic sample chamber as a function of time and pressure differential. The corresponding Darcy plots based on (1) the measurement of the weight of permeant (overflow from sample chamber) and (2) the volume of glucose solution transported across the microporous tube wall (derived from concentration measurements) are shown in Figure 11B. There is a good agreement between the two methods, and the Darcy permeability coefficient is the same within experimental error for water, PBS, and glucose solution (Table 1), indicating that there is no interaction of glucose with the PCL scaffold.

(
The cumulative concentration of BSA in the sample chamber due to permeation across the wall of a microporous PCL tubular scaffold also increased with time and pressure differential (Fig. 12A). The corresponding Darcy plot is shown in Figure 12B. The Darcy permeability coefficients obtained using BSA solutions in PBS are significantly lower (∼66%) than those determined for water, PBS, or glucose/PBS solutions. The higher viscosity of the BSA solution in PBS (Fig. 7) is not sufficient by itself to account for the substantial reduction in permeation rate through the scaffold. The reduction may be attributable instead to protein adsorption on the exposed surfaces of the PCL scaffold reducing the net permeation of BSA protein through the scaffold and potentially increasing the resistance to flow. If this interpretation is valid, then there is considerable potential for studying protein–biomaterial surface interactions and how they change with time, through the determination of permeability coefficients.
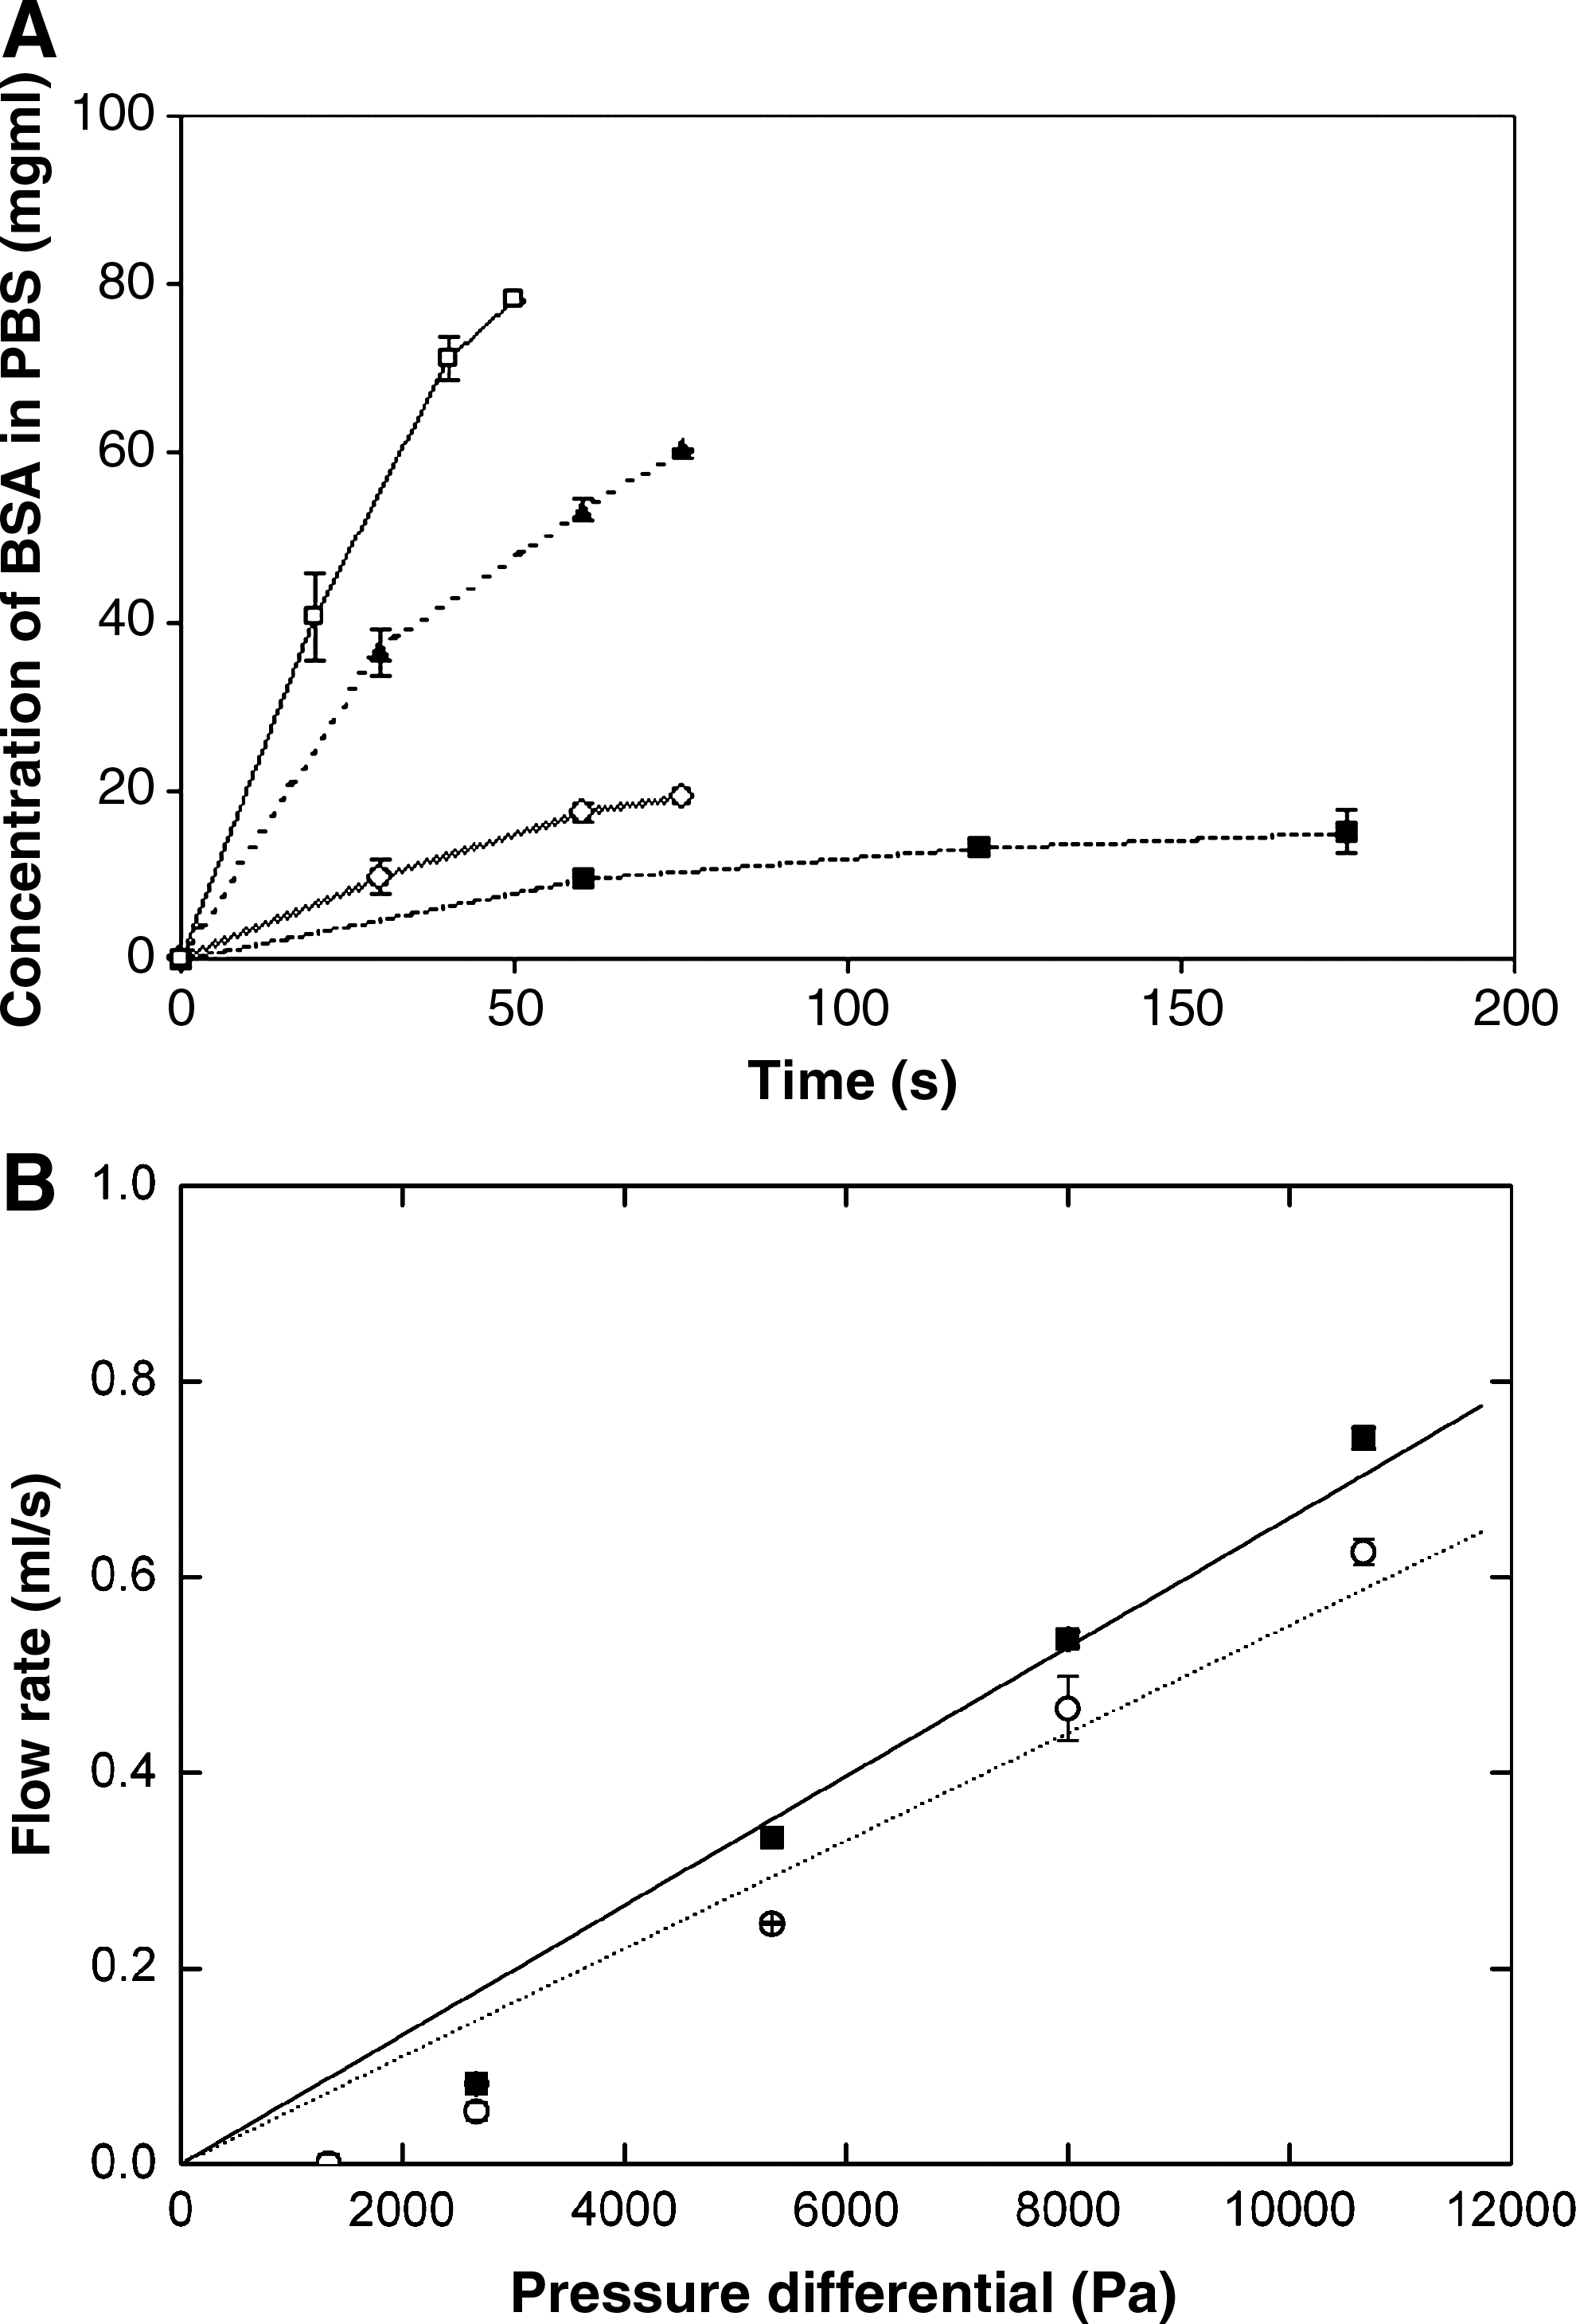
(
Discussion
Investigations of tissue engineering scaffold design, production, and performance tend to focus on the macroporous structure since this defines the geometrical conditions for cell migration and tissue ingrowth. Less attention is paid to the important role of microporous structures within a scaffold that would provide a useful route for nutrient and metabolite transport to and from cells. Microporous features may assume increasing importance in the later stages of tissue repair when macropores are expected to be occupied by new tissue formation. Limited cell migration and tissue ingrowth within scaffolds is already recognized as a major disadvantage of many designs and has been linked with inadequate nutrient diffusion and transport of waste cellular products. Botchwey et al. 22 therefore developed a basic model to characterize the efficiency of nutrient transport (glucose) to bone cells growing within 3D scaffolds under static and dynamic culture conditions in a bioreactor. However, a major limitation of their model derived from the use of estimates of the Darcy permeability constant, which were calculated using estimates of the scaffold tortuosity and an assumption of interconnecting cylindrical pores within the scaffold. Such models would be considerably improved by the availability of actual measurements of Darcy permeability coefficients, which our study provides for microporous PCL. Subsequent improvements in scaffold design and bioreactor design are anticipated.
A recent study 5 showed that lactose (Mw 342) is efficiently transported (90% release in PBS in 9 days) through a PCL matrix comprising a microporous (10–20 μm) phase with dispersed and largely nonconnected macropores (90–250 μm). The present findings of high permeation rates for glucose solution, PBS, and water in microporous PCL matrices help explain the highly efficient release behavior observed previously for lactose. These results also demonstrate conclusively that glucose transport is not impeded by molecular interactions with the scaffold, emphasizing the utility of permeability measurements for assessing the transport properties of small molecules in tissue engineering scaffolds that are vital for cell survival. In addition, measurement of Darcy permeability coefficients using the BioDynamic chamber provided permeation data for PCL tubular scaffolds under fluid flow rates that are relevant to cardiovascular tissue engineering. Blood flow rates of 320 and 450 mL/min, respectively, are experienced in the renal artery under resting and mild exercise conditions. 23
While glucose solution and PBS show similar behavior to water and give comparable permeability coefficients (Table 1), the permeability of the PCL scaffold to protein solution is significantly lower and beyond that expected on the basis of viscosity alone (BSA solution is approximately 10% more viscous than water, the exact value depending on the shear rate). The permeability of the scaffold to protein solution is lower than PBS by a factor of three. There is also a significant difference between the Darcy permeability coefficient derived from direct weighing of the permeant and that determined from protein concentration data with the latter value being some 16% smaller. This observation suggests that protein molecules are being retained in the scaffold. Since the “pore” sizes within the scaffold are in the orders of magnitude larger than the size of a protein molecule (the pore diameters are typically 5–15 μm in diameter while a globular protein is ≈10 nm in diameter), it is likely that protein adsorption on pore and channel surfaces plays a highly significant role in the permeability behavior of macromolecules.
As a quality control tool for porous biomedical materials, measurement of permeability coefficients may be more discriminating than measurements of porosity since fluid flow through scaffolds will differ depending on pore size distribution for a given pressure differential. However, this comparison is not without ambiguity, as the fluid–biomaterial interface will play a more dominant role in narrow diameter pores, increasing the resistance to flow. Care should also be taken in comparing the magnitude of the permeability coefficients for different fluids: that for air is roughly 50% that of water. At first sight this might be taken to mean that the matrix is less permeable to air than water which is counter-intuitive. However, if the viscosity term is also included (the quantity A/L is effectively constant for a batch of tubes [Equation 1]), then the flow of air through the scaffold at a given pressure is around 18 times more than water or PBS. Aside from the major determinant of fluid viscosity, differences in permeation rate may be indicative of the fraction of the structure that is inaccessible to fluid due to the hydrophobicity of the material or simply reflect the complexity of the pore structures and flow patterns that exist within the material. Despite these potential limitations, determination of Darcy permeability coefficients provides a useful quality control measure to monitor the consistency of tissue scaffolds produced using nominally the same material and formulation conditions.
The model of laminar flow through an array of uniform, square-packed, cylindrical channels of diameter 10 μm representing a nonuniform microporous matrix is overly simplistic; in practice the flow pattern will be much more complex. However, this model can provide valuable insights as to the shear rates that exist within the wall of a microporous scaffold intended for vascular tissue engineering, which is exposed to a pressure differential caused by blood flow. Based on a simple model of parallel, cylindrical pores, the shear rate at the permeating fluid–biomaterial interface, using the measured permeation rate and sample geometry, is high at 1500 s−1. What happens to the flow pattern and shear rate in a more complex pore geometry is beyond the scope of this paper, but the calculations described here suggest that the fluid dynamics generated in microporous structures will assist nutrient and metabolite transport. The high shear rates generated may also improve the distribution of cell adhesion molecules such as fibronectin and growth factors such as platelet-derived growth factor (PDGF) and vascular endothelial growth factor to promote tissue ingrowth. The local environment in which cells are expected to thrive will be macroporous and will therefore experience a gentler fluid flow condition.
Footnotes
Acknowledgments
The authors would like to thank Matt Brooks of the National Physical Laboratory for writing the software for capturing laser micrometer data and Crispin Allen also of the National Physical Laboratory for carrying out viscosity measurements. This work was funded by the United Kingdom Department of Trade and Industry as part of the Measurements for Processing program.
Disclosure Statement
No competing financial interests exist.