
Abstract
Advanced therapies medicinal products (ATMPs) have introduced innovative cell-based products. However, the regulatory demands for characterization of ATMPs are currently unable to adequately address the safety of such products. As recent studies have emphasized the role of mitochondria in the osteogenic differentiation of human mesenchymal stem cells (hMSCs), we have studied in detail the viability and osteogenic differentiation potency of the hMSCs intended for use as ATMPs based on analyses of the mitochondrial inner membrane potential (ΔΨm). Flow cytometric measurement of 5,5′,6,6′-tetrachloro-1,1′,3,3′-tetraethylbenzimidazolcarbocyanine iodide (JC-1), propidium iodide fluorescence, and AnnexinV was employed to determine ΔΨm, plasma membrane integrity, and organization of phosphatidylserine in plasma membrane, respectively, in cultured hMSCs. Apoptosis was induced by incubating cells at critical concentration (20 μM) of menadione. 3-(4,5-Dimethylthiazol-2-yl)-2,5-diphenyltetrazolium bromide (MTT) was used as an indicator for cell proliferation and alkaline phosphatase activity and calcium deposition as indicators of osteogenic differentiation. Based on JC-1 fluorescence, cell morphology, organization of phosphatidylserine, and plasma membrane integrity, we could sort cells into four categories that represented different cell quality. A strong correlation between JC-1 and osteogenic differentiation was demonstrated for the first time and thus this analytical tool is suitable not only to determine cell viability but also to predict osteogenic differentiation of hMSC.
Introduction
Apoptosis, that is, “programmed cell death,” has been identified as an intrinsic safety measure of cells after exposure to critical damage. Consequently, cell death or apoptosis may provide a means for measurement of cell viability and offer a tool for method development for advanced therapies medicinal products (ATMP) cell characterization. Apoptosis is executed by the cell itself through highly regulated programmed death that ultimately leads to apoptotic changes in morphology, function, and metabolism. 6 The key roles of mitochondria and cysteinyl aspartate–specific proteinases (caspase) cascades in regulation and execution of apoptosis through two major pathways, extrinsic or intrinsic, have been established.6–8 Depolarization of mitochondrial membrane potential (ΔΨm) and release of several proapoptotic mitochondrial proteins, such as apoptosis inducer factor, Smac/Diablo, and cytochrome c, are commonly known alterations of mitochondrial function that induce apoptosis.9–13 However, due to discrepant data, there is currently no agreement on whether the depolarization of ΔΨm is an early and point of no return event in the process of apoptosis. Recent results have shown that cytochrome c release, and thus caspase activation and other hallmarks of apoptosis, can arise either independently of or as a consequence of ΔΨm depolarization.9,14,15 However, the role of ΔΨm depolarization in regulating apoptosis has been widely accepted as a relevant event in programmed cell death. Moreover, ΔΨm also controls several other important systems that are essential for the proper function of the cells, such as respiration, Ca2+ homeostasis, mitochondrial dynamics, reactive oxygen species scavenging, and ATP synthesis.16–18
Since the demonstration of the role of ΔΨm in apoptosis, several different fluorescence dyes, such as rhodamine123, 3,3′-diethyloxacarbocyanide iodide and tetramethylrhodamine methyl ester, have been used to determine the viability of the cells. These dyes supersede the traditional methods, such as 3-(4,5-dimethylthiazol-2-yl)-2,5-diphenyltetrazolium bromide (MTT), trypan blue, or colony-forming unit counting, as a more accurate markers.19–21 Still most of the dyes continue to have deficiencies, such as altering of the mitochondrial function of certain cell types or low sensitivity for ΔΨm.22–24 On the other hand, use of the fluorescent dye 5,5′,6,6′-tetrachloro-1,1′,3,3′-tetraethylbenzimidazolcarbocyanine iodide (JC-1) to measure reliably ΔΨm has been demonstrated and widely accepted. 23 Use of JC-1 fluorescent dye combined with flow cytometry technique enables the rapid analyses of large amounts of cells.
In summary, closer examination and characterization of mitochondria could be a unique indicator for measuring the condition of cultured cells and for evaluation and quantification of the cellular products. This hypothesis is further supported by recent findings that point to changes in energy metabolism and the role of mitochondria during differentiation. Studies with murine embryonic stem cells and adult monkey stromal cells have shown that mitochondria are important to the differentiation potential of these cells.25,26 Most recently, change from anaerobic glycolysis to mitochondrial respiration and oxidative phosphorylation has been demonstrated by human mesenchymal stem cells (hMSCs) during osteogenic differentiation. 27
Cell- and tissue-based products are regulated in the European Union (EU) as ATMPs and must fulfill criteria of characterization as demanded by Annex I in Directive 2001/83/EC, amended by Directive 2003/63/EC.28–30 However, current regulatory demands and guidances originate from regulations on the characterization of traditional pharmaceutical products, which bear little or no resemblance to living cells intended to repair, regenerate, and restore physiological functions as novel medicinal products. 31
To develop and ensure the safety and efficiency of future cell-based medicinal products and clinical trials, we present that analysis of mitochondrial function, especially ΔΨm, may be useful in determining the viability of cells and also for predicting the osteogenic differentiation potency of hMSCs.
Materials and Methods
hMSC culture and apoptosis induction
Human bone marrow was harvested from patients (from 11 to 84 years old), who were operated for osteoarthrosis (older patients) or for scoliosis (younger patients). The hMSCs were cultured as described earlier. 32 Briefly, hMSCs from bone marrow were allowed to attach to culture flasks in a medium containing alpha minimum essential medium (MEM) buffered with 20 mM HEPES and containing 10% heat-inactivated fetal bovine serum (Promo Cell, Heidelberg, Germany), 100 U/mL penicillin, 0.1 mg/mL streptomycin, 2 mM L-glutamine (all reagents from Sigma-Aldrich Chemie, Steinheim, Germany unless otherwise indicated). Cells were cultured at 37°C in 5% CO2 and 95% air. After 2 days, the medium was changed and nonattached cells were washed away. Attached cells were cultured in flasks for 1–2 weeks until reached confluence. The medium was changed twice a week. For further analysis, cells in passages 1 to 4 were used.
Apoptosis was induced by incubating cells at critical concentration (20 μM) of menadione (MQ) for different time lapses (0–7 h). MQ has been reported to induce apoptosis at low concentrations (10–20 μM) and necrosis at high concentrations (100–500 μM). 33
Flow cytometric analysis of mitochondrial membrane potential and cell viability
hMSCs were detached from culture flasks and resuspended in phosphate buffer saline (PBS) (100,000 cells/mL). One sample of the cells was stained by incubating with 1 μM JC-1 (1 μg/mL) for 30 min at 37°C. After a wash with PBS, cells were incubated with AnnexinV-Alexafluor647 (Invitrogen, Carlsbad, CA) for 10 min at room temperature in AnnexinV working buffer containing 10 mM HEPES, 140 mM NaCl, 2.5 mM CaCl2, and 0.5% bovine serum albumin (BSA) pH 7.4. Another sample was used for plasma membrane integrity assay by incubating with propidium iodide (PI) (0.25 μg/mL; Becton Dickinson, Heidelberg, Germany) for 15 min at room temperature. As a positive control, the protonophore carbonyl cyanide m-chlorophenylhydrazone (CCCP; final concentration 50 μM) was used to depolarize the ΔΨm and as a FL1 single control of JC-1.
JC-1 has been widely accepted as the most sensitive and reliable probe for determining ΔΨm. 23 In the presence of high ΔΨm, JC-1 accumulates into mitochondria and forms aggregates with an emission maximum at 590 nm. Upon depolarization of ΔΨm, it returns to a monomer with emission maximum at 530 nm, when excited at wavelengths close to 490 nm. This behavior allows dual emission detection, which makes JC-1 advantageous by eliminating some ambiguities of single-wavelength probe data.
Samples were analyzed using FACSCalibur (Becton Dickinson), equipped with laser emitting at 488 nm. JC-1 monomers were detected in FL1 using a 530/30 nm bandpass filter. The emission of JC-1 aggregates and PI was detected in FL2 using a 585/42 nm bandpass filter. Simultaneous staining with JC-1 and AnnexinV-Alexafluor647 was analyzed using FACSAria (Becton Dickinson), equipped with laser emitting at 488, 633, and 407 nm. The emission of AnnexinV-Alexafluor647 was detected in Alexafluor647 using a 660/20 nm bandpass filter. Compensation for signal spillover was performed off line with the FlowJo software (TreeStar Inc. Ashland, OR). Flow cytometry data were also analyzed with FlowJo. Cell debris was gated out from all samples and the rest of the cell population was analyzed.
Flow cytometric analysis of surface antigens
The minimal criteria panel of surface antigens proposed by the Mesenchymal and Tissue Stem Cell Committee of the International Society for Cellular Therapy to characterize hMSCs was performed. hMSCs were detached from culture flasks and suspended in PBS + 0.5% BSA (100,000 cell/mL). Following conjugated antibodies were incubated for 20 min at room temperature: CD13 (allophycocyanin (APC); BD Biosciences, Heidelberg, Germany), CD44 (fluorescein (FITC); BD Biosciences), CD49e (phycoerythrin (PE); BD Biosciences), CD29 (APC; BD Biosciences), CD90 (FITC; Stem Cell Technologies, Grenoble, France), CD73 (PE; BD Biosciences), HLA-ABC (APC; BD Biosciences), and CD105 (FITC; Abcam, Cambridge, United Kingdom). Negative surface antigens for hMSCs were incubated simultaneously as a group in a same sample: HLA-DR (PE; BD Biosciences), CD34 (PE; BD Biosciences), CD45 (PE; BD Biosciences), CD14 (PE; BD Biosciences), and CD19 (PE; BD Biosciences). In addition, following isotype controls were used: FITC Mouse IgG2a k (BD Biosciences) and PE Mouse IgG2a k (BD Biosciences). After incubation, cells were washed with PBS + 0.5% BSA and analyzed by FACSAria, equipped with laser emitting at 488, 633, and 407 nm. FITC, PE, and APC channels were used to detect the emission of conjugated surface antigens. Flow cytometric data were analyzed with FlowJo. Cell debris was gated out from all samples. Based on isotype controls and unlabeled cells, the gate for positive cells was defined.
MTT proliferation assay
hMSCs were cultured in 96-well plates in six replicates. Five hundred cells per well were plated, and cell proliferation was measured by MTT assay after 1, 7, and 14 days culture as described below. MTT was added to the medium at a final concentration of 0.5 mg/mL, and cells were incubated for 2 h at 37°C in 5% CO2 and 95% air. After incubation, the staining solution was removed and 100 μL per well of dimethyl sulphoxide was added. The absorbance of reduced form of MTT was measured at 550 and 650 nm (background) in a plate reader (Victor 2; Wallac Oy, Turku, Finland).
Induction of osteogenic differentiation and determination of specific alkaline phosphatase activity
hMSCs were cultured in 96-well plates for 21 days in osteogenic induction medium with 100 nM dexamethasone, 10 mM β-glycerolphosphate, and 0.05 mM ascorbic acid-2-phosphate or in basic cell culture medium (control). The number of plated cells per well was 1500, and these were plated in four replicate. After 3 weeks' cell culture, cells were assayed as described below. The assay buffer, containing 0.1% Triton-X-100, pH 7.6, was added to each well, and plates were frozen overnight at −70°C. After thawing and mixing the content of wells, alkaline phosphatase (ALP) activity was determined using 0.1 mM 4-p-nitrophenylphosphate as a substrate and absorbance was read at 405 nm in a plate reader (Victor 2; Wallac Oy). Four parallel samples were measured in duplicate. The protein contents of the wells were determined by Bio-Rad Protein Assay (Bio-Rad Laboratories, Hercules, CA). The specific ALP activity was expressed as absorbance at 405 nm/mg/mL protein.
van Kossa stain procedure
Induction of osteogenic differentiation was performed as mentioned above. The presence of calcium deposits was detected by van Kossa staining. Briefly, cells were washed with PBS and fixed in 4% paraformaldehyde for 10 min at room temperature. After fixation, cells were washed once with PBS and stained with 1.0% silver nitrate for 30 min under the ultraviolet light. After that cells were washed three times with water and then incubated in 2.5% sodium thiosulfate for 5 min. Finally, cells were washed with water and air dried before microscope detection.
Determination of calcium content
The induction of osteogenic differentiation was performed as mentioned above. After 5 weeks differentiation period, the calcium content was measured as described below. After osteogenic induction, 0.6 M HCL was added to cells and incubated overnight at room temperature. Calcium content was determined based on the reaction of calcium with o-cresolphthalein-complexone according to the manufacturer's instruction (Roche Diagnostics Corporation, Indianapolis, IN). The colorimetric reaction was measured at 550 nm in a plate reader (Victor 2; Wallac Oy). Four parallel samples were measured in duplicate.
Induction of adipogenic differentiation and detection of lipogenic activity
hMSCs were seeded at a density of 3000 cells/cm2 in basic proliferation medium in 12-well plate. After cells were proliferated near confluence, the adipogenic induction medium with 0.1 mM indomethasin, 0.5 mM 3-isobutyl-1-methylxanthine (Promo Cell), 0.4 μg/mL dexamethasone (Promo Cell), and 0.5 μg/mL insulin (Promo Cell) was added. Cells were grown in induction medium for 4 days and after that terminal differentiation medium with 0.1 mM indomethasin, 0.5 μg/mL insulin, and 3.0 μg/mL ciglitazone (Promo Cell) was added. After 21 days differentiation, intracellular accumulation of lipids was detected by Sudan III staining. Cells were washed with PBS and fixed with 4% paraformaldehyde for 10 min at room temperature and washed once with water. After that Sudan stain was added, and cells were incubated for 1 h at room temperature and washed with water before detection with microscope.
Induction of chondrogenic differentiation
hMSCs were suspended in basic proliferation medium at a density of 2 × 10⁵ in 15 mL tube with cone-shaped bottom. Cells were spun to the bottom of tubes, and the differentiation medium with 10 ng/mL transforming growth factor-β, 0.1 mM ascorbic acid-2-phosphate, 100 nM dexamethasone, 1:100 ITS + Premix (BD Biosciences), and 40 μg/mL proline was added. After 14 days differentiation period, the acid mucosubstances were detected by Alcian Blue staining.
Statistical methods
The statistics were evaluated using Student's t-test. All the diagrams and analyses were carried out using Origin (Version 8) statistical software. For correlation studies r-value was used when linear fitting analysis was performed.
Results
Demonstration of multipotency and identity of hMSCs
Human bone marrow–derived mesenchymal stem cells used in this study were characterized as proposed by Mesenchymal and Tissue Stem Cell Committee of International Society of Cellular Therapy. 33 The multipotency of hMSCs was demonstrated by in vitro differentiation into three mesenchymal lineages, namely osteogenic, adipogenic, and chondrogenic (Fig. 1). In addition, the analysis of surface antigens was performed. hMSCs were positive for CD73, CD90, CD105, CD44, CD49e, CD13, CD29, and HLA-ABC, whereas negative for HLA-DR, CD34, CD45, CD19, and CD14 (Fig. 1). These characterizations clearly show that cells used in this study fulfill the criteria needed for hMSCs.

Determination of multipotency and identity of hMSCs. (
Characterization of the cells with different ΔΨm
To test our hypothesis that ΔΨm can be used to determine cell viability, we analyzed the hMSCs by different reagents, such as rhodamine123 and JC-1. Pilot studies (not shown) demonstrated the weaknesses of rhodamine123 to detect alterations in ΔΨm reliably when the protonophore CCCP was used as a positive control. Thus, JC-1 was selected for further experimentation. Preliminary results showed three distinct populations with high, intermediate, and low ΔΨm. Further analyses showed that cells with intermediate ΔΨm can be divided into two distinct classes based on morphology, plasma membrane integrity, and organization of phosphatidylserine (PS) in plasma membrane (Fig. 2A, B and Table 1). Trials were made to employ simultaneous staining with PI and JC-1, but because of the wide overlap of the fluorescence spectra, JC-1 and PI intake could not be determined from the same cell. Most of the PI-positive cells also had totally or partially collapsed ΔΨm (groups R3 and R4), whereas cells that were negative for PI were characterized by normal or slightly decreased ΔΨm (groups R1 and R2 in Fig. 2A and Table 1). The four different properties of cells, ΔΨm, morphology, plasma membrane integrity, and proper organization of PS in plasma membrane, allowed us to identify four distinct subpopulations of hMSCs in the isolated cell mass. The first population included cells with high ΔΨm, normal morphology, and negative for PI and AnnexinV. These were marked as R1 and considered to be healthy normal cells. A second group, marked as R2, consisted of cells with intermediate ΔΨm, slight change in morphology (usually enlarged cell size and granularity, forward scattering [FSC] vs. side scattering [SSC]), and also changes in PS organization in plasma membrane (slight increase of AnnexinV–positive cells) but normal plasma membrane integrity (negative for PI). A third group included cells with more collapsed ΔΨm and clearly reduced cell sized and were marked as R3. Large part of these cells was also PI and AnnexinV positive, indicating that this population consists mostly of early and late apoptotic cells. The last group, marked as R4, consisted of cells with totally collapsed ΔΨm. These cells were all PI- and AnnexinV positive and showed reduced cell size, indicating that they were mostly late apoptotic or necrotic. As a positive control for JC-1 staining, CCCP was used. Exposure to CCCP caused a shift from R1 and R2 to R4 and R3. Cells in R4 still showed normal morphology, which indicates that they were healthy and normal cells that responded to CCCP (results not shown).
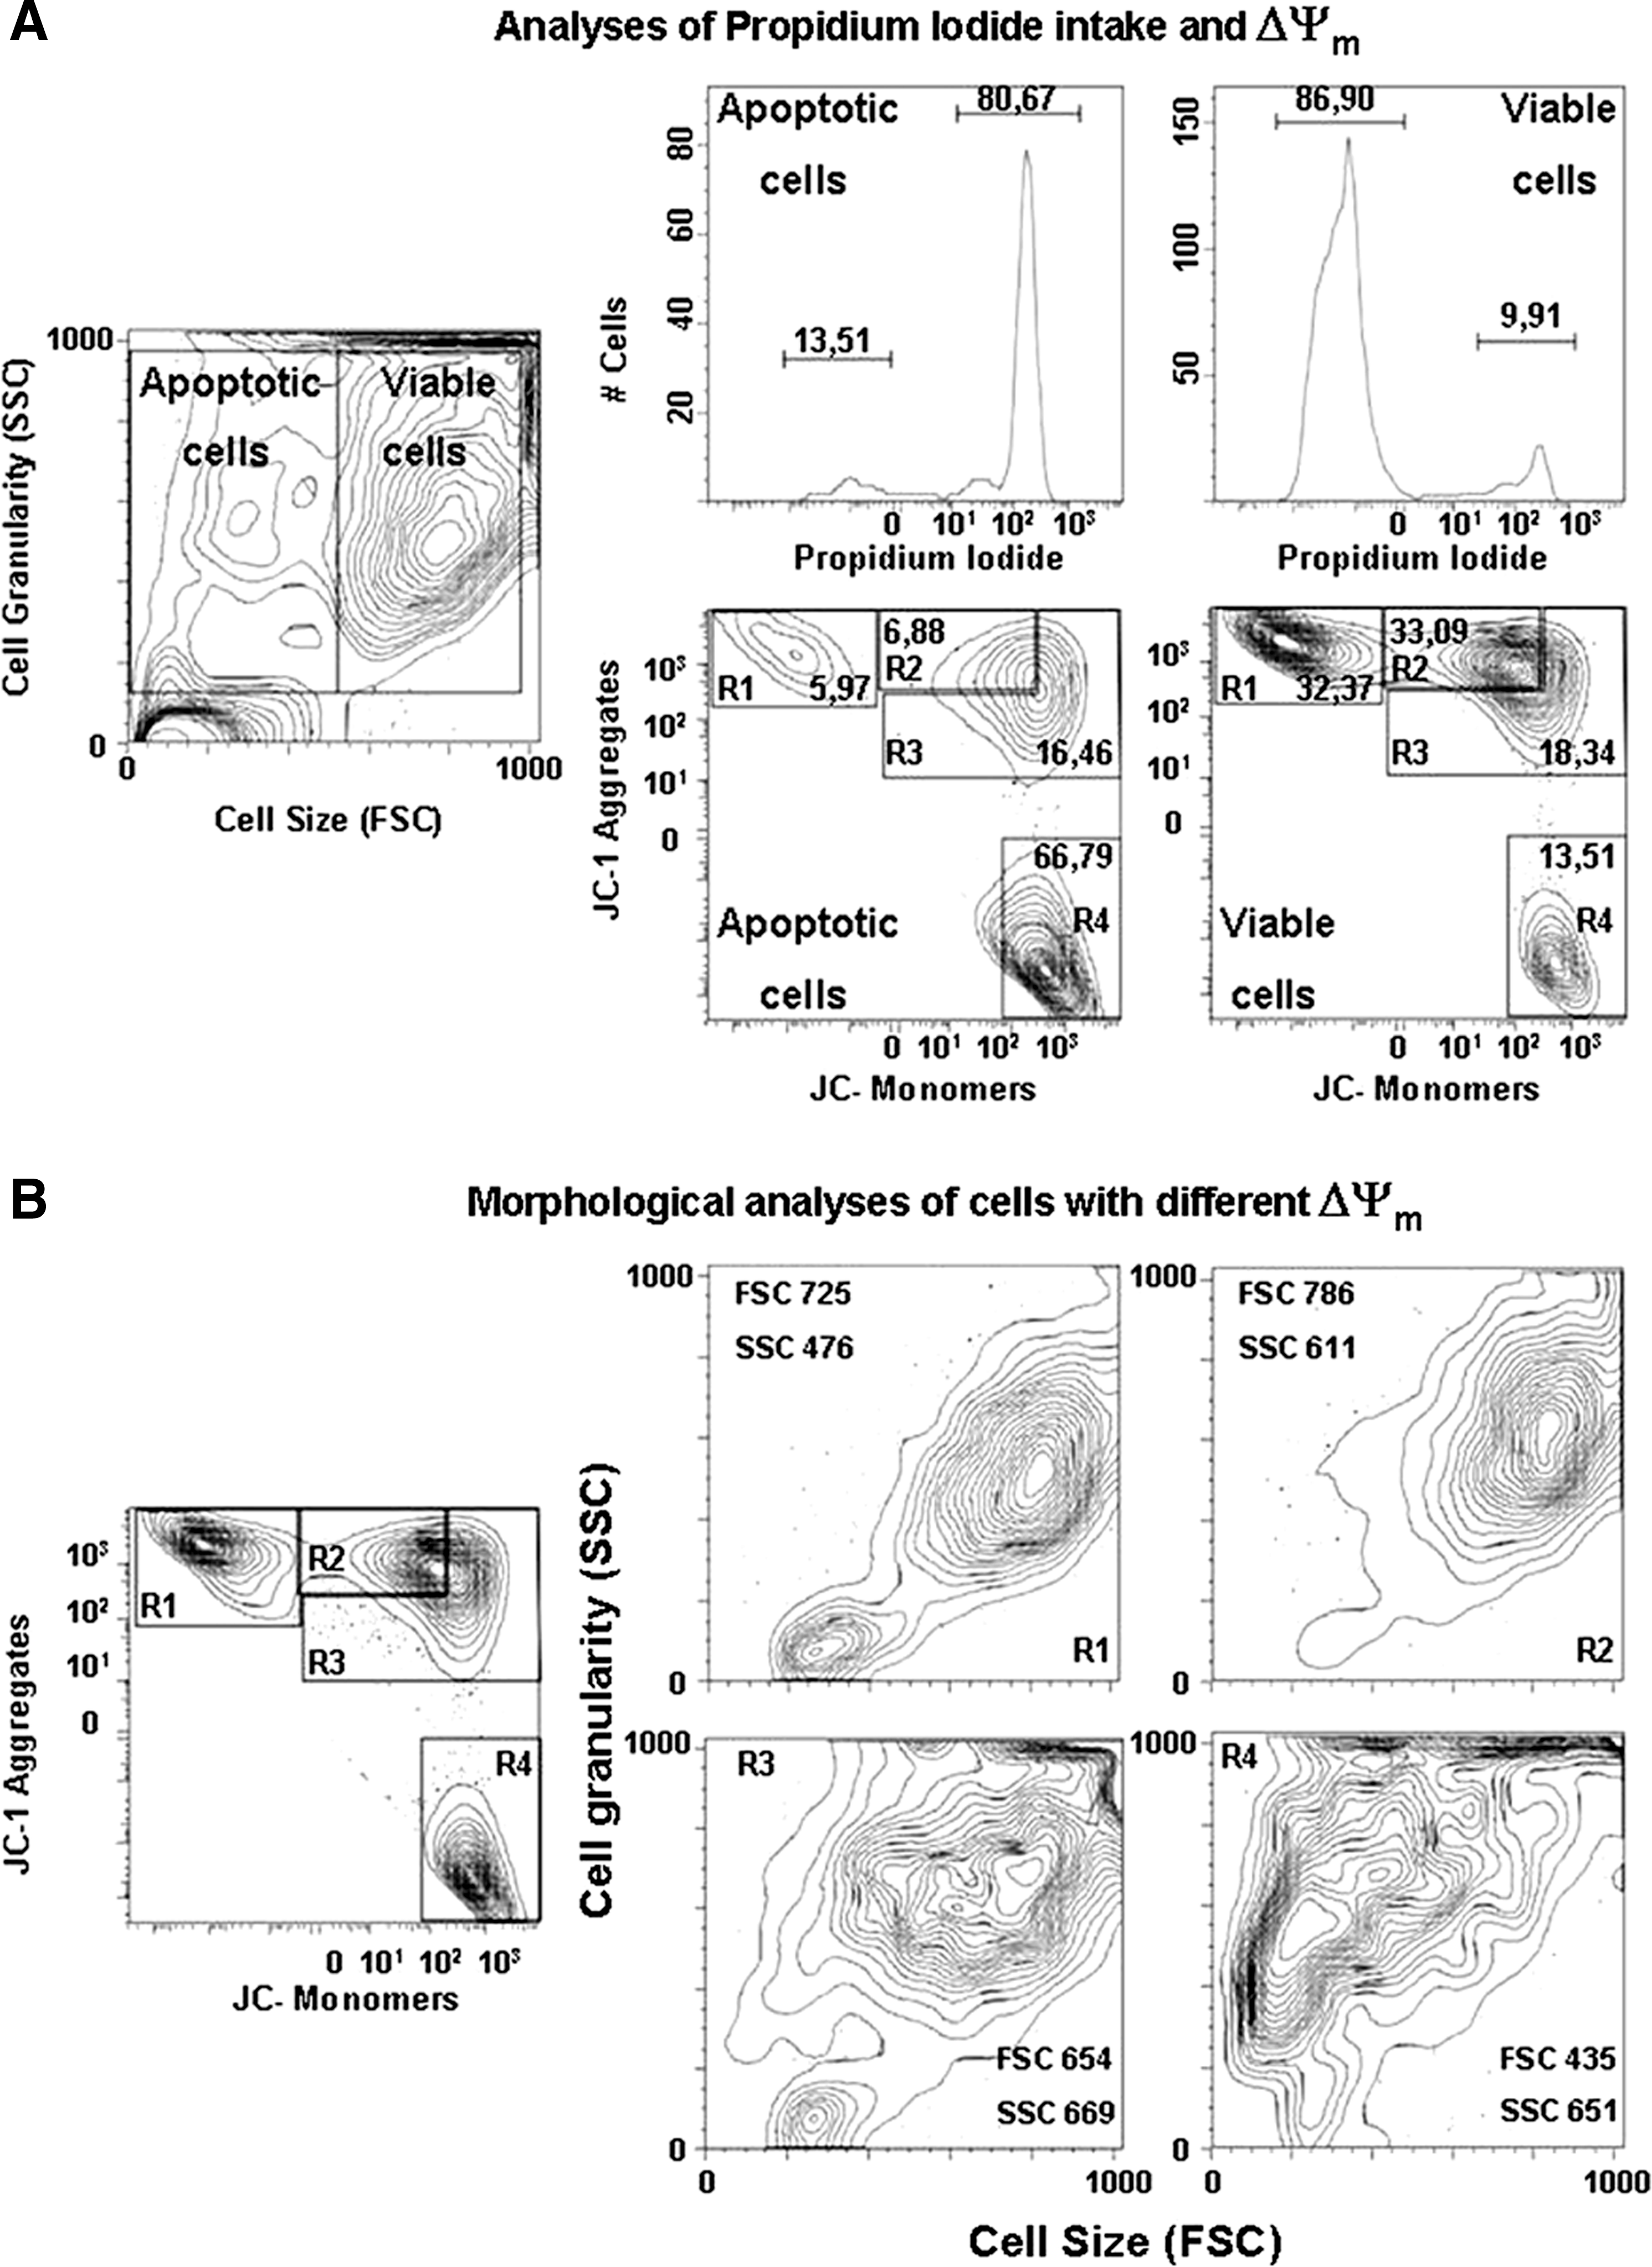
Flow cytometric characterization of hMSCs with different ΔΨm. Division of cells into four subpopulations was performed based on cell membrane integrity, JC-1 staining, and morphology. (
The percentage of propidium iodide–positive cells, AnnexinV–positive cells together with AnnexinV intensity increased significantly (p < 0.001) in groups R2, R3, and R4. The results are represented as mean ± standard deviation of four parallel experiments.
Student's t-test p-value p < 0.001 when compared with subpopulation R1.
hMSCs, human mesenchymal stem cells.
Assay of induced apoptosis
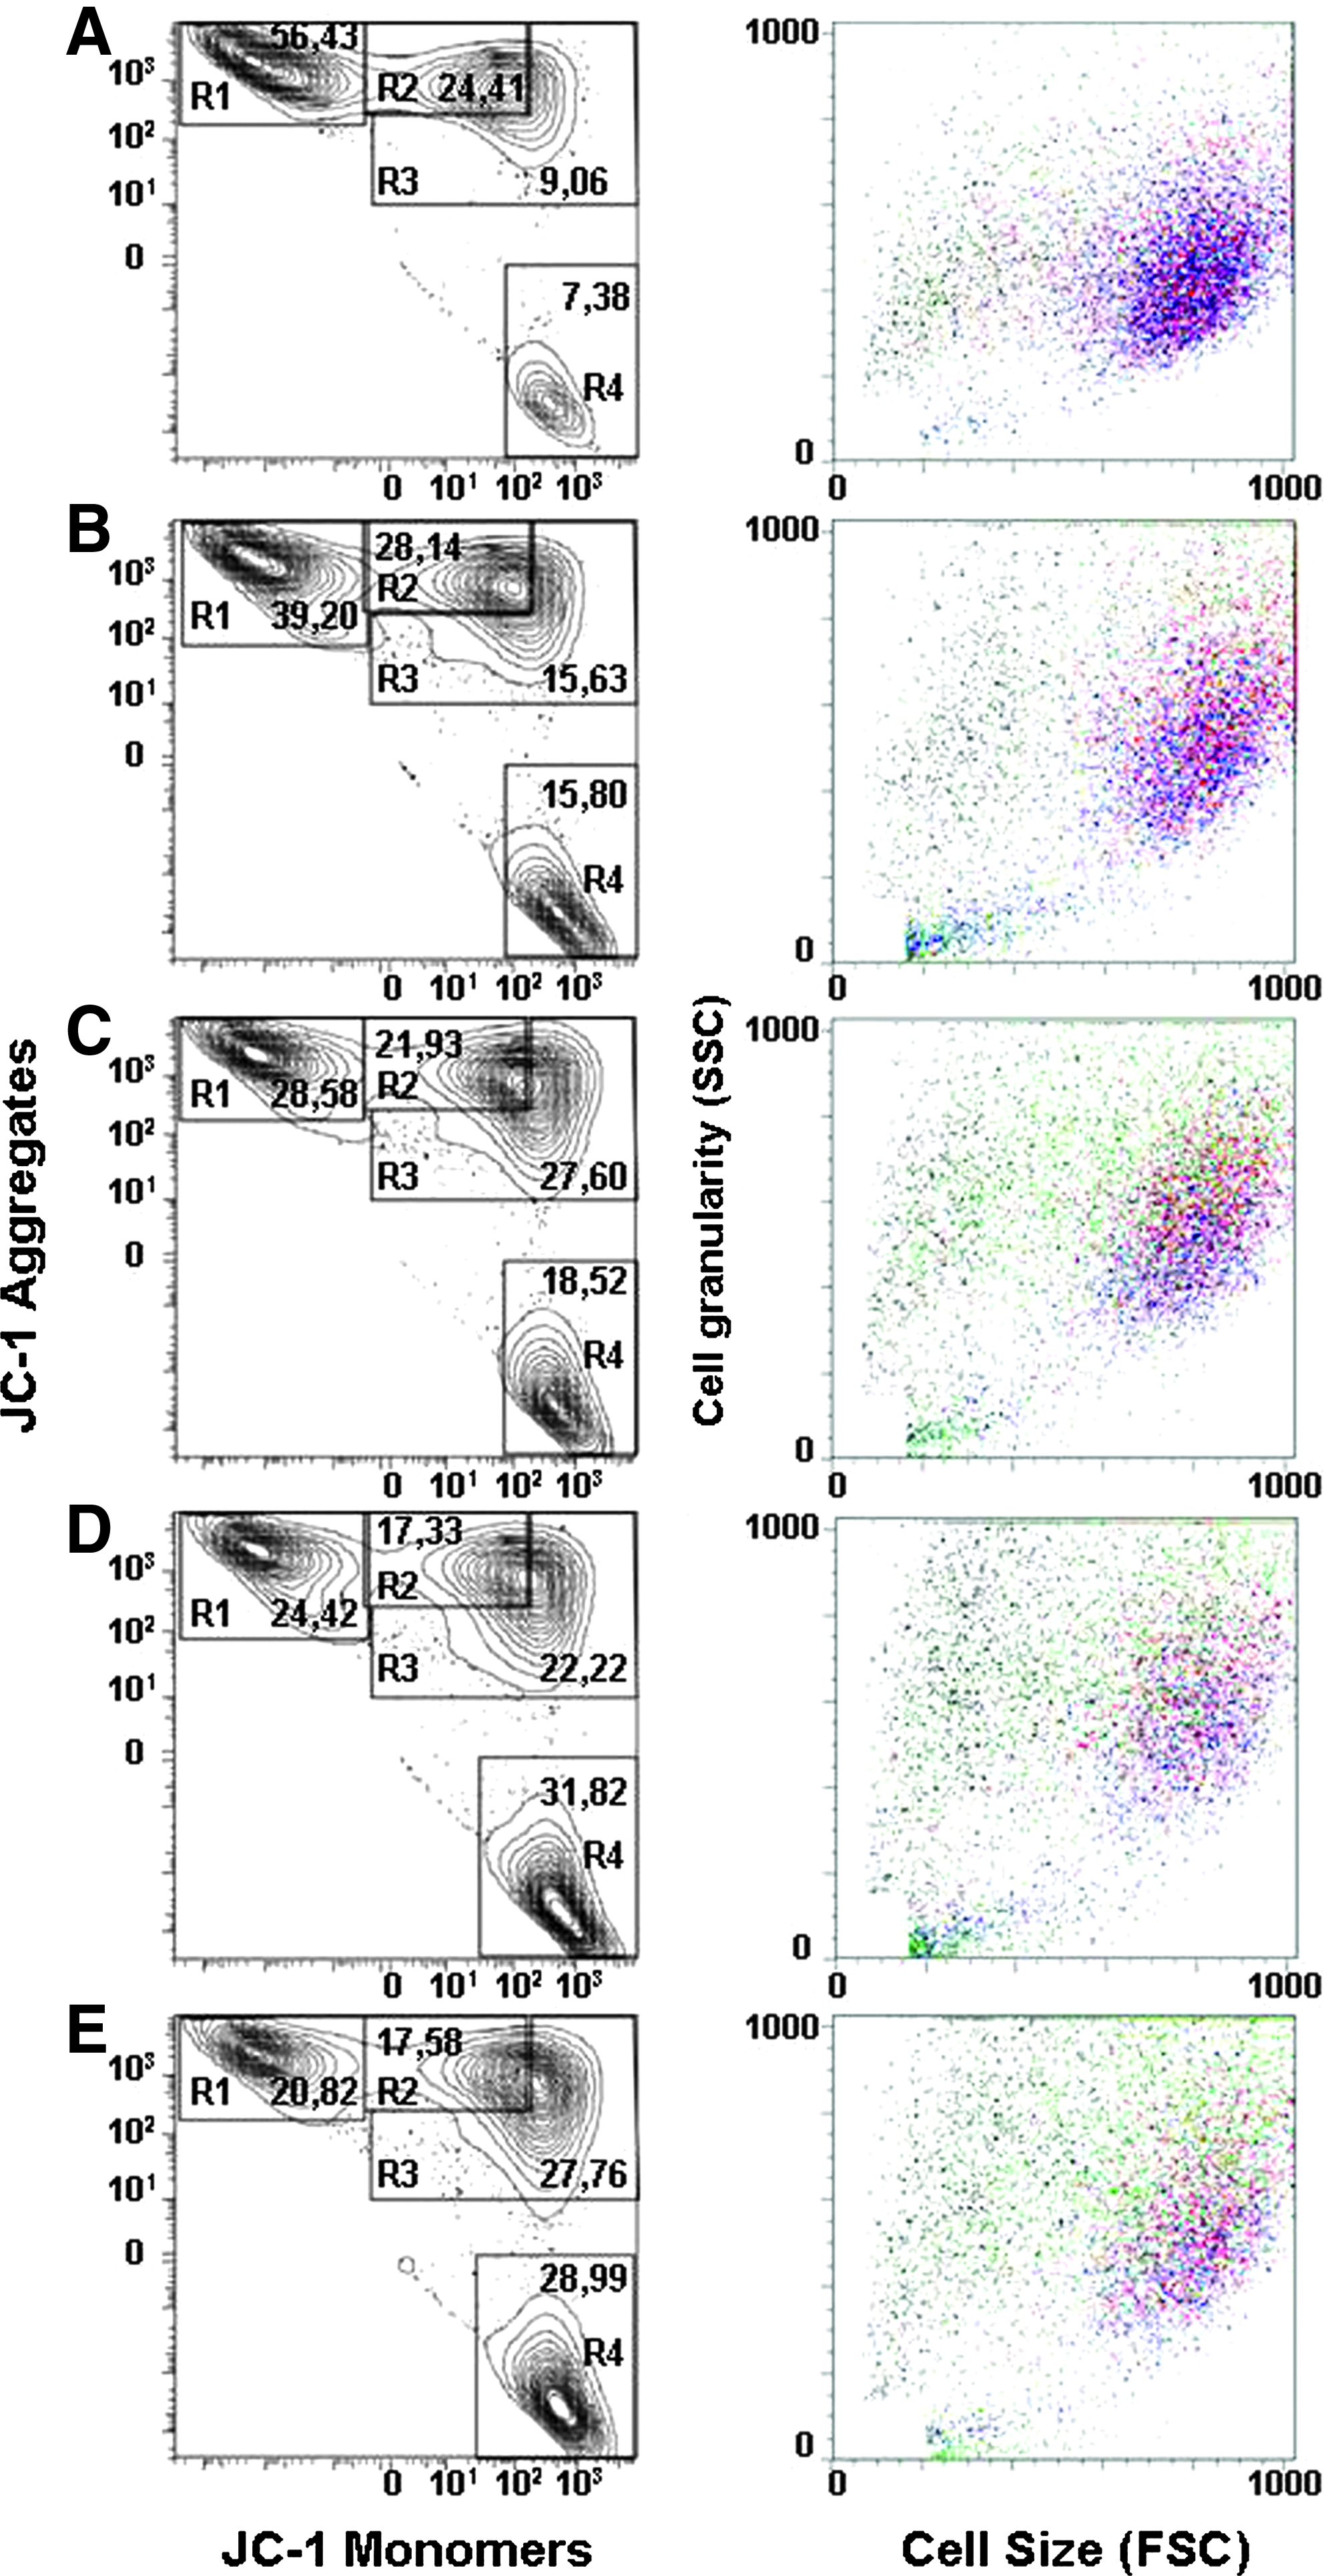
Next we tested whether our hypothesis was in accordance with the biological model with experimental mitochondrial and cell damage. To do so, we used MQ, which has been widely used to induce apoptosis through oxidative stress by forming superoxide anions and other reactive oxygen species, known risk factors also for further DNA damage. 34 hMSCs were exposed to the critical dose of MQ (20 μM) for 0, 2, 4, 5, and 7 h (Fig. 3). The proportion of cells with high ΔΨm gradually decreased during MQ exposure until after 7 h most of the cells had shifted to R3 and R4 that represented early and late apoptotic cells with reduced cell size with totally or partially collapsed ΔΨm (Fig. 4A). At the early phase of MQ-induced apoptosis, a dramatic shift from R1 into the R3 cell category occurred, and only after 5 h exposure to MQ, significant alterations were evident in the proportion of cells in groups R2 and R4. Finally, there was a 10-fold increase in the amount of cells in group R4 (Fig. 4A).

Kinetic analysis of MQ-induced apoptosis. ΔΨm and morphology (cell size and granularity) of cells were analyzed after (

Functional studies of MQ-exposed cells. (
To further clarify the functional properties of MQ-exposed cells and to obtain more information on the meaning of the changes in JC-1 staining pattern in the context of normal function of the cells, we determined the osteogenic differentiation potency and proliferation rate of the exposed cells. As shown in Figure 4B, C, a gradual decrease in specific ALP activity and proliferation did occur during MQ exposure.
Comparison of ΔΨm in different hMSC lines
To demonstrate the wide variability in quality of hMSCs from different donors and thus emphasize the importance of the development of further analytical tools for stem-cell characterization, we analyzed cells from five different donors. As expected, a wide variability in mitochondrial quality was evident. The proportion of cells having high ΔΨm (percentage of cells in group R1) varied greatly between hMSC lines even though the cells were not exposed to any apoptosis inducers (Fig. 5). Further functional studies also showed a difference in proliferation rate and in osteogenic differentiation potential between cells having different JC-1 staining pattern (Fig. 6A, B). The best hMSC line 322 showed the highest specific ALP activity and also the greatest proportion of cells in R1, whereas 319 and 316 showed lowest specific ALP activity and the proportion of the cells in R1. The above data therefore confirm that normal mitochondrial function is essential for hMSCs to achieve the level of osteogenic differentiation and proliferation rate, which is necessary for tissue regeneration.
The analyses of mitochondrial quality and cell morphology of several hMSC lines from different donors. Cell lines (
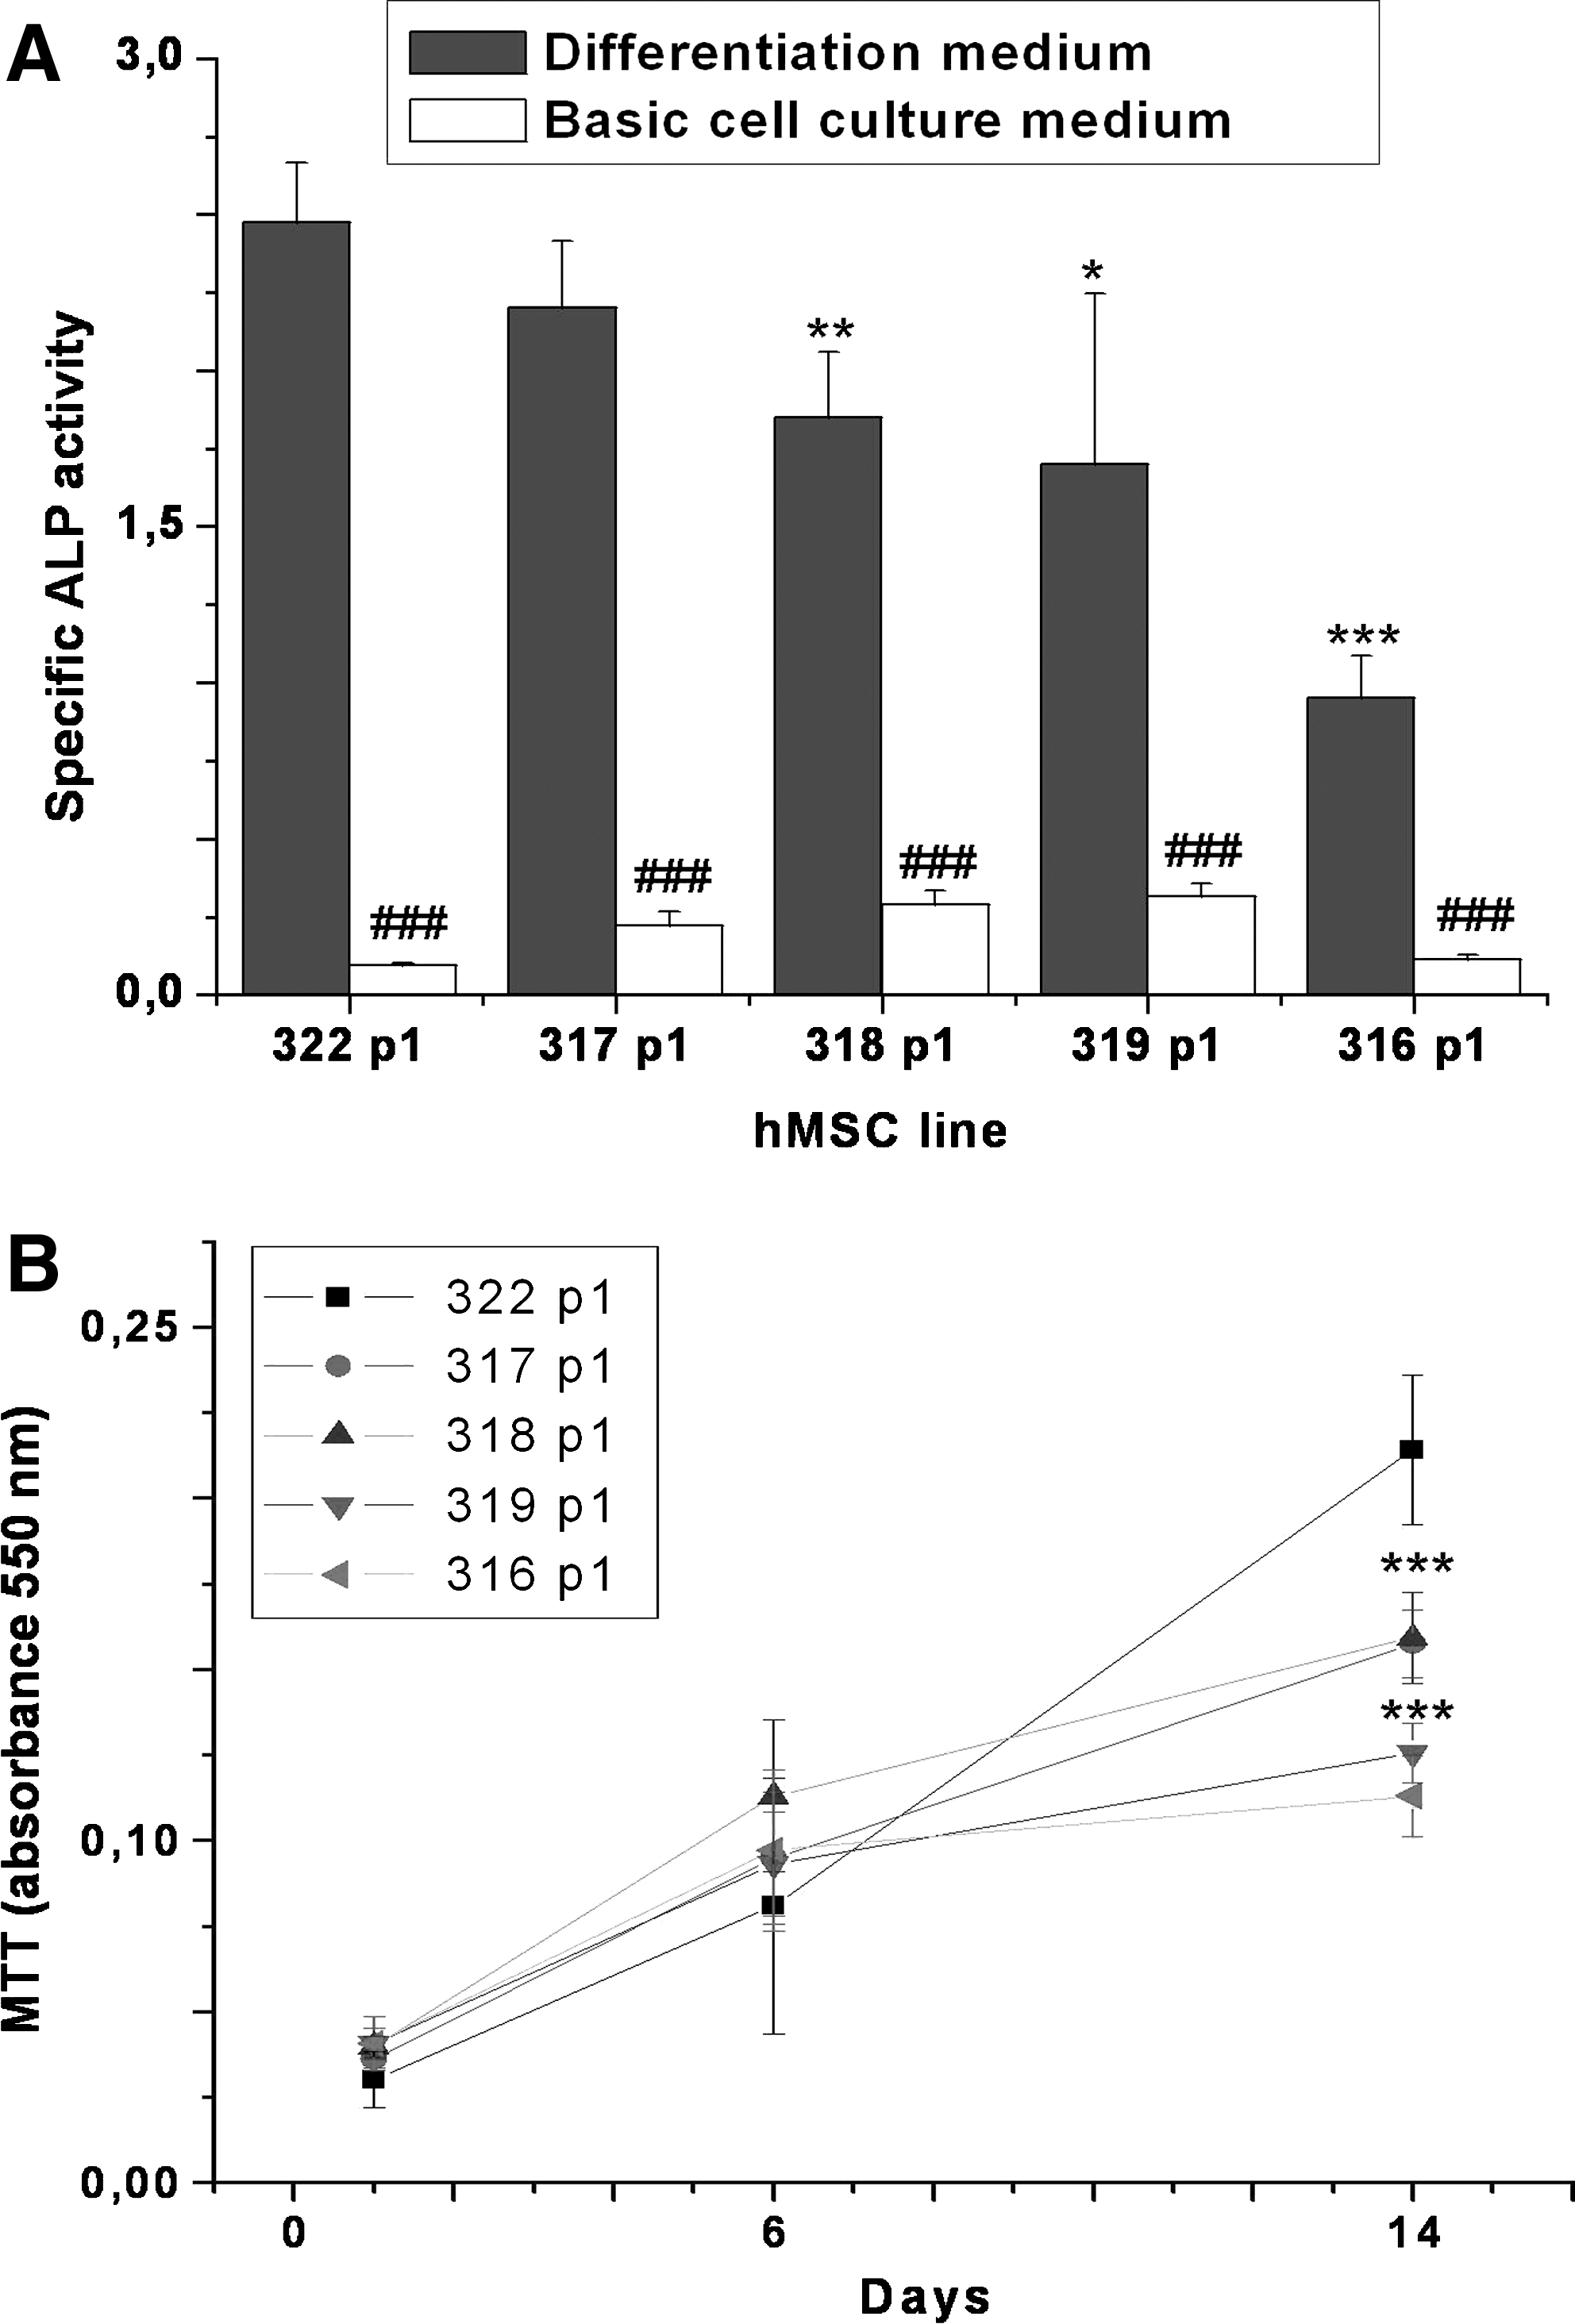
Functional study of hMSC lines with different mitochondrial quality. (
Correlation between ΔΨm and osteogenic differentiation
Earlier results from hMSC line comparison and apoptosis induction by MQ lead us to study whether the JC-1 staining could be used to predict the osteogenic differentiation potential of hMSCs that are a potential source for use in future cell therapies for bone defects. Accordingly, hMSCs with different quality of mitochondria were analyzed, and the osteogenic differentiation capacity was determined. Seventeen hMSC populations with different level of mitochondrial quality were subjected to ΔΨm and specific ALP activity analyses. Samples included hMSC populations from adult and child donors. The correlation between specific ALP activity and FL2/FL1 (JC-1 aggregates/JC-1 monomers) ratio was strong with an r-value of 0.80 (p < 0.0005) (Fig. 7A).
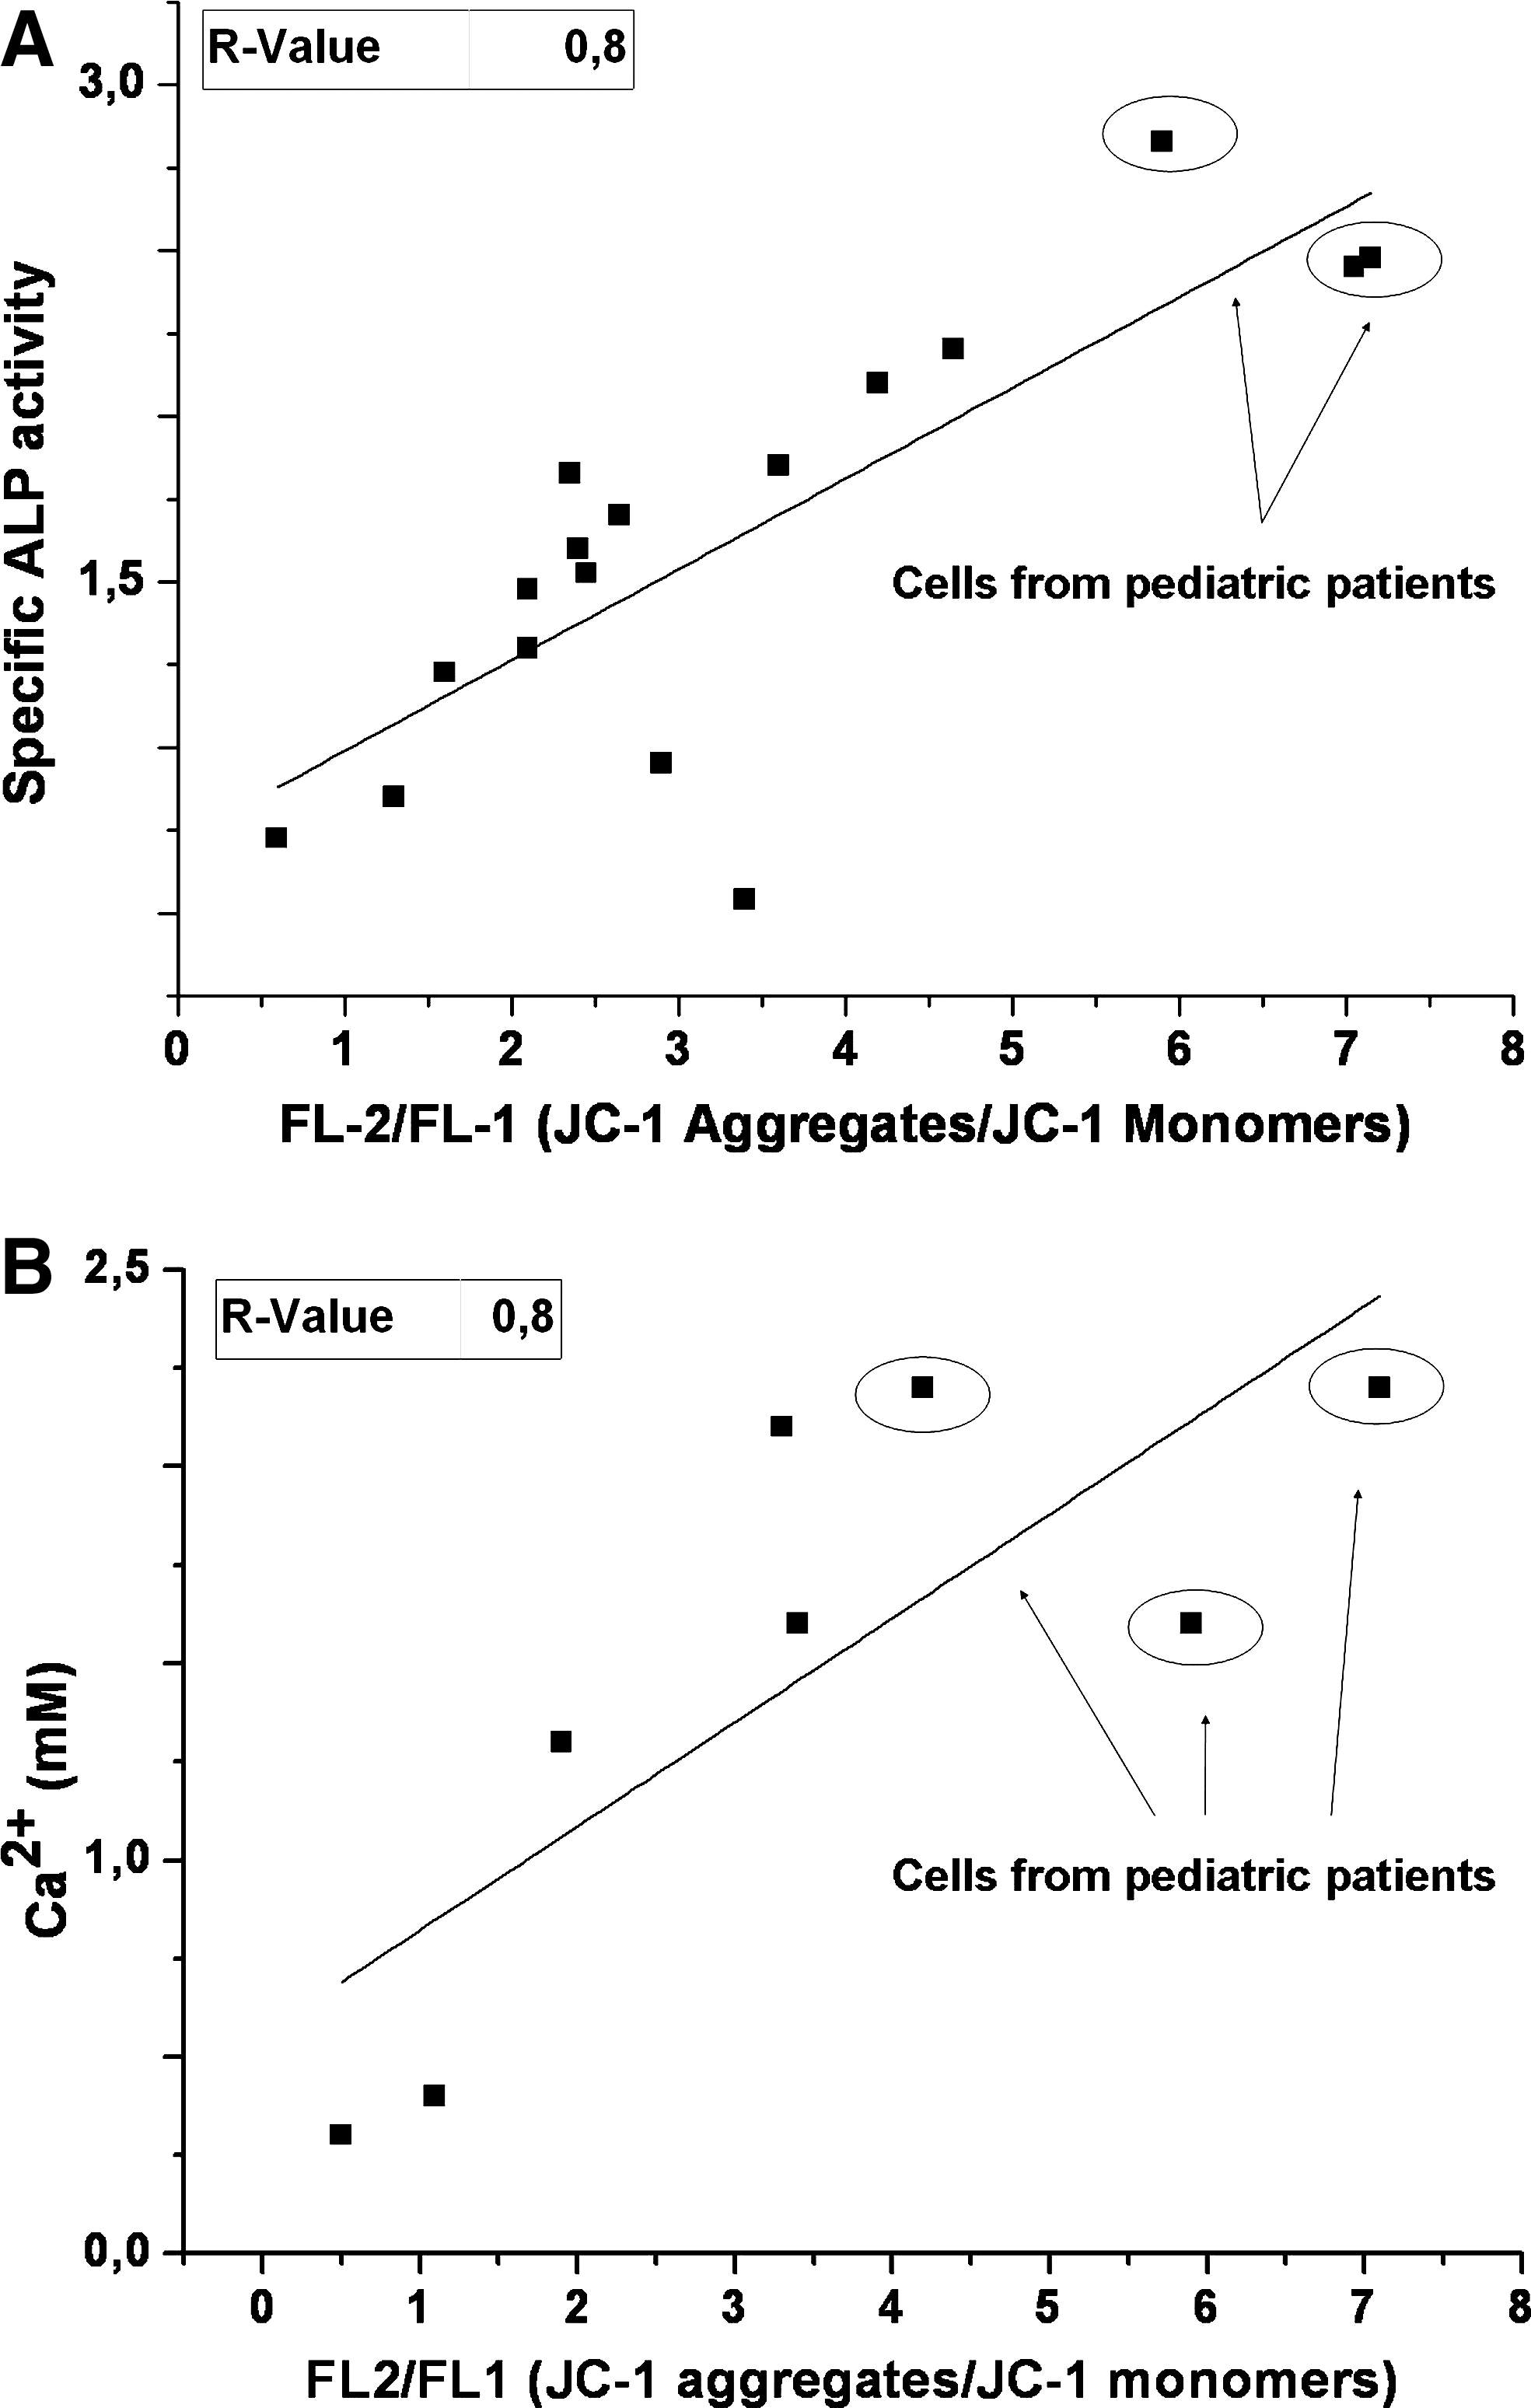
Correlation study of ΔΨm and osteogenic differentiation potency, measured by specific ALP activity and calcium formation, was performed. (
Next, the correlation between calcium formation and FL-2/Fl-1 (JC-1 aggregates/JC-1 monomers) ratio was tested for the eight hMSC populations with different level of mitochondrial quality. As shown in Figure 7B, the correlation between these two variables is strong with an r-value of 0.80 (p < 0.0005), which is in line with ALP measurements.
Discussion
This study was designed to test the hypothesis that mitochondria could be used as indicator of cell quality especially in cell-based osteogenic therapies. In the present study, based on JC-1 staining, we have defined three different distinct cell populations: cells having high, intermediate, or low ΔΨm. Further characterization showed that the intermediate population could be divided into two subpopulations (R2 and R3) based on cell size, granularity, organization of PS in plasma membrane (AnnexinV), and indirectly by plasma membrane integrity (PI intake). Cells in R2 group were mostly PI negative, but their ΔΨm was partially collapsed and they also showed slight increase in the proportion of AnnexinV–positive cells; in addition, cell size and granularity were slightly increased. Cells in R3 group showed more collapsed ΔΨm, and they were mostly PI- and also AnnexinV positive with clearly reduced cell size. The last group, R4, included late apoptotic or necrotic cells with totally collapsed ΔΨm, dramatically decreased cell size, and they showed positivity for PI and AnnexinV. Group R1 included healthy normal cells with high ΔΨm and normal plasma membrane integrity and PS organization. These observations are in line with earlier studies with JC-1 fluorescence dye that shows the same staining pattern with high, intermediate, and low ΔΨm. 35 Lugli et al. 35 used multilaser flow cytometry, which allowed simultaneously detection of several apoptotic indicators including PI, Annexin V, and JC-1 among others. Consequently, it was suggested that cells having intermediate ΔΨm may represent early apoptotic cells in some models of apoptosis. However, due to wide overlap of the fluorescence spectra, PI and JC-1 could not be determined from the same cell. Therefore, we had to demonstrate the PI positivity in parallel experiments from the same cell pool that imposes the need of larger population sizes for correlation analysis. On the other hand, the PI-positive cells clearly do distinguish between groups R3 and R4 that represent late apoptotic and necrotic cells with reduced cell size. Unlike Lugli et al., 35 we divided the intermediate cell population into two subpopulations due to a dramatic difference in cell morphology (FSC vs. SSC), PI intake, and AnnexinV detection. Our data clearly suggest that the depolarization of ΔΨm precedes the AnnexinV detection and hence demonstrates an earlier phase in the apoptosis process. In addition, analysis of ΔΨm enables to distinguish four subpopulations with different levels of mitochondrial functions that represent different stages of apoptosis or cellular stress.
To test our hypothesis in context of a model of experimental mitochondrial and cell damage of the hMSCs, the role of ΔΨm in apoptosis using MQ as an inducer was elucidated. A prolonged exposure to critical concentrations of MQ caused a decrease of ΔΨm and thus a shift from groups R1 and R2 to groups R3 and R4. Exposure to MQ caused a dramatic cell shift from R1 to R3, before significant differences were noted in the amount of populations of R2 and R4. A 5-h exposure to MQ was needed for a marked increase in cell number in group R4, reaching a 10-fold value after 7 h. Also the shift from R2 population to R3 and R4 occurred much later than from R1. The shift to R3 group at early state of MQ exposure verifies the hypothesis that the R3 group does include early apoptotic cells, whereas the group R4 clearly consists of later apoptotic or necrotic cells as the shift into R4 occurred only after 5 h exposure. The shift from high ΔΨm to low has also been demonstrated in an earlier kinetic study where JC-1 was used as a ΔΨm indicator and querectin as an apoptosis inducer. 35 Moreover, the present study allows to detect several different phases of apoptosis from very early alterations only in mitochondrial function to late apoptotic or necrotic cells with dramatic alterations in morphology, plasma membrane integrity, and PS orientation, thus the analysis of ΔΨm gives a rapid and a more comprehensive understanding of the status and the viability of cells in comparison to traditional methods. Other ΔΨm-based apoptosis assays developed so far have also demonstrated its relevance as an indicator of cellular status, having shown the link between ΔΨm and with other well-known apoptosis markers.19,20
Studies on elucidating the meaning of different JC-1 staining patterns for cellular function, based on the proliferation rate and osteogenic differentiation potential of MQ-exposed hMSCs, showed that both the MTT and specific ALP activity decreased with prolonged MQ exposure. The control sample had the greatest osteogenic differentiation potential and also proliferation rate, whereas hMSCs exposed for several hours to MQ showed the lowest activity. The increase of specific ALP activity in basic cell culture medium during MQ exposure was most likely due to the oxidative stress. Specific ALP activity may acutely rise as a result of stress and other anomalies. Hence, specific ALP activity is commonly used as an indicator of osteogenic differentiation together with other indicators, such as calcium nodule quantitation. The ALP values presented here are an example of one representative experiment.
The correlation between JC-1 and MTT was expected because MTT monitors mitochondrial function and especially the activity of mitochondrial respiration and thus is not a very reliable indicator of proliferation. However, these results do emphasize the importance of demonstrating the correlation between JC-1 analyses of cells and the actual cellular function, which is relevant for quality control assurance of cell- and tissue-based medicinal products that are intended for therapeutic use of bone defects.
It is important to ascertain the sensitivity of the characterization method and performance in normal hMSCs not exposed to apoptosis inducers. Accordingly, we have also shown the reliability of such an analytical procedure for hMSCs by demonstrating the wide range of mitochondrial quality between selected hMSC lines. The difference in mitochondrial function was evident in five hMSC lines. Major differences were also evident in size and granularity (FSC vs. SSC) between hMSC lines that correlated with JC-1 staining where a major proportion of the studied cells exhibited reduced cell size and a large proportion of the cells were distinguished into groups R3 and R4. Moreover, the proliferation activity and osteogenic differentiation potency showed the same trend as in MQ-exposed cells. hMSC lines with most cells representing healthy normal cells also had the greatest proliferation activity and osteogenic differentiation potency.
The hypothesis that monitoring ΔΨm can be used to predict the osteogenic differentiation potency was demonstrated by testing the correlation between mitochondrial function and osteogenic differentiation by measuring specific ALP activity and calcium formation of several hMSC populations with different level of mitochondrial quality. Plotting the FL2/FL1 ratio against the specific ALP activity or against the calcium formation showed a very strong correlation. The osteogenic differentiation potential of hMSC populations from children was greater than hMSC samples from adults which is in line with earlier studies, whereas, interestingly, the FL2/FL1 (JC-1 aggregates/JC-1 monomers) ratio was also clearly higher in samples from children.36,37 This may be explained by differences in mitochondrial activity or most probably by more condensed network of mitochondria in children. Even when the difference in osteogenic differentiation potency between adult and pediatric patient was evident, the specific ALP activity of hMSCs and patient age at late adulthood (>50 years) showed no correlation (data not shown). In addition, Leskelä et al. 32 have also shown that the osteogenic differentiation potency of hMSCs does not decrease by age at late adulthood. The difference in the mitochondrial activity and in the number of mitochondria between different stem-cell types does, however, pose challenges to the application of this procedure to other cell types, namely embryonic stem cells or umbilical cord blood stem cells. Different concentrations, proper constant single-dye controls, and flow cytometry adjustments should be tested to find out the universal settings to make the results comparable between different cell types. Consequently, even if the variation in proliferation rate and differentiation potency of hMSC lines is well known, this is the first time when the correlation between ΔΨm and osteogenic differentiation potency has been demonstrated. Consequently, the predictability of osteogenic differentiation potency of hMSC has been verified when specific ALP activity and calcium formation was used as an indicator of differentiation. However, it is notable that at this point the data are valid only for cells undergoing osteoblastic differentiation in vitro and the method should be tested for chondrogenic and adipogenic differentiation capacity.
It should be clarified that the actual cells in test cannot be used further for patient, instead proportion of cells from larger cell pool is selected for analysis. The amount of cells for analysis (300,000 cells) is relatively small compared to the usual dose of hMSCs in clinical trials which is more than 20 million cells and thereby this analysis will not have significant impact on total number of hMSCs and further on treating purposes. However, proper sampling protocol is an issue of concern, and in clinical setting special attention should be paid to determine optimal sample size that will represent statistically whole cell pool.
In summary, analysis of ΔΨm offers a rapid and simple characterization method for hMSCs and may be used as a tool for quality control in safety and efficacy determination of cell-based therapies. The method also contributes to increasing the reliability of results from clinical trials. By analyzing ΔΨm, it is possible to distinguish cells with different level of mitochondria, and this method can also be used to predict the osteogenic differentiation potency of hMSC lines, which is an extremely useful property with reference to development of future cell therapies for incurable bone defects. Although we recognize that this analytical tool must undergo further optimization and validation testing, it is evident that characterization procedures for fulfilling regulatory demands need to be developed and must emerge side by side with the actual products. Such a development is typical for all technologies—intensive fields, where regulatory initiatives will lag behind the science of innovative product development for which tools of validation cannot be established before the technological challenges and the product-specific critical issues for safety become evident.
Footnotes
Acknowledgments
The authors thank Minna Savilampi for her skillful technical assistance. This study is funded by the Academy of Finland and Finnish Medical Association.
Disclosure Statement
This study does not include conflicts of interest of any kind.