
Abstract
The repair of large and complex bone defects could be helped by a cell-based bone tissue engineering strategy. A reliable and consistent cell-seeding methodology is a mandatory step in bringing bone tissue engineering into the clinic. However, optimization of the cell-seeding step is only relevant when it can be reliably evaluated. The cell seeding efficiency (CSE) plays a fundamental role herein. Results showed that cell lysis and the definition used to determine the CSE played a key role in quantifying the CSE. The definition of CSE should therefore be consistent and unambiguous. The study of the influence of five drop-seeding-related parameters within the studied test conditions showed that (i) the cell density and (ii) the seeding vessel did not significantly affect the CSE, whereas (iii) the volume of seeding medium-to-free scaffold volume ratio (MFR), (iv) the seeding time, and (v) the scaffold morphology did. Prolonging the incubation time increased the CSE up to a plateau value at 4 h. Increasing the MFR or permeability by changing the morphology of the scaffolds significantly reduced the CSE. These results confirm that cell seeding optimization is needed and that an evidence-based selection of the seeding conditions is favored.
Introduction
The use of adequate cell types, cell numbers, or cell densities plays an important role in the osteoinductivity of the applied TE strategies.3,4 Eyckmans and Luyten reported that 5 × 10⁵ human periosteum-derived cells (hPDCs) were capable to induce bone in Collagraft™ scaffolds by ectopic implantation in nude mice, whereas the same number of PDCs harvested from rabbits were not. 5 When decreasing the initial cell number of hPDCs to values as low as 5 × 10⁴, bone formation was impeded. 6 Braccini et al. implanted hydroxyapatite scaffolds ectopically in nude mice. The scaffolds were seeded with human bone-marrow-derived stromal cells (hBMSCs) and subsequently cultured for 19 days with the aid of a perfusion bioreactor. Both the number of initially seeded hBMSCs and the number of clonogenic hBMSCs before implantation were significantly higher for the osteogenic scaffolds than for the nonosteogenic ones. Braccini et al. observed a threshold value of clonogenic hBMSCs above which the applied TE methodology resulted in an osteoinductive construct. For the initial cell number, however, no threshold value could be obtained. 7 Both Eyckmans et al. and Braccini et al. confirmed that initial cell number and cell type play a critical role in osteoinduction.
A bone TE methodology will be controllable when all individual process steps are consistent, reproducible, and reliable. This requires the use of standard analysis techniques, which enable accurate scoring and validation of specific steps of the process.
Cell seeding is a critical step in bone TE. A controlled and reproducible cell-seeding methodology enables to combine a known cell number and a scaffold. The quality of the seeding step will affect all following actions and thus also the osteogenic activity and variability of the applied bone TE strategy. The cell seeding efficiency (CSE), that is, the fraction of initially seeded cells that attach to the scaffold, is therefore a useful parameter to describe the efficacy of the seeding process.
Current TE research involves the optimization of cell seeding and culturing in three-dimensional (3D) scaffolds.8–10 However, the lack of reliable characterization methods results in diverging CSE values that range between 0% and 150%.11–13
Within this article two research questions that allow an evidence-based selection of the process conditions were addressed: (i) How can the CSE or cell number reliably and consistently be determined? (ii) Which process characteristics of passive seeding positively affect the CSE?
To address the first question, the influence of freeze–thaw cycles and of the applied calculation methods was investigated. To address the second question, the effect of five passive seeding process parameters on the CSE were investigated: (i) cell density, (ii) seeding vessel, (iii) volume of seeding medium-to-free scaffold volume ratio (MFR), (iv) incubation time, and (v) scaffold morphology.
Materials and Methods
Scaffolds and cells
To address both research questions, the variability that could be introduced by the cells or the cell–scaffold interactions was reduced by using an inert scaffold material and a homogenous cell line of osteosarcoma-derived mature osteoblasts, instead of a more heterogeneous primary cell population of hPDCs, containing mature bone cells as well as osteoprogenitor cells.
Two types of cylindrical titanium (Ti-6Al-4V) scaffolds (φ = 5 mm, h = 3 mm) with distinct morphological properties were used: (i) irregular scaffolds with randomly distributed spherical pores and (ii) regular scaffolds with well-defined pores. All Ti scaffolds were provided by VITO (Mol, Belgium). 14
The irregular structures were produced by gel casting (GC) with a foaming agent. 15 The mechanically foamed structures consist of circular, irregularly distributed pores.
The regular structures were produced by a 3D fiber deposition (3DFD) technique.16–18 3DFD structures consist of parallel struts, deposited layer by layer. The struts of two consecutive layers are rotated over 90°. Two different macrostructures were produced by either or not displacing consecutive even and uneven layers by half the interstrut distance. 3DFD structures with displaced struts resulted in smaller pore channels (3DFD-S) compared to structures with nondisplaced struts (3DFD-L).
Secondary electron microscopic images (SEM, JSM-6340F; Jeol) and microfocus computed tomographic images (micro-CT, Tomohawk, HOMX 161 X-ray system with AEA Tomohawk CT-upgrade, Philips X-ray) were used to analyze the macrostructures and architectures of the produced Ti scaffolds. Permeability measurements were performed with nitrogen gas (PMI, Ithaka). The corresponding average Darcy constants were calculated by CapWin software (version number 6.71.93).
Before cell seeding, all Ti scaffolds were cleaned by ultrasound and immersing them 10 min in acetone, 10 min in ethanol 70%, and 10 min in distilled water. Scaffolds were dried overnight and sterilized by ethylene oxide.
SaOS2 human osteosarcoma cells were used in all seeding experiments. Two-dimensional cell expansions were carried out in T175 flasks (Greiner) in an incubator at 37°C, 5% CO2, and 95% relative humidity. The plating density was 5000 cells/cm2. Cells were passaged at 90% confluency by performing a trypsin treatment (0.25% trypsin, 1 mM ethylenediaminetetraacetic acid; Invitrogen). The culture medium contained high-glucose Dulbecco's modified Eagle's medium (Invitrogen) with 10% fetal bovine serum (Bio-Whittaker) and 1% antibiotic–antimycotic solution (100 units/mL penicillin, 100 mg/mL streptomycin, and 0.25 mg/mL amphotericin B; Invitrogen). This cell culture medium was also used for cell seeding.
Cell seeding and CSE
All scaffolds were prewetted before cell seeding by vacuum impregnation with the culture medium and incubation during 2 h in a humidified incubator. Afterward, the medium was removed and the scaffolds were dried overnight in a dry incubator.
Scaffolds were passively seeded by dropping a concentrated cell suspension (more details below) on top of the scaffold. Nonseeded scaffolds were taken as controls.
After a seeding time of 2 h in a small volume of the culture medium and subsequent overnight incubation in 10 mL culture medium in a humidified incubator, cell-seeded scaffolds were taken out with a forceps, rinsed with 350 μL phosphate-buffered saline (PBS) 1 × (Sigma), and put in 350 μL 0.05% Triton-X-100 cell lysis buffer (PBS + 0.05% Triton-X-100). The unattached cells in the residual seeding medium were spun down 10 min at 180 g, rinsed with 350 μL PBS 1 × , spun down again, and resuspended in 350 μL cell lysis buffer. All samples were vortexed 5 s and stored at −80°C before DNA analysis.
A highly selective Quant-iT™ PicoGreen® dsDNA Assay Kit (Invitrogen) was used. All analyses were performed according to manufacturer's instructions.
To obtain a reliable DNA quantification method, a high and consistent cell lysis is required. Sonication and freeze–thaw are candidate approaches to enhance cell lysis. Their effect on the lysis efficiency was determined.
The CSE describes the efficacy of the seeding process. It refers to the percentage of cells that attached to the scaffolds, compared to the number of cells initially seeded. In literature, different calculation methods of the CSE are used side by side.4,19–21 To demonstrate the impact of this parameter, the CSE was determined according to four different calculation methods commonly used. Method A19,22 estimated the CSE by determining the ratio of the DNA content of the cells successfully seeded in the scaffold to the initially seeded cells. In Method B 20 the initial cell number was estimated by the total DNA content of the cells in the scaffold and the cells in the medium. In Methods C and D4,19 the CSE was calculated based on the amount of DNA (Method C) or the cell number (Method D) of unattached cells that ended up in the residual seeding medium.
Equations of the different calculation methods that are mentioned in literature are shown below, where [DNA]i and CellsI, respectively, are the DNA content and cell number of all cells initially seeded; [DNA]scaf, the DNA content of the cells on the scaffold; and [DNA]med and Cellsmed, respectively, the DNA content and cell number of the cells in the residual seeding medium.
Cell-seeding process conditions
This study investigated the effect of five different process parameters of passive seeding on the CSE: (i) cell density, (ii) seeding vessel, (iii) volume of seeding medium-to-free scaffold volume ratio (MFR), (iv) incubation time, and (v) scaffold morphology. This selection was based on the diverging CSE values reported in literature.20,23
The DNA analysis always incorporated three freeze–thaw cycles (based on the obtained results) and the CSE was determined by Method A. Each data point represents three to six scaffolds.
The effect of the cell seeding density on the CSE was investigated by seeding SaOS2 cells at six different cell densities in GC, 3DFD-S, and 3DFD-L Ti scaffolds: 0, 200, 2000, 20,000, 25,000, 50,000, and 75,000 cells were suspended per μL of medium. Passive seeding was performed in a 15 mL falcon tube. The medium volume used for cell seeding was limited to half of the scaffold void volume, determined by multiplying the scaffold volume by its porosity. Filling up only half of the free scaffold volume, the MFR is defined to be 50%. After a seeding period of 2 h, both the scaffolds and the medium underwent a lysis treatment in 350 μL Triton-X-100 for subsequent DNA analysis.
Seeding requires a seeding vessel or a recipient where seeding takes place. To investigate whether selecting a different vessel would affect the CSE, the influence of the seeding vessel on the CSE was investigated. Ti scaffolds were seeded at a density of 50,000 cells/μL and an MFR of 100%, using four different seeding vessels: (i) 15 mL falcon tubes (BD), (ii) suspension culture well plates, (iii) culture well plates coated with agarose to avoid cell attachment, or (iv) 1.5 mL Eppendorf tubes. None of the vessels used in this investigation supported cell attachment.
The effect of seeding medium-to-free scaffold volume ratio (MFR) on the CSE was studied by seeding GC, 3DFD-S, and 3DFD-L Ti scaffolds with the seven different cell densities (0, 200, 2000, 20,000, 25,000, 50,000, and 75,000 cells/μL). The medium volume of the cell suspension was a factor 0.5, 1, or 1.5 of the free scaffold volume, correlating with an MFR of, respectively, 50%, 100%, or 150%. After 2 h of seeding, the scaffold and medium were further prepared for DNA analysis.
The effect of the incubation time in 10 mL of culture medium on the CSE was investigated by cell seeding GC Ti scaffolds at a cell density of 50,000 cells/μL. After a seeding time of 0.5 or 2 h with an MFR of 150%, 10 mL of the culture medium was added and scaffolds were additionally incubated for 0 to 18 h. After incubation, scaffolds and medium were further prepared for DNA analysis.
To study the influence of the scaffold morphology on the CSE, scaffolds with three different morphological characteristics, (i) GC, (ii) 3DFD-S, and (iii) 3DFD-L, were seeded with the seven different cell densities as noted earlier (0, 200, 2000, 20,000, 25,000, 50,000, and 75,000 cells/μL) and an MFR of 50%, 100%, or 150%. After 2 h of seeding, the scaffold and medium were further prepared for DNA analysis.
Viability
As the CSE estimated by a DNA assay cannot unambiguously distinguish between viable and dead cells as long as AT-rich dsDNA zones are available in the fragmented DNA, the viability plays another key role in validating the cell-seeding process as only seeded viable cells play a role in the tissue regeneration process.
To assess the viability of the seeded cells, Ti-GC scaffolds were seeded with an MFR of 50%, 100%, and 150% at a cell density of 25,000 cells/μL. Cells were subsequently harvested by a 5 min trypsin treatment. Cell viability was assessed by trypan blue exclusion test and counted with the aid of a hemacytometer or by incubation with 7-AAD and Annexin V-PE (BD Bioscience) in a light-protected environment and analyzed by flow cytometry (BD FACSCalibur™; BD Bioscience). Viability results were scaled by the total number of counted cells. A good characterization of the cell-seeding process should investigate not only the CSE but also cell viability.
Statistical analysis
Experimental data are plotted in point diagrams, bar diagrams, or box plots. The first two plots represent the mean ± the standard error. The box plots span the interquartile range of the values in the variate, with the median indicated by the line. Whiskers that extend beyond the ends of the box span the 5% and 95% range of the values in the variates.
Significant differences were confirmed when p-values were <0.05, by performing an unpaired Student's t-test.
Results
Scaffolds
Secondary electron microscopic images and micro-CT images of the Ti scaffolds used in this study are shown in Figure 1A–D. The images confirm a random, but spherical pore distribution in the GC structures and an organized cuboidal pore distribution in the 3DFD scaffolds. Schematic representations of the pore morphologies of the Ti scaffolds are shown in Figure 1E. Displacing the even and uneven layers over half the interstrut distance (3DFD-S) drastically reduced the channel width as compared to the 3DFD scaffolds without layer displacement (3DFD-L). The reduction of the channel width is indicated by the solid versus the dashed squares (Fig. 1B). Permeability results are shown in Figure 1F. The GC scaffolds had a significantly lower permeability or average Darcy coefficient as compared to the 3DFD structures. The permeability of the 3DFD-S structures with reduced channel width was significantly lower as compared to the 3DFD-L structures.

Secondary electron microscopic images of the macrostructure and microstructure of (
Cell seeding and CSE
Additional freeze–thaw cycles significantly enhanced cell lysis efficiency (Fig. 2A). The DNA content was increased by a factor 10 when adding 1 additional freeze–thaw cycle. No significant differences were seen between two, three, and four freeze–thaw cycles, although the standard error was reduced (data not shown). This finding suggests that three freeze–thaw cycles are needed to obtain an efficient and reproducible DNA analysis. Therefore, three freeze–thaw cycles were used to investigate the influence of the process parameters on the CSE.
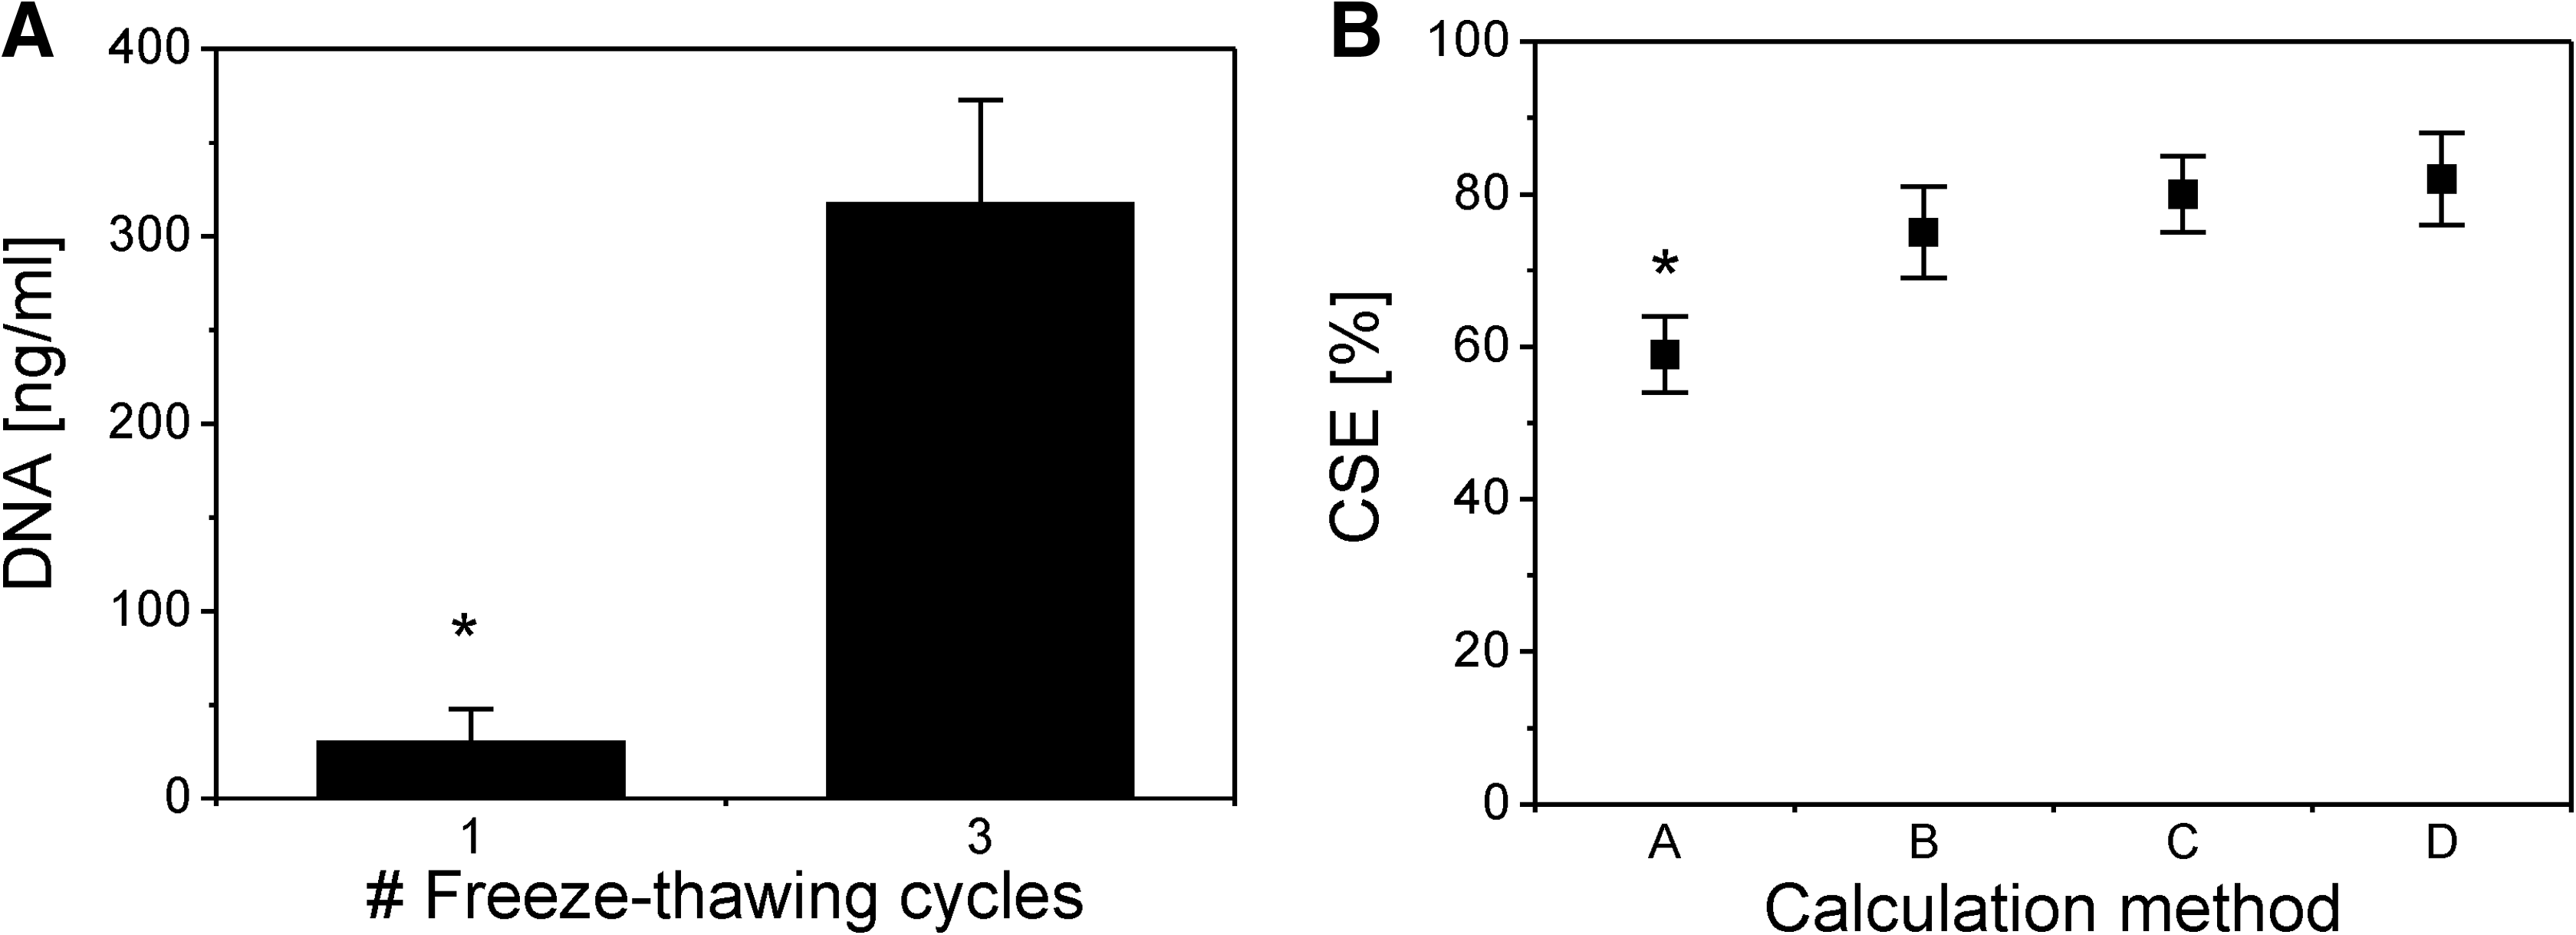
Effects of two methodologies that are involved in determining the cell seeding efficiency (CSE): (
The influence of the applied calculation method on the final CSE is shown in Figure 2B. Method A resulted in a significantly lower CSE (59% ± 5%) as compared to Methods B, C, and D (79% ± 5%). Method A, however, is the method that correlates best with the exact definition of the CSE, being the number of cells seeded in the scaffold, compared to the total number of cells initially used for cell seeding.
No significant differences were seen between Methods B, C, and D. Method B approximated the initial cell number by the sum of the cells in the scaffold and in the medium. In Methods C and D, the cell number in the scaffold was approximated by the initial cell number minus the number of cells that was left in the medium.
Cell-seeding process conditions
The influences of the five different process parameters of passive cell seeding on the CSE, (i) cell density, (ii) seeding vessel, (iii) MFR, (iv) incubation time, and (v) scaffold morphology, are shown in Figures 3 and 4.

The influence of four different process conditions of passive seeding on the CSE. The triangles in the boxplots represent maximum and minimum values; squares represent the mean value. (
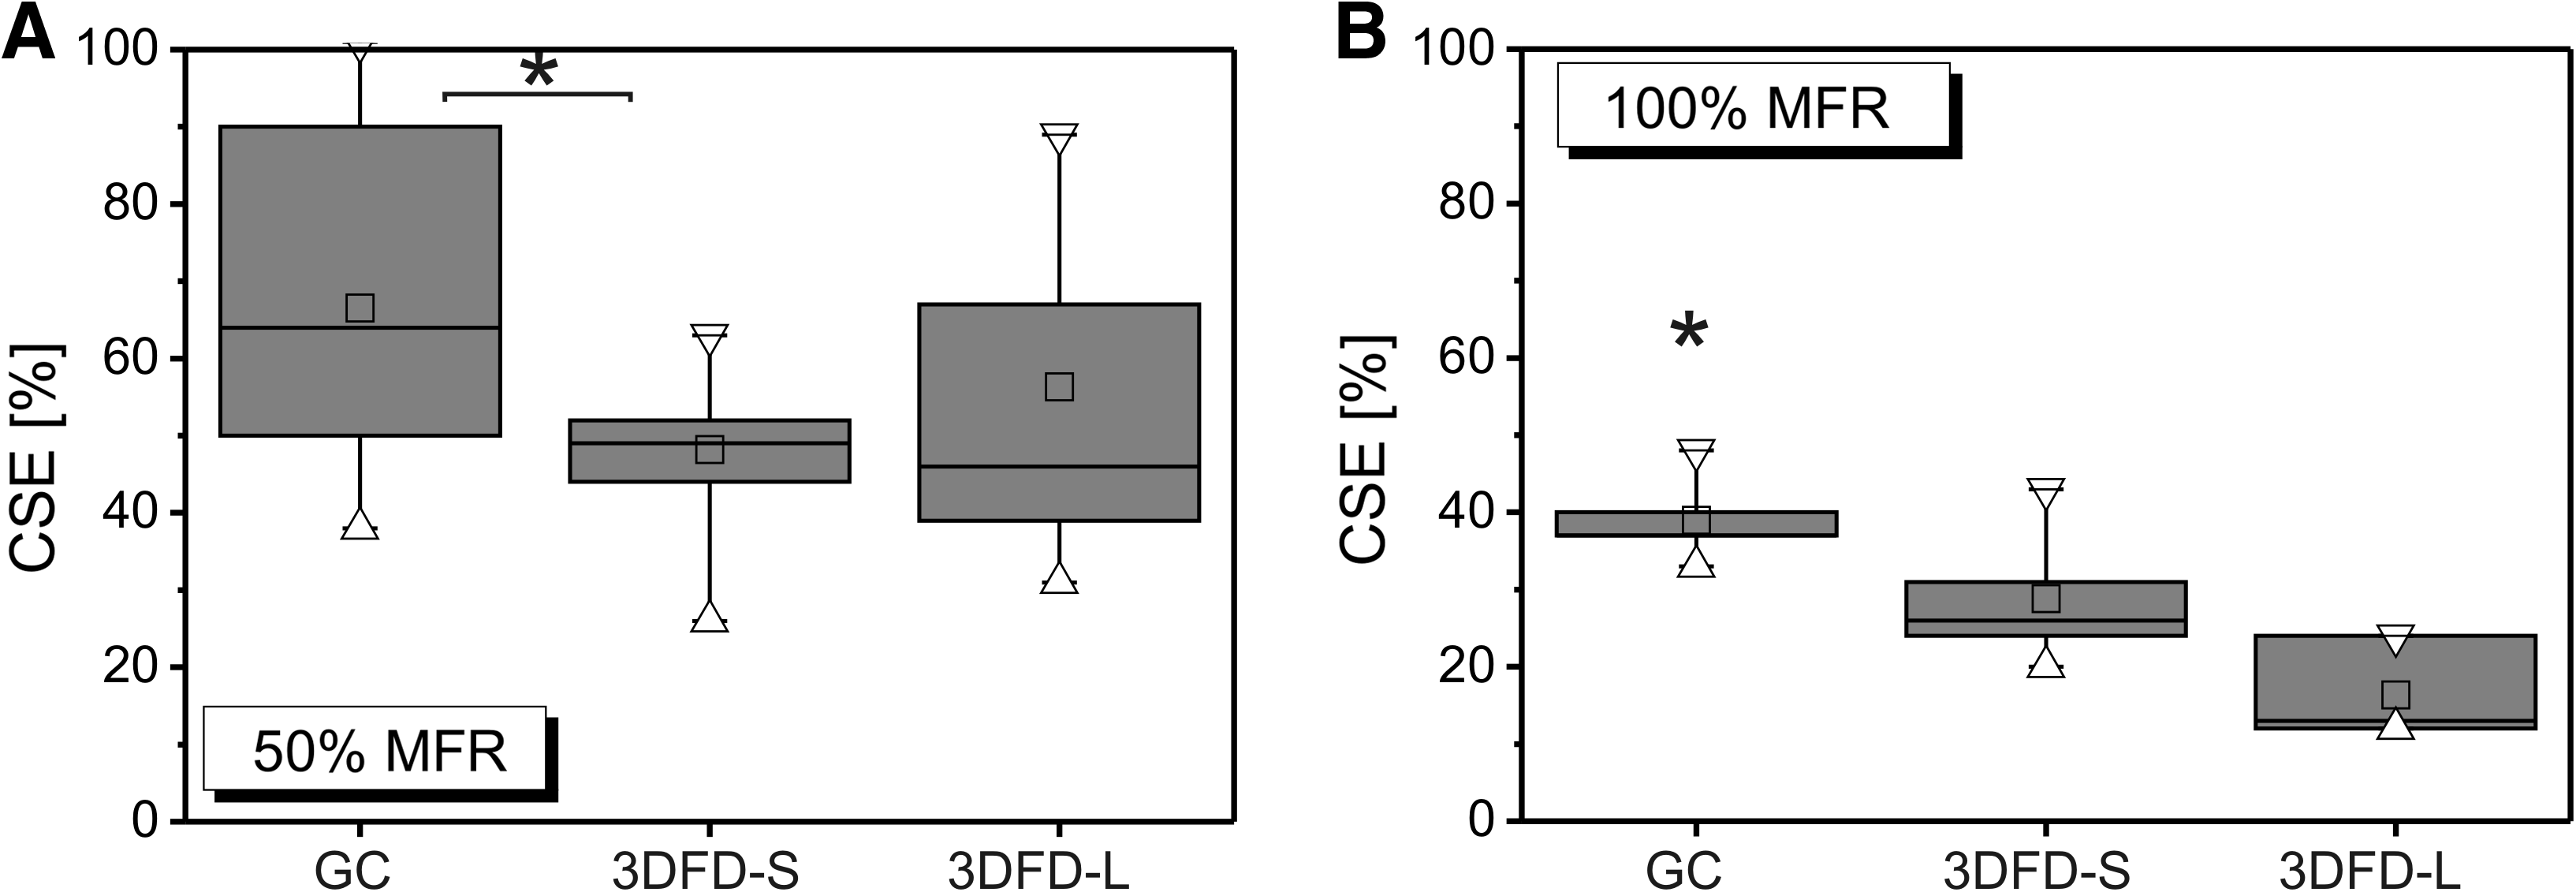
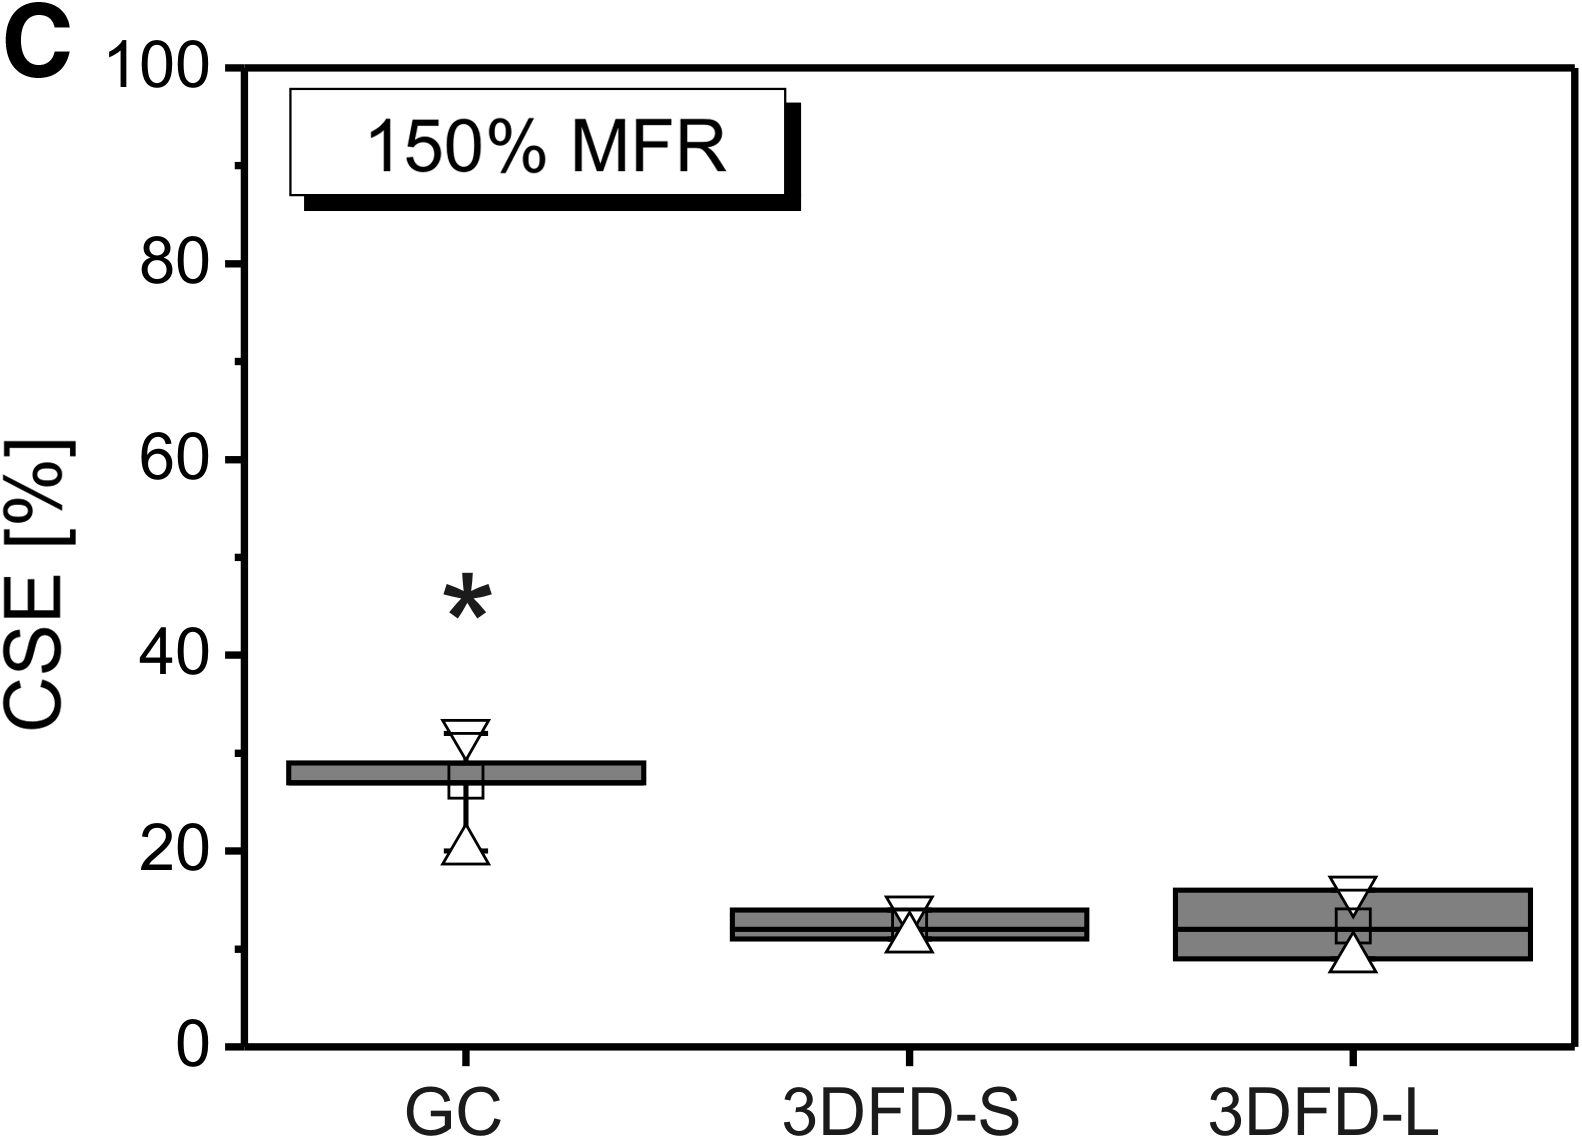
The influence of the scaffold morphology on the CSE as defined by Method A. The results were shown in function of the MFR. Triangles represent maximum and minimum values; squares represent the mean values. (
As these graphs often showed pooled data, large standard deviations occurred.
In 60% out of the nonseeded control scaffolds, no DNA was detected as the read out was <0.5 ng/mL. The other 40% empty scaffolds resulted in small read outs and falsely resulted in 8 × 10⁴ ± 5 × 10⁴ cells.
SaOS2 cell densities in the range of 200–75,000 cells/μL did not significantly influence the CSE as defined by Method A (Fig. 3A). The average CSE values were in the range of 50%–65%. As a consequence, the use of larger cell densities within the investigated range resulted in higher absolute cell numbers ending up in the scaffold.
The influence of the seeding vessel on the CSE was investigated (Fig. 3B).
Four different seeding vessels were used: (i) a falcon tube, (ii) an agarose-coated culture well plate, (iii) a suspension culture well, and (iv) an Eppendorf tube, but none of them significantly increased or decreased the CSE. Average values ranged between 64% and 69%.
The MFR strongly influenced the CSE as shown in Figure 3C. The average CSE decreased from 59% to 19%, when, respectively, increasing the MFR from 50% to 150%.
Increasing the total incubation time from 0.5 to 18 h allowed the cells to attach over a longer period of time. As shown in Figure 3D, shorter incubation times (≤2 h) resulted in a significantly lower CSE of 50% ± 16% on average. Incubation times ≥4 h resulted in a significantly higher CSE of 73% ± 15% on average. Increasing the incubation time well over 4 h did not further increase the CSE.
Increasing the seeding time in a small volume of the culture medium from 0.5 to 2 h resulted in a significantly higher CSE when using a total incubation time of 2 and 4 h. At longer incubation times, the benefit of increasing the seeding time from 0.5 to 2 h was overruled by the effects of the longer incubation time.
The obtained CSE depended on the scaffold morphology as shown in Figure 4A–C. The GC scaffolds seeded with an MFR of 100% and 150% resulted in significant higher CSE values as compared to the 3DFD scaffolds. Independent of the MFR, no significant differences were seen for the CSE of the 3DFD-S and 3DFD-L scaffolds, although there was a weak tendency for the 3DFD-L scaffolds to result in a lower CSE. This suggested a correlation with the scaffold permeability as represented in Figure 1F.
Viability
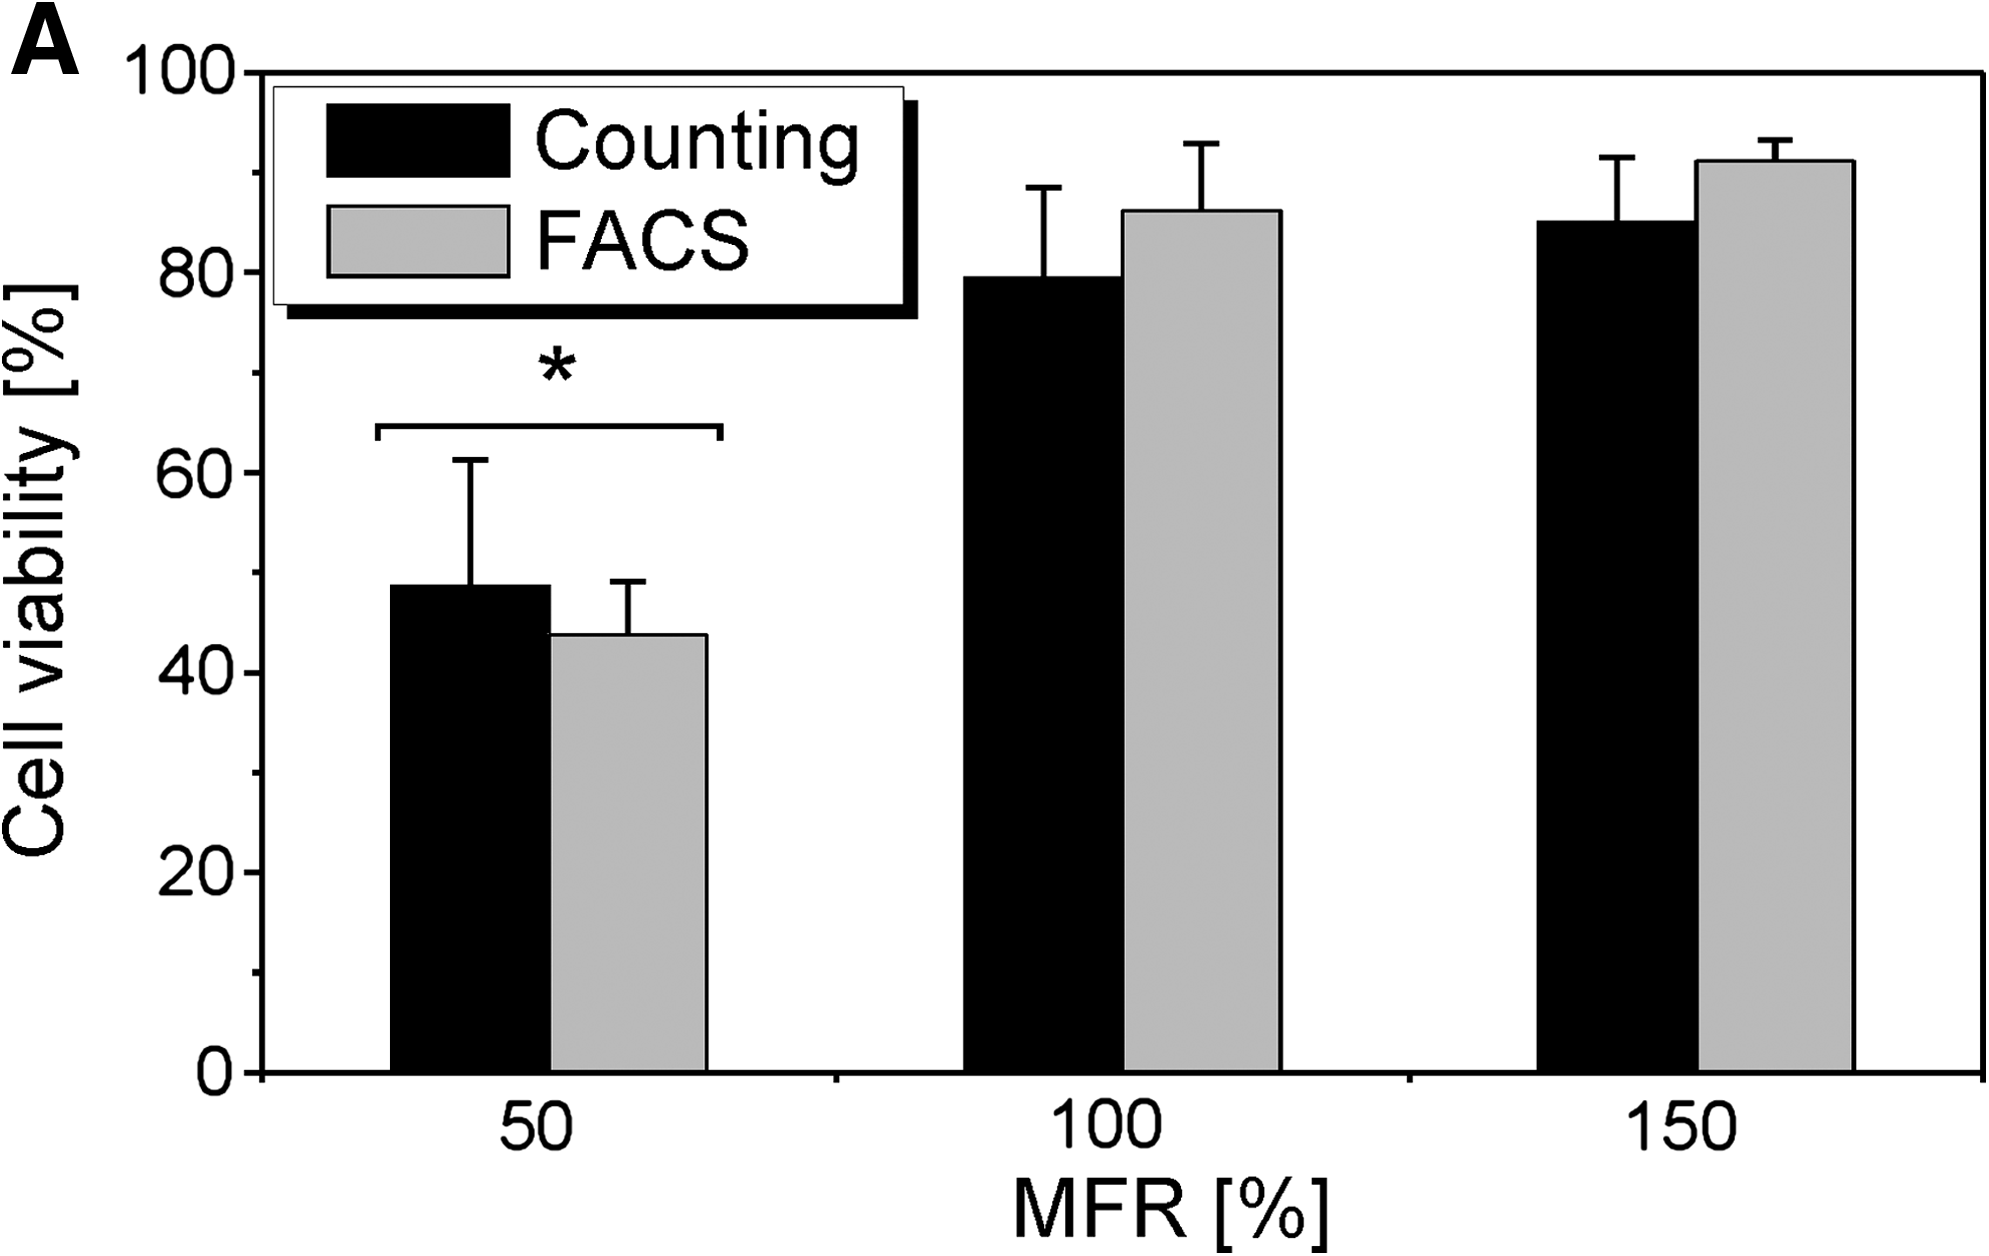
Viability results are shown in Figure 5. FACS analysis and manual counting of trypan blue-positive SaOS2 cells did not result in significantly different viability values.
(
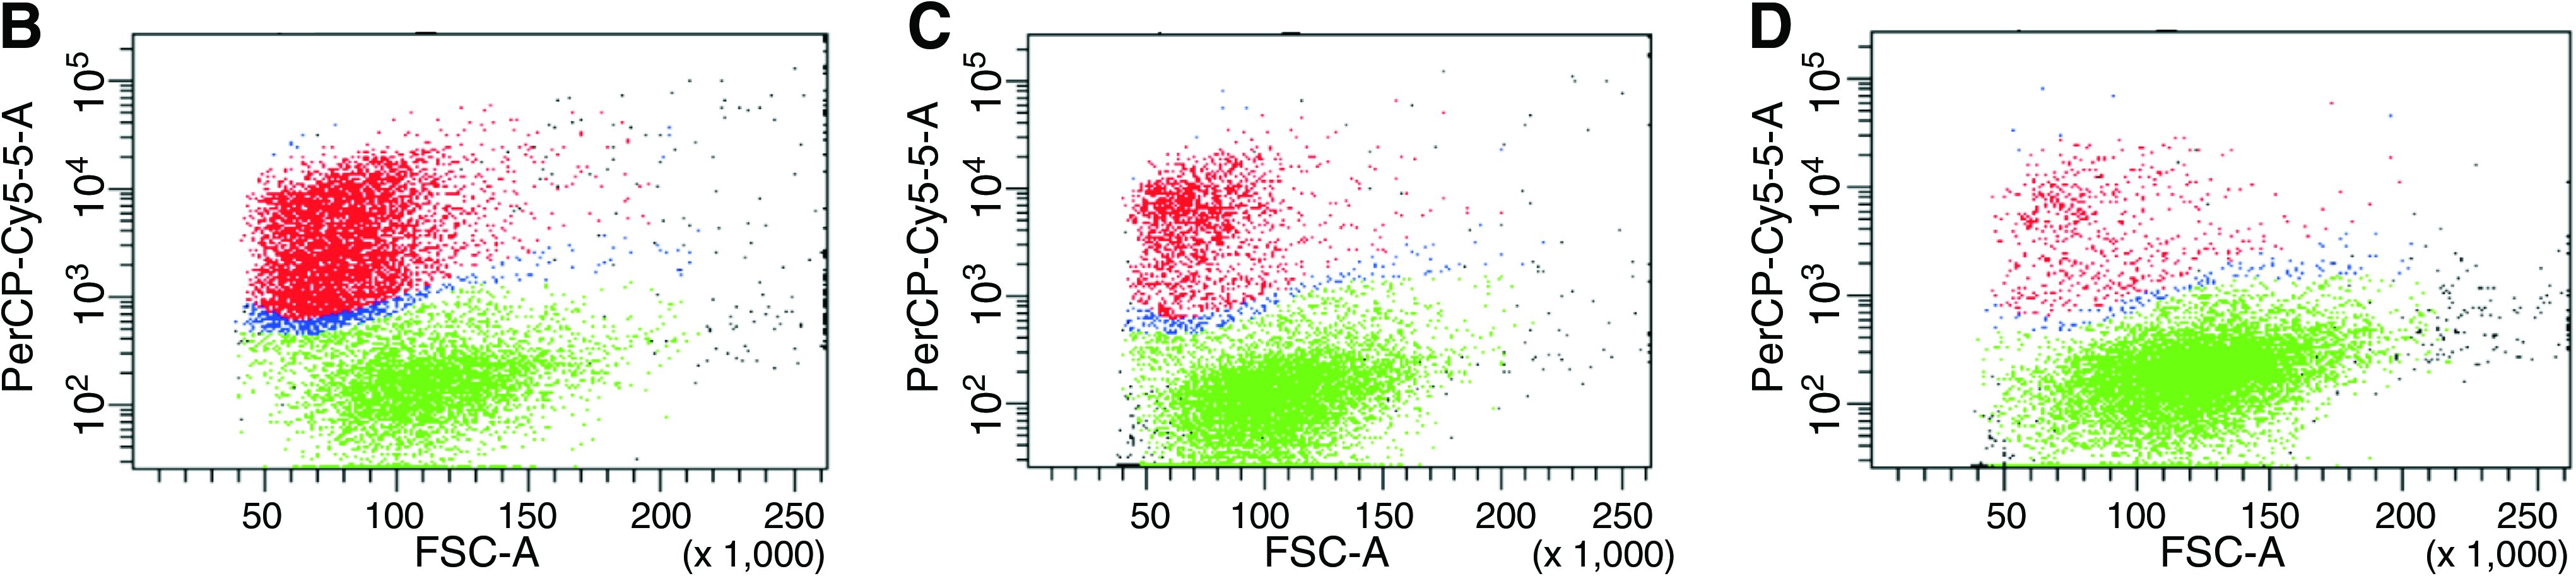
The percentage of viable cells decreased from 88% to 46% when decreasing the MFR from 150% to 50%. Only the viability of the cells seeded at the lowest MFR (50%) significantly differed from the other two conditions.
Discussion
To obtain a predictable and efficient cell-based bone TE strategy, more and more researchers acknowledge the necessity of reliable methods to quantify parameters such as the CSE. 19
Materna et al. concluded that metabolic assays overestimated the CSE, while DNA assays underestimated the CSE. 19 Metabolic assays correlate with cellular activity, which fluctuates in time and additionally depends on other process conditions such as the cell density: higher cell densities resulted in lower metabolic activities. 24 The DNA content of a single cell is relatively constant (6–11 pg DNA/cell 13 ), and there is a good correlation between DNA content and cell number.
The high selectivity of the Quant-iT™ DNA assay resulted in a good correlation between the DNA content and the cell number, and was therefore used throughout this study.
This study confirmed the importance of (i) an efficient and reproducible cell lysis by incorporating three freeze–thaw cycles when using 0.05% Triton-X-100 and (ii) an unambiguous calculation method for the CSE (Fig. 2, Equation 1).
Zhou et al. determined the CSE by Method B, approximating the total cell number by the cells in the scaffold and the cells left behind in the seeding medium 20 and obtained values close to 85%. Using Method A these values could decrease to 20%.
Many researchers are directed toward Method C or D, both estimating the cells in the scaffold by the difference between the initially seeded cells and the cells left over in the medium. Materna et al. used both Methods A and D. According to the first method, the collagen and CaCO3 scaffolds, respectively, resulted in CSE values of ∼10% and 30%, whereas method D resulted in significantly higher CSE values of 83% and 53%. Both articles confirmed that Method A resulted in lower CSE values (Fig. 2B). Due to cell losses and as long as proliferation did not take place, Method A would result in lower, but more realistic CSE values that better estimate the number of cells ending up in the scaffold. Method A thus contributes more to obtain a clinically relevant TE process.
In this study it was demonstrated that the CSE values with passive seeding SaOS2 cells on Ti scaffolds were not significantly affected by the cell density and seeding vessel within the parameter ranges studied (Fig. 3A, B). Therefore, these results will not be further discussed. The MFR, the incubation time, and the scaffold morphology, however, did significantly affect the CSE values (Figs. 3C, D and 4A–C).
Because there is a correlation between the MFR and the scaffold morphology, the incubation time will be discussed first.
In literature the incubation time on average ranged between 1 and 48 h. Our results indicated that an increase of the incubation time up to 4 h enhanced the CSE, beyond which a plateau value was reached (Fig. 3D). The effect of the incubation time is often overruled by process parameters such as the scaffold type and the MFR value. Holy et al. obtained a CSE of 25% after 1 h and Lopez-Heredia of 40% after 24 h, whereas Du et al. reached a value of 1.3% after 24 h and Zhou et al. of 80%–90% after 2 h.4,20,22,25,26
Large MFR ratios and high permeabilities (correlated to the scaffold morphology) significantly decreased the CSE (Figs. 3C and 4A–C), as was confirmed by literature: Zhou et al. obtained a CSE of 80%–90% when using an MFR of 41.7%, Ryan et al. obtained a CSE of 40%, but seeded at a higher MFR (81%) and used highly permeable scaffolds, and Ichinohe et al. only obtained a CSE of 20%, when seeding with an MFR as high as 590%.20,27,28
The authors noticed a higher outflow percentage of the cell suspension during passive seeding of scaffolds with a high MFR and/or high permeability. A higher outflow percentage resulted in a lower contact time and contact area between bone cells and scaffold and negatively affected the CSE. Results obtained with respect to the contact time (Fig. 3D) confirmed that a short incubation time (≤2 h) reduced the CSE. The contact area between cells and scaffold is reduced by the outflow of the cell suspension. Our results confirmed that the CSE obtained by scaffolds with a high permeability (3DFD Ti scaffolds) or seeded at a higher MFR (100%–150%) was lower compared to the less permeable scaffolds (GC) or scaffolds seeded at lower MFR (50%). This indicated that decreasing the outflow of the cell suspension by using an enfolding vessel during passive seeding might be a possible approach to increase the CSE without modifying the scaffold characteristics.
Low MFR ratios (50%) resulted in significantly lower cell viabilities (Fig. 5). This indicates that controlling the CSE is insufficient to obtain a predictable and efficient cellular bone TE strategy: additional information on cell viability needs to be taken into account. Du et al. used an MFR of 16%, which might have caused severe cell death, resulting in cell detachment and DNA degradation, and thus resulting in a low CSE of 1.3%.
Reliably determining and maximizing the CSE in combination with the viability therefore plays a key role when bringing bone TE closer to the clinic as these two parameters together define the amount of viable cells ending op in a scaffold.
In this study, CSE data of scaffolds seeded at a cell density of 25,000 cells/μL as included in Figure 4 were combined with the viability data shown in Figure 5.
Maximization of the product of the CSE and the viability resulted in an optimal MFR of 100% (Fig. 6).
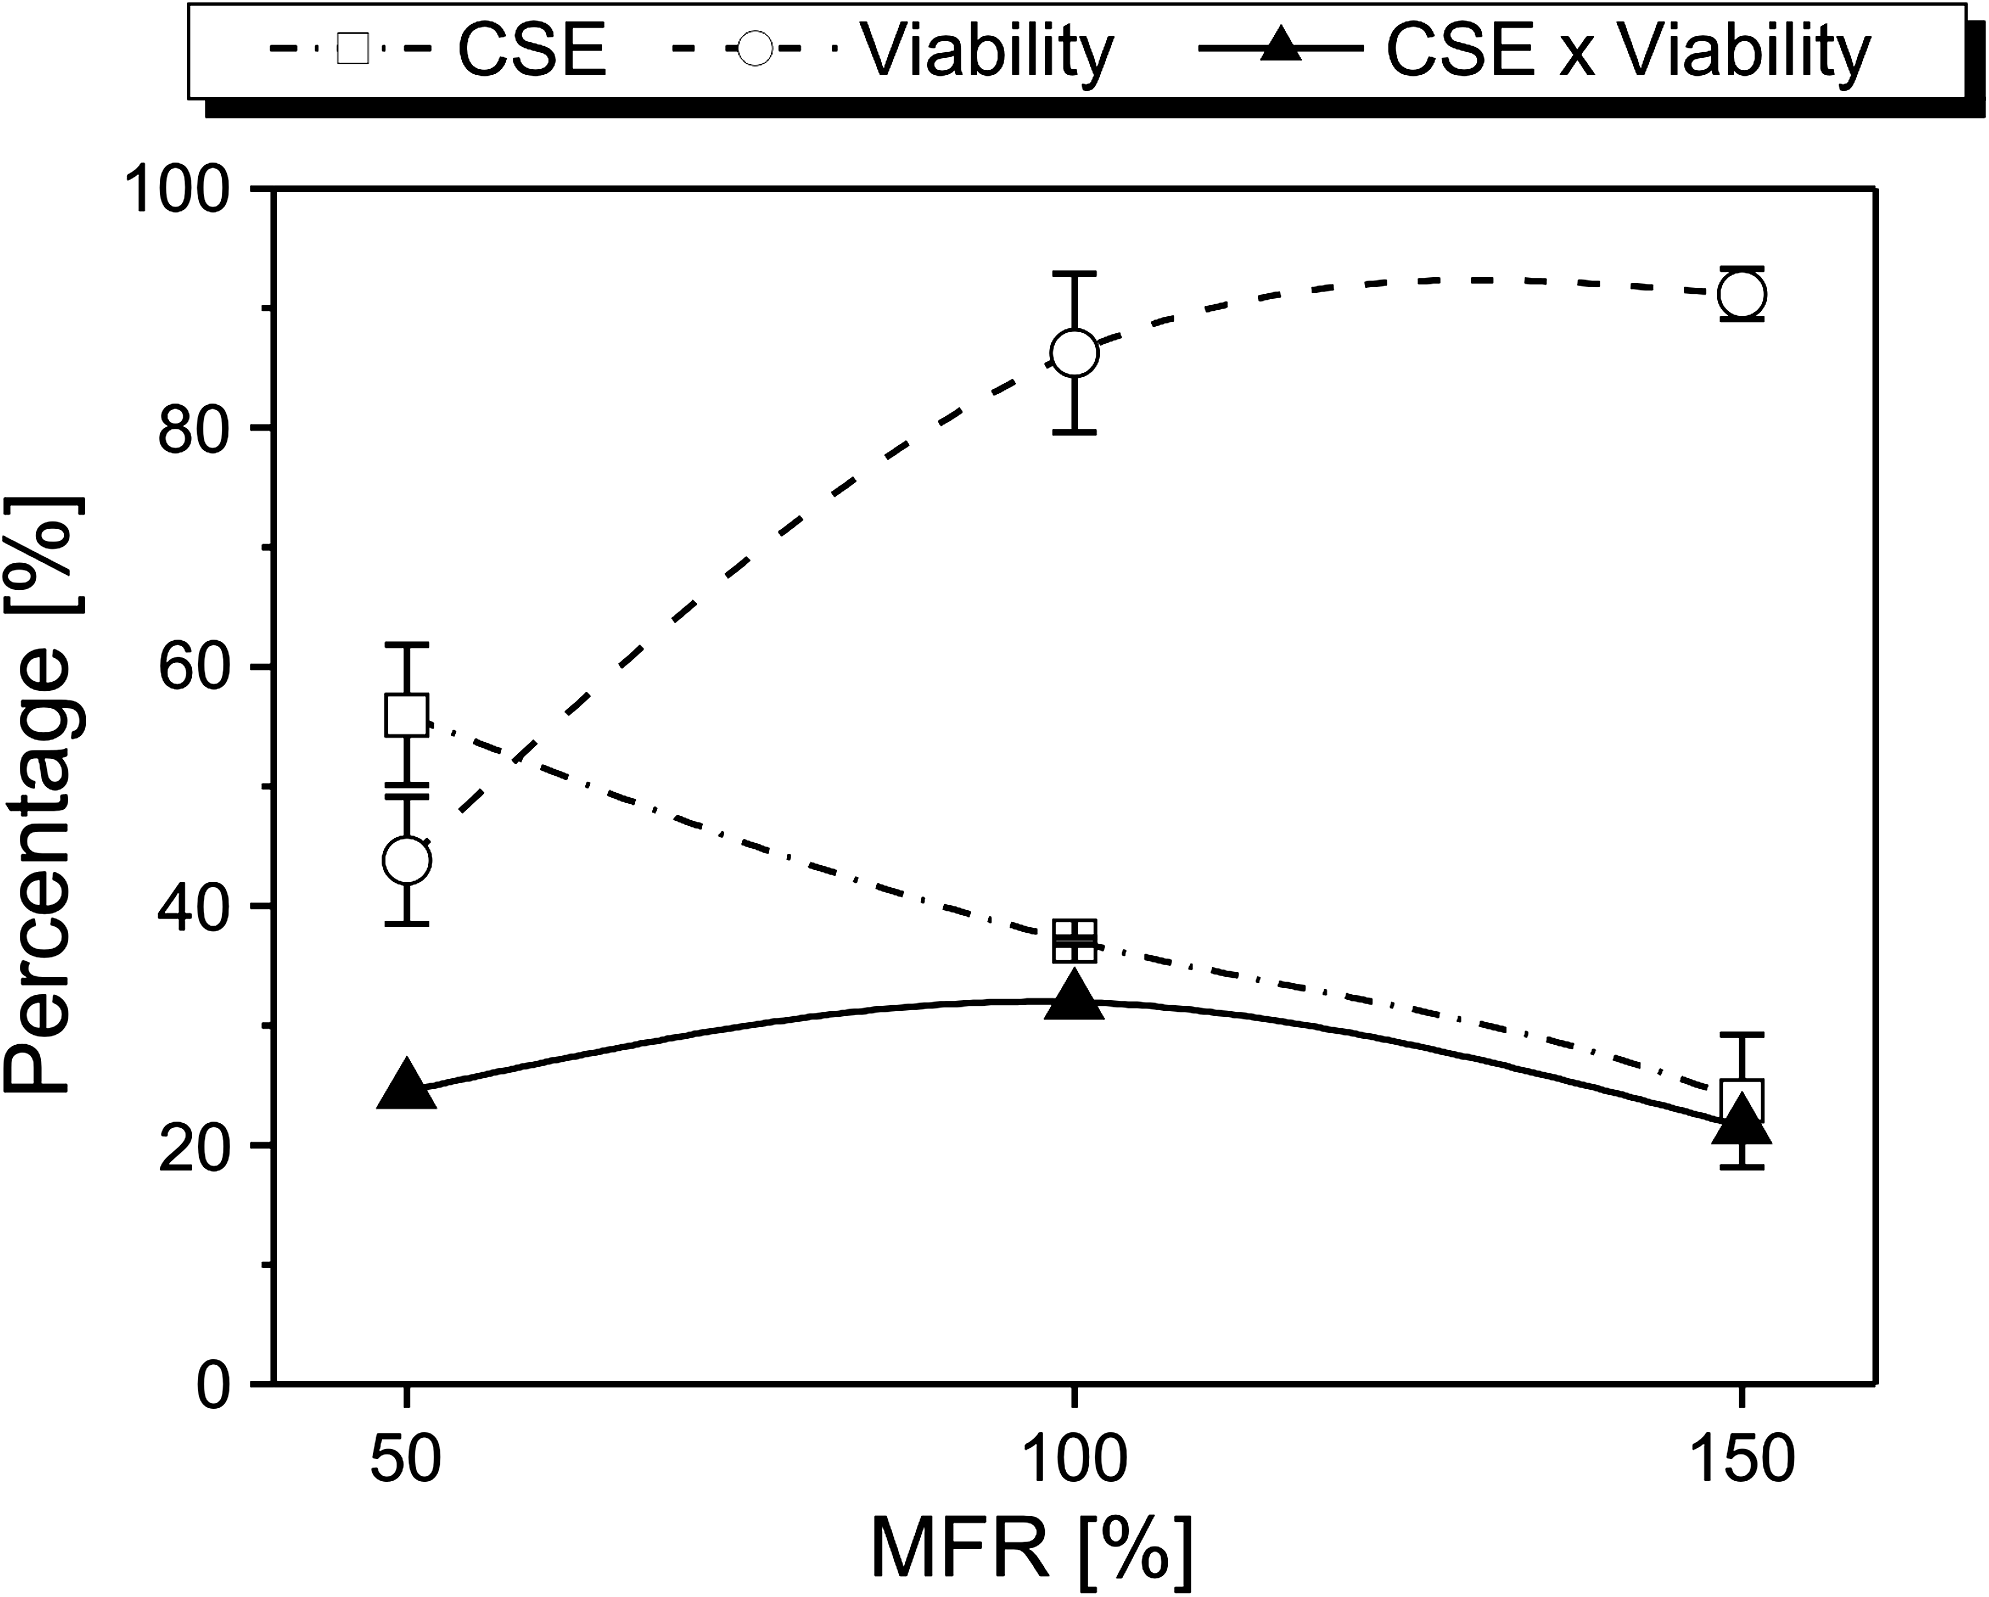
A low MFR is required to obtain a high CSE, whereas a high cell viability requires a high MFR. When combining both requirements—CSE and viability—the intermediate MFR of 100% appears to be the most optimal.
Predictable and efficient cellular bone TE strategies require an evidence-based selection of the process parameters of cell seeding and will include the maximization of the product of the CSE and the viability of the cells.
Further cell seeding research will focus on the integration and optimization of additional evaluation criteria besides the CSE, and cell viability, and include consistency, homogeneity, and possibility to scale up toward clinically relevant volumes.
Conclusion
Cell seeding plays a critical role in the quality of custom-made TE constructs. Reliable techniques are required to validate the different seeding conditions, by determining parameters such as the CSE, that is, the ratio of initially loaded cells to the successfully attaching cells.
DNA-based methods required an efficient and reproducible cell lysis step.
Under the applied conditions, cell lysis was significantly enhanced by incorporating three freeze–thaw cycles. The use of an unambiguous and reliable calculation method for the CSE was shown to be essential, as it significantly affected the obtained results and could lead to considerable overestimations.
Optimization of cell seeding requires an evidence-based selection of the process conditions. Passive seeding of SaOS2 cells on Ti scaffolds within the ranges studied was affected by the incubation time, the MFR, and the scaffold morphology. Increasing the incubation time initially increased the CSE and reached a plateau value after 4 h, whereas increasing the MFR or permeability significantly reduced the CSE under the applied process conditions. The cell density and seeding vessels did not significantly affect the CSE.
A low MFR significantly reduced cell viability. Within the parameter ranges investigated, maximization of the product of CSE and cell viability resulted in an optimal MFR of 100%.
An evidence-based selection of the seeding conditions requires further investigation of the process conditions in terms of CSE and other parameters such as the viability.
Footnotes
Acknowledgments
The scientific partners of the Guided Bone Engineering (GBE) project are the Department of Metallurgy and Materials Engineering, the Division of Biomechanics and Engineering Design and the Department of Rheumatology of the Katholieke Universiteit Leuven, the Polymer Materials Research Group of the Ghent University, and VITO, the Flemish Institute for Technological Research. Major Flemish industrial actors also support this project. This work is part of Prometheus, the Leuven Research and Development Division of Skeletal Tissue Engineering of the Katholieke Universiteit Leuven (
Disclosure Statement
No competing financial interests exist.