
Abstract
A simple porogen-leaching method to fabricate macroporous cyclic acetal hydrogel cell scaffolds is presented. Optical coherence tomography (OCT) was applied for nondestructive imaging and quantitative characterization of the scaffold structures. High-resolution OCT reveals the microstructures of the engineered tissue scaffolds in three dimensions. It also enables subsequent image processing to investigate quantitatively several key morphological design parameters for macroporous scaffolds, including the volume porosity, pore interconnectivity, and pore size. Two image-processing algorithms were adapted: three-dimensional labeling was applied to assess the interconnectivity, and erosion was applied to assess the pore size. Scaffolds with different design parameters were imaged, characterized, and compared. OCT imaging and image processing successfully discriminated scaffolds made from different formulations in terms of volume porosity, interconnectivity, and pore size. The cell viability and their spread across the scaffolds were confirmed by the fluorescence microscopy co-registered with OCT.
Introduction
There are several methods that have been employed to create macroporous water-swollen hydrogels, including freeze-drying, gas-foaming, stereolithography, and porogen-leaching.5–11 Each approach has associated advantages and disadvantages. Freeze-drying uses temperature changes to create porous structures. 5 Pore size (PS) is controlled by altering the freeze rate. However, higher success rates occur when combined with porogen-leaching. 12 Gas foaming is commonly used in hydrogels where pores are formed from bubbles created by either a chemical reaction or gasses under pressure. 8 PSs are controlled by altering gas volume, rate of gas nucleation, and diffusion. 9 Again, it can be combined with porogen-leaching to improve the PS control and PC.9,13 Laser stereolithography has also been employed to create porous structures. In this approach, complex internal structures can be produced through computer-aided design. 14 While this technique allows for excellent repeatability between scaffolds, it requires the use of expensive infrastructures. Porogen leaching, specifically salt leaching, is a commonly used technique for synthetic scaffolds to create porous structures due to ease of fabrication and porogen removal. The use of a water-soluble porogen with the water-soluble hydrogel polymer solution allows for the creation of isolated pores since isolated porogens can still be dissolved through the hydrophilic polymer matrix. By contrast, the conventional approach using a water-soluble porogen and a hydrophobic polymer scaffold leaves isolated porogens entrapped within the polymer scaffold. This simple method allows for the creation of macroporous water-swollen hydrogels using only aqueous solutions and was presented in this article.
Once fabricated, it is necessary to develop tools to characterize the architecture of macroporous scaffolds. Mercury intrusion porosimetry is a technique that has been commonly used, and is based upon the infusion of mercury within the scaffold under increasing pressure to determine the porosity and estimate PS.15–18 While this technique may give reasonable estimates of the porosity and PS, the use of mercury is not ideal due to its toxicity. In addition, it is difficult to measure pores with scaffolds with limited PC and sensitivity to pressure such as hydrogels. Further, mercury intrusion porosimetry is not appropriate for some scaffolds because it requires the sample to be under a vacuum. Such an environment would boil away most of the water and thus dramatically change the architecture of water-swollen hydrogels. Liquid displacement method is another technique that is also frequently utilized. Here, the construct is submerged in a volume of liquid and is brought through a series of evacuation–repressurization cycles to force liquid into the pores. 15 Porosity can be estimated from the amount of liquid that is taken up by the construct.19–21 However, it can be difficult to find a proper solvent that will not affect the biomaterial and can be forced into the pores. In addition, sensitive biomaterials may be compressed and their internal structures could be altered when exposed to varying pressures; therefore, the liquid displacement techniques may not be appropriate for some scaffolds too. Imaging and image analysis have also been applied. In particular, scanning electron microscopy and micro-computed tomography (micro-CT) are commonly used techniques.21–23 Micro-CT has been used to analyze bone morphology, 24 and are beginning to be used to determine porosity, PSs, and interconnectivity in scaffolds.25,26 However, both require long data acquisition and higher costs. Except for micro-CT, many of these above techniques are invasive, discrete methods of analysis. Therefore, there is a need for an optimal method that can analyze the engineered tissue structure in a noncontact manner and with high resolutions.
Optical coherence tomography (OCT) is a promising technique that may overcome many of the limitations of the previously mentioned techniques. This method allows for noninvasive cross-sectional imaging of tissue architecture by measuring the optical reflections.27–29 In OCT imaging, a beam of near-infrared light is shone upon the sample and the morphological features can be elucidated in terms of the scattering variations of the sample's internal structures. Near-infrared light is often used because the biological samples have lower scattering in the near-infrared region that allows deeper penetration. Specifically, the intensity and echo delay of the back-reflected light are measured using low coherence interferometry, which allows for precise micron-level imaging. 27 OCT has been used previously to image microstructures of various biological tissues.30–44 In fact, OCT has begun to be utilized in tissue engineering applications.45–63 For example, OCT has been shown to differentiate among cells, matrix, and scaffolds, and is capable of analyzing cellular proliferation, adhesion, and motility.48,53 In addition, perfusion has been assessed with Doppler OCT, where an OCT system was integrated with bioreactor culture systems to monitor specimens repeatedly. 64 Recently, a fibrin tissue-mimicking phantom has been proposed for assessing OCT. 62 For imaging engineered tissue scaffolds, OCT has several advantages. Depending on the scattering property of the sample, OCT is able to image to a depth of 1–2 mm with a resolution of 1–15 μm, which allows for analysis at the cellular level and observation of the extracellular matrix.56,61 OCT does not rely on exogenous contrast agents such as fluorescent dyes, thus maintaining cell viability during imaging. In addition, OCT reduces potential artifacts because it eliminates the need for specimen fixation and processing. OCT has been demonstrated being capable of performing repeated observations on the same sample for a time-lapse analysis,61,63 which also implies the nondestructive nature of OCT imaging. OCT is relatively less costly than other imaging techniques. 46 Lately, OCT data have been digitized, which facilitates quantitative image-processing techniques to analyze specific structural or functional features for each application. Automation of routine processes is especially preferred because manual processing is highly time consuming and prone to error.43,65,66 OCT images, however, are deteriorated by speckle noise. Among many other approaches to reduce speckle, image processing using median filter is applied here.
In this work we endeavor to fabricate macroporous hydrogel scaffolds and then characterize their architecture by OCT. Our laboratory has previously developed a class of biomaterials based upon a cyclic acetal polymer. These materials may be advantageous for tissue engineering applications as they degrade hydrolytically to form primary degradation products of diols and carbonyls, and thus should not affect the local acidity of the implant or phenotypic function of the delivered cell population.1,67,68 In particular, we have polymerized the monomer 5-ethyl-5-(hydroxymethyl)-β,β-dimethyl-1,3-dioxane-2-ethanol diacrylate (EHD) with a poly(ethylene glycol) diacrylate (PEGDA) polymer to form EH-PEG hydrogels.69–72 In this work, and for the first time, macroporous EH-PEG hydrogels were fabricated and then characterized using OCT. Objectives of this study are to (1) create water-swollen macroporous EH-PEG hydrogels, (2) apply OCT to automatically quantify the EH-PEG hydrogel architectural parameters, and (3) combine OCT with fluorescence microscopy (FM) to demonstrate viable cells and their distribution within the hydrogels.
Materials and Methods
EH-PEG hydrogel fabrication
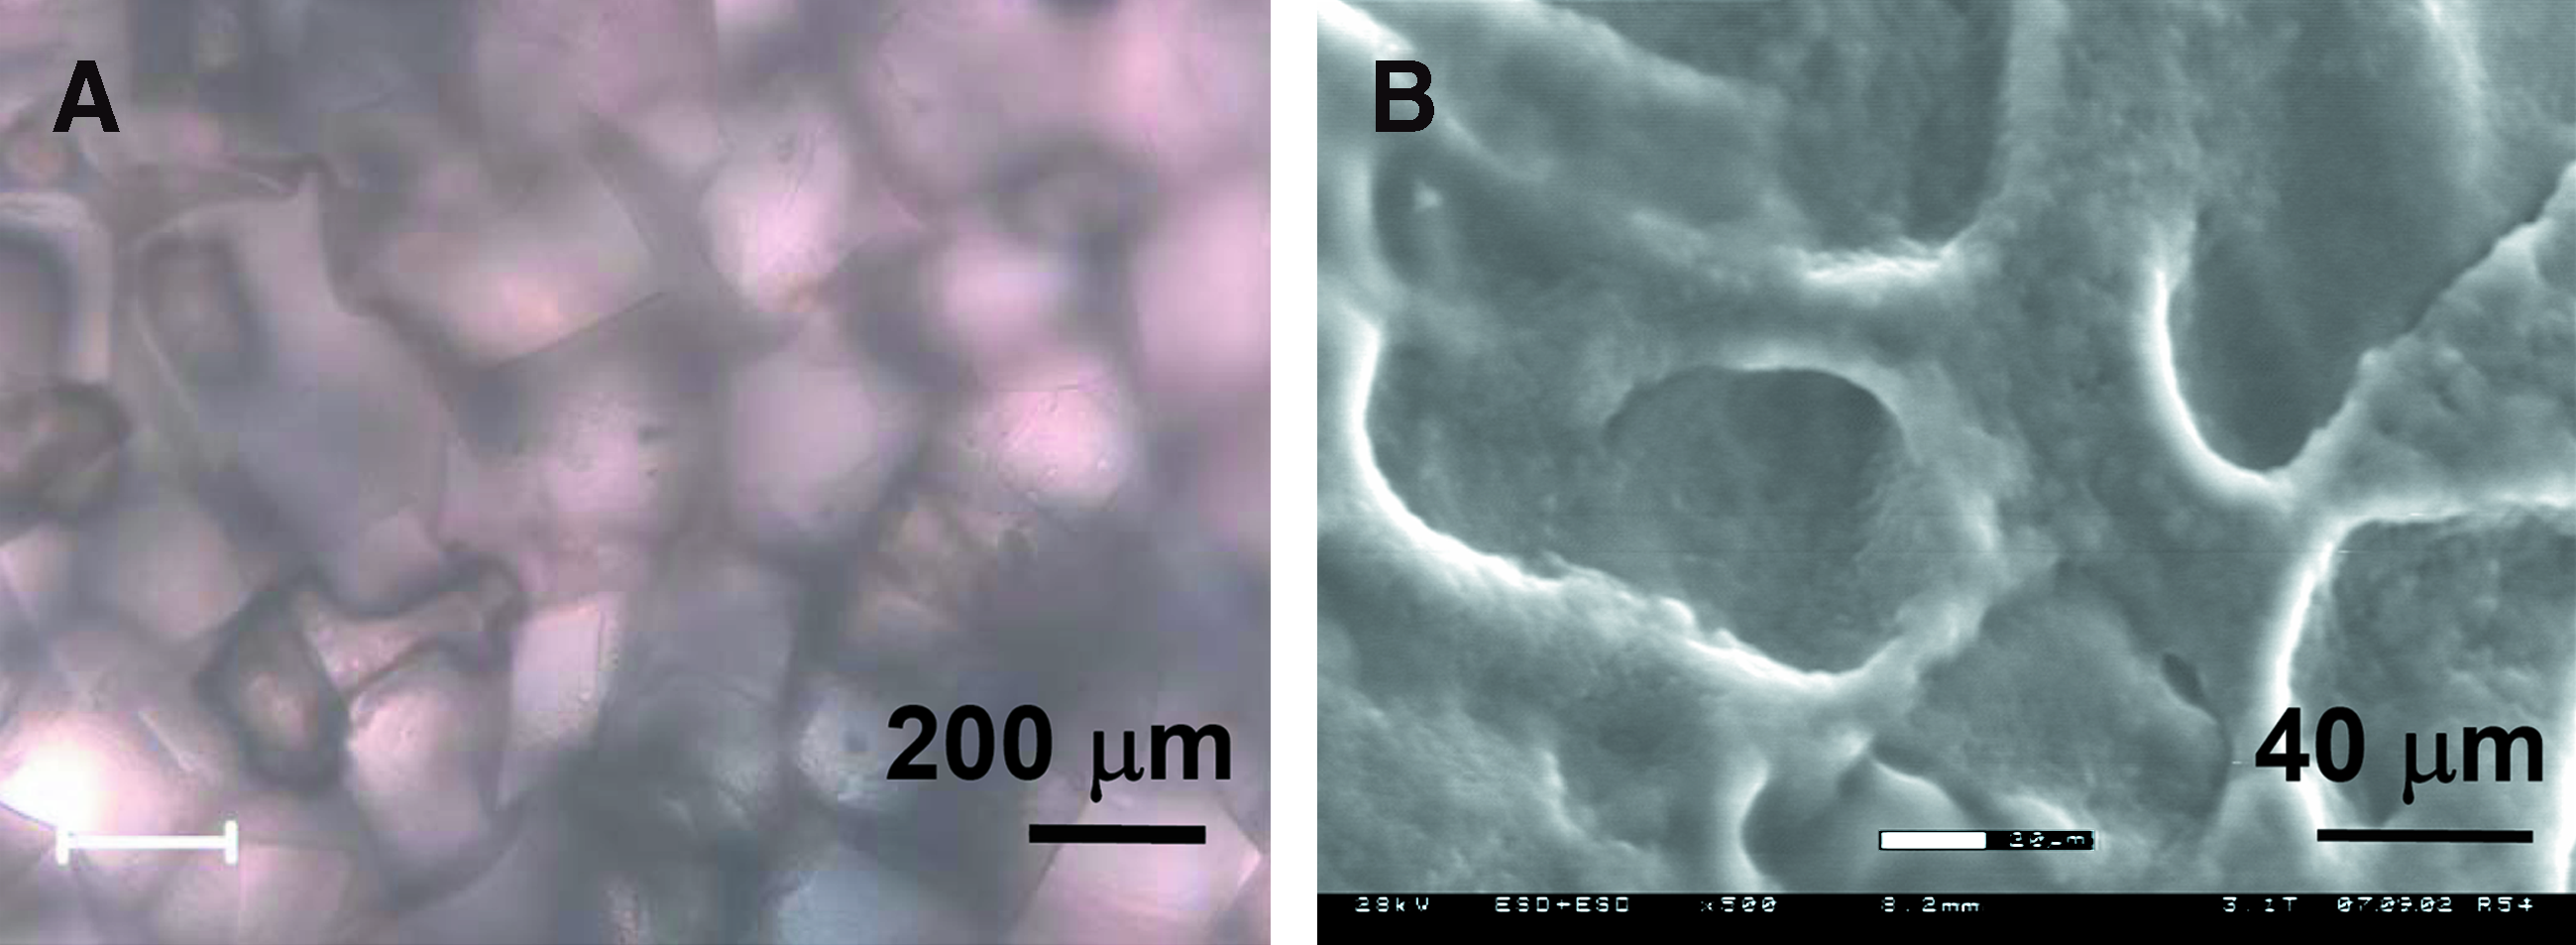
Cyclic acetal hydrogels were fabricated from the EHD monomer and PEGDA polymer using established techniques.69–72 Briefly, macroporous EH-PEG constructs were crosslinked using ammonium persulfate and N,N,N′ ,N′-tetramethylethylenediamine at 15 mM using a sodium chloride-leaching technique. A saturated salt solution was used as the water component of the gel to slow the sodium chloride crystals from dissolving into the gel solution. The constructs were prepared using EHD and PEGDA (Mn = 700 g/mol) at 1:10 molar EHD to PEGDA with 30 wt% initial monomer components. Sieves were used to sort sodium chloride granules to specified sizes. Gels were created in Petri dishes by spreading the salt evenly and dispersing the gel solution over the salt before crosslinking. Gels were allowed to crosslink, and smaller gels were cut to 8 mm diameter with a cork borer. The sodium chloride was leached out over 2 days in water with multiple washes while on an orbital shaker. Gels were sterilized in 70% ethanol, washed four times in phosphate-buffered saline, and presoaked in control media plus fetal bovine serum (FBS) for 4 h before cell loading. EH-PEG hydrogels were created with the following four formulations with different porogen sizes and mass porosity. Formulations 1 and 2 were fabricated with salt that had been collected between sieves of 106 and 150 μm, and formulations 3 and 4 were fabricated with salt collected between sieves of 250 and 300 μm (Fisher Scientific). The mass porosities for these four formulations are 65% (1), 70% (2 and 3), and 75% (4). Figure 1 shows a typical macroporous EH-PEG hydrogel scaffold under the phase-contrast microscope and environmental scanning electron microscope.
Human mesenchymal stem cell culture
Human mesenchymal stem cells (hMSCs) were purchased from Lonza and cultured according the manufacturer's specifications and as described in the literature. 73 The hMSCs were cultured in control media composed of high-glucose Dulbecco's modified Eagle's medium with 4 mM L-Glutamine, 0.1 mM nonessential amino acids, 1% penicillin/streptomycin (v/v), and 10% MSC qualified FBS. Then, the hMSCs were added to sterile, presoaked hydrogels in a concentrated cell solution. The cells were allowed to attach for 4 h before filling the well with media. Next, each gel was seeded with 50,000 cells and the seeded gels were cultured and analyzed using the LIVE/DEAD assay. They were soaked in phosphate-buffered saline for 1.5 h to remove FBS from the hydrogel, which can interact with the LIVE/DEAD reagents and then incubated with the LIVE reagents (2.5 μM calcein AM) at room temperature for 30 min before FM imaging.
Optical coherence tomography
A swept-source Fourier-domain OCT (Thorlabs Inc.) was utilized in this work (Fig. 2). The laser source generated a broadband spectrum of 100 nm at 1300 nm, which provided an axial resolution of 8 μm. The laser operated at a sweep rate of 16 kHz. The average output power was 12 mW. The output of the swept-laser was split into two portions. Three percent passes to a Mach-Zehnder interferometer with a fixed path difference to generate an optical frequency clock. The remaining 97% output was equally distributed to the sample and reference arms. In the sample arm, the laser passed through an objective (Olympus). The transverse resolutions were either 15 μm under a 4 × (NA = 0.1) objective or 7 μm under a 10 × (NA = 0.25) objective. Approximately 4 mW power was illuminating on the sample. In the reference arm, a dispersion compensation glass was used to compensate the dispersion of light in the sample arm. The returned OCT interference signal was detected by a balanced photodetector, digitized by data acquisition board, and Fourier transformed to obtain an axial depth profile. Three-dimensional images were acquired using a pair of galvanometer mirrors (Cambridge Technology), measuring 2 × 2 × 2.55 mm3 with 512 × 512 × 512 pixels. During imaging, the pore was water-filled. The gel and the pore were assumed to have the same refractive index, n = 1.33. Each voxel therefore corresponded to 56.9 μm3 physically. The sensitivity of the system was 95 dB. Depending on the optical property of the gel (mainly the scattering property), the penetration depth of 0.5–1 mm into the scaffold was generally accomplished.

Schematics of the combined OCT and FM imaging system. BD, balanced detector; BS, beam splitter; C, collimator; D1, D2, dichroic mirror; DAQ, data acquisition board; DCG, dispersion compensating glasses; FC, fiber coupler; M, mirror; MZI, Mach-Zehnder interferometer (frequency clocks); OBJ, objective; PC, polarization control; PMT, Photomultiplier Tube; XY, XY scanner. OCT, optical coherence tomography; FM, fluorescence microscopy. Color images available online at
Fluorescence microscopy
The left portion of Figure 2 depicts the fluorescence microscope, which was co-registered with OCT to image fluorescence-labeled cells within the scaffolds. The FM system used a laser diode (NDHA210APAE1; Thorlabs, Inc.) at 473 nm as the excitation source. The excitation light was combined with the OCT sample arm by a dichroic mirror (D1). Typical illumination power on the sample was ∼2 mW. The fluorescence signals were first separated from the excitation light by another dichroic mirror (D2, FF506-Di02-25 × 36; Semrock), passed through an emission filter (540–570 nm), and then were detected by a photomultiplier tube (H7422PA-40; Hamamatsu). The excitation and emission wavelengths were chosen based on the optical properties of the viability reagent (Invitrogen) used to label cells in this study. FM provided lateral resolution of 1.6 μm. To co-register OCT images with FM images, the U.S. Air Force resolution target with rhodamine 6G fluorescence dye upon it was imaged simultaneously by OCT and FM. Calibration was achieved by overlaying FM image with the reconstructed en face OCT image of the resolution target. Calibrated co-registered image field-of-view (FOV) was 1.7 × 1.7 mm2.
Image-processing algorithm: Filtering and segmentation
En face (XY) OCT images were first filtered by a median filter to remove the speckle. Speckle is an interference effect caused by the scattering of light from microscopic tissue heterogeneities. The resulting granular pattern does not correspond to the actual tissue microstructure. 74 To perform intensity segmentation where identification of features and edge preservation are required, a median filter is commonly applied to remove the speckle effect and to preserve edges simultaneously. In our images, typical speckle size was 4–6 pixels wide. An empirical 8 × 8 pixel block was applied for each pixel. The intensity histogram of the filtered image was then generated to estimate the segmentation threshold. Because the porous (void) and mass (solid) regions in the hydrogel have different back-scattering intensity, the histogram clearly showed two peaks separated by a valley. The intensity segmentation threshold was then set to be the minimum in the valley regime for each en face image. The segmentation process formed a binary image highlighting the pores (pixel value I = 1 for porous region and I = 0 for the scaffold region) as illustrated in Figure 3. The volume porosity (VP), PC, and PS were quantified based on the segmented images.

Segmentation of an en face OCT image into a binary image highlighting the pore regions. Segmentation threshold was determined by the minimum in the valley region in the histogram. Red arrow indicates the minimum location. Scale bar = 200 μm. Color images available online at
Image-processing algorithm: VP
The VP was expressed as the ratio of pore volume (Vpore) divided by the total volume (Vtotal):
Both pore volume (Vpore) and total volume (Vtotal) were automatically quantified from the 3D segmented OCT images, and expressed as the number of voxels.
Image-processing algorithm: PC
As OCT is capable of imaging scaffolds in a nondestructive way, the images reveal the pore structures in situ and are suitable for use in an algorithm to investigate PC. We adapted a 3D labeling function bwlabeln in Matlab to automatically identify regions that are spatially connected and regions that are spatially isolated in 3D. Similar functions can be acquired in commercial software like Analyze (Biomedical Imaging Resource, Mayo Clinic) or Amira (Visage Imaging GmbH) as well. After labeling, label indices can be used to select and extract stereo-isolated regions from the complex gel matrix. Each region is a group representing either an entire pore, a partial pore, or several interconnected pores.
PC is defined as the accessible pore volume fraction
26
:
Accessible pore volume is the volume of pores that connect to the outside air space. A highly interconnected pore network is characterized by the ability to access pores that are deep from the gel surface. On the contrary, a low interconnected pore network is characterized by the limited ability to only access shallow pores.
Image-processing algorithm: PS
After 3D labeling, the volume of each group is readily available. Determining PS is possible by counting the number of voxels in a given group. However, this approach works only when all the pores are fairly isolated from each other, which is not the desired case. Therefore, such an approach is not feasible when one pursues to fabricate scaffolds with highly interconnected pore networks. To address the issue, we adapted a mathematical morphological operation known as erosion to estimate PS. The erosion algorithm detects and removes the stereo boundary of each group iteratively. Erosion leads to three consequences. First, it disconnects the interconnected pores from each other because the connection between the pores is generally narrower than the pore body. This event is called separation and it increases the number of groups in the matrix. Second, the dimension of the group is reduced 2i pixels by i times of erosion, but the number of groups in the matrix remains the same. Note that every iteration removes 2 voxels from the boundary. Third, a group is totally removed if its largest dimension is <2i pixels. However, it may be removed earlier if its other dimensions are smaller. This event is called annihilation and it decreases the number of groups. In this case, the PS is estimated by:
where Ea (μm/pixel) is the conversion unit. In other words, the PS can be estimated by the number of iteration it takes for annihilation to occur. The occurrence of separation and annihilation can be seen from the increase and decrease in the number of groups Gi along iterations. After i-th iteration, Gi is summarized by:
By applying erosion and labeling iteratively until there are no more groups in the matrix, the PS distribution was estimated. Figure 4A–C shows the spatial distribution of the groups after 0, 4, and 8 iterations. Figure 4D shows the number of groups verses the erased size (2 × 3.9 μm/pixel x i). The curve rises in the beginning, indicating the number of groups increases due to the dominating events of separation as well as the possible minor events of annihilation of small-volume groups. The curve later declines, indicating the dominant event becomes annihilation. In other words, separation barely occurs and most pores have been isolated. Assuming the event of all the pores being separated from each other occurs when the number of groups reaches its maximum, the right-sided declining curve can be simply explained as that only annihilation occurs. Therefore, this part of the curve was treated as the “cumulative density function” and its finite difference as the probability density function. The expectation and standard deviation of PS were calculated based on the probability density function, as exemplified in Figure 4E. In the case that the curve was not monotonically decreasing as required by the definition of cumulative density function, rendering negative probability density, the negative part was replaced with zero, as exemplified at 93.6 μm in Figure 4E.

Estimation of pore size by erosion and labeling. Diameter erased by erosion was 0 μm
The erosion algorithm was tested by virtual cube phantom. Considering all possible orientations of cubes, the algorithm slightly overestimated the prespecified 100 pixel cube by 7 pixels. The error attributes to the finite grid sampling of different oriented cubes. Therefore, dense sampling is preferred. The erosion algorithm was implemented in Matlab with its built-in imerode function. Each iteration elapsed ∼2 s, running on a computer with a 2.66 GHz dual-core processor.
Image-processing algorithm: Cell counting
The number of cells on the scaffold surface within the two-dimensional (2D) FOV was counted by using the same labeling process. The 2D fluorescence image was first segmented and then each dye-stained cell was labeled with an index automatically. The number of cells inside the FOV was estimated as the total number of labels. Potential error may come from the case of several cells overlapping with each other. In this case, only one number was counted. Volumetric imaging of cells' distribution such as two photon microscopy may resolve the problem in the future study.
Statistical analysis
All experiments were completed with a minimum of 3 replicates, and up to 11 replicates. Means and standard deviations are reported and summarized in Table 1. Statistical analysis was performed by a Student's t-test with a significance of p = 0.05.
VP, volume porosity; PC, pore interconnectivity; PS, pore size; n, the number of samples considered in the statistics; hMSC, human mesenchymal stem cell.
Results
Macroporous EH-PEG hydrogel fabrication and OCT imaging
Macroporous EH-PEG hydrogels were successfully fabricated using the porogen leaching technique. The use of a polymer solution that was saturated with salt allowed the addition of a salt porogen to further create a macroporous architecture. Figure 5 shows the representative OCT images taken from four samples made from different formulations. As shown in the cross-sectional images (A–D), OCT imaging penetrated 0.5–1 mm into the scattering scaffold. Both the cross-sectional and en face OCT (E–H) images revealed the porous regions for cell growth (dark color) and hydrogel region (gray-white color). Different PSs and porosities among samples can be qualitatively appreciated. Segmented binary (I–L) and labeled (M–P) representations of scaffolds revealed the interconnectivity in the pore network. Qualitatively, scaffolds fabricated using formulations 3 and 4 showed better interconnectivity than those fabricated using formulations 1 and 2.

Quantification of VP
For scaffolds fabricated using formulations 1–4, the calculated VPs are 24.4% ± 7.5%, 18.1% ± 10.3%, 41.4% ± 6.0%, and 39.7% ± 7.7%, respectively. The test of significance for pair (1, 2), (2, 3), and (3, 4) reports p = 0.28, 4.4 × 10⁻³, and 0.61, respectively. Therefore, it indicates that VP strongly depended on porogen size, with larger porogen corresponding to higher VP. However, when comparing hydrogels of different mass ratios, VPs were not statistically different (p > 0.05). The prespecified porosities based upon mass ratios can also be translated into VP by
where DNaCl = 2.2 g/mL, DPEGDA = 1.1 g/mL, DEHD = 1.1 g/mL. For mass ratios (Mpore/[Mpore + MPEGDA + MEHD]) of 65%, 70%, and 75%, the translated VPs are 47%, 53%, and 59%, respectively. It is observed that VPs calculated by OCT were constantly ∼25% lower than those predicted by mass porosity.
Quantification of PC
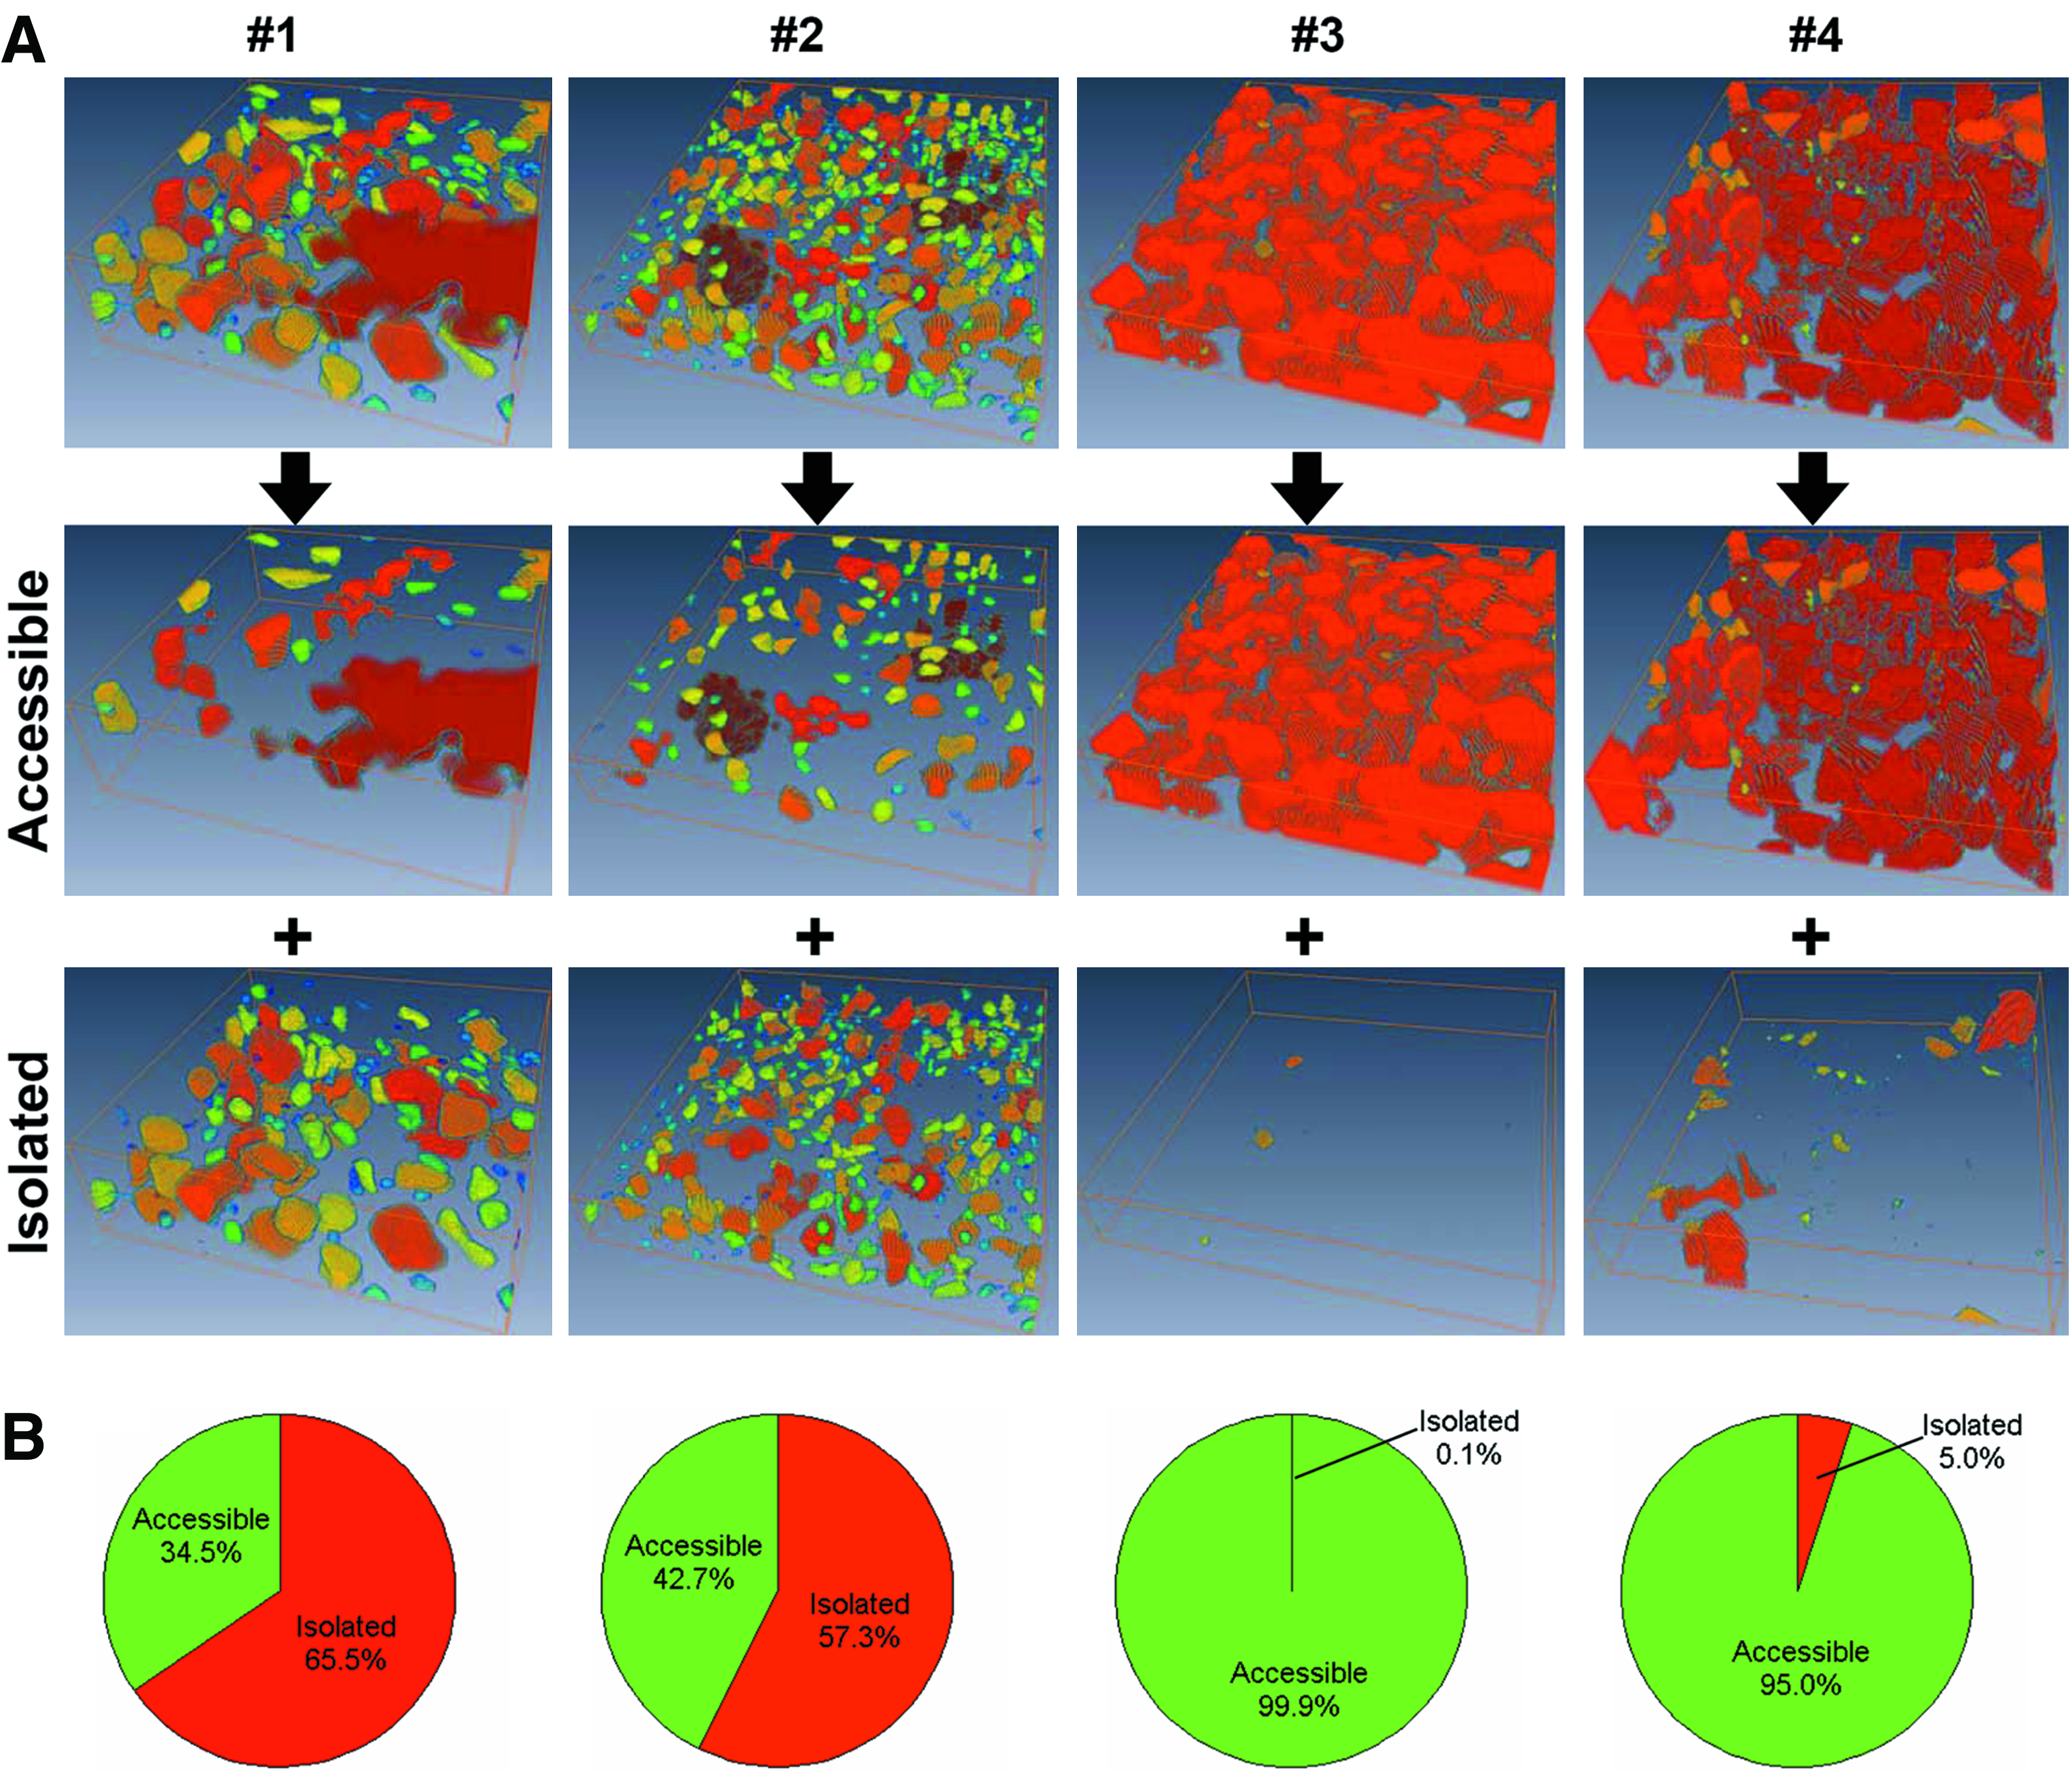
To quantitatively evaluate the interconnectivity, hydrogel matrices were decomposed with respect to the accessibility of pores 26 as explained in the section Image-processing algorithm: PC. Figure 6A shows the representative decomposed matrices for each formulation. Groups connecting to the outside space were collected and defined as the accessible region. The other groups were defined as isolated regions. Interconnectivity was defined as the share percentage of accessible volume, and summarized in Figure 6B. The PC results from multiple samples were 67.1% ± 17.3% for 1, 68.2% ± 18.6% for 2, 97.8% ± 1.9% for 3, and 94.5% ± 3.3% for 4. The test of significance for pair (1, 2), (2, 3), and (3, 4) reported p = 0.35, 2.5 × 10⁻⁴, and 0.08, respectively. Therefore, statistics suggested that scaffolds fabricated with different size porogens were associated with different interconnectivities.
Quantification of PS
Erosion and labeling processes were applied to estimate PS as explained in the section Image-processing algorithm: PS. Figure 7 shows the estimated sizes are 72.5 ± 27.5 μm for 1, 80.7 ± 33.0 μm for 2, 194.3 ± 52.3 μm for 3, and 144.6 ± 52.5 μm for 4 for multiple samples. The estimated PS was consistently lower than the nominal sieve size. Again, the test of significance for pair (1, 2), (2, 3), and (3, 4) reports p = 0.55, 2.7 × 10⁻⁵, and 0.92, respectively. Hydrogels fabricated with differing porogens sizes were found to have statistically different PSs.
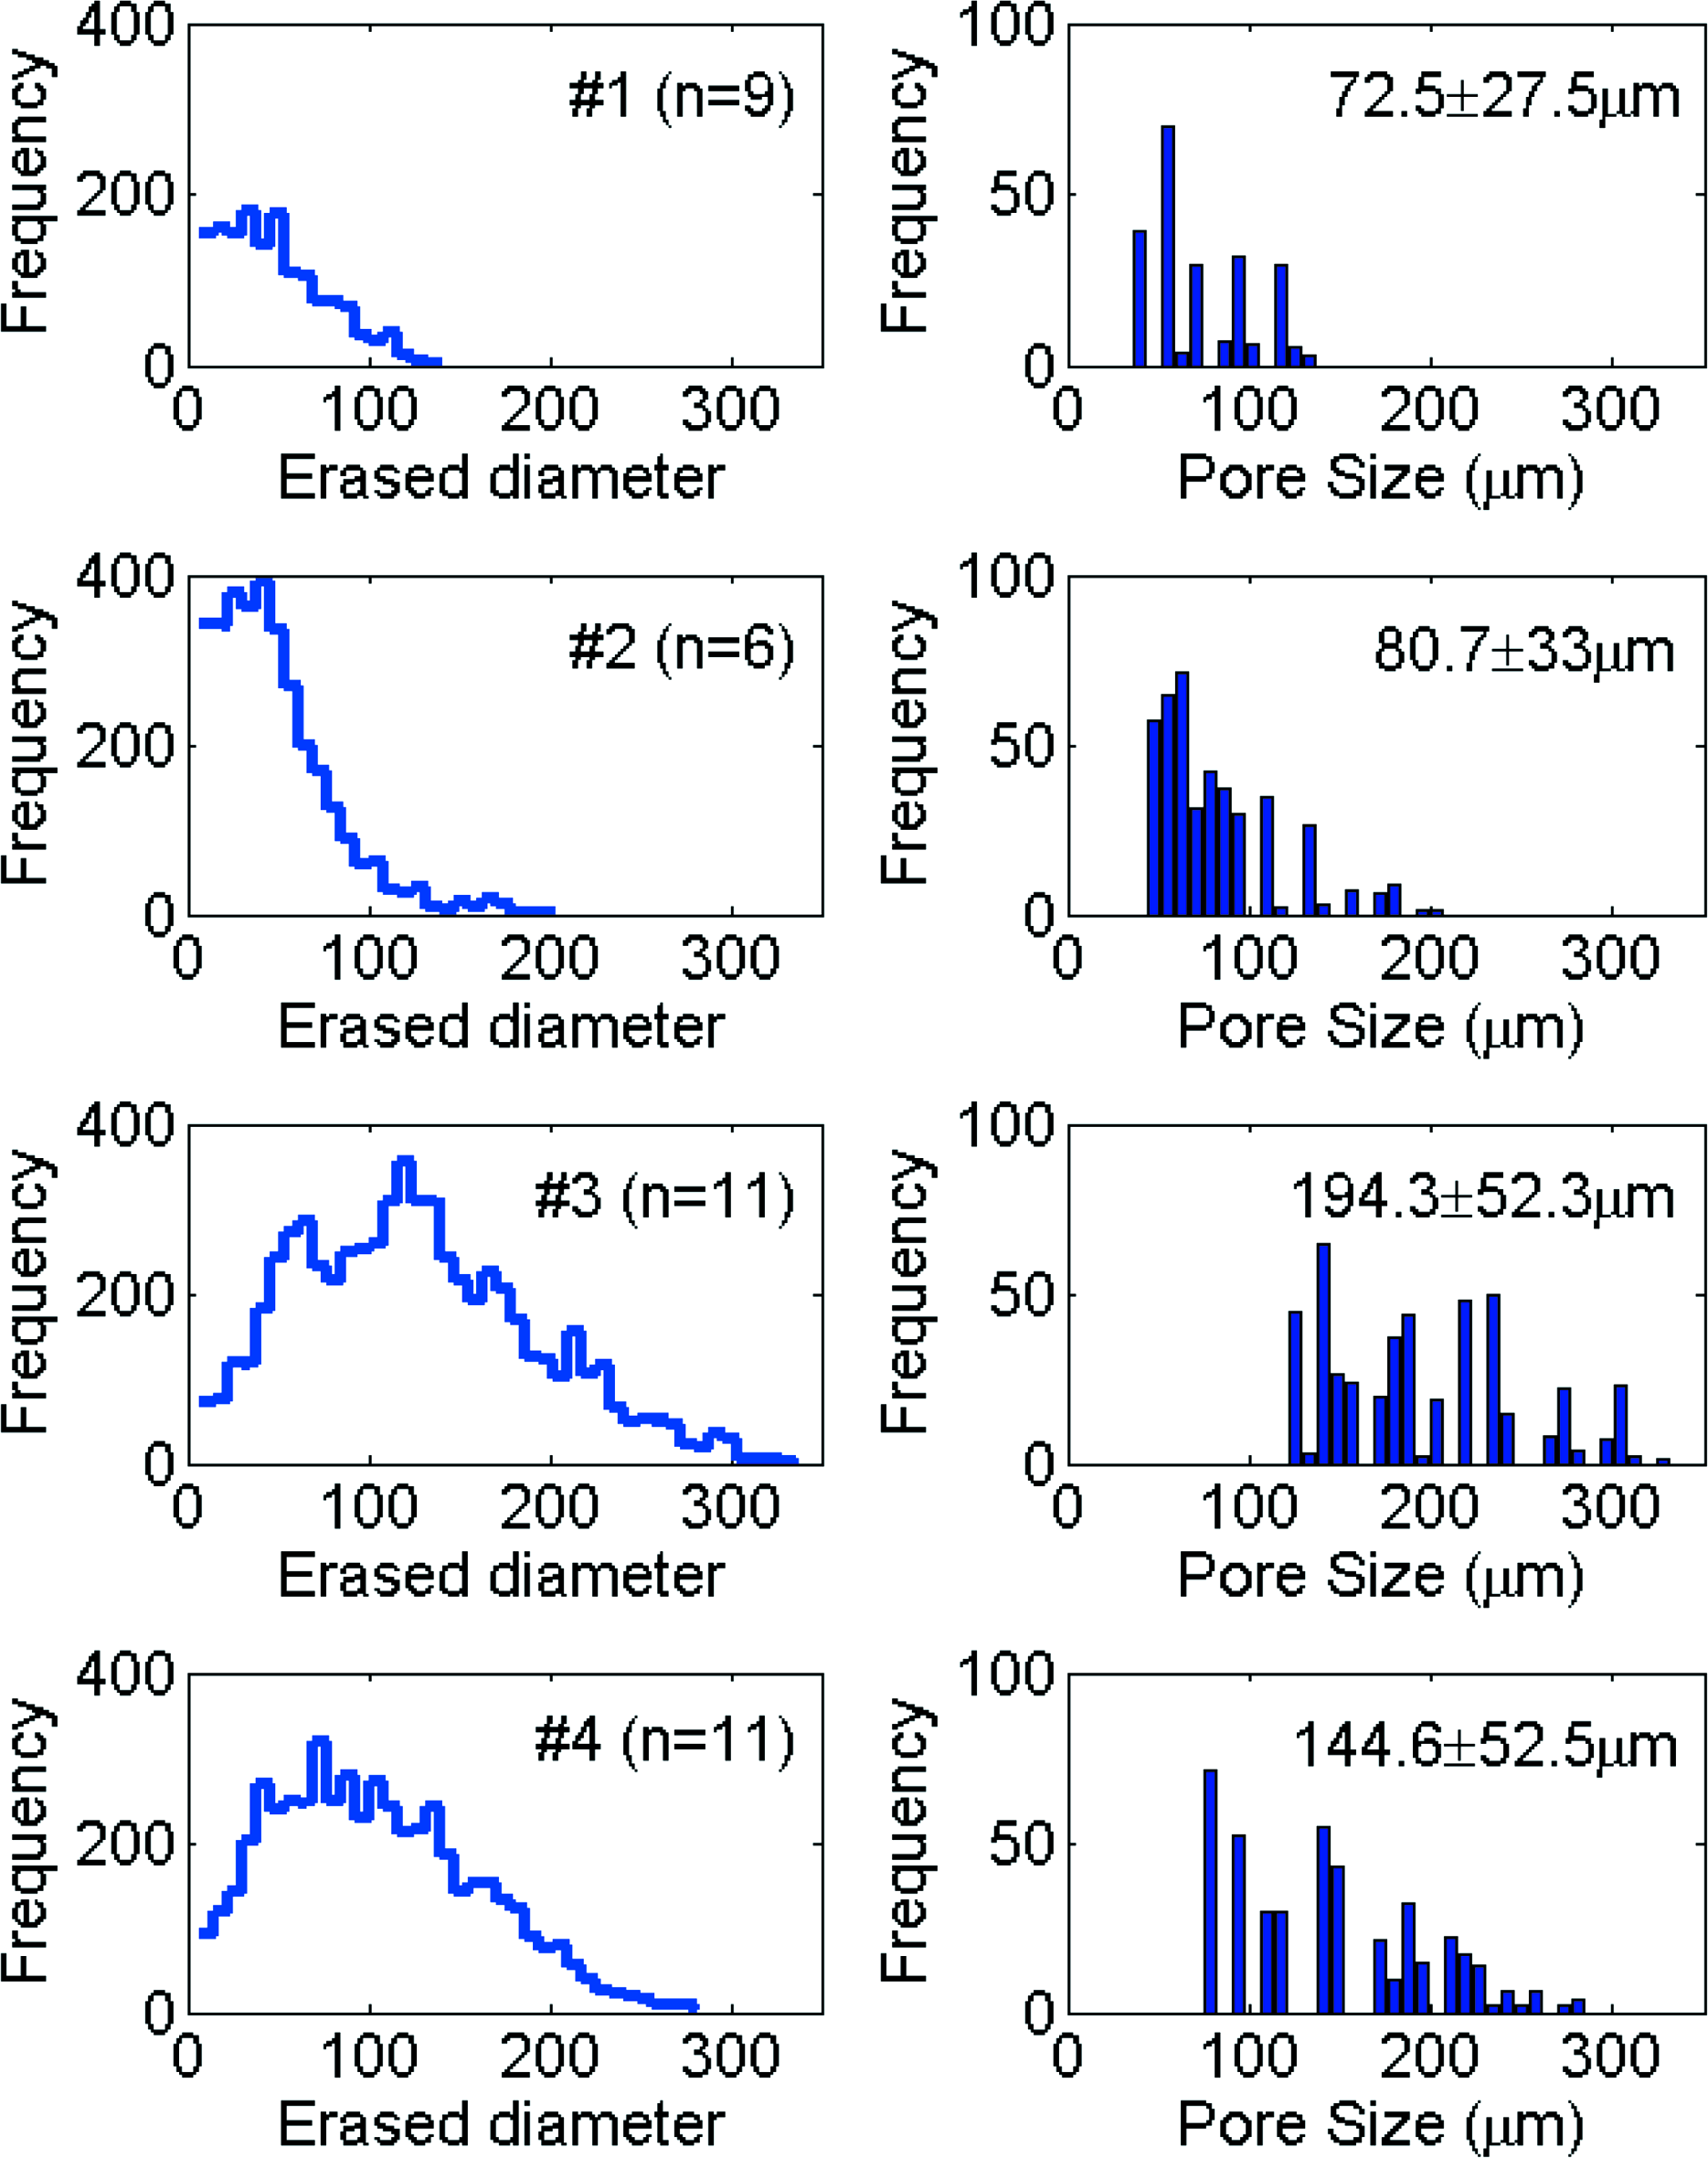
(Left) The number of groups evolving with erosion iterations. For each formulations 1–4, n is the number of samples considered in the statistics. (Right) Estimated probability density function and the subsequent expectation and standard deviation value of pore size. Color images available online at
Co-registered OCT and FM images of hMSC in scaffold
The structural properties revealed by OCT are important for the scaffold design since different scaffold structures may result in different cellular behavior within the scaffold. To understand cell distribution after initial seeding, hMSCs were seeded only from the top surface of an ∼2-mm-thick hydrogel. Cells were then imaged under FM and OCT for both top and bottom surfaces. Comparing the difference of cell population between top and bottom may then indicate cellular behavior among different scaffolds. Figure 8 shows the co-registered FM and en face OCT image of the top and bottom surfaces of the scaffolds from the same batch. A red (pseudo colored) signal indicates viable hMSCs distributed over the scaffold surfaces. Figure 9 summarizes the number of cells on the top and bottom surface using the method described in the section Image-processing algorithm: cell counting. The calculated number of cells per mm2 was 40.9 ± 7.9, 54.7 ± 15.0, 28.3 ± 8.1, and 17.3 ± 3.6 on the top side, and 12.3 ± 6.8, 9.2 ± 5.1, 8.4 ± 1.2, and 10.5 ± 4.6 on the bottom side, for 1–4 scaffolds, respectively.
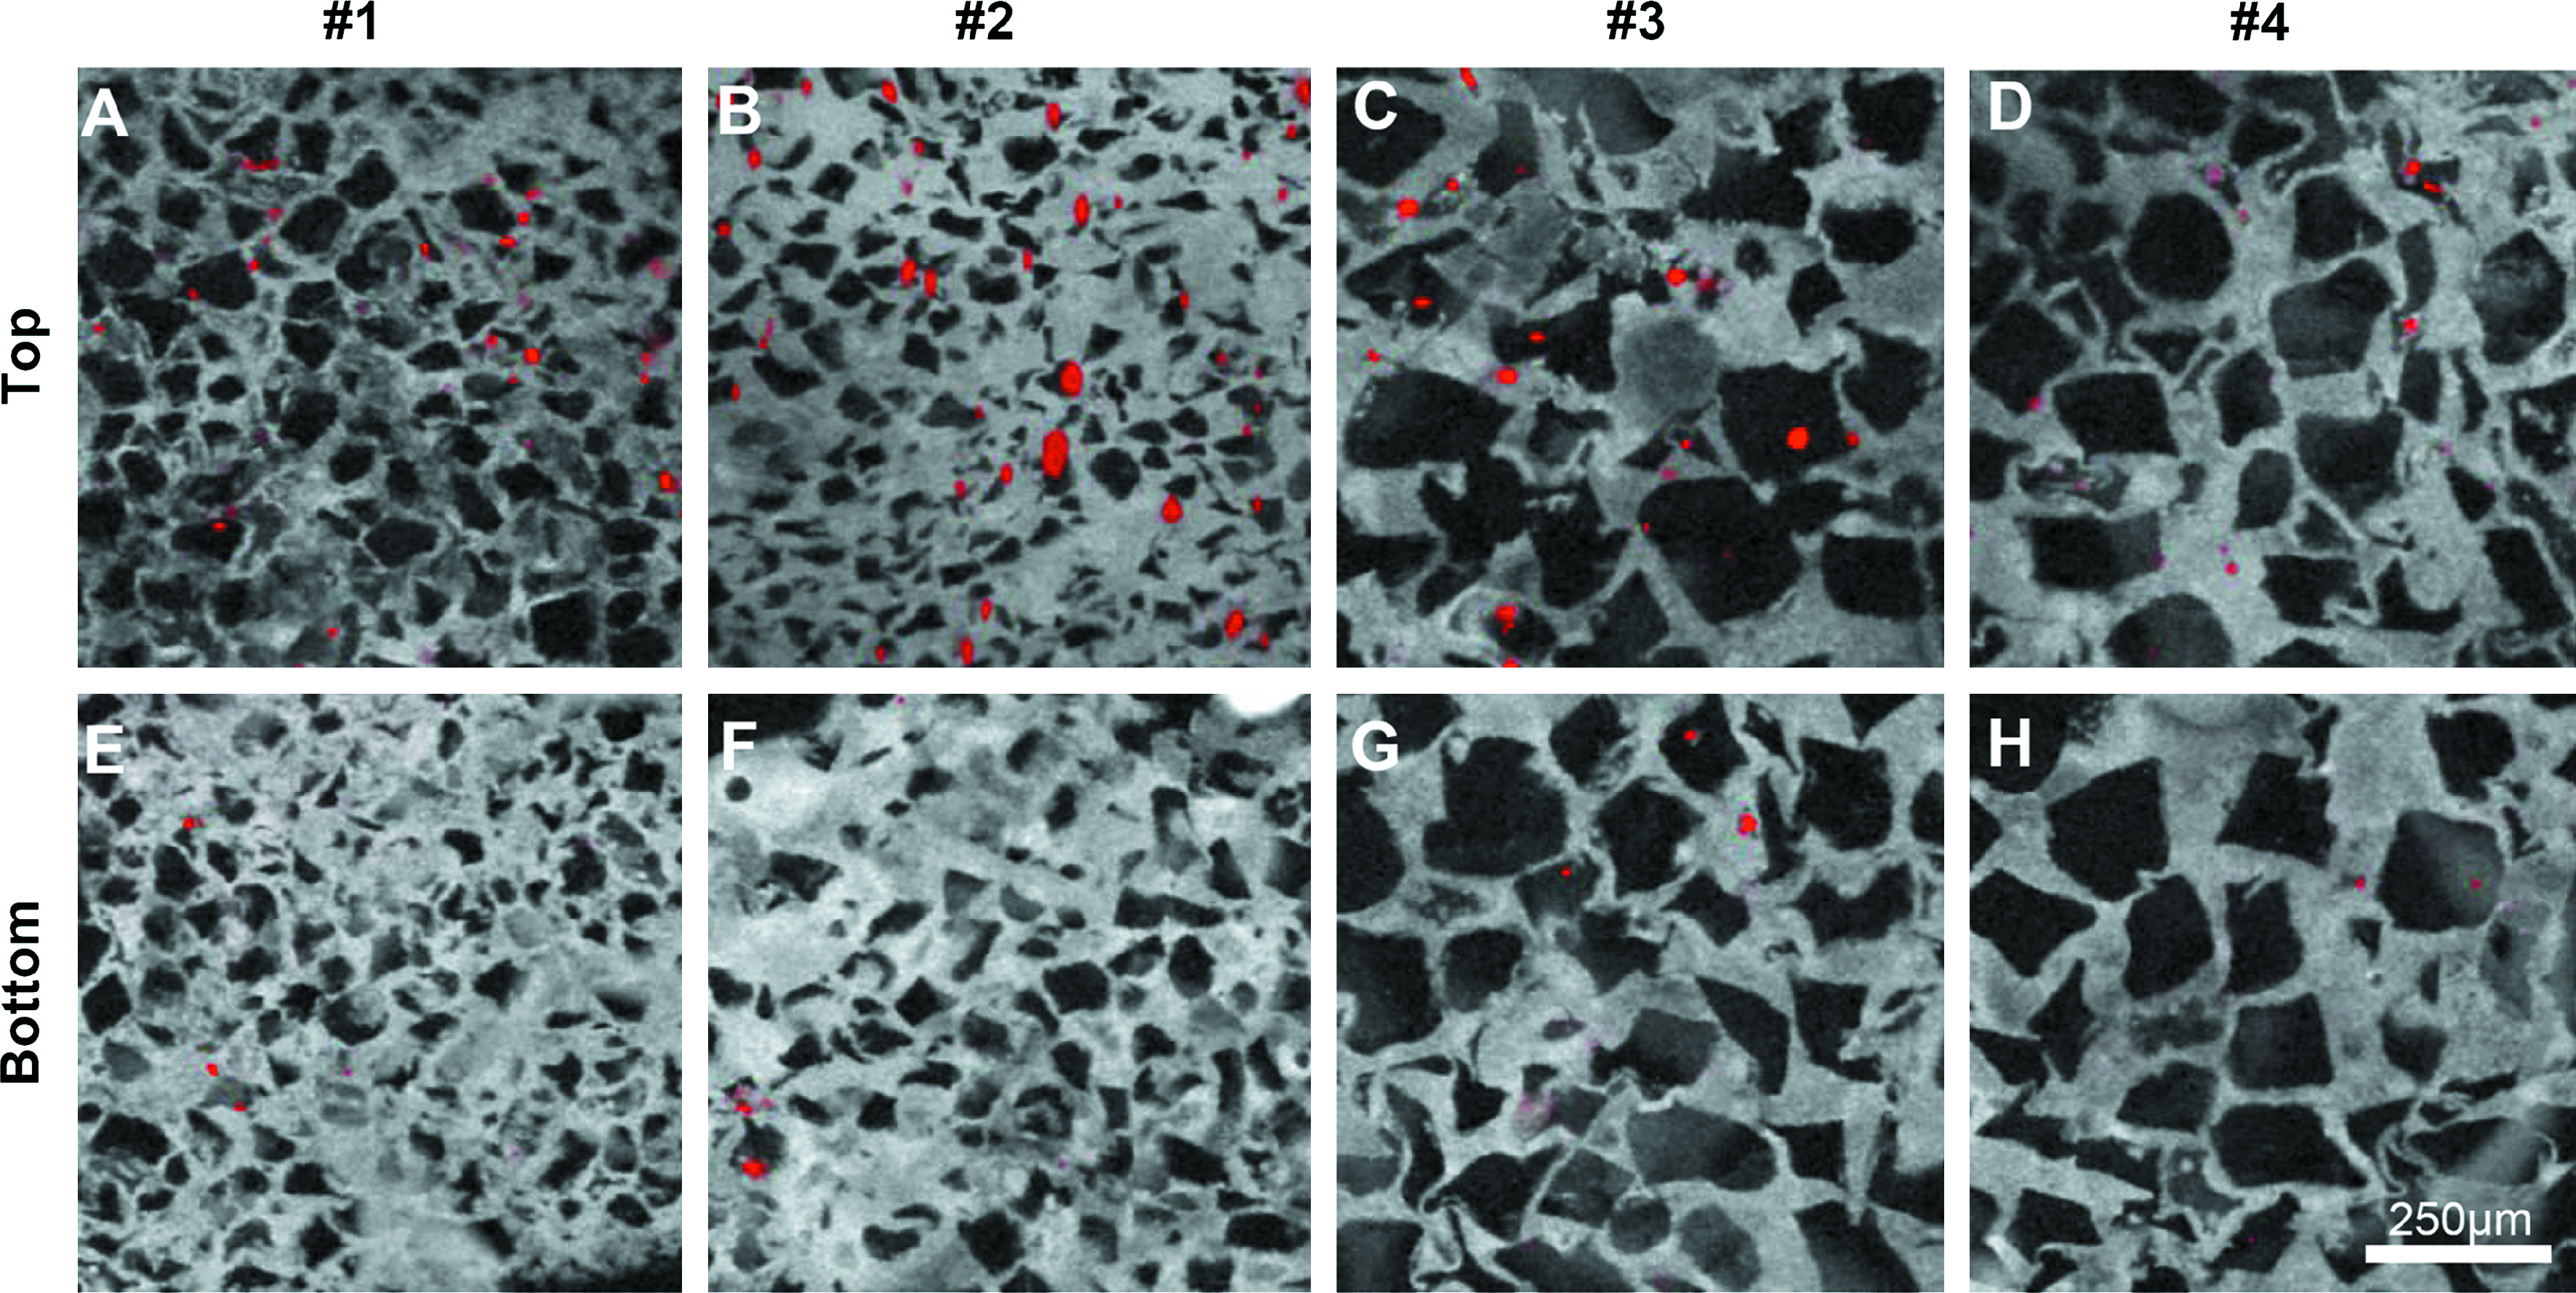
OCT/FM images of human mesenchymal stem cells stained a viability dye within 5-ethyl-5-(hydroxymethyl)-β,β-dimethyl-1,3-dioxane-2-ethanol-poly(ethylene glycol) hydrogels. Results show the en face view of the scaffolds and demonstrate viable cells spread across the constructs and within the pores. Viable cells are pseudo-colored red.

Average number and standard deviation of cells inside the OCT/FM image field of view. The difference in numbers between top and bottom sides is larger in scaffolds fabricated using formulations 1 and 2 than those fabricated using 3 and 4, indicating a possible relation between scaffold structure and cell migration. Color images available online at
To investigate the effect of architecture upon cell distribution, the ratio hMSCtop/hMSCbottom was calculated. The ratio emphasizes the difference between the number of cells at the top and at the bottom surfaces. The hypothesis is that if the scaffold is highly interconnected, as in 3 and 4, cells may easily migrate to the other side and thus produce a low hMSCtop/hMSCbottom ratio. Results found this ratio to be 13.5 ± 16.2 for 1, 10.2 ± 6.7 for 2, 3.4 ± 1.8 for 3, and 3.6 ± 2.8 for 4. The test of significance for pair (1, 2), (2, 3), and (3, 4) reported p = 0.77, 0.21, and 0.90, respectively. Therefore, cell migration behavior in scaffolds fabricated with the same porogen size but different porogen content might be similar. On the other hand, when comparing scaffolds of different porogen size but the same porogen content (groups 2 and 3), statistical analysis found no significant difference (p = 0.21), suggesting that these porogen sizes may not significantly alter cell migration. Future studies are needed to increase the sample size.
Discussion
This work utilized OCT to analyze the architecture of macroporous EH-PEG hydrogels. Algorithms were developed to automatically quantify essential structural parameters, namely, VP, PC, and PS. As shown in Figure 5 OCT images clearly defined the boundary between hydrogels and pores, indicating that the porogen-leaching method was successful in slowing the dissolution of sodium chloride into the aqueous gel solution before crosslinking. Moreover, this allowed the subsequent image processing to be capable of quantifying those key parameters of EH-PEG hydrogels. The macroporous hydrogels in fact allow many of the advantageous aspects of the OCT analysis to be realized. First, the high water content of the polymer phase of the macroporous hydrogels allows for easy discrimination of open pores and hydrogel polymer matrix. Second, the use of a water-soluble porogen with the water-soluble hydrogel polymer solution allows for the creation of isolated pores, as isolated porogens can still be dissolved through the hydrophilic polymer matrix. This is in contrast to the typical approach with a water-soluble porogen and a hydrophobic polymer scaffold, where isolated porogens would remain entrapped within the polymer scaffold. As shown in Figure 6A, for example, OCT can easily resolve these isolated pores, and the image-processing techniques described can quantify their overall effect upon macroporous scaffold architecture.
Specifically, the image-processing techniques allow to differentiate scaffolds made from different porogen sizes. As each single pore has more chance to appear in the isolated region as in 1 and 2 in Figure 6A, it was observed that the PS was not uniform even though the porogen was sorted using the same sieve. However, overall, the PS was ∼75%–80% of the nominal sieve size. A possible explanation is that the sorted porogen size did not robustly reflect the nominal sieve size. From a simulation considering all possible orientations of cubes with uniform probability, the 2D projection of cube tended to have the
PC analysis through the 3D labeling process provides a way to investigate available cell migration paths within the scaffold. In Figure 6A and Table 1, it is clearly shown that scaffolds of 3 and 4 possessed highly interconnected pore networks, whereas those of 1 and 2 had significantly more isolated pores. To be specific, this evidence provides the expected result that a larger porogen size was associated with higher PC in the resulting scaffold. Meanwhile, when comparing scaffolds fabricated with the same porogen size but different porogen contents, the interconnectivity was similar. These isolated pores contribute to the VP, but migrating cells would not have these pores available for infiltration. In this sense, using VP solely to evaluate scaffolds may be insufficient.
Finally, FM was used to observe the cell viability and distribution, and the co-registered OCT image revealed the scaffold structure. Figure 8 qualitatively shows the viable cells across the surface of the constructs. This suggests that viable cells can survive on the construct and that OCT combined with FM is capable of monitoring them in real-time. Figure 9 quantifies the number of live cells over the top and bottom surfaces, and in Table 1 the ratio of the number of cells at the top to that at the bottom was calculated to study the relation between scaffold structure and cell migration. The hypothesis is that cell migration from the top to the bottom would be limited if the PC of the scaffold is low. Therefore, scaffolds with higher interconnectivity would have a smaller ratio. The result shows that scaffolds fabricated with the same porogen contents but of different size (groups 2 and 3) had different ratios about four times. On the contrary, scaffolds fabricated with different porogen contents but of the same porogen size (groups 1 and 2 and groups 3 and 4) displayed comparable ratios. However, the test of significance reported no significant difference among these three comparisons. We therefore conclude that although PC can be altered by both porogen content and porogen size, interconnectivity does not solely determine cell migration into a scaffold. Another point is that given there was a consistent cell seeding density for all the gels (50,000 cells/gel), the total number of cells observed at top and bottom surfaces was less than that of the initial seeding density, which might indicate that cells were distributed not only on the surface but also inside the gel. Therefore, the total number of cells that were observed may then be related to the gel structure. Further studies are needed to understand the impact of interconnectivity on cell migration, which might require a technique that can quantitatively image 3D cell distribution. A recent study, 63 however, reports that cell density would alter the optical scattering of the collagen gel and OCT alone can reveal such change.
Long-term cell migration studies can be performed to better understand the viability, proliferation, and distribution of cell populations over time as well as space within the scaffolds. Certainly, relevant methods have also been established. 55 However, demonstrating a global view of viable cell populations within constructs and, therefore, elucidating cellular interactions within scaffolds are increasingly necessary. 63 Both OCT and FM have been used independently for tissue engineering applications.49,64 Recently, the emerging demonstrations of multi-modality systems that provide co-registered images of structural and functional properties of scaffolds have had significant impact upon the field.45,60 The combined systems will not only provide the basis for promising studies of structure–function relationships, but also serve as a cross-validation platform.
Conclusions
The physical properties of hydrogel scaffolds are important parameters for successful applications in tissue engineering. In this work, macroporous EH-PEG hydrogels were fabricated using a simple porogen-leaching method. OCT was used to acquire high-quality images in a high-speed, noninvasive manner. Subsequent image processing quantified VP, PC, PS, and the spread of live cells over the surface of the scaffold. PC analysis illustrated the interconnected pore network in the EH-PEG scaffold, and the OCT/FM co-registered images revealed hMSC viability and migration within the scaffold. Scaffolds made of different size porogens were generally discriminated in terms of VP, pore connectivity, PS, and the ratio of the number of cells between two sides of the scaffolds. Spanning the mass ratio in a larger interval in the formation of scaffolds will help understand the mass ratio effects on the parameters. Three-dimensional image acquisition and analysis for PC and PS may be a key tool for the refinement of scaffold fabrication processes. The development of multi-modality system will also promise for characterizing both structural and functional properties of the engineered tissue models and for cross validation.
Footnotes
Acknowledgments
The authors gratefully acknowledge the technical assistance from Dr. Shuai Yuan, Jeremiah Wierwille, Bobak Shirmohammadi, and Anik Durraory, from the University of Maryland, and Drs. James Jiang and Hongzhou Ma from Thorlabs, Inc. This work is supported in part by the Nano-Biotechnology Award of State of Maryland, the Minta Martin Foundation, the General Research Board (GRB) Award of the University of Maryland, the Prevent Cancer Foundation, the UMB-UMCP SEED Grant Programs, and the State of Maryland-Maryland Stem Cell Research Fund.
Disclosure Statement
No competing financial interests exist.