
Abstract
Mesenchymal stem cells (MSCs) offer a great promise for regenerative medicine. Present study compared the characterization of porcine MSCs (pMSCs) derived from bone marrow extract with adult ear and fetal skin-derived cells on morphology, cell growth, alkaline phosphatase activity, proliferation ability, expression of cluster of differentiation (CD) markers (CD29, 45, and 90), cell cycle, protein and mRNA levels of Oct-4, Sox-2, and Nanog, and lineage differentiation ability. Skin-derived cells exhibited alkaline phosphatase activity and differentiation ability like pMSCs. pMSCs possessed a longer doubling time than skin-derived cells, and there was no difference in the ratio of G0/G1 phase between pMSCs and skin-derived cells. Except for CD29 and 90, all cells were found negative for CD45. Protein and mRNA expression of Oct-4, Sox-2 and Nanog were observed with similar intensity in all cells. Taken together, pMSCs and skin-derived cells revealed similar characteristics, and suggested the possible supportive role of skin-derived cells with MSCs for the regeneration of damaged tissues in cell-based therapies.
Introduction
Early transcription factors such as Oct-4, Sox-2, and Nanog have been known to express at higher levels in pluripotent cells and are considered as markers of primitive stem cells. 8 However, a recent study on porcine umbilical cord (PUC) matrix cells showed the crossing over of the boundary of multipotent stem cells by forming colonies and expressing alkaline phosphatase (AP) along with all the three transcription factors at protein and mRNA levels. 9 Colony formation and expression of Oct-4 was also documented in murine and porcine fetal fibroblasts under changed cell culture conditions. 10 Further, both MSCs and skin-derived cells have shown their ability to form colonies depending on serum levels in the media. 4 These observations suggest that alteration in culture conditions of primary fibroblasts might influence changes in phenotypic characteristics, at least within a subpopulation of cells. Recent studies have also demonstrated that stem cells derived from fetal porcine skin have the ability to expand in culture and can give rise to cells of multiple lineages, including oocyte-like cells.11,12 Taken together, somatic cells of modified potency along with stem cells derived from fetal and adult tissues may offer new possibilities of alternative sources for cell-based therapies.
Preclinical studies carried out in porcine are highly relevant to human applications and continuously add the evidences on the safety and efficacy of the transplantation of MSCs. Several studies have shown that a specific microenvironment, known as a niche, plays a very important role in deciding the phenotype and differentiation decision of stem cells. 13 Recent results suggested that spontaneous fusion between the stem cells and differentiated cells and also the possibility of adult stem cells to commit to various lineages by the extra- or intracellular environment might stimulate the regeneration of stem cell niches. 14 Nevertheless, these observations collectively indicated the multifaceted cell to cell interactions in restoring stem cell niches and supported the role of somatic cells with adult stem cells in offering substantial practical advances in regenerative medicine.
To consider the possibility of using fetal or adult skin-derived cells as a source of substitute cells to support MSCs in cell-based therapies, the present study compared the characteristics of pMSCs derived from bone marrow extract with adult and fetal skin-derived cells on cell morphology, AP activity, cell proliferation ability, expression of CD markers, cell cycle status, expression of early transcription factors such as Oct-4, Sox-2, and Nanog at the protein and mRNA levels and mesenchymal lineage differentiation ability.
Materials and Methods
All chemicals were purchased from Sigma Chemical Company, and media were from Gibco Life Technologies, unless otherwise specified.
Cell and tissue extraction and culture
All experiments were authorized by the Animal Center for Biomedical Experimentation at Gyeongsang National University. pMSCs and porcine ear skin cells (pESCs) were isolated from bone marrow and ears of a 3-week-old female, respectively, as described previously,5,6 and porcine fetal skin cells (pFSCs) were isolated from a female fetus via hysterectomy of pregnant gilt on approximately day 30 of gestation. 15 All cells were cultured in advanced Dulbecco's modified Eagle's medium supplemented with 10% fetal calf serum (FCS) and 1% penicillin–streptomycin (10,000 IU and 10,000 μg/mL) at 38.5°C 6 in a humidified atmosphere of 5% CO2 in air. Cells reached confluency at 7–10 days after being cultured (passage 0). Once confluent, cells were dissociated using 0.1% (w/v) trypsin–ethylenediaminetetraacetic acid (EDTA) solution and made into pellets at 300 g for 5 min. Cells were then re-grown and passaged six times for further analysis.
Human fetal fibroblasts (hFF), MRC-5, were purchased from American Type Culture Collection (ATCC), and testis tissues of a 2-year-old male pig collected from a slaughterhouse were used as a reference and a positive control for the analysis of stem cell transcript factors, Oct-4, Sox-2, and Nanog, respectively.
AP activity
Cells grown on six-well tissue culture plates or 35-mm dishes for 2 weeks were stained with AP chromogen kit (BCIP/NBT; Abcam) to detect AP activity after being fixed with 4% formaldehyde solution. Cells displaying purple brown were considered as positive for AP reaction.
Proliferation assay
Cells from different culture passages, P3 and P6, were plated at 1000 cells per 24-well tissue culture plate (Nunc) in triplicate. Every 2 days for 14 days, cells from each 24-well were detached with 0.1% (w/v) trypsin-EDTA and counted each two times per 24-well plate with a hemocytometer. The culture medium was changed every 3 days.
Cell population doubling time was calculated using the formula DT = t (log 2)/(log Nt − log No), where t represents the culture time, and No and Nt are the cell numbers before and after seeding, respectively.
Immunocytochemical staining
Stem cell transcription factors such as Oct-3/4 and Nanog (raised as goat polyclonal immunoglobulin G [IgG]) and Sox-2 (raised as rabbit polyclonal IgG) were analyzed in all cell types. All antibodies were purchased from Santa Cruz Biotechnology (Santa Cruz). Approximately 90% confluent cells were harvested with 0.25% (w/v) trypsin-EDTA, fixed with 4% paraformaldehyde for 30 min, and washed three times with
Analysis of CD markers and cell cycle by flow cytometry
Cells were analyzed for CD markers using flow cytometry (Becton Dickinson FACS Calibur flow cytometer) by modified procedures of Vacanti et al. 3 and manufacturer's instructions. Cell surface antigens employed were unconjugated CD29 (Integrin B1; BD Bioscience), FITC-conjugated CD45 (Sigma), and CD90 (THY1; BD Bioscience). Cells at ∼90% confluence were stained with diluted unconjugated and conjugated monoclonal antibodies, and isotype matched controls at room temperature for 30 min. Unconjugated CD29 first monoclonal antibody-treated cells were stained with secondary antibody, anti mouse IgG-FITC (Sigma) for 30 min.
For analysis of the cell cycle, cells were fixed with 70% ethanol, washed twice in D-PBS, and stained with 10 μg/mL propidium iodide solution.
Analysis of CD markers and cell cycle using flow cytometry were performed six times with 10,000 cells per sample.
Analysis of stem cell transcription factors (Oct-4, Sox-2, and Nanog) by reverse transcription–polymerase chain reaction
Total RNAs were extracted from the cells or the tissues using RNeasy mini Kit (Qiagen) in accordance with the manufacturer's instruction. cDNA synthesis of the samples and negative control using distilled water was performed at 55°C using an Omniscript RT kit (Qiagen) with 10 μM Oligo-dT primer (Invitrogen), and 1 μg total RNA for 30 min. Detailed information on each specific gene used for PCR is described in Table 1. Reactions for PCR were conducted in 20 μL volume of Maxime PCR pre mix Kit (iNtRON BIO) supplemented with 2 μL cDNA, 2 μL of 10 μΜ specific primer pairs, and 16 μL distilled water. Glyceraldehyde-3-phosphate dehydrogenase (GAPDH) was amplified for every sample to confirm the presence of RNA as a housekeeping gene for internal standardization. The PCR amplification of all genes was performed by 35 cycles and the PCR products were evaluated by electrophoresis using 1% agarose gel with 0.1 μg/mL ethidium bromide. Images were analyzed using zoom browser EX5.7 software (Cannon). Gene expression levels for semiquantitative reverse transcription–polymerase chain reaction (RT-PCR) were normalized to GAPDH mRNA levels and presented as a fold induction with mean ± standard deviation. The number of reaction cycles was determined to achieve semiquantitative conditions with control DNA, GAPDH, for each primer set. Relative intensities of each specific band were calculated against a base of GAPDH intensity by Unok-8000 Gel Manger System Gel viewer 1.5 (Biotechnology).
hGAPDH, human glyceraldehyde-3-phosphate dehydrogenase.
Differentiation assay
When the cells cultured in 35-mm dishes reached to ∼80% confluence, their ability of differentiation into adipocytes and osteocytes was tested.
Adipogenic or osteogenic differentiation was induced using the culture medium supplemented with 10 μM insulin, 200 μM indomethacin, 500 μM isobutylmethylxanthine and 1 μM dexamethasone or 1 μM dexamethasone, 100 μM ascorbic acid and 10 mM B-glycerophosphate by modified procedures of Vacanti et al. 3 or Bosch et al., 4 respectively. The differentiation medium was changed every 3 days for 3 weeks.
Differentiated cells into adipocyte or osteocyte were fixed with 10% formalin or 70% ethanol, respectively, and were stained with 0.5% Oil red O solution or 40 mM Alizarin red solution (pH 4.1) for 1 h, respectively. The differentiated cells were washed with distilled water several times before observation and photography.
Statistical analysis
Differences among proportional data of three types of cells were analyzed using one-way analysis of variance by SPSS 12.0 (SPSS). Data were expressed as mean ± standard deviation. Mean values among groups were compared using Tukey's multiple comparisons test. Differences were considered to be significant at p < 0.05.
Results
Morphological characterization and AP activity
pMSCs, pESCs, and pFSCs possessed the characteristics of fibroblasts (Fig. 1A–C). All the three kinds of cells were positive for AP activity, but varied in expression levels. pFSCs revealed weaker expression than pMSCs and pESCs, as shown in macrographic pictures (Fig. 1A–C). Further, AP activity of colony-formed cells was stronger than noncolony formed cells in all cell types.

Expression of AP activity in pMSCs, pESCs, and pFSCs. Three kinds of cells were cultured in separate 35-mm dishes until ∼90% confluence. (
Cell proliferation and doubling time
To confirm the cell proliferation ability and doubling time, all the three cell types at 3 and 6 passages were compared, and the results are presented in Figure 2.
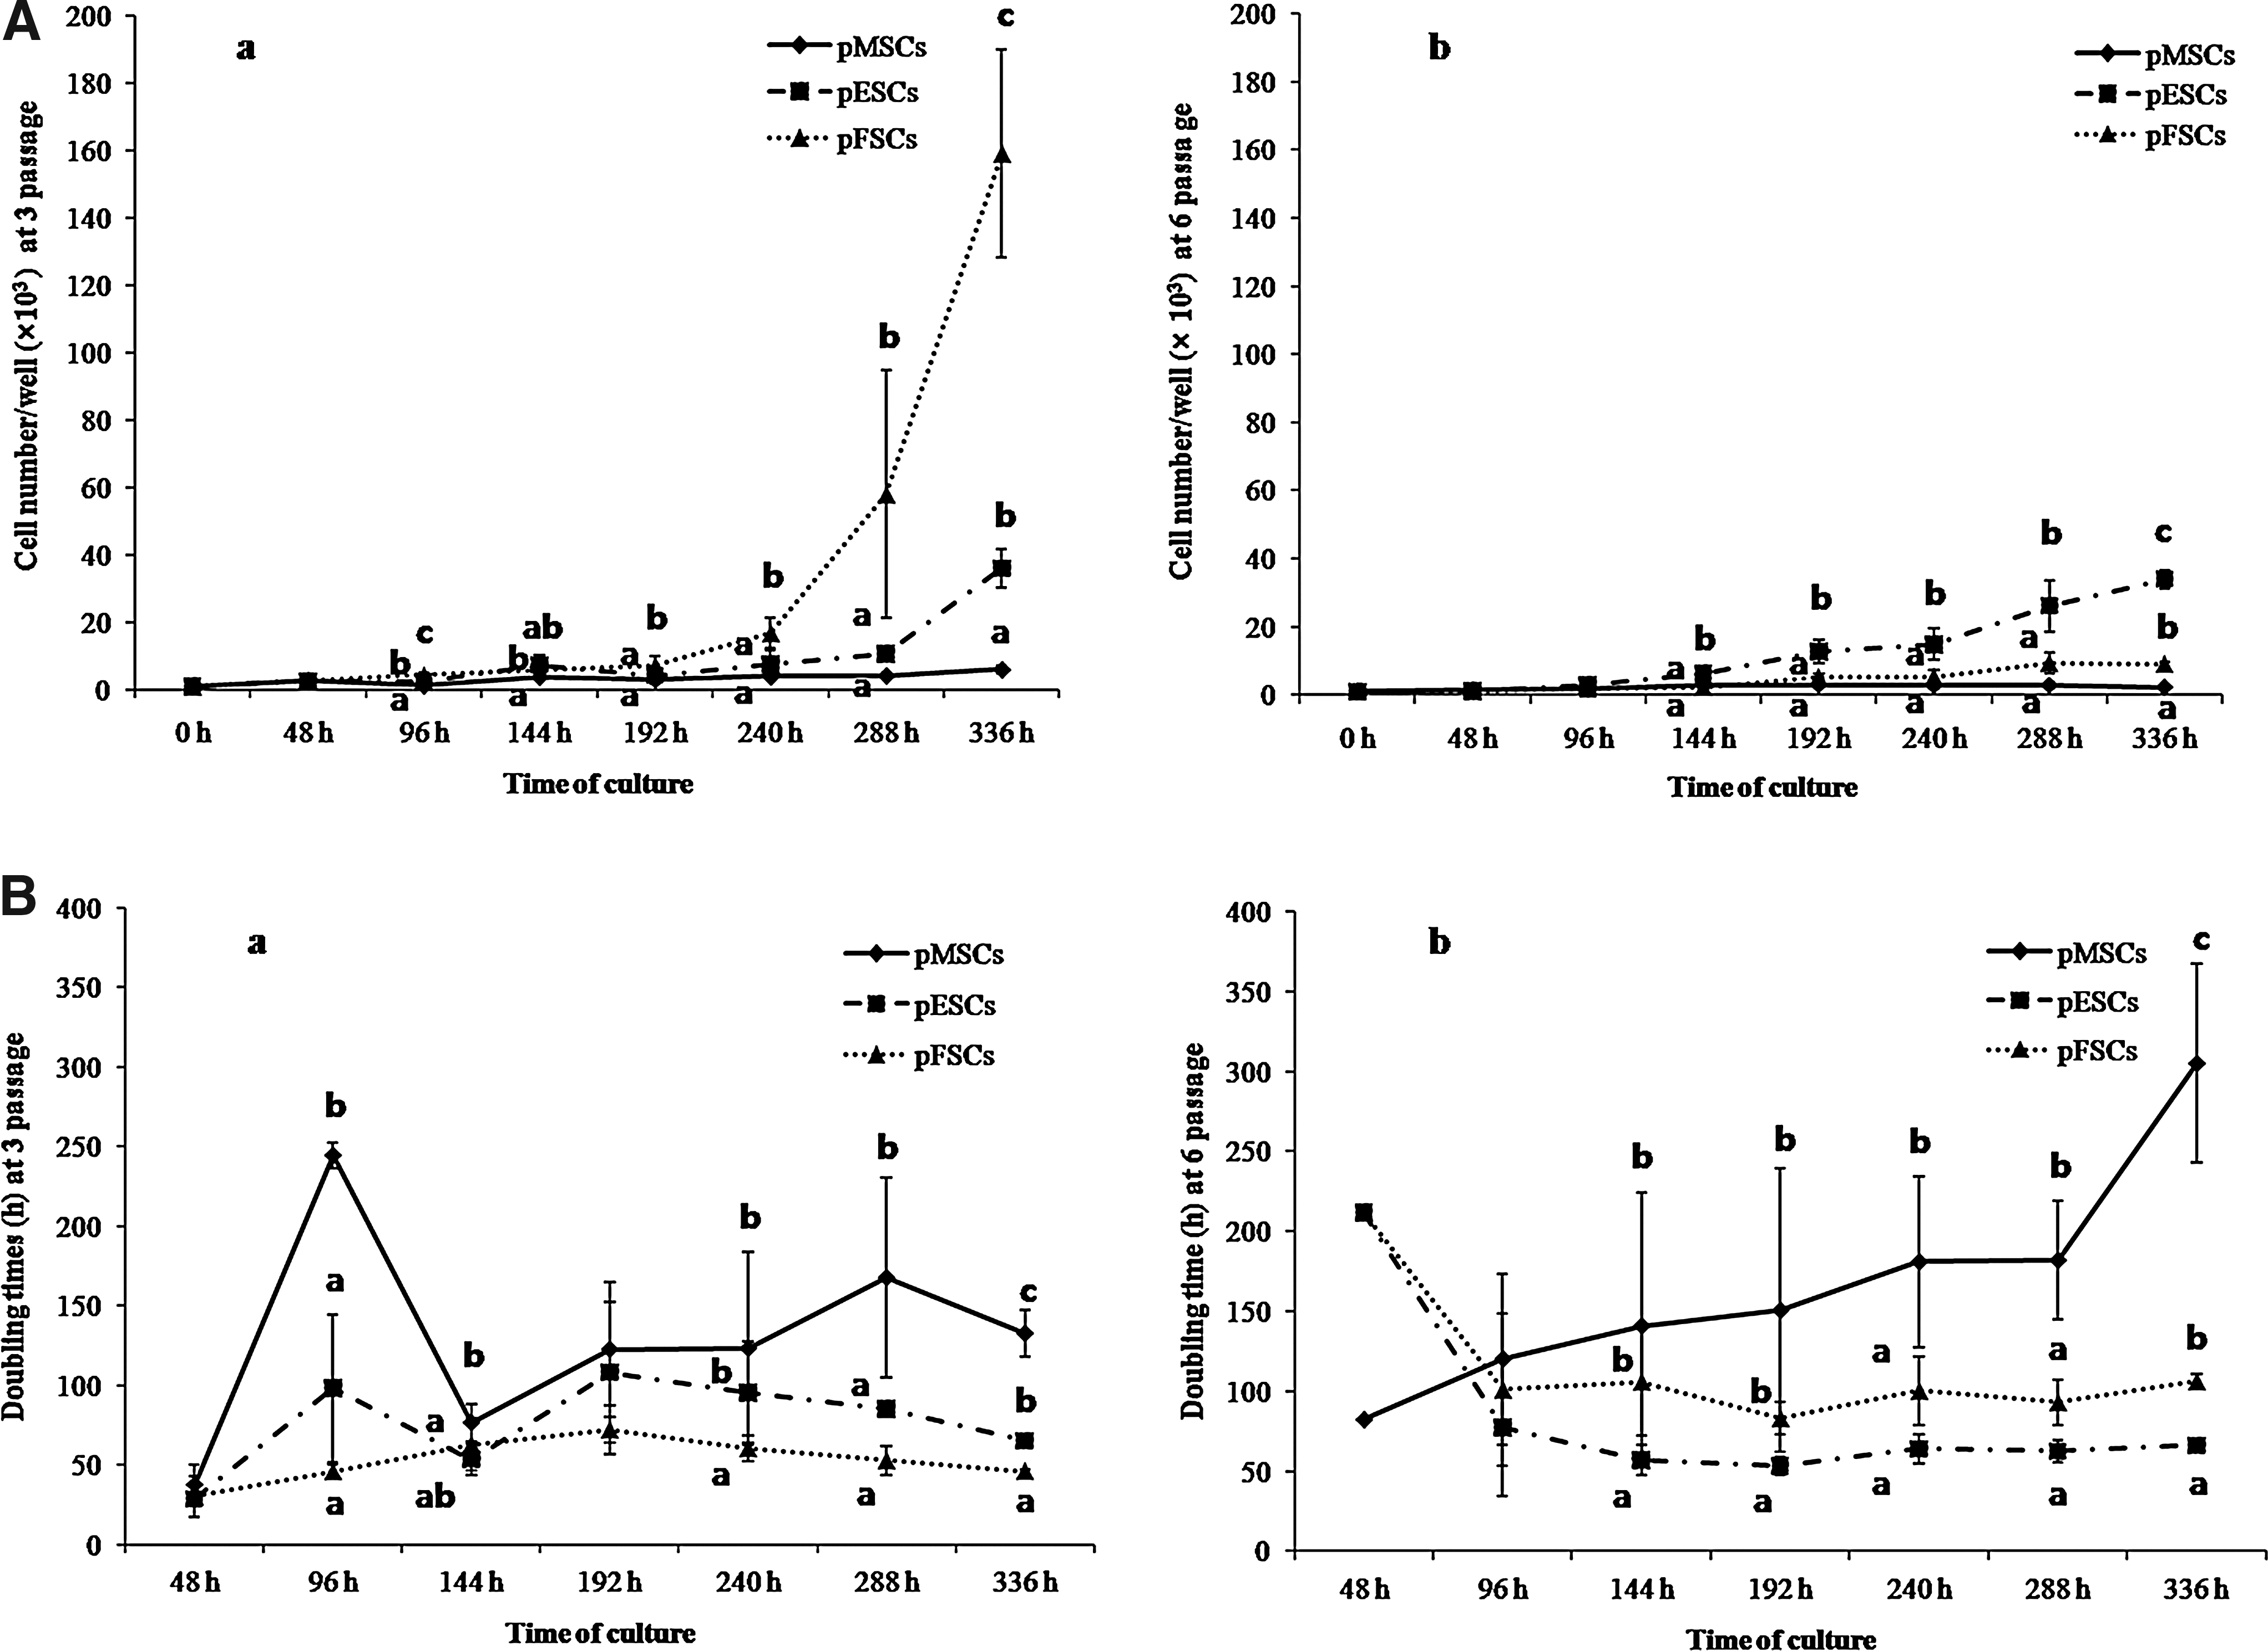
Cell number and cell doubling time in pMSCs, pESCs, and pFSCs at 3 and 6 passages at various time intervals. Three kinds of cells were seeded with 1000 cells per each 24-well dish. (
Absolute cell numbers among three cell types at passage 3 were exhibited different patterns depending on various time intervals (Fig. 2Aa). Cell numbers (×103) were significantly (p < 0.05) different among cell types at 96 h of culture (pMSCs, pESCs, and pFSCs; 1.2 ± 0.1, 2.0 ± 0.6, and 4.3 ± 0.7). A significant (p < 0.05) increase in cell number (×103) of pFSCs was observed when compared to pMSCs and pESCs from 192 to 336 h (7.2 ± 2.6 vs. 3.0 ± 1.4 and 4.2 ± 1.5 at 192 h; 16.8 ± 4.4 vs. 3.9 ± 3.0 and 7.5 ± 4.0 at 240 h; 58.0 ± 36.8 vs. 4.2 ± 0.8 and 10.5 ± 1.3 at 288 h; 159.2 ± 30.9 vs. 6.0 ± 1.2 and 36.0 ± 5.8 at 336 h). Interestingly, at 336 h pESCs had significantly (p < 0.05) higher cell number than pMSCs. At passage 6, the cell number (×103) in pESCs was significantly (p < 0.05) increased compared with pMSCs and pFSCs between 144 and 336 h (6.2 ± 1.7 vs. 2.7 ± 1.3 and 2.3 ± 1.5 at 144 h; 12.8 ± 3.4 vs. 3.0 ± 0.9 and5.2 ± 1.1 at 192 h; 14.8 ± 4.6 vs. 2.8 ± 1.0 and 5.3 ± 2.1 at 240 h; 26.2 ± 7.5 vs. 2.9 ± 1.0 and 9.3 ± 3.1 at 288 h; 34.0 ± 2.7 vs. 2.3 ± 0.5 and 9.0 ± 0.8 at 336 h) (Fig. 2Ab). Although direct comparison of cell numbers between 3 and 6 passages was not carried out, cell numbers in pFSCs at passage 6 decreased faster with a relatively lower reduction in pESCs.
In the case of cell doubling time at passage 3 (Fig. 2Ba), overall pMSCs possessed a relatively longer doubling time than pESCs and pFSCs, especially at 288 and 336 h (167.6 ± 62.6 vs. 85.3 ± 4.6 and 52.8 ± 9.2 at 288 h; 126.6 ± 14.1 vs. 66.2 ± 4.3 and 45.8 ± 1.8 at 336 h). Cell doubling time of pMSCs at passage 6 was also longer than that of pESCs and pFSCs, especially from 240 to 336 h (180.9 ± 53.6 vs. 63.9 ± 9.0 and 100.3 ± 21.5 at 240 h; 181.9 ± 37.1 vs. 62.4 ± 6.6 and 93.1 ± 14.2 at 288 h; 305.0 ± 62.0 vs. 66.1 ± 1.6 and 106.3 ± 4.4 at 336 h) (Fig. 2Bb). Further, eventhough a direct comparison of cell doubling time between 3 and 6 passage cells was not made, a tendency for the delay in doubling time was observed for all the cell types and particularly for pMSCs.
Analysis of CD markers
Expression of CD markers of pMSCs was compared with that of pESCs and pFSCs by flow cytometry (Fig. 3 and Table 2). pMSCs, pFSCs, and pESCs were negative for CD45, because its level of expression in all the cell types was either extremely low or could not be detected (2 ± 2.3, 0 ± 0, and 3 ± 4.6, respectively). However, CD29 (Fig. 3Ab, Bb, Cb) and CD90 (Fig. 3Ac, Bc, Cc) were found uniformly expressed in all cell types. Especially, the CD29 marker displayed significantly (p < 0.05) higher levels of expression in pMSCs than both pESCs and pFSCs (97 ± 0.2 vs. 95.3 ± 0.6 and 96 ± 0.4, respectively).
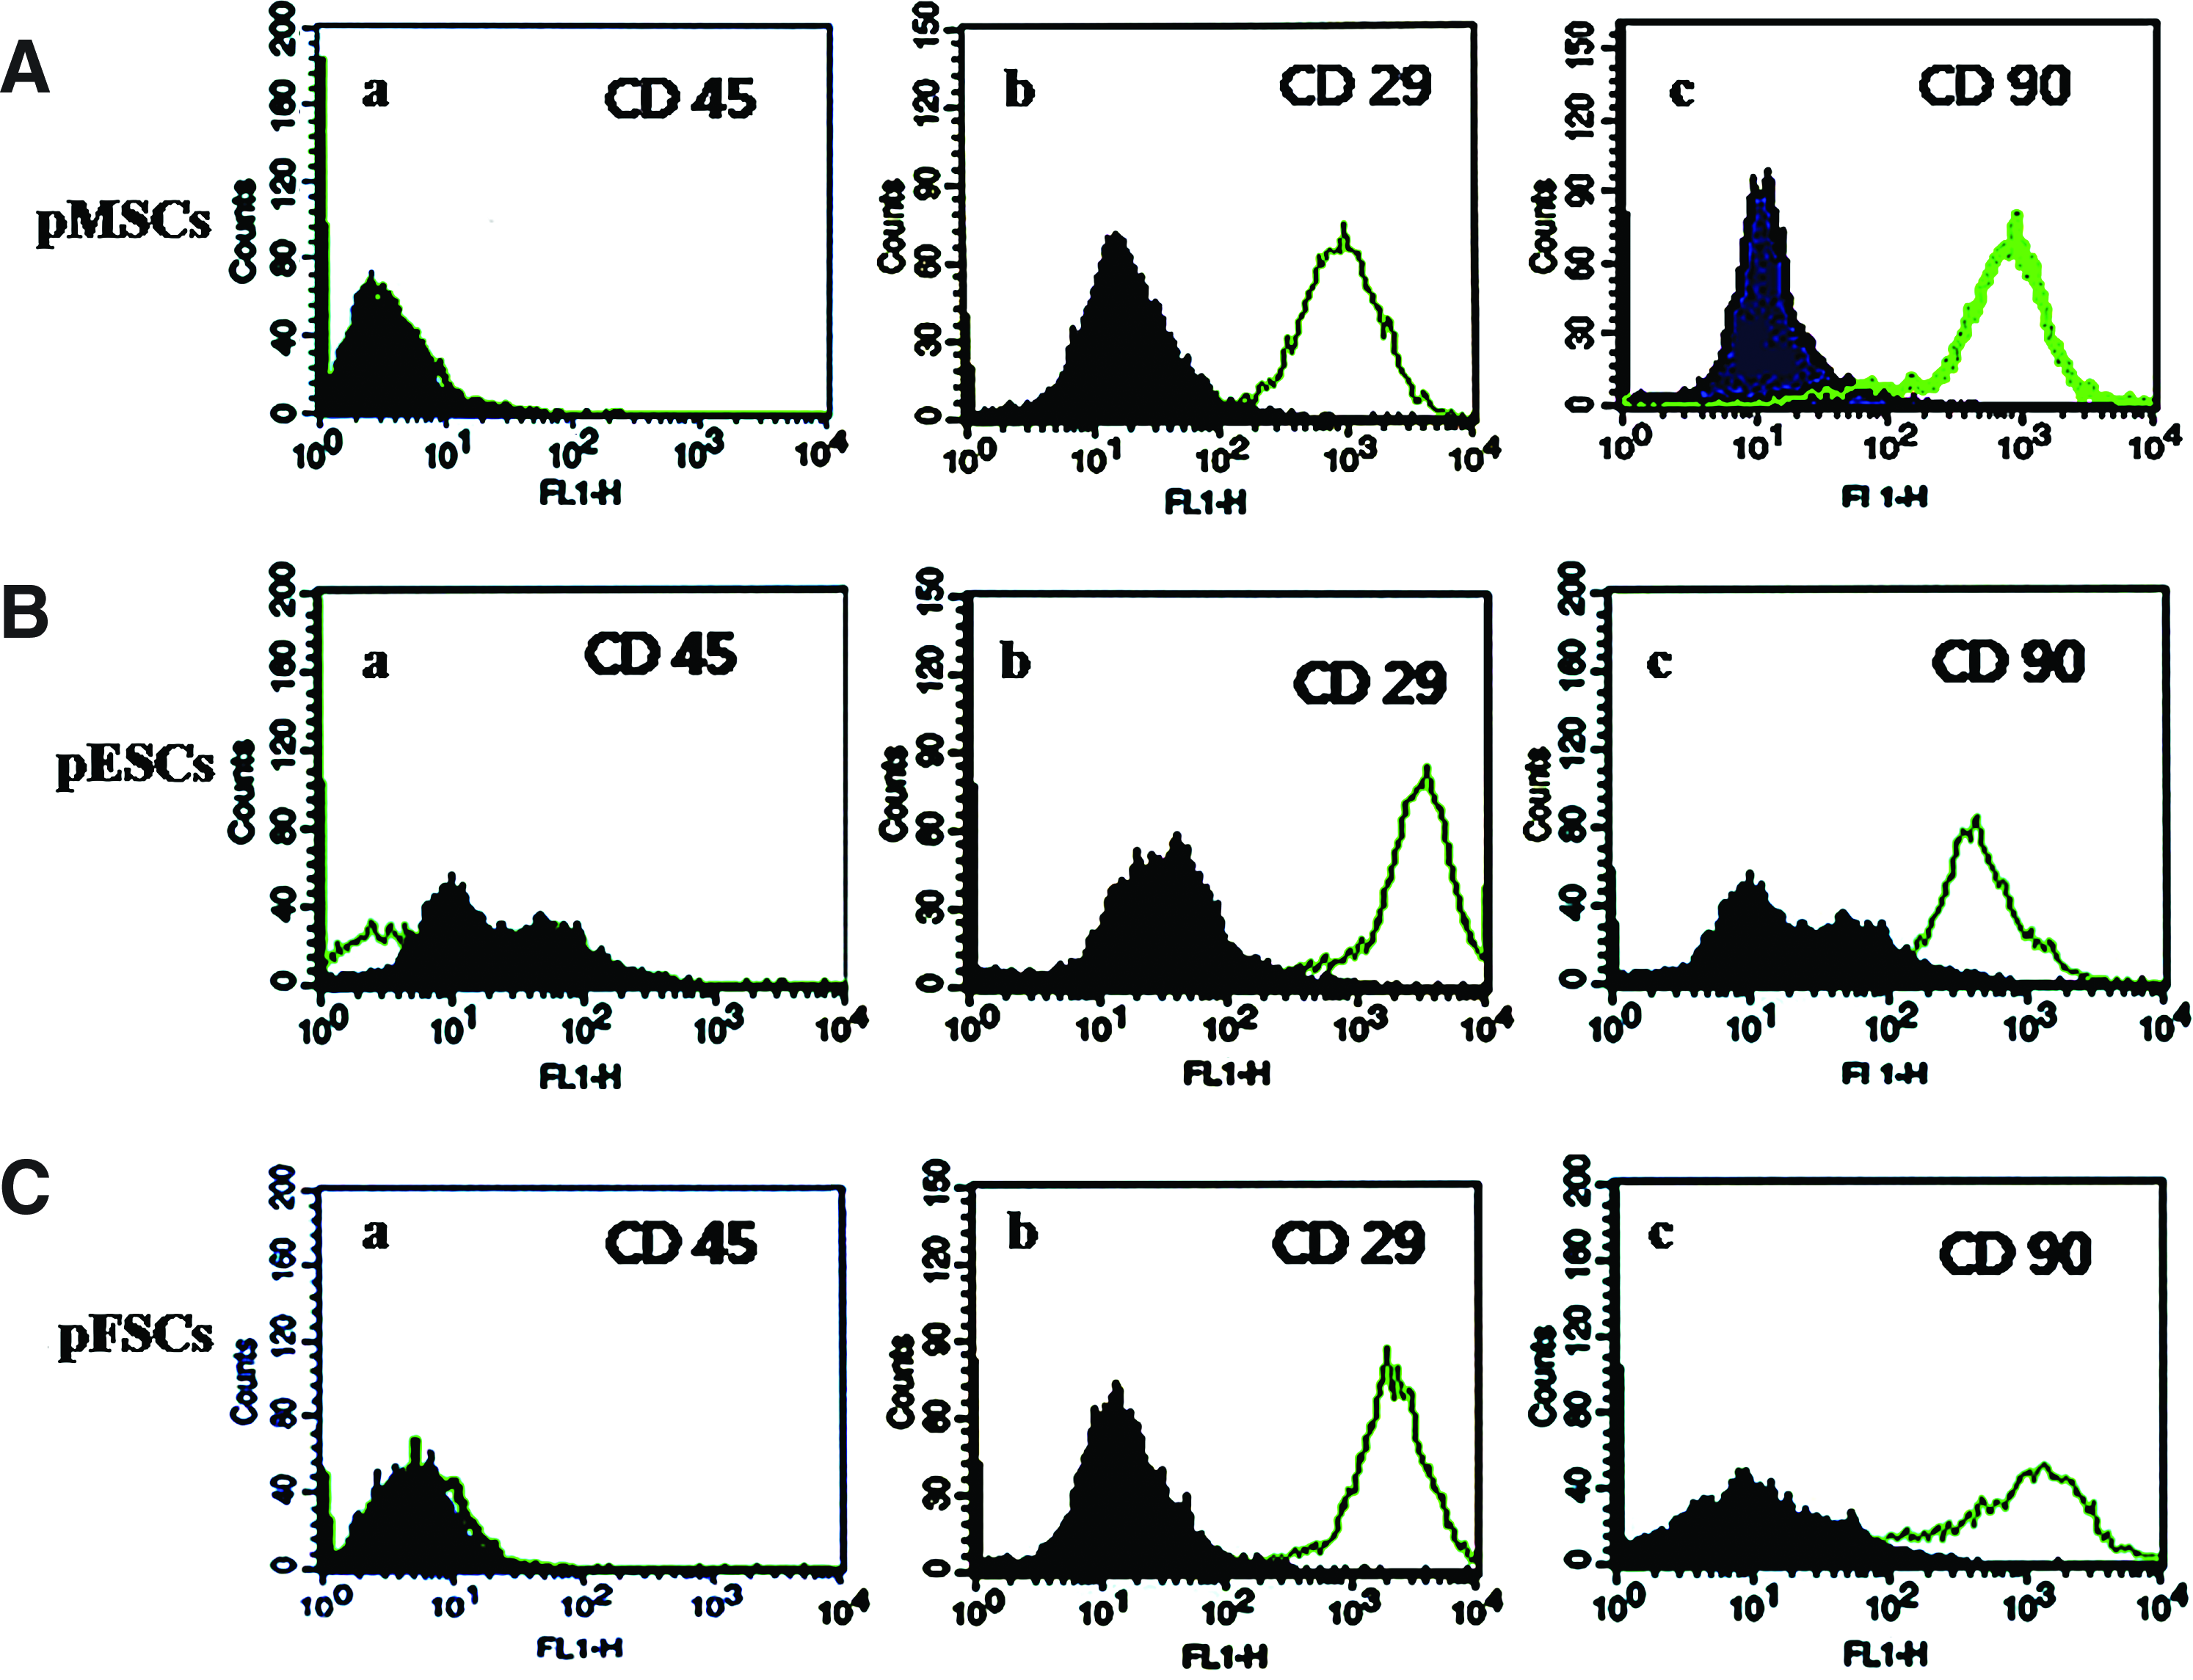
Expression of cluster of differentiation (CD) markers in pMSCs, pESCs, and pFSCs. Each sample was counted with 10,000 cells by a flow cytometer. Three kinds of cells were stained with each specific CD marker (open histograms) and isotype-matched controls (filled histograms). (
Six replicates. Different superscript letters (a and b) in the same column represent significant difference (p < 0.05). pMSCs, porcine mesenchymal stem cells; pESCs, porcine ear skin cells; pFSCs, porcine fetal skin cells; CD, cluster of differentiation.
Analysis of cell cycle
To compare the proliferation ability, pMSCs, pFSCs, and pESCs at confluent stage were subjected to cell cycle analysis by flow cytometry (Table 3). The population of cells at G0/G1 and G2/M phase of the cell cycle did not differ among pMSCs, pESCs, and pFSCs. In pMSCs, the percentage of cells at S phase of the cell cycle was significantly (p < 0.05) higher than that of pESCs and pFSCs (30.4 ± 5.3 vs. 19.1 ± 3.6, 21.3 ± 1.7, respectively), but exhibited no difference between pESCs and pFSCs. Further, ploidy analysis by flow cytometry showed the normal diploid in all cell types.
Six replicates. Different superscript letters (a and b) in the same column represent significant difference (p < 0.05).
Expression of stem cell transcription factors
Expression of Oct-3/4, Sox-2, and Nanog at protein and Oct-4, Sox-2, and Nanog at mRNA levels were evaluated by immunofluoresence and RT-PCR analysis, respectively, in pMSCs, pFSCs, and pESCs (Figs. 4 and 5). Proteins of Oct-3/4, Sox-2, and Nanog were strongly expressed in all the three kinds of cells (Fig. 4A–D). The expression regions in the three kinds of cells were at both the nucleus and cytoplasm. However, no difference in fluorescence strength of these proteins was observed in any of the cell types.
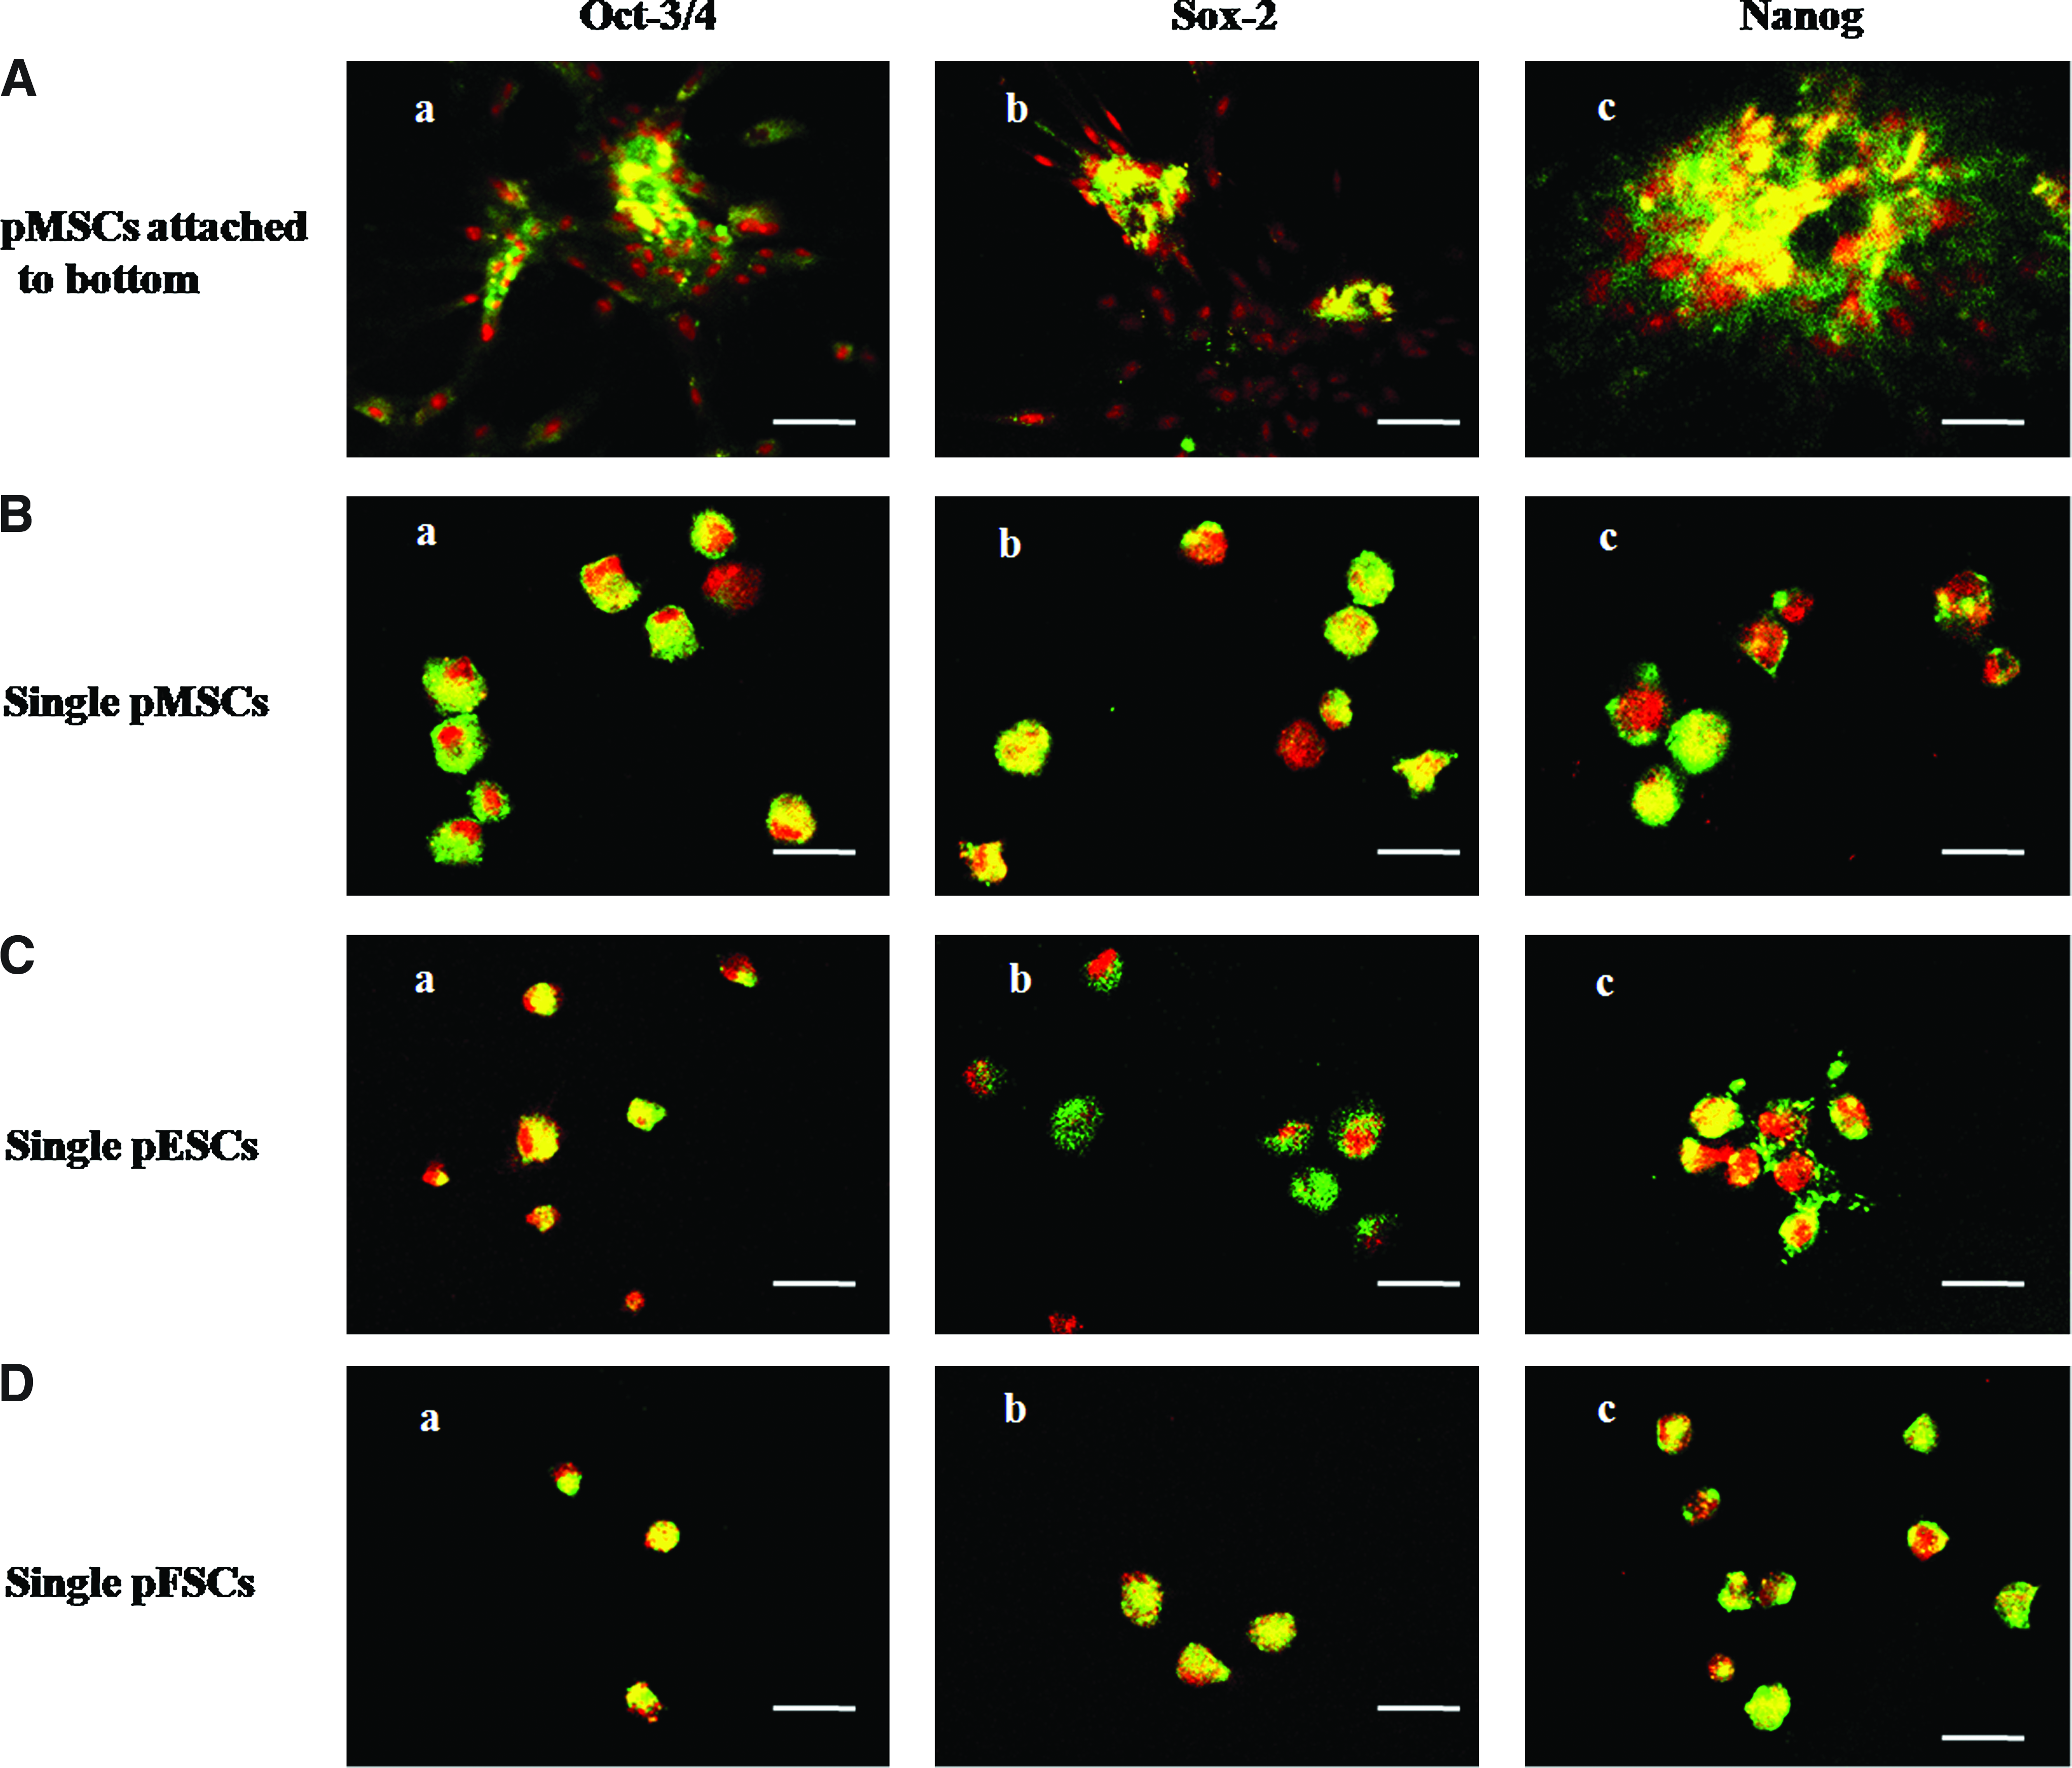
Immunocytochemical staining of transcription factors, Oct-4, Sox-2, and Nanog, in pMSCs, pESCs, and pFSCs. (
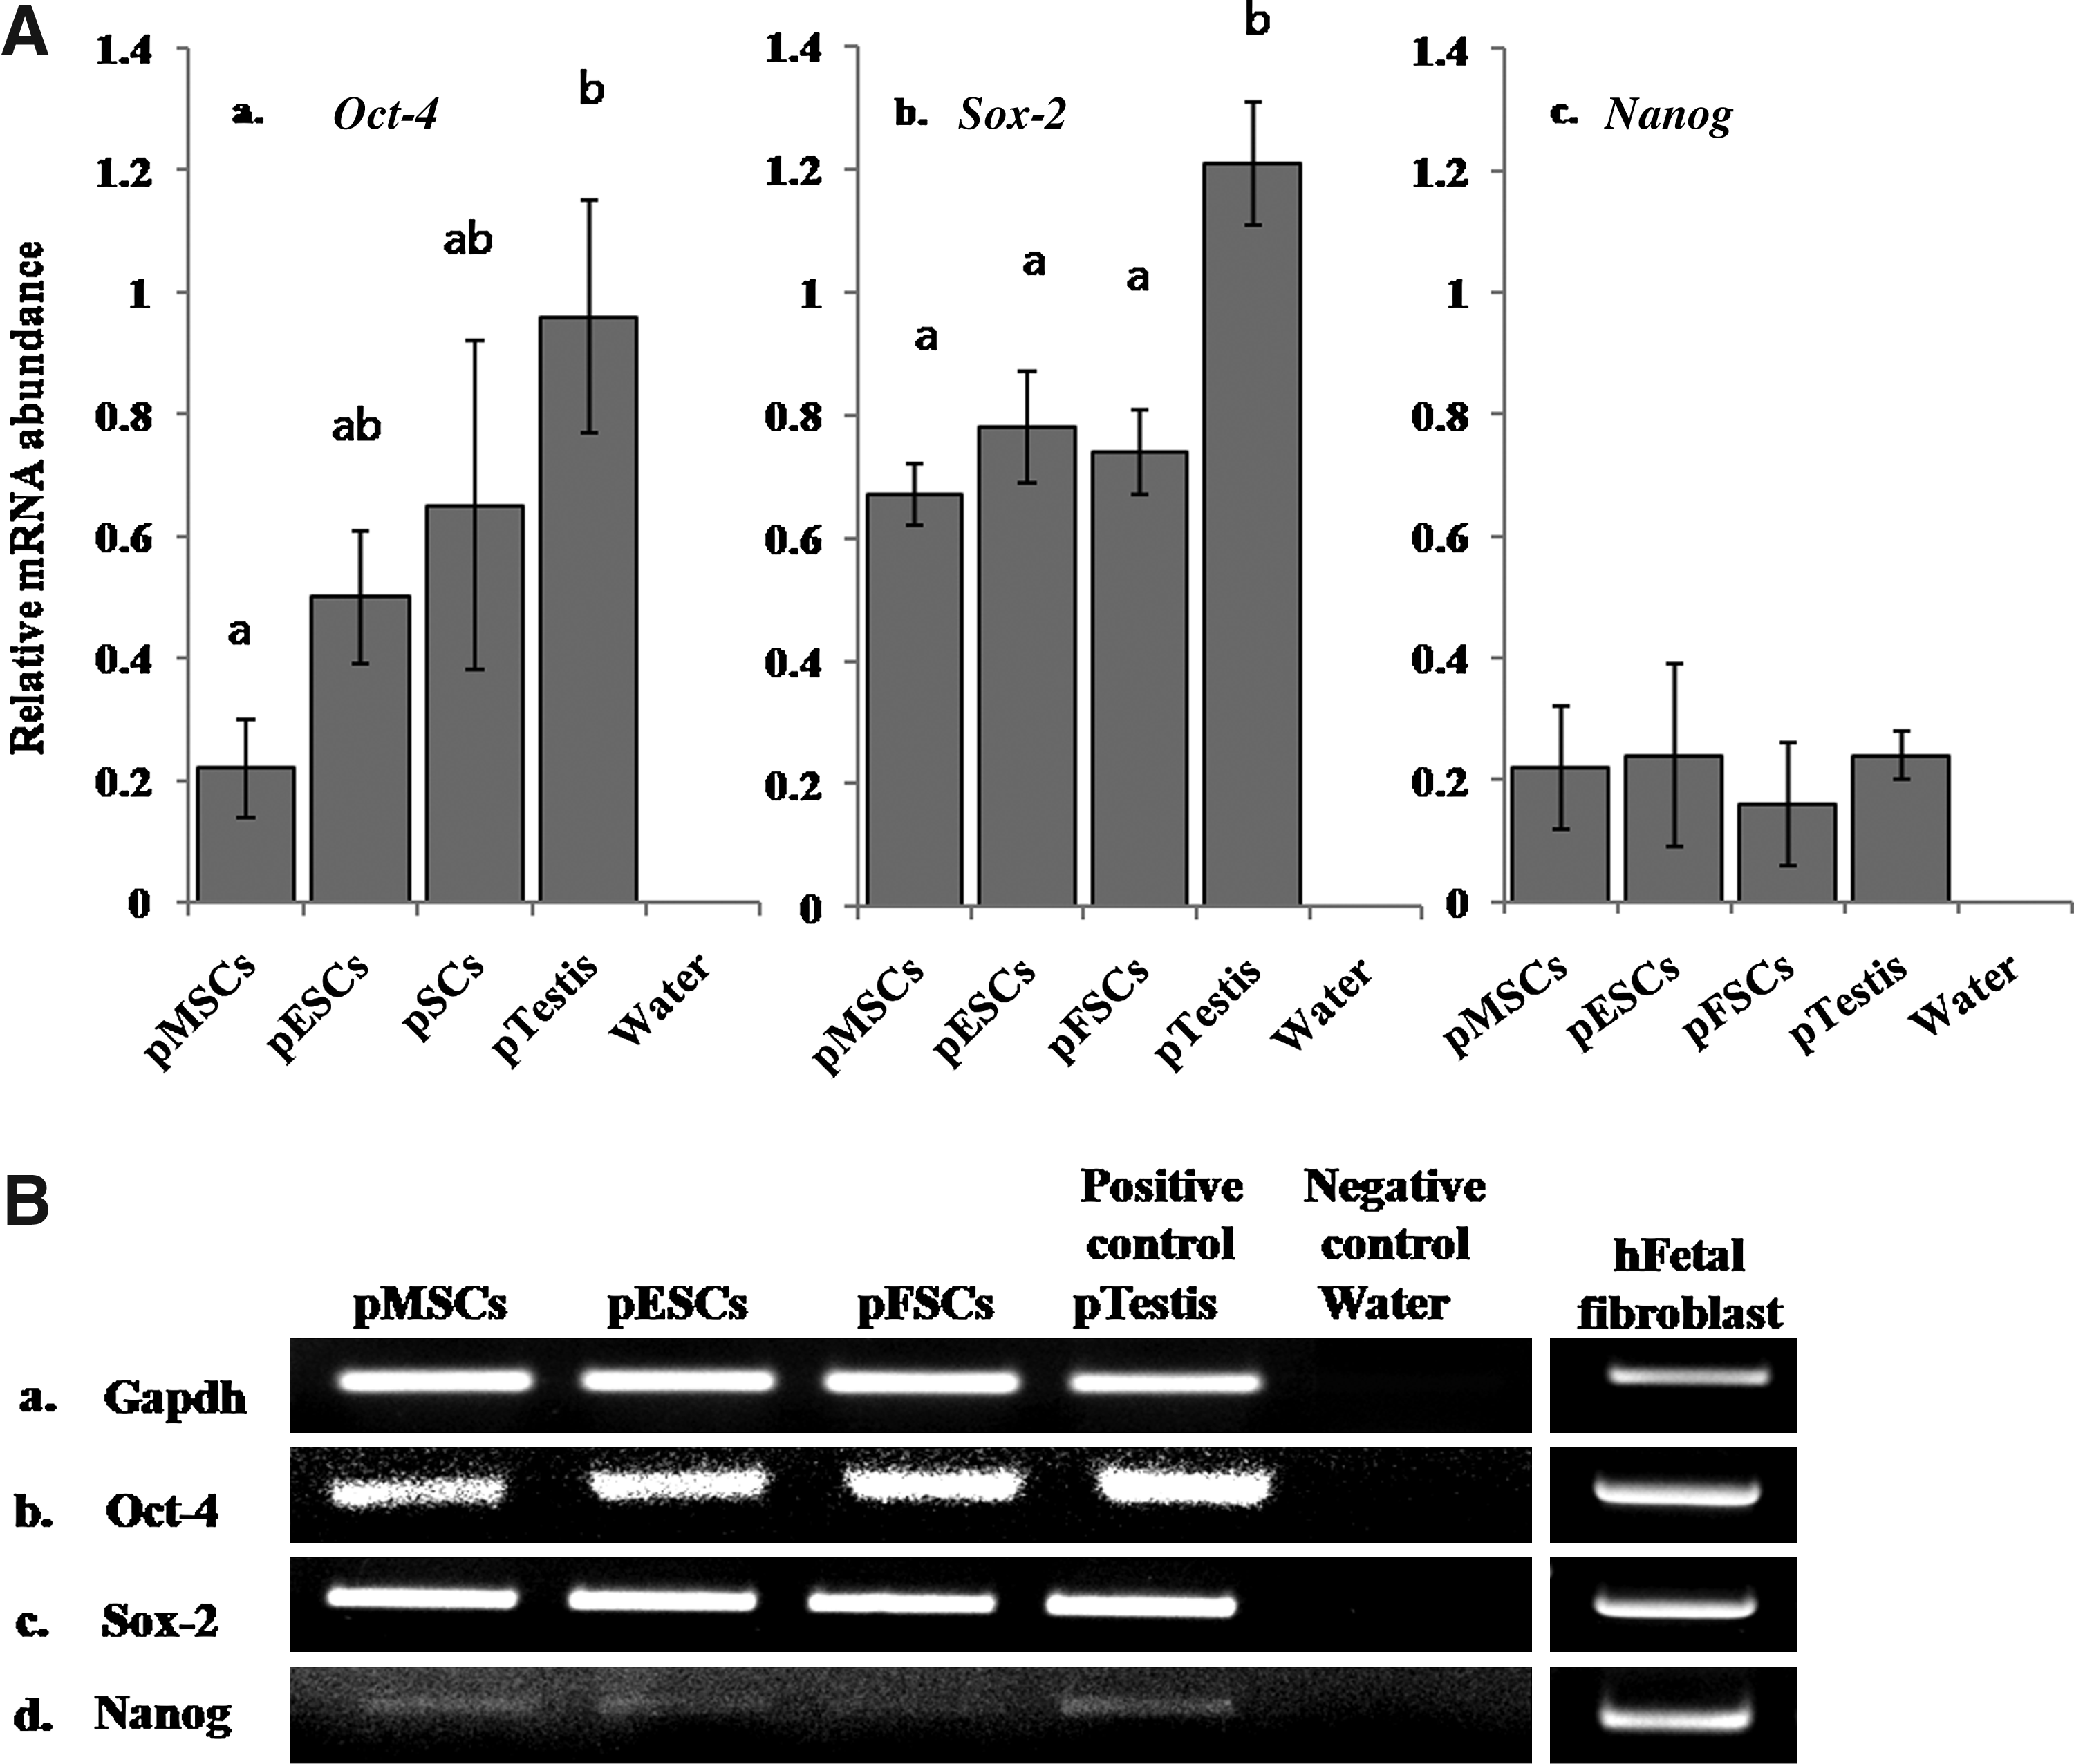
Expression of Oct-4, Sox-2, and Nanog in pMSCs, pESCs, and pFSCs and human fetal fibroblasts by reverse transcription–polymerase chain reaction. (
RT-PCR was employed to detect expression of Oct-4, Sox-2, and Nanog transcripts in all the cell types (Fig. 5). Porcine testis tissue was used as a positive control for the same species, and hFF was used as a reference control for porcine skin-derived cells. Distilled water was used as a negative control for this experiment. Oct-4 was expressed in all cell types (Fig. 5Aa, Bb), but the intensities of Oct-4 in pMSCs, pESCs, and pFSCs were different compared with porcine testis tissue. pMSCs displayed significantly (p < 0.05) lower expression of Oct-4 than porcine testis (Fig. 5Aa). Expression of Sox-2 was also observed in all cell types (Fig. 5Ab, Bc), but the intensities of expression varied. Interestingly, its expression in pMSCs, pESCs, and pFSCs was significantly (p < 0.05) low compared with porcine testis tissue (Fig. 5Ab). In the case of Nanog (Fig. 5Ac, Bd), although all cell types expressed it, the intensity was low when compared with Oct-4 and Sox-2; further, there were no significant (p < 0.05) differences among porcine cell types (Fig. 5Ac).
Differentiation into adipogenesis and osteogenesis
Adipogenic and osteogenic differentiation ability of three cell types was compared, and the representative pictures of cytochemical staining are shown in Figure 6. In the case of adipogenesis, lipid droplets were observed in all cell types (Fig. 6A). However, the potential of adipogenic differentiation among three cell types was different. pMSCs were appeared to possess greater ability for adipogenic differentiation than pESCs and pFSCs (Fig. 6Aa) as it was evidenced after and before Oil red O staining.

Differentiation of pMSCs, pESCs, and pFSCs into adipocyte and osteocyte. Cells attained ∼90% confluence on 35-mm dishes were induced for differentiation along 3 weeks. (
In the case of osteogenesis, distinct mineralized nodules were observed in all cell types as shown after and before Alizarin red staining (Fig. 6B). Particularly, pMSCs exhibited stronger expression of reddish color, indicating the calcium deposits on dish (Fig. 6Ba) in both macrographic and micrographic observations, than pESCs and pFSCs. However, the differences in the osteogenic differentiation ability between pESCs and pFSCs were hard to distinguish (Fig. 6Bb, Bc).
Discussion
In the present study, pMSCs, pESCs, and pFSCs were characterized by analyzing their morphology, AP activity, cell proliferation ability, expression of CD markers (CD29, 45, and 90), cell cycle, and protein and mRNA expression and lineage differentiation ability. The pMSCs and pESCs were derived from the same origin, but the origin of pFSCs was different.
The isolated pMSCs, pESCs, and pFSCs exhibited the morphological characteristics of fibroblasts along with their ability to proliferate in culture by forming colonies with no marked differences (Fig. 1A–C). However, the frequency and size of colonies in pESCs were relatively poor and limited than those of pMSCs and pFSCs. As observed in pMSCs, skin-derived cells were able to form colonies depending on the serum concentration in the culture medium.4,10 It was shown that a high concentration of serum (30% FCS) induced the colony formation in confluent cultured skin-derived cells, but these cells lost the capacity of colony formation when cultured in a standard culture medium supplemented with 10% FCS. 4 However, in this study, skin-derived cells did form colonies in a the culture medium supplemented with 10% FCS, but their number and size were relatively poor.
Generally, endogenous AP is known to be expressed in embryonic stem cells,9,10 primodial germ cells, 16 and osteoblasts, 6 and its expression has been often utilized to evaluate the identity and functionality of stem cells. 10 In porcine, AP expression has been documented as a marker for assessing the pluripotency of stem cells, including PUCs 9 and skin-derived cells, 10 under optimal culture conditions. Similar to the above results, all the types in the present study were observed to be AP positive, although the intensity of expression varied depending on the potency of the cells (macrograph of Fig. 1A–C).
Stem cell proliferation ability has been strongly related with telomere length and telomerase activity, which in turn is very important to repair and regenerate the tissues in postnatal life. Generally, the cell proliferation ability has been assessed by using doubling time or colony-forming unit fibroblast assay, 4 which are known to be affected by the culture environment. In spite of the fact, doubling time of pMSCs has not been compared directly among various cell sources collected either from the same or different individuals. This study attempted a direct comparison among three cell types that possessed a similar phenotype under the identical culture system. The results showed a longer doubling time for pMSCs than for pESCs and pFSCs. In addition, doubling time of pMSCs was shown to be prolonged at later passage than in early passage. Generally, MSCs have been known to possess a limited life span and gradually undergo reduction in proliferation with altered morphology. The causes for this limited expansion potential have been unclear and the characteristics of MSCs are presumed to be affected by insufficient culture system under in vitro conditions.
Stem cells isolated from different animals and sources have been known to express specific CD marker, but their expression levels have been varied according to the species and origin.3,17 Generally, MSCs extracted from porcine bone marrow expressed CD29, CD44, CD90, and CD105, but were negative for hematopoietic stem cell markers such as CD11b, CD14, CD45, and CD133.3–5 CD29 is known to express in several cells and tissues such as leukocytes, endothelia, epithelia, and oocytes, and is believed to be a critical factor for the rejection of pig to human xenografts. 18 CD29 antibody used in the present study was specific to porcine and hence expressed by all cell types. CD90 is known to express in cells from fetal liver, cord blood, bone marrow including both MSCs and hematopoietic stem cells, and proliferative colony-forming cells. 19 However, in this study, CD90 was expressed not only in pMSCs, but also in skin-derived cells. Although there were no reports available on expression of CD90 in porcine skin-derived cells, it is possible that the cells used in our study could have been isolated from dermis part of the skin, which is known to be the source of MSCs. 20
Cell cycle analysis showed the normal diploid in all cell types, but the ratio of G0/G1, S, and G2/M phases was different. The ratio of proliferation phases such as the sum of S and G2/M in the cell cycle was similar for the three kinds of cells, although the ratio of S phase was tended to be higher in pMSCs than in others. A previous study reported the similar proliferation capacity between MSCs and fibroblasts in porcine. 21 However, the ratios of G0/G1 21 (81.3% ± 1.2% and 78.1% ± 0.9% in MSCs and fetal fibroblasts, respectively) were higher than values observed in the present study (69.9 ± 4.6, 64.7 ± 3.3 and 68.1 ± 4.5 in pMSCs, pESCs, and pFSCs, respectively). The difference in observations could be related to donor age as the bone marrow used in the present study to derive MSCs was 3 weeks old, whereas the previous study used the cells isolated from that of 6 months old.
POU domain Oct-4 and high mobility group (HMG) domain Sox-2 transcription factors were critical for the normal development and maintenance of pluripotent stem cells. 8 The function of Nanog is similar to Oct-4 and Sox-2; further, overexpression of Nanog can support pluripotency competence under differentiation inducing culture conditions. 22 To understand the pluripotent capacity, the present study characterized the cells by examining expression of Oct-4, Sox-2, and Nanog at both protein and mRNA levels. Immunocytochemical analysis showed the nuclear localization of transcription factors in all cell types, but the intensity of expression could not be assessed. In addition, RT-PCR results have also shown expression of Oct-4, Sox-2, and Nanog genes in both pMSCs and skin-derived cells. However, contrary to our expectations, expression of Oct-4 transcript in pMSCs was significantly (p < 0.05) worse than porcine testis tissue, whereas skin-derived cells regardless of donor and origins had similar intensity of Oct-4 compared to porcine testis, thus supporting the results of earlier study.9,10 Although a multipotent cell population like MSCs is still present after embryonic and fetal development, they were supposedly not expected to express the early transcription factors. However, it has been reported that the cells isolated from PUC matrix express all the three transcription factors found in pluripotent stem cells both at the mRNA and protein level. 9 Further, there was a faint immunoreactivity of Nanog in fibroblasts, but it was absent for Oct-4. The conservation of these three transcription factors in our cells might be correlated to the early passages and the presence of a lot of presumptive stem-like cells in MSCs as well as skin-derived cells. It has been presumed that the fibroblasts might contain stem cells with gene expression levels similar to those of embryonic cells, but with a smaller stem cell to nonstem cell. 9
Studies have shown that pluripotency of stem cells has been strongly regulated by Oct-4 functioning together with Sox-2 and Nanog at the core of a transcription factor network, 23 but expression of Oct-4 and Nanog has been observed in stem cells derived from different adult tissues, thus promoting the in vitro multilineage differentiation potential. 24 Although positive reactivity of MSCs and somatic cells to primitive stem cells markers alone may not be sufficient to define their pluripotency, it certainly throws up new perspectives regarding the function and regulation of these marker transcripts in adult differentiated tissues. The above results also imply that the functional differences of these transcription factors do exist among somatic cells, and adult and embryonic stem cells, but now the molecular basis to explain these differences is lacking. 23
Further, it has been reported that pluripotent cell-specific genes, such as Oct-4 and Nanog, exhibit the presence of multiple pseudogenes, which are hypothesized to be involved in regulating cell-specific expression through epigenetic mechanisms. 25 However, unlike in the human and mouse genome, the presence and expression of these pseudogenes in pigs is not presently confirmed. Nevertheless, all cells in our study expressed Oct-4, Sox-2, and Nanog at the mRNA level along with immunolabeling protein, which suggests the presence of functional transcript factors. For further validification of results, assessment of high degree of homology between the coding sequence of transcripts and their pseudogenes could be considered. 25
pMSCs have been reported to possess a broad differentiation ability under a suitable induction medium not only into similar lineage cell types, including adipocyte, osteocyte, and chondrocyte, 4 but also into different lineage cell types, such as endothelial cells, hepatocytes, and neural cells. 26 Porcine skin-derived cells have also been shown to possess the differentiation ability similar to pMSCs.11,12 The findings of the present study supported the previous results,4,11 but the differentiation abilities were different among the three cell types on the basis of macrographic observation after specific cytochemical staining (Fig. 6). pMSCs were more effective in forming osteocytes and adipocytes than skin-derived cells. The cause of different differentiation capacity among the cell types presumed to be the maintenance of stem-like cell property, and especially in the case of skin-derived cells, they have been known to be more effective under suspension culture system than under plating culture system.11,12
To conclude, the present study compared pMSCs and skin-derived cells, pESCs, and pFSCs, concerning basic characteristics. All cells derived from different origins revealed common features such as a fibroblastic morphology, positive reaction to AP activity, expression of CD markers, ratio of cells at the proliferation phases, expression of transcription factors at the protein and mRNA levels, and the lineage differentiation ability. However, there were some differences observed among the three cell types as regard to doubling time, intensity of AP reaction, and the differentiation ability into adipocytes and osteocytes. These facts suggest that, depending on the abundance, frequency, and expansion potential, skin-derived cells may have the possible supportive role with MSCs for the regeneration of damaged tissues in clinical applications, because skin-derived cells possess a higher cell proliferation capacity than pMSCs.
Footnotes
Acknowledgments
This work was supported by a grant from Biogreen21 (20070301034041), Ministry of Agriculture and Forestry, Republic of Korea and Basic Science Research Program through the National Research Foundation of Korea (NRF) funded by the Ministry of Education, Science and Technology (2009-0064229).
Disclosure Statement
The authors declare no conflict of financial interests.