
Abstract
Current methodology for pluripotent human embryonic stem cells (hESCs) expansion relies on murine sarcoma basement membrane substrates (Matrigel™), which precludes the use of these cells in regenerative medicine. To realize the clinical efficacy of hESCs and their derivatives, expansion of these cells in a defined system that is free of animal components is required. This study reports the successful propagation of hESCs (HES-3 and H1) for >20 passages on tissue culture-treated polystyrene plates, coated from 5 μg/mL of human plasma-purified vitronectin (VN) solution. Cells maintain expression of pluripotent markers Tra1-60 and OCT-4 and are karyotypically normal after 20 passages of continuous culture. In vitro and in vivo differentiation of hESC by embryoid body formation and teratoma yielded cells from the ecto-, endo-, and mesoderm lineages. VN immobilized on tissue culture polystyrene was characterized using a combination of X-ray photoemission spectroscopy, atomic force microscopy, and quantification of the VN surface density with a Bradford protein assay. Ponceau S staining was used to measure VN adsorption and desorption kinetics. Tuning the VN surface density, via the concentration of depositing solution, revealed a threshold surface density of 250 ng/cm2, which is required for hESCs attachment, proliferation, and differentiation. Cell attachment and proliferation assays on VN surface densities above this threshold show the substrate properties to be equally viable.
Introduction
Other than cell-based feeder layers, Matrigel™, a gelatinous basement membrane extract secreted by mouse Engelbreth-Holm-Swarm tumor cells and distributed by Becton Dickinson Biosciences, is now routinely used as a substrate for maintaining the pluripotency of cultured hESCs. However, a medium conditioned by MEFs is usually used in combination with Matrigel to maintain pluripotent hESCs. Matrigel is known to contain a diverse number of factors that include laminin-111, entactin, heparan sulfate proteoglycans, and multiple growth factors. 4 Importantly, in a move toward a more defined culture platform, Hakala et al. recently compared the use of Matrigel with different feeder-free hESC culture substrates (biomaterials, human extracellular matrix [ECM] proteins, and human and animal sera matrices) and reported that Matrigel was superior in terms of the maximum passage number attained, as well as hESC morphology and pluripotent marker expression. 5 Despite these advances in feeder-free systems, the use of Matrigel is limited by batch to batch variability, complex protein mixtures, and the possibility of transferring nonhuman sialic acid, Neu5Gc, to the hESCs. 6 Neu5Gc is an immunogenic molecule and can limit the industrial scale up of this technology for clinical applications. These results have driven the exploration of several routes to develop a defined system suitable for culturing hESCs.
Defined model surfaces in the form of immobilized peptide arrays have been used as substrates for hESC adhesion and expansion.7,8 Although dilution is used to tune the peptide surface density, the latter is not quantified or otherwise measured. Rather, this study identifies a peptide surface density threshold that promotes cell adhesion. Further, the analysis of hESC pluripotency is limited to detecting endogenous alkaline phosphatase and OCT-4, without examining karyotypic stability or differentiation potential of the expanded hESCs. In a more recent study by Kolhar et al., immobilized cyclic arginine, glycine and asparigine (RGD) peptide sequences where shown to promote hESCs attachment and propagation. 9 Using this platform, hESCs were cultured for >10 passages, without adversely affecting karyotypic stability or differentiation potential. Although an estimate of peptide surface density (10–30 fmol/cm2) was obtained from fluorescence measurements and enzyme-linked immunosorbent assay, no direct quantification of the peptide surface density or other surface characterization was carried out.
Recent advances in synthetic surfaces by Melkoumian et al. describe synthetic peptide-acrylate surfaces that are able to sustain the propagation of pluripotent hESCs for >20 passages in a xeno-free environment. 10 This study detects surface-immobilized peptides by fluorescence, and while solution concentration is used to tune the conjugated peptide surface density, the surface density was not reported. Villa-Diaz et al. report the propagation of hESCs on a fully synthetic polymer (without immobilized biomolecules) with tunable surface wettability and Young's modulus. 11 This surface successfully propagates H9 hESCs in StemPro defined medium, but was not reported to be robust across cell lines and with the mTeSR-defined cell culture medium.
A further development of a defined hESC culture platform was described by Ludwig et al., who reported that a combination of human collagen IV, fibronectin, laminin, and vitronectin (VN) was able to support several passages of hESCs when combined with a xeno-free culture medium (TeSR1). 12 However, this platform relies on a combination of four human matrix protein substrates that adds significant cost to the scale-up of hESCs. Moreover, the cells were found to be karyotypically abnormal, 12 which may explain their adaptation to this platform. In other approaches, hESCs have been shown to propagate on separate matrices of fibronectin, laminin, laminin-511, and VN,13–16 highlighting that a defined, scalable substrate on which to propagate hESCs may be a realistic possibility. Also, induced pluripotent stem cells (iPSC) have recently been successfully propagated on plasma-purified VN, 17 suggesting that VN, of the various ECM proteins being investigated, may be universally applicable for the propagation of pluripotent stem cells.
VN is an abundant glycoprotein that is found in the ECM. It promotes cell adhesion and spreading, but inhibits the complement pathway that can compromise hESC viability. It is secreted as a single molecule (75 kDa), 18 which may be approximated by a cylinder with a radius of 30.3 ± 0.6 Å and a length of 110 Å. 19 Braam et al. reported the successful culture for at least 10 passages of hESCs on 5 μg/mL of recombinant VN and identified αVβ5 integrin as VN receptor. 15 Rowland et al. also reported similar results with 10 μg/mL of plasma-purified VN with iPSCs. 17 However, neither of these reports determined the threshold amount of VN necessary for the long-term propagation of hESCs. As such, there is a need to better characterize and quantify VN substrates for hESC expansion so as to provide a defined platform for the scale-up of stem cell cultures.20–22
In the present study, we adsorb VN onto tissue culture polystyrene (TCPS) and determined the effect of VN surface density on the adhesion, proliferation, and long-term maintenance of hESCs compared to Matrigel. 12 This simplified VN substrate also provided an opportunity to tune the relevant surface properties for promoting hESC adhesion and propagation. VN surface density was characterized by a combination of Ponceau S staining, Bradford assay, X-ray photoemission spectroscopy (XPS), and the physical roughness of the surface determined by atomic force microscopy (AFM). Although AFM has previously been used to study VN adsorption on smooth mica surfaces, 23 the present study examined VN adsorbed to TCPS, a surface demonstrated to be successful for the long-term propagation of hESCs.
We show that the bioresponse of cultured hESCs to adsorbed VN correlates with VN surface density. Further, we establish a minimum threshold of surface-bound VN that is required for the maintenance of hESC pluripotency.
Materials and Methods
Biological response
Coating of TCPS with VN or Matrigel
A 5 μg/mL working solution of VN was prepared by diluting stock VN solution (1 mg/mL) (Millipore) with 1 × phosphate-buffered saline (PBS). This solution (300 μL) was added into 60 mm center-well organ culture dishes (Becton Dickinson Biosciences), which are made from TCPS. After overnight incubation (15 h) at 4°C, the VN-coated plates, referred to as VN5, were rinsed once with PBS and then immediately used for cell seeding. For surface characterization, the coated TCPS substrates were rinsed twice in MilliQ water (Milli Q Gradient A10; Millipore) and dried under a nitrogen flow. Matrigel™ (Becton Dickinson Biosciences), used as a control cell culture surface, was diluted in cold knock-out (KO) Dulbecco's modified Eagle's medium (Invitrogen) at 1:30 ratio and allowed to coat TCPS overnight at 4°C before washing and cell seeding.
hESCs and matrices
HES-3 (46, XX) and H1 (46, XY) cells were obtained from ES Cell International and WiCell, respectively. They were cultured on Matrigel or VN-coated culture dishes with conditioned medium (CM) from ΔE-MEF 24 or in mTeSR®1 serum-free defined growth medium, with bovine serum albumin (BSA) as the only animal-derived component (Stem Cell Technologies) at 37°C/5% CO2. The CM used for culturing hESCs contained 85% KO-Dulbecco's modified Eagle's medium and 15% KO serum replacer, supplemented with 1 mM L-glutamine, 1% nonessential amino acids, 0.1 mM 2-mercaptoethanol, 25 U/mL penicillin, 25 μg/mL streptomycin (Gibco), and 10 ng/mL fibroblast growth factor-2 (Invitrogen). This medium was conditioned overnight on ΔE-MEF as described above, sterilized with a 0.22 mm filter, and again supplemented with 10 ng/mL fibroblast growth factor-2 before adding into hESCs culture. Cells were grown on the matrix for 7 days with a daily change of CM or mTeSR1. mTeSR1 medium was prepared according to the manufacturer's instructions.
hESC cultures were passaged following Choo et al. 3 Briefly, cells grown on Matrigel were treated with collagenase IV (200 U/mL) for 5 min at 37°C and differentiated cells removed by pipetting. Cells were then dissociated into small clumps by scraping and repeated pipetting. Harvested cells were split at 1:4 ratio and seeded into fresh Matrigel-coated tissue culture dishes. For cells grown on VN, mechanical passaging was employed. Colonies that appeared differentiated were removed by manual pipetting and the remaining cells scraped into small clumps. Cells were then seeded into freshly coated VN culture dishes at a 1:6 passage ratio.
Fluorescence-activated cell sorting analysis
Flow cytometry was performed with the cell surface marker Tra1-60 and transcription factor OCT-4 with an appropriate isotype control for hESCs grown on the various platforms. Cells were first trypsinized with 0.25% trypsin/ethylenediaminetetraacetic acid to a single cell suspension and then fixed and permeabilized with a Fix and Perm kit (Caltag Laboratories, Invitrogen), used according to the manufacturer's instructions. During the 15 min permeabilization step, OCT-4 (1:20; Santa Cruz) or Tra1-60 (1:50; Chemicon) mouse monoclonal antibodies were incubated together with the kit's Reagent B. Cells were then washed with 1% BSA/PBS followed by 15 min incubation in the dark with fluorescein isothiocyanate-conjugated goat anti-mouse antibody at 1:500 dilution (Dako). Finally, cells were washed and resuspended with 1% BSA in PBS for analysis on a fluorescence-activated cell sorting (FACS) Calibur (Becton-Dickinson). Results were analyzed with FlowJo software, with gating selected at the point of intersection between the marker and isotype control curves. 25
Adhesion assay
Flat-bottom 96-well TCPS plates (Thermo Fisher Scientific) were coated with VN solutions at concentrations of 0, 2.5, 5, 10, 15, and 20 μg/mL, as described above, yielding VN coated TCPS surfaces that are referred to as VN0, VN2.5, VN5, VN10, and VN20, respectively, (in triplicates). The wells were then blocked with 2% BSA (1 h, 20°C) and a single cell suspension of HES-3 cells (3 × 10⁵ per well), dissociated with TrypLE™ (Invitrogen), was seeded into the wells. The cells were incubated for 45 min at 37°C/5% CO2. TCPS substrates coated from the same VN solution and similarly blocked were used as blanks. After 45 min, the wells were washed three times with Iscove's modified Dulbecco's medium (Invitrogen), supplemented with 0.35% BSA, and then rinsed once with PBS to remove nonadherent cells. Cells on TCPS were fixed with 100% ethanol for 5 min and stained with 0.4% crystal violet in methanol for another 5 min at room temperature. Cells were then washed with deionized water three times, followed by the addition of 40 μL of 1% sodium dodecyl sulfate to solubilize the dye. The plates were left on an orbital shaker until a uniform color in the well was observed. Cell adhesion was determined by measuring the optical density at 570 nm with results normalized to Matrigel (100%).
Cell growth
A solution containing 3 × 10⁵ cells was used to seed the TCPS surface of organ culture dishes, coated with different concentrations of VN (VN0, VN2.5, VN5, and VN10), in triplicates. Cells were counted on days 1 and 7. Briefly, cultures were washed with 1× PBS and cells dissociated with 0.25% trypsin/ethylenediaminetetraacetic acid (Invitrogen). The total cell number was determined using a nucleocounter NC-100 (ChemoMetec).
In vitro differentiation assay (embryoid body formation) and reverse transcribed-polymerase chain reaction analysis
To determine whether HES-3 cells cultured on VN with mTeSR1 media retain their ability to differentiate into the three germ layers, confluent HES-3 cells grown on VN were removed using a cell scraper to form random-sized embryoid bodies (EBs). These were grown in suspension for 7 days and replated on 0.1% gelatinized plates for 14 days with a media change every 2 days. Total ribonucleic acid (RNA) was extracted from EBs after 21 days culture using an RNA extraction kit (Qiagen) in accordance with the manufacturer's instructions. Purity and concentration of RNA was quantified using an ND-1000 Spectrophotometer (Nanodrop Technologies). The RNA was reverse transcribed with polymerase chain reaction (RT-PCR) using oligo dT primers and superscript II reverse transcriptase (Promega) into complementary DNA. PCR (Biorad) was carried out with primers specific to the three germ layers. The endodermal lineage was represented by alpha-feto protein (AFP), the mesodermal lineage by Msh homeobox 1, heart- and neural crest derivatives-expressed protein 1 (MSX1), and the ectoderm lineage by neurofilament heavy chain (NFH). OCT-4 (undifferentiated marker) and GAPDH (house keeping gene) were used as controls (Table 1). In parallel, RNA was harvested from undifferentiated HES-3 cells for comparison to differentiated cells. The amplified products were observed with ethidium bromide-stained 1% agarose gels.
In vivo differentiation assay (teratoma analysis)
To confirm the pluripotentiality of hESCs cultured on the various substrates, an intramuscular injection of cells was given to SCID mice and the formation of tumors determined 10 weeks post injection. Briefly, HES-3 cells cultured on VN for 18 passages with either CM or mTeSR1 media were harvested by trypsin, and an intramuscular injection (hamstring muscle) of 5 × 10⁶ cells in 50 μL of sterile PBS was delivered to 4-week-old female SCID mice with a sterile 22G needle. After 10 weeks, mice were sacrificed and the tumors dissected, fixed in 10% formalin, embedded in paraffin, and then sectioned and stained with hematoxylin and eosin (H&E). The presence of germ layers (ectoderm, mesoderm, and endoderm) in the tumors was assessed by immunohistochemistry, using the primary antibodies: polyclonal rabbit anti-cytokeratin (1:250), Desmin Clone 33 (1:100), and Rabbit anti-glial fibrillary acidic protein (GFAP) (1:250) (Dako) with matching undiluted secondary antibodies: EnVision+HRP anti-rabbit and EnVision+HRP anti-mouse (Dako). Sections were then incubated with Chromogen DAB (Dako) and counter stained with hematoxylin.
Karyotypic stability
To assess chromosomal stability of hESCs cultured on VN for more than five passages, karyotyping of 20 colonies using BrdU/colcemid was performed by the Cytogenetics Laboratories at the Department of Obstetrics and Gynaecology, Kandang Kerbau Women's and Children's Hospital, Singapore.
Surface characterization
Adsorption and desorption kinetics were measured by Ponceau S staining. VN-coated organ culture dishes: VN0, VN2.5, VN5, VN10, and VN20, prepared as described above for the cell culture substrates, were exposed to Ponceau S staining solution (Sigma-Aldrich) for 15 h at room temperature.26,27 After three rinses in water and blow-drying, 400 μL of 0.1 M NaOH (Goodrich Chemical Enterprise) were added to each TCPS substrate. The samples were then shaken gently for 20 min, allowing desorption of bound Ponceau S stain from the sample surface. 27 TCPS samples were run in triplicates, yielding six 200 μL aliquots per VN concentration. Each aliquot was placed in a flat-bottom 96-well plate and neutralized with 15 μL of 50% acetic acid (J.T. Baker). Colorimetric adsorption was measured at 515 nm on an Infinite® 200 Multimode Microplate Reader (Tecan). This was compared with a standard curve generated using Ponceau S concentrations ranging from 0 to 10 μg/mL in 5% (w/v) acetic acid. The Ponceau S solution density was converted into molarity, which was used to calculate density of stain adsorbed to TCPS-immobilized VN. Ponceau S staining was similarly used to determine VN adsorption kinetics at 4°C, where TCPS samples were incubated with 5 μg/mL VN for different times. For VN desorption, TCPS samples were coated with 5 μg/mL VN solution overnight (15 h) at 4°C. Samples were then rinsed once with water and blow-dried. They were then incubated with 1 mL of PBS at 37°C at different times and subsequently stained with Ponceau S, as described above.
Quantification of VN adsorbed on TCPS by Bradford assay
VN adsorbed to TCPS was quantified by its depletion from the depositing solution by using a modified Bradford assay28,29 to measure the VN concentration in PBS before and after coating of TCPS. Dye reagent was prepared according to Bradford 28 and TCPS substrates were incubated with VN solutions at concentrations of 0, 5, 10, 15, and 20 μg/mL for 15 h at 4°C, as described above. After coating, 100 μL VN in PBS supernatant from triplicate samples for each concentration were combined into one 1.5 mL glass vial and 1.2 mL of Bradford dye reagent solution was added. The contents were mixed for 5 min and six 200 μL aliquots of each solution were then pipetted into a flat-bottom 96-well plate to measure their absorbance at 590 nm (A590) and 450 nm (A450) on a Tecan plate reader. This process was carried out within 10–20 min, to minimize nonspecific adsorption of VN during handling of the protein solution. For each well, the A590/A450 ratio mitigates fluctuations arising from differences in solution volume. This was normalized by subtracting the average A590/A450 value for PBS (0 μg/mL). 29 An assay of VN solutions with concentrations of 0, 5, 10, 15, and 20 μg/mL was used to plot the standard curve of A590/A450 versus VN concentrations. The VN solution concentrations before TCPS coating were taken as 0, 5, 10, 15, and 20 μg/mL. The A590/A450 values obtained from VN solutions used to coat TCPS were compared with the standard curve, yielding the depletion in VN solution concentration. These values were then used to calculate VN adsorbed to TCPS and its corresponding surface density. For the latter, the coated surface area of the 60 mm center-well organ culture dishes was estimated at 3.5 cm2, which includes the base and a rim extending 1.5 mm above it.
XPS measurements
VN0, VN2.5, VN5, VN10, and VN20 were prepared as described above. Their surface chemical composition was determined using a Theta Probe X-ray photoelectron spectrometer (Thermo Fisher Scientific), equipped with an aluminium anode (15 kV, 100 W), and a quartz monochromator. The latter was set to a 50° take-off angle, measured from the normal to the plane of the sample surface, yielding a probing depth of ∼5 nm. Detailed scans of the N1s, O1s, and C1s peaks were performed on each sample, taking data from a 400 μm2 spot and using a pass energy of 40 eV. Detailed scans were repeated as follows: 20 times for C1s, 15 times for O1s, and 20 times for N1s. A wide scan (binding energy from 0 to 1300 eV) was then performed with pass energy of 200 eV. Peaks were fitted with a mixed Lorentz-Gaussian function. Deconvolution of the C1s signal reveals five peaks: aromatic C (284.8–284.9 eV), C-C (285 eV), C-NH2 (285.5–286.0 eV), C-O (287.6–288.4 eV), and C = O (287.6–288.4 eV).
AFM measurements
Surface topography was assessed by AFM profilometry, as a measure of the hESC responses to VN-coated TCPS. Bare TCPS and VN0, VN2.5, VN5, VN10, and VN20 were measured after blow-drying in ambient conditions using a Bioscope I microscope equipped with a NanoScope IIIa controller and a low noise scanner (Digital Instruments; Veeco Metrology Group). PointProbe® Plus noncontact high resonance frequency (PPP-NCH) silicon cantilevers (Nanosensors) were used for intermittent-contact (also known as tapping) mode operation to obtain high-resolution images of the samples. Scan rates ranged from 0.75 to 1 Hz, and free amplitude (A0) setpoint values were ∼1.6 V. Images of the TCPS surface morphology and the corresponding VN-coated surfaces were taken at 85%–90% of the free amplitude. Roughness analysis was performed by Nanoscope software version v5.12rb. Briefly, two-dimensional AFM height maps can be used to determine the arithmetic roughness (Ra) of the bare and VN-coated TCPS surfaces. The arithmetic roughness, Ra, describes the absolute value of the surface height, measured relative to a two-dimensional plane, set at the average sample height. Ra was calculated from the entire (4 × 4 μm) image or several smaller areas (2 × 2 μm) within the image. Phase data records variations in the cantilever oscillation, reflecting changes in surface rigidity and viscoelasticity. This was used to improve the contrast between adsorbed VN aggregates and the TCPS substrate surface. Bearing analysis was carried out using Nanoscope software version v5.12rb.
Colloidal gold staining of VN adsorbed to TCPS
To evaluate the uniformity of VN adsorbed to TCPS over length scales of mm–cm, the surface-bound protein was detected by the Colloidal Gold Total Protein Stain (Bio-Rad). VN0, VN2.5, VN5, VN10, and VN20 were prepared as described above. After rinsing and blow-drying, the surfaces were incubated overnight in Colloidal Gold stain at room temperature. They were then rinsed with water, blow-dried, and photographed.
Statistical analysis
Data values are reported as a mean and a standard deviation. Graphs were plotted and data were transformed using Sigmaplot software. One-way analysis of variance was applied to compare differences across the groups and p < 0.05 was considered as significant.
Results
Stable expansion and analysis of HES-3 and H1 cells cultured on VN5
The development of a defined matrix to support long-term hESC expansion is important for potential therapeutic applications. To determine whether VN is a suitable substrate, HES-3 and H1 cells were cultured for >10 passages on VN5 in either CM or mTeSR1 media. Cells grown on Matrigel in CM served as a positive control. Images of cells cultured at passage 15 showed that both hESC lines retained an undifferentiated morphology that was characterized by the formation of compact colonies with distinct boundaries and a high nucleus to cytoplasmic ratio (Fig. 1A). Cells cultured with mTeSR1 appeared to have less distinct boundaries as compared to cells cultured in CM. However, this difference was not reflected in the expression level of the pluripotent marker Tra1-60 (Fig. 1B) and OCT-4, with >90% positive expression after 12 passages (Table 2). Quantitative RT-PCR of HES-3 cells cultured on VN5 and Matrigel at passage 20 revealed similar levels of Nanog and OCT-4 mRNA expression, which confirms their pluripotency (Supplementary Fig. S1 and Supplementary Table S1, available online at
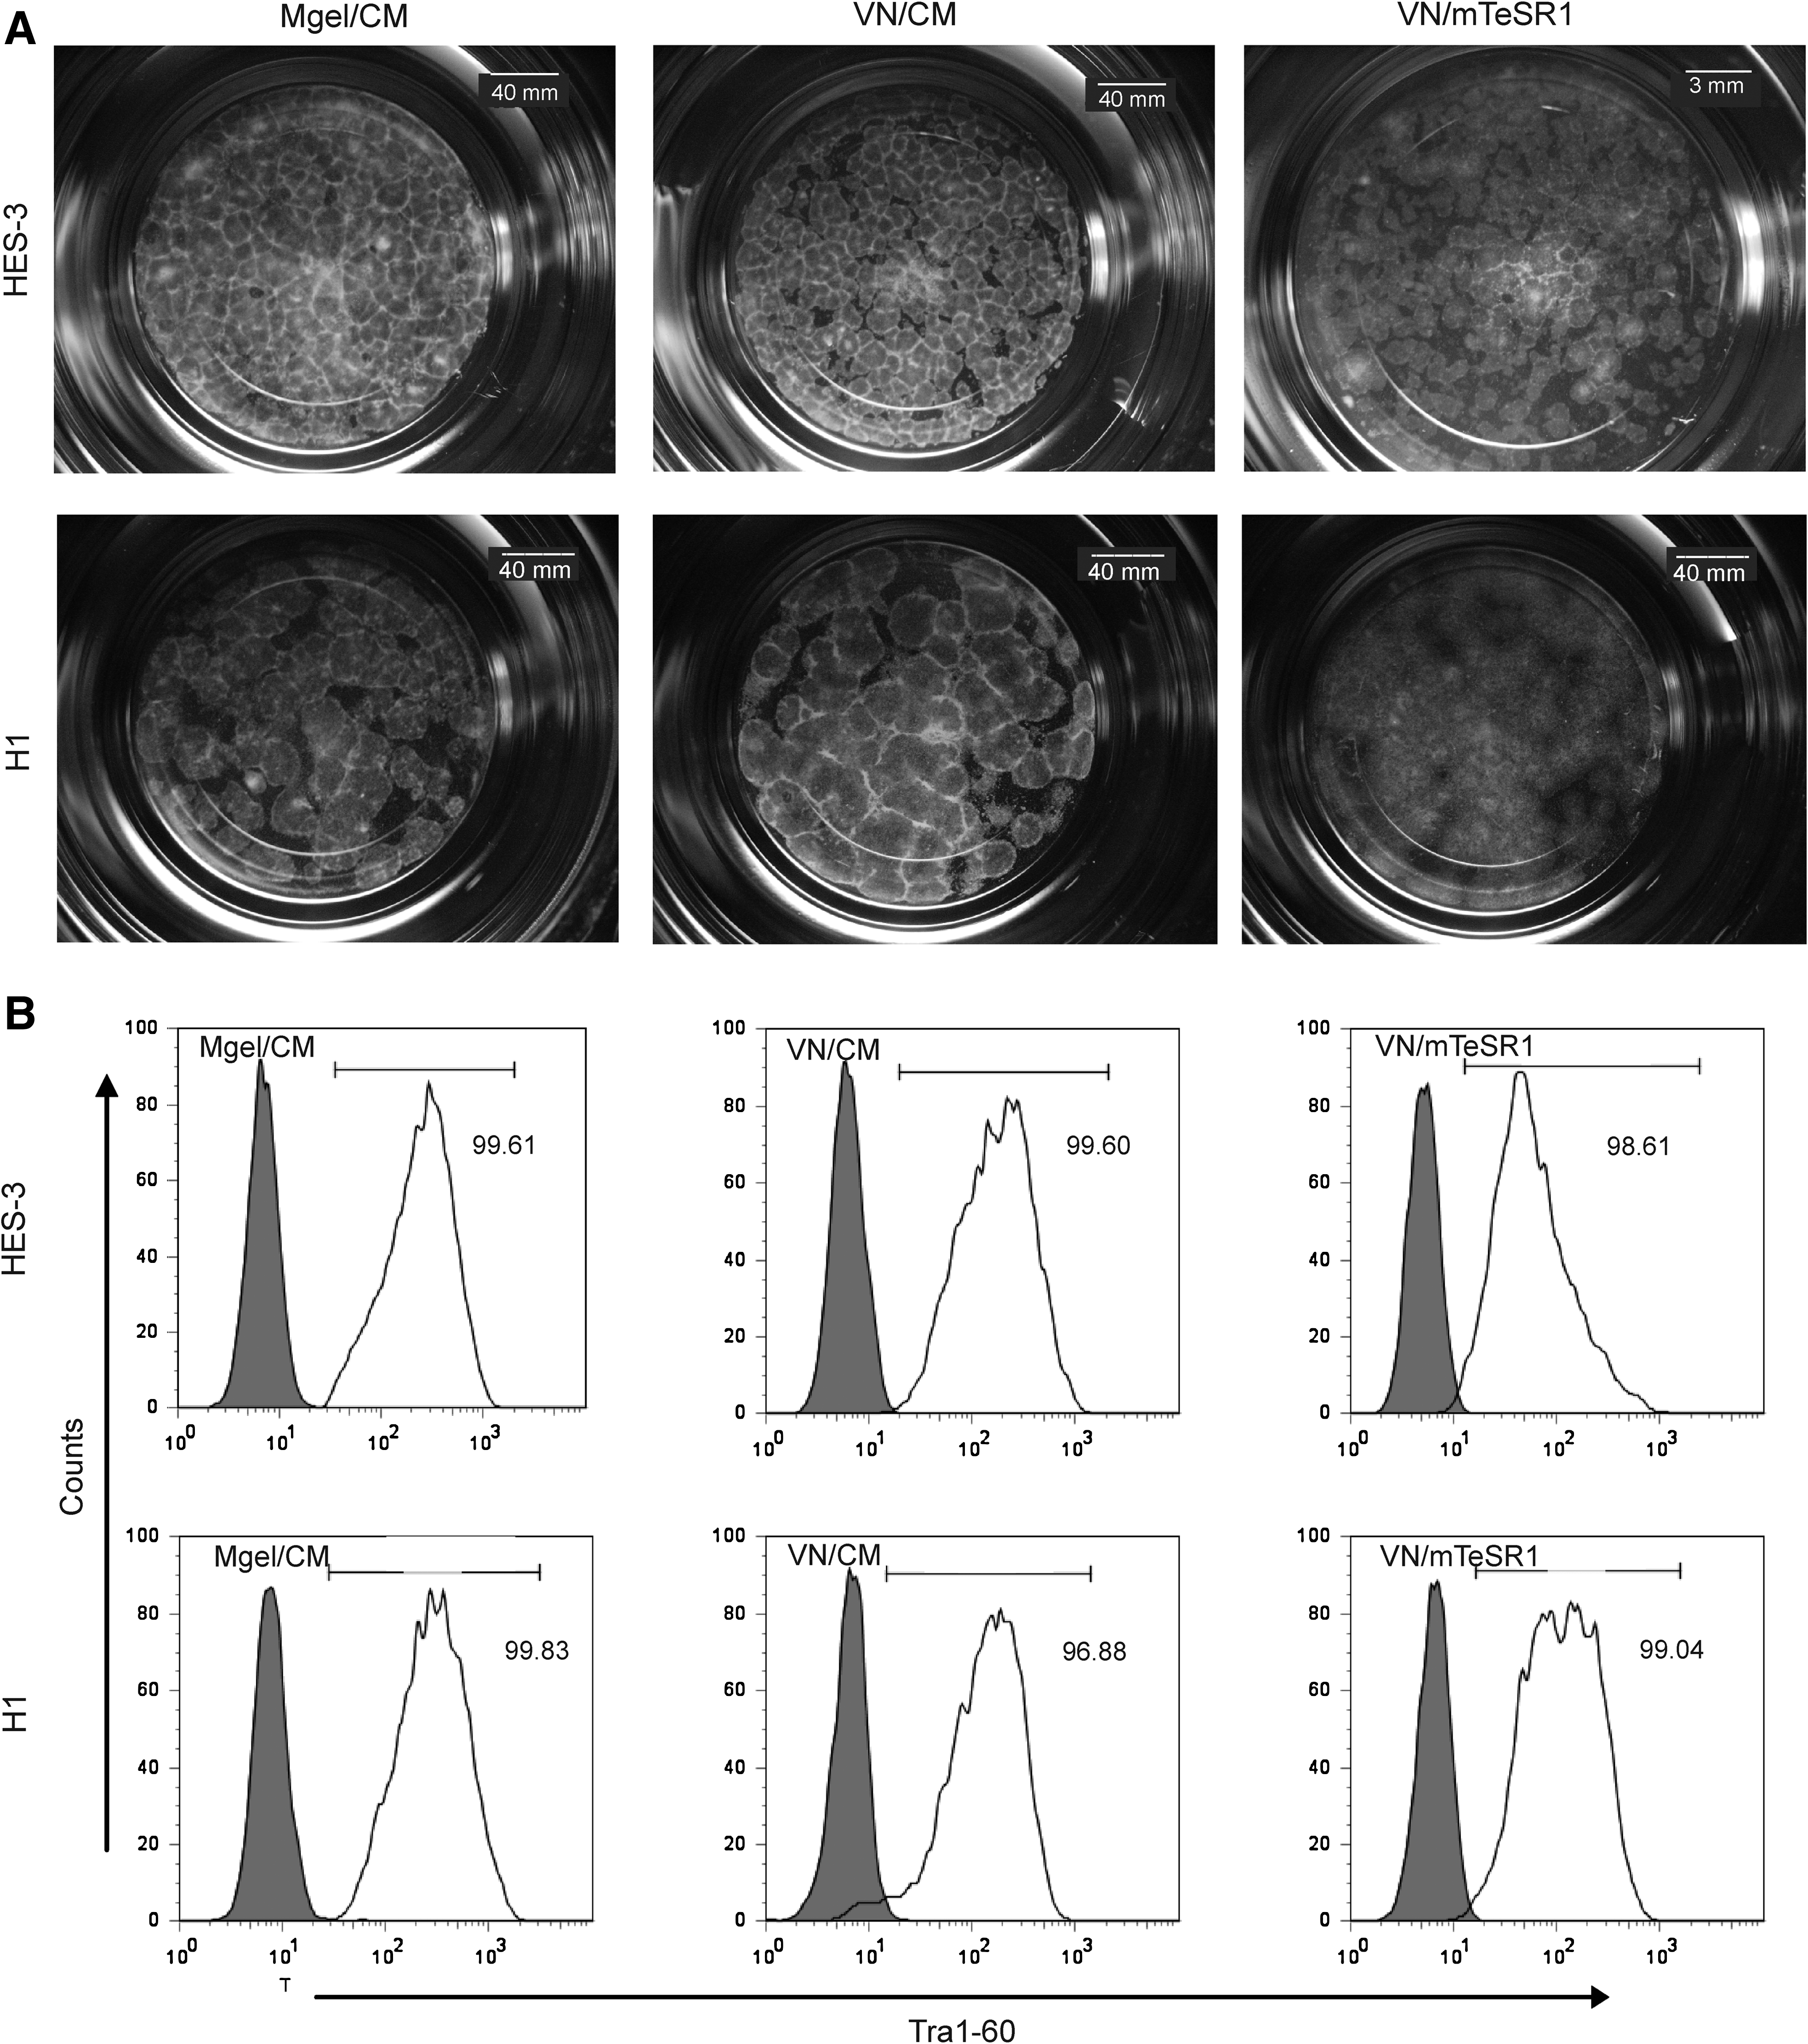
Characterization of HES-3 and H1 cells cultured on VN5 in either conditioned medium (CM) or mTeSR1 medium at passage 15.
Cells maintain >90% positive for both markers expression for 12 passages.
CM, conditioned medium; VN, vitronectin.
Karyotype analysis was performed on HES-3 (46, XX) at passage 9 and H1 (46, XY) at passage 5 from the VN5 in mTeSR1 platform and the cells were found to be of a normal diploid karyotype (Fig. 2A). Moreover, FACS and karyotype analyses were also repeated on passage 30 hESC, with >90% of the cells continuing to express Tra1-60 and OCT-4 with a normal diploid karyotype (data not shown).
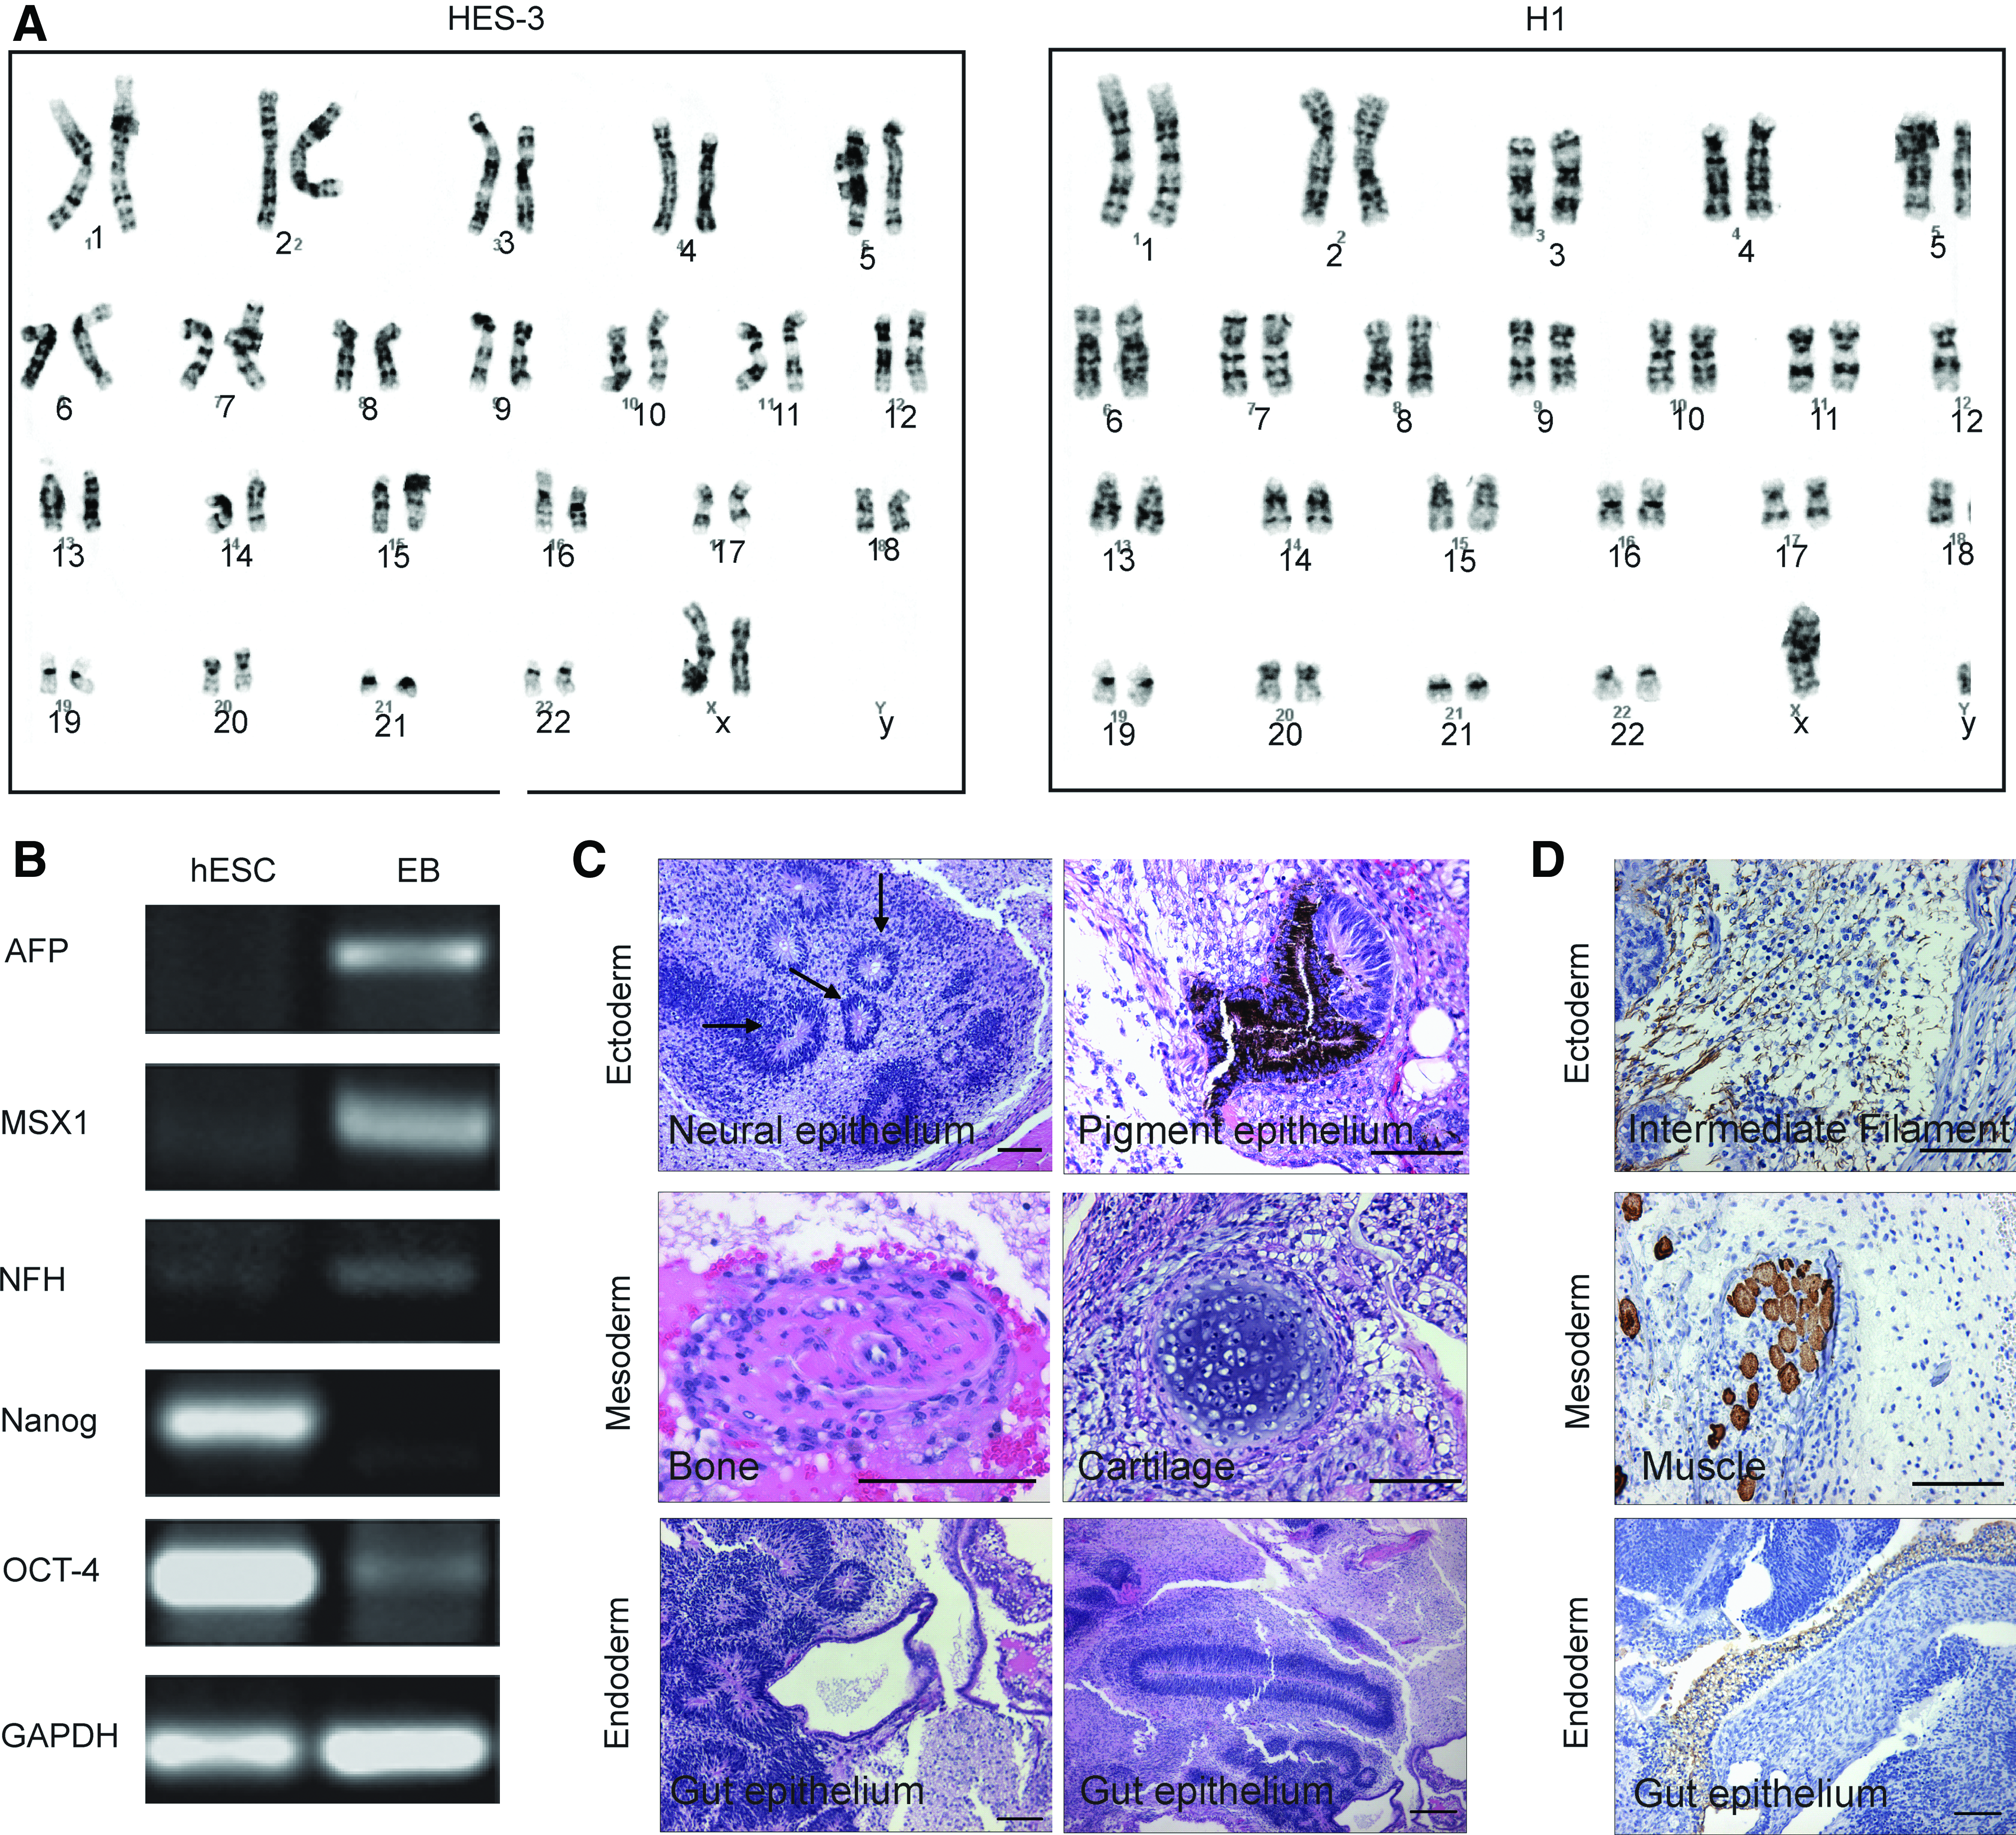
HES-3 and H1 cells cultured on VN5 with mTeSR1 media were analyzed by karyotyping, embryoid body (EB) differentiation, and teratoma assay.
A robust tri-germ layer differentiation potential is also a hallmark of pluripotent hESCs. After VN propagation for 25 passages, HES-3 cells were induced to differentiate through EBs and the presence of ectoderm, mesoderm, and endoderm probed by PCR (Fig. 2B). After 21 days of differentiation, HES-3 express the mRNA transcripts for AFP (endoderm), NFH (ectoderm), and MSX1 (mesoderm) that are absent in undifferentiated cells (Fig. 2B). As expected, expression of the pluripotent markers Nanog and OCT-4 were suppressed when the cells were induced to differentiate.
As a final test of pluripotency, the tumorgenicity of HES-3 was investigated in vivo. When cultured on VN5 for 18 passages in mTeSR1 medium and then injected into the muscle of SCID mice, a teratoma formed contained structures from all three germ layers, as determined by H&E and immunohistochemical staining (Fig. 2C, D). Ectoderm (neural epithelium and pigmented epithelium), mesoderm (bone and cartilage), and endoderm (gut epithelium) were clearly visible by H&E. Similarly, the presence of GFAP-positive intermediate filaments (ectoderm), desmin-positive muscle (mesoderm), and cytokeratin-positive epithelium (endoderm) was confirmed by immunohistochemistry.
Taken together, these data suggest that VN5 combined with mTeSR1 medium is able to support the long-term propagation of undifferentiated, pluripotent hESCs. Notably, similar results were also found for induced pluripotent stem cell (IMR90) that could be readily propagated on VN5 mTeSR1 medium for over five passages (data not shown).
Short-term biological response to different VN surface density
Having established a defined condition for hESC culture, we sought to assess the variation in bioresponse arising from changes in the VN surface density. Several VN solution concentrations were used to coat TCPS by overnight incubation at 4°C. Cell attachment on these surfaces was compared across a range of VN densities in CM and mTeSR1 media (Fig. 3A). For all VN surface densities, cells attach in a VN density-dependent manner, with the highest number of attached cells resulting from the highest VN density. Notably, in CM, the cell density plateaus at concentrations above 1.25 μg/mL, with approximately two- to four-fold more cells attached in the presence of mTeSR1 as compared to CM.

Short-term adhesion assay on different VN-coated TCPS with HES-3 cells.
As significant differences in cell attachment to VN-coated TCPS were observed over a 45 min period, we next chose to examine hESC attachment and proliferation at 1 and 7 days (Fig. 3B, C). In contrast to the 45 min assay, at day 1 no differences in cell number were observed for both media treatments. There was, however, a similar VN density-effect between 45 min and 1 day with approximately threefold more cells in the ≥VN2.5 condition, when compared to VN1.25. Notably, when hESCs were cultured for 7 days at various VN densities, ≥VN2.5 was required for maximum proliferation; however, significant growth differences were observed between CM and mTeSR1 media, with mTeSR1 significantly outperforming CM (∼30%).
The VN density threshold of 2.5 μg/mL, capable of supporting hESC attachment and expansion, was also evident from photomicrographs taken after 1 week in culture (Fig. 3D). Cells cultured on ≥VN2.5 had the typical mosaic/cobblestone appearance of confluent hESC, as compared to cells cultured <VN2.5 that were sparsely attached and failed to grow.
Long-term biological response to different VN surface densities
To fully evaluate the threshold VN surface density suitable for the long-term maintenance of pluripotent hESC, HES-3 cells were cultured for greater than five passages in mTeSR1 media. Pluripotency was then assessed by FACS, EB differentiation, and teratoma formation. Initially, cells cultured on VN1.25, VN2.5, and VN5 underwent a period of adaptation,27,28 which was reflected by decreased expression of pluripotent markers at passage 1 (Table 3). After subsequent passaging, cultures at passage 2–6 were >90% positive for Tra1-60 and OCT-4 (Fig. 4A and Table 2). These levels were similar to those observed for cells maintained on Matrigel.
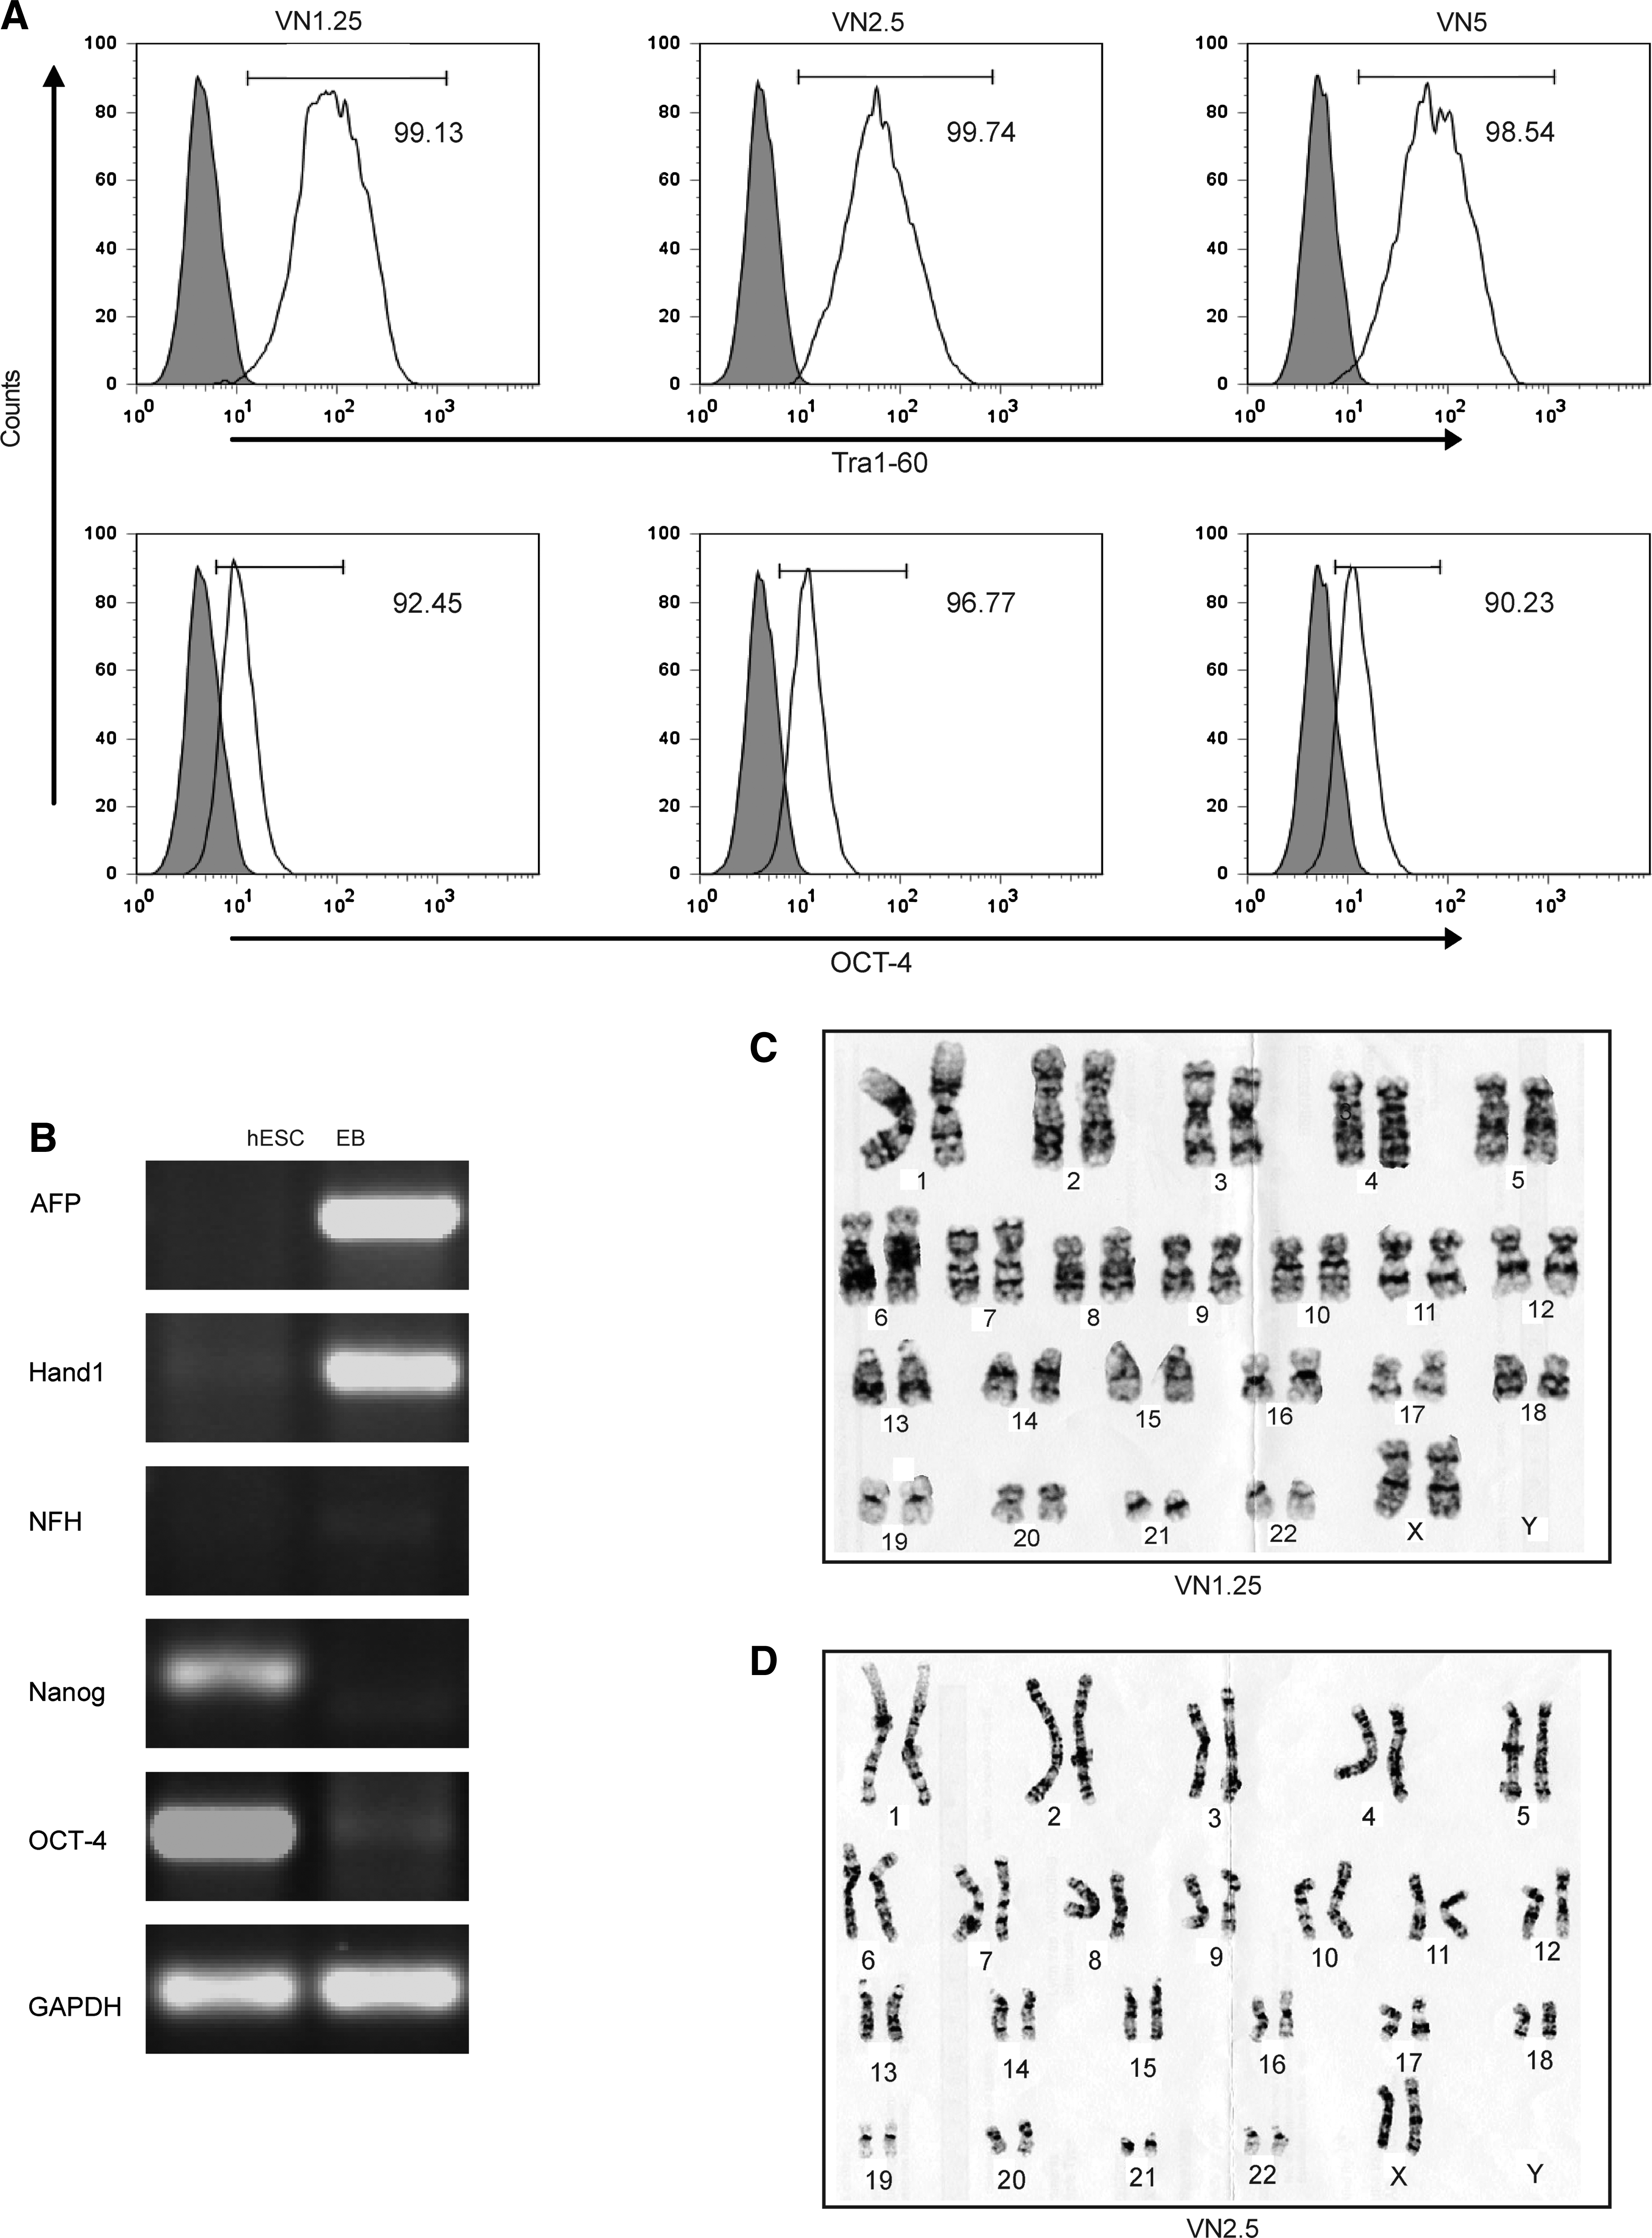
Long-term analysis of HES-3 cells cultured on TCPS coated from different VN concentration.
Cells maintained high levels of expression for 6 weeks.
Differentiation was then assessed by RT-PCR for germline markers in EBs. Cells cultured on VN1.25 failed to expand sufficiently for differentiation assays and were not analyzed further by either EB or teratoma formation. However, cells readily expanded on VN2.5, with differentiation assays showing the presence of mRNA transcripts for AFP (endoderm), Hand1 (mesoderm), and NFH (ectoderm) and the absence of Nanog and OCT-4 genes (Fig. 4B). Importantly, despite their in vitro differentiation potential, cells cultured on VN2.5 failed to form a teratoma when transplanted into the muscle pouch of a SCID mouse (data not shown). As previously shown in Figures 1 and 2, cells cultured on VN5 maintained all the hESC characteristics of growth, differentiation, and teratoma formation. Further, hESC culture on VN1.25 and VN2.5 maintained normal karyotypes over five passages (Fig. 4C, D).
Surface characterization
Results from both the Bradford protein assay and Ponceau S staining (Fig. 5A and Fig. 5B, respectively) show similar trends for the adsorbed VN surface density versus the depositing solution concentration: a steady increase in surface-adsorbed VN with increasing solution concentration that reaches a plateau for >VN10. Adsorption and desorption kinetics (Fig. 5C, D) were modeled using an exponential time dependence. Modeling the data with an exponential in the square root of time, as proposed by Granick,30–32 does not improve the fit. The associated fitting parameters (Table 4) indicate an adsorption time constant of ∼1 h and a desorption time constant of ∼4 h. The latter may not accurately represent surface depletion in actual cell culture conditions, where VN desorption is influenced by competing adsorption from other proteins. The y0 parameter physically represents the VN protein that remains bound to TCPS after a desorption time of 2 days, and Figure 5D shows that only about 25% of the adsorbed VN is desorbed from the TCPS substrate after 48 h exposure to PBS. While 75% of VN adsorbed to TCPS after 2 days may arise from VN re-adsorbed from the PBS solution, this is mostly attributed to VN remaining durably bound to the TCPS substrate.
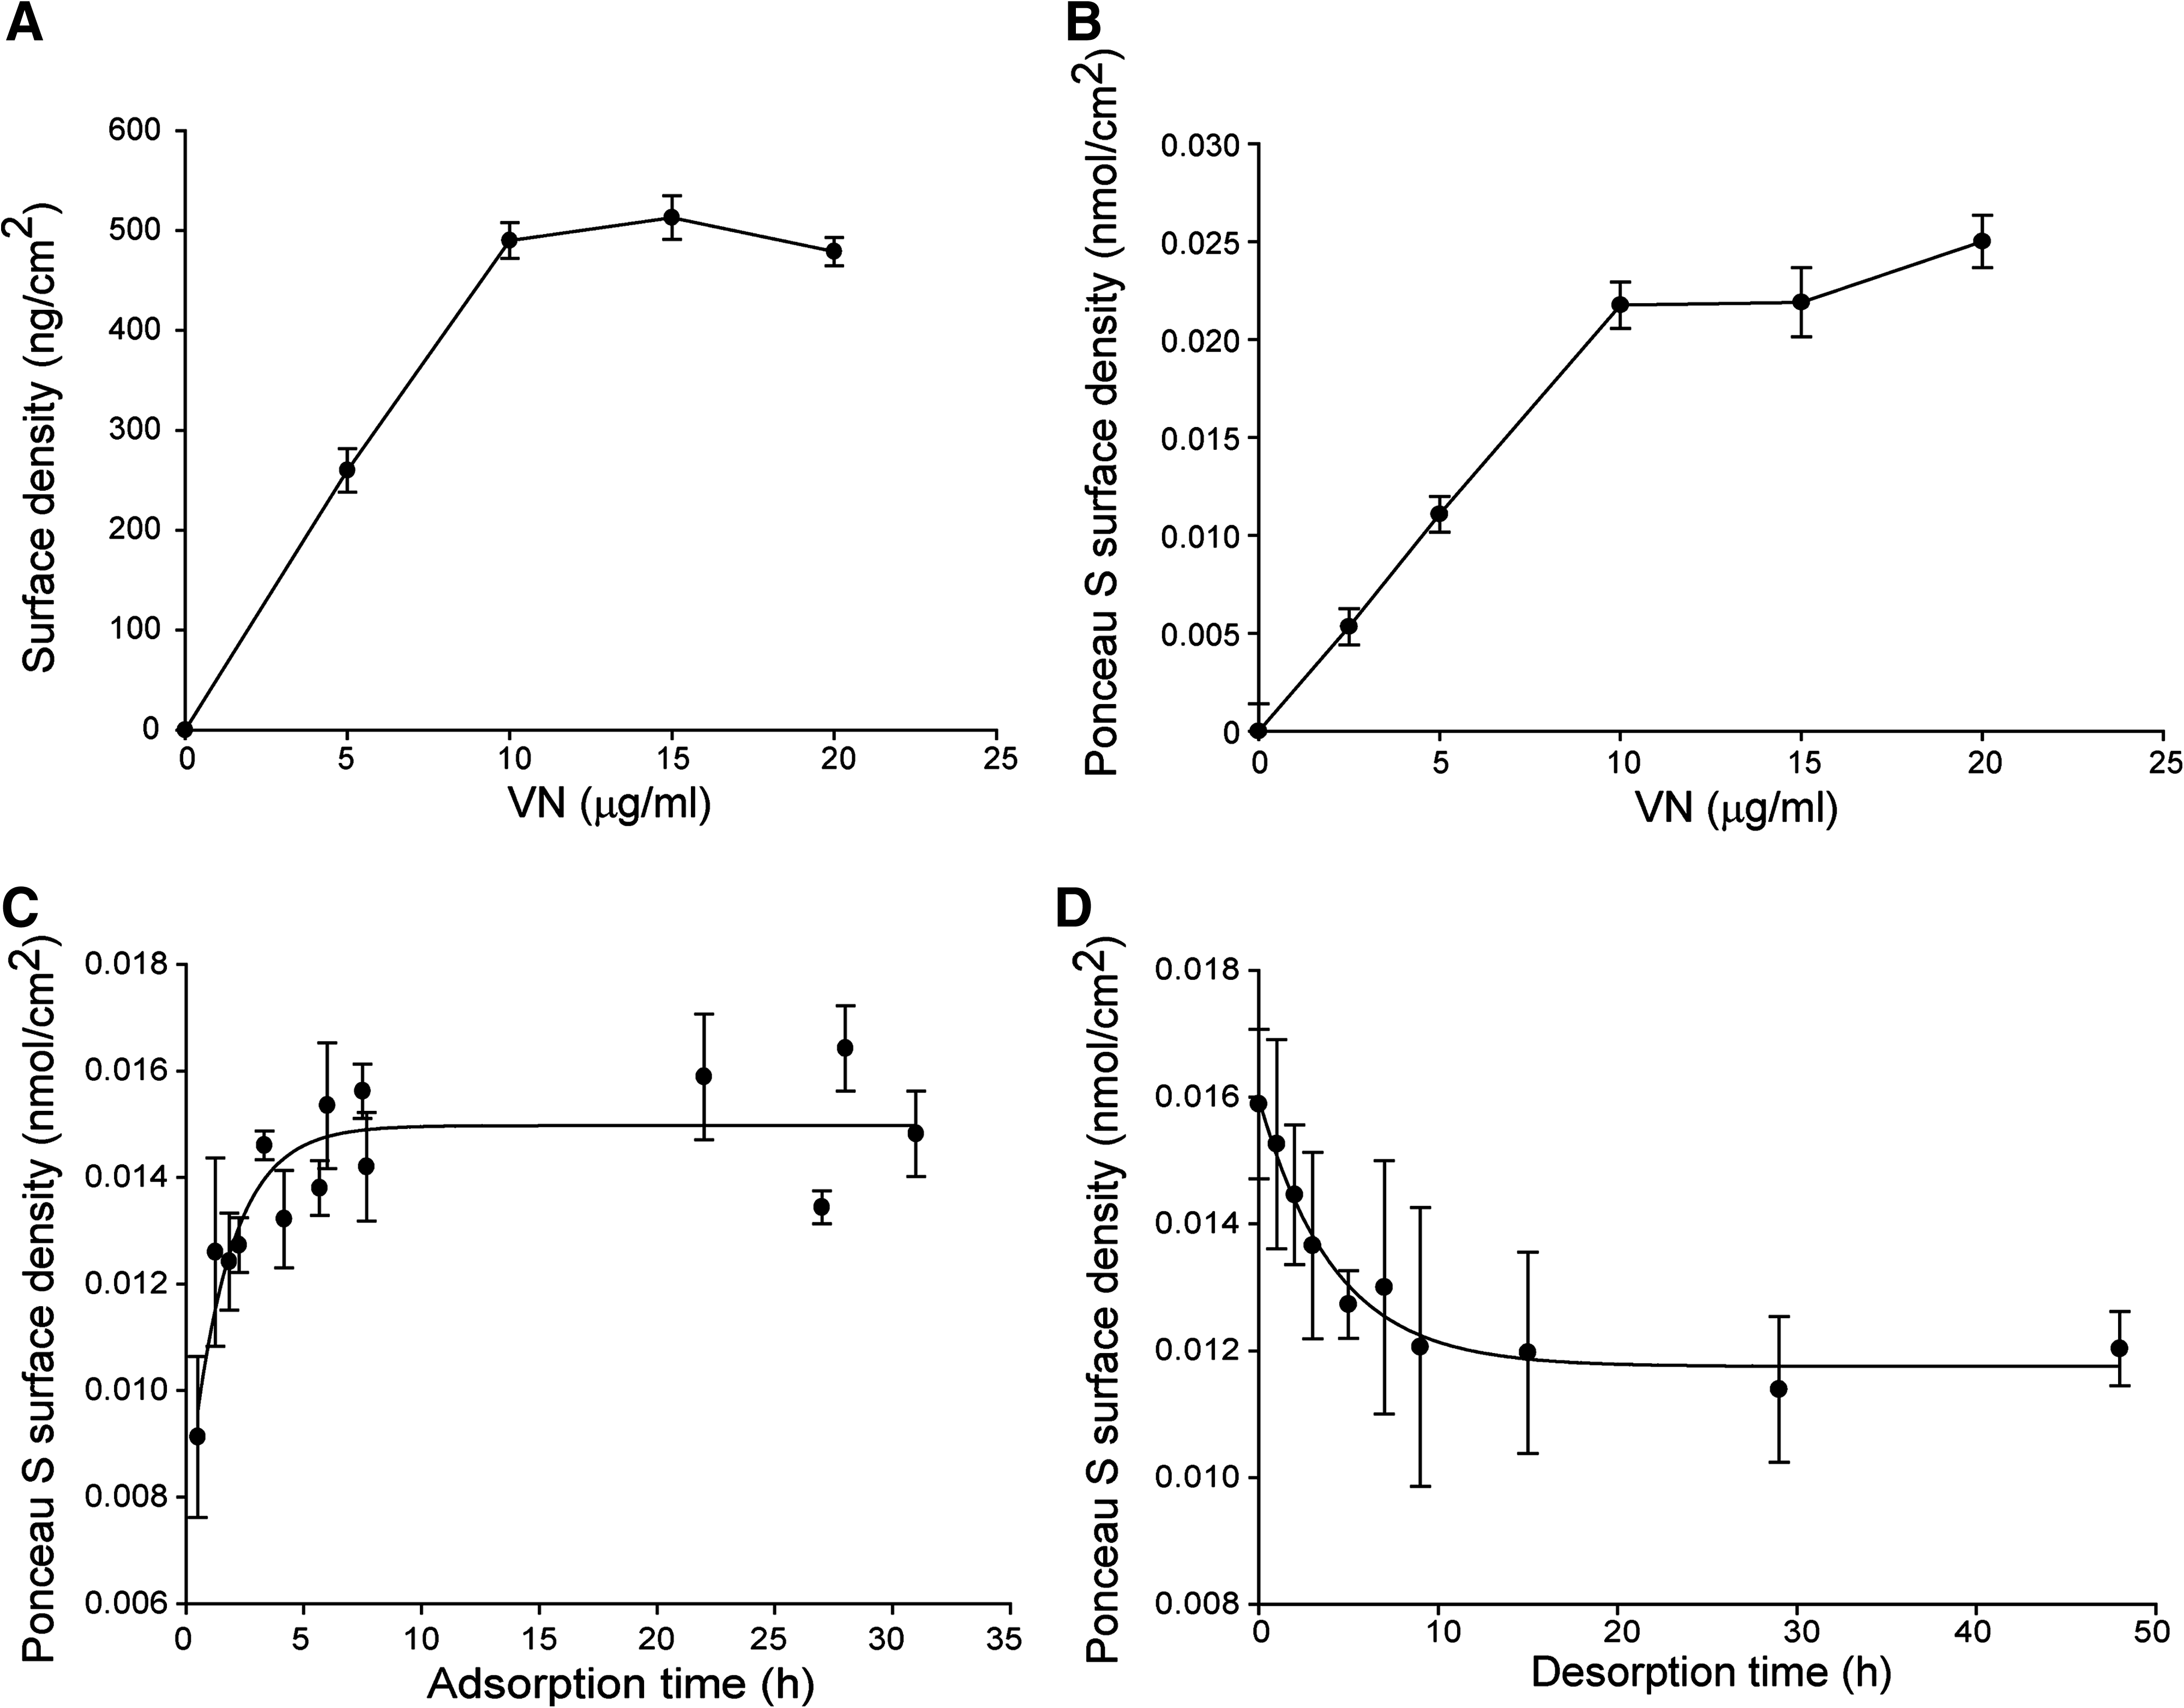
Data and fitted curves shown in Figure 6. For adsorption, A reflects the maximum surface density of VN and T is the time constant. For desorption, A reflects the initial surface density of VN, T is the time constant, and y0 reflects staining of nondesorbed VN.
XPS detects the surface chemical composition of VN-coated TCPS, with data showing the presence of nitrogen, C-NH2, C-O, and C = O bonds (Fig. 6A). The increasing signal from N and O atoms with depositing solution concentration indicates a monotonic increase in VN surface density, which reaches saturation for depositing solution concentrations >VN10, reproduces the same trend as observed with Ponceau S surface staining and Bradford quantification of the surface-adsorbed protein (Fig. 5A, B) and independently confirming the dependence of surface-adsorbed VN on depositing solution concentration.
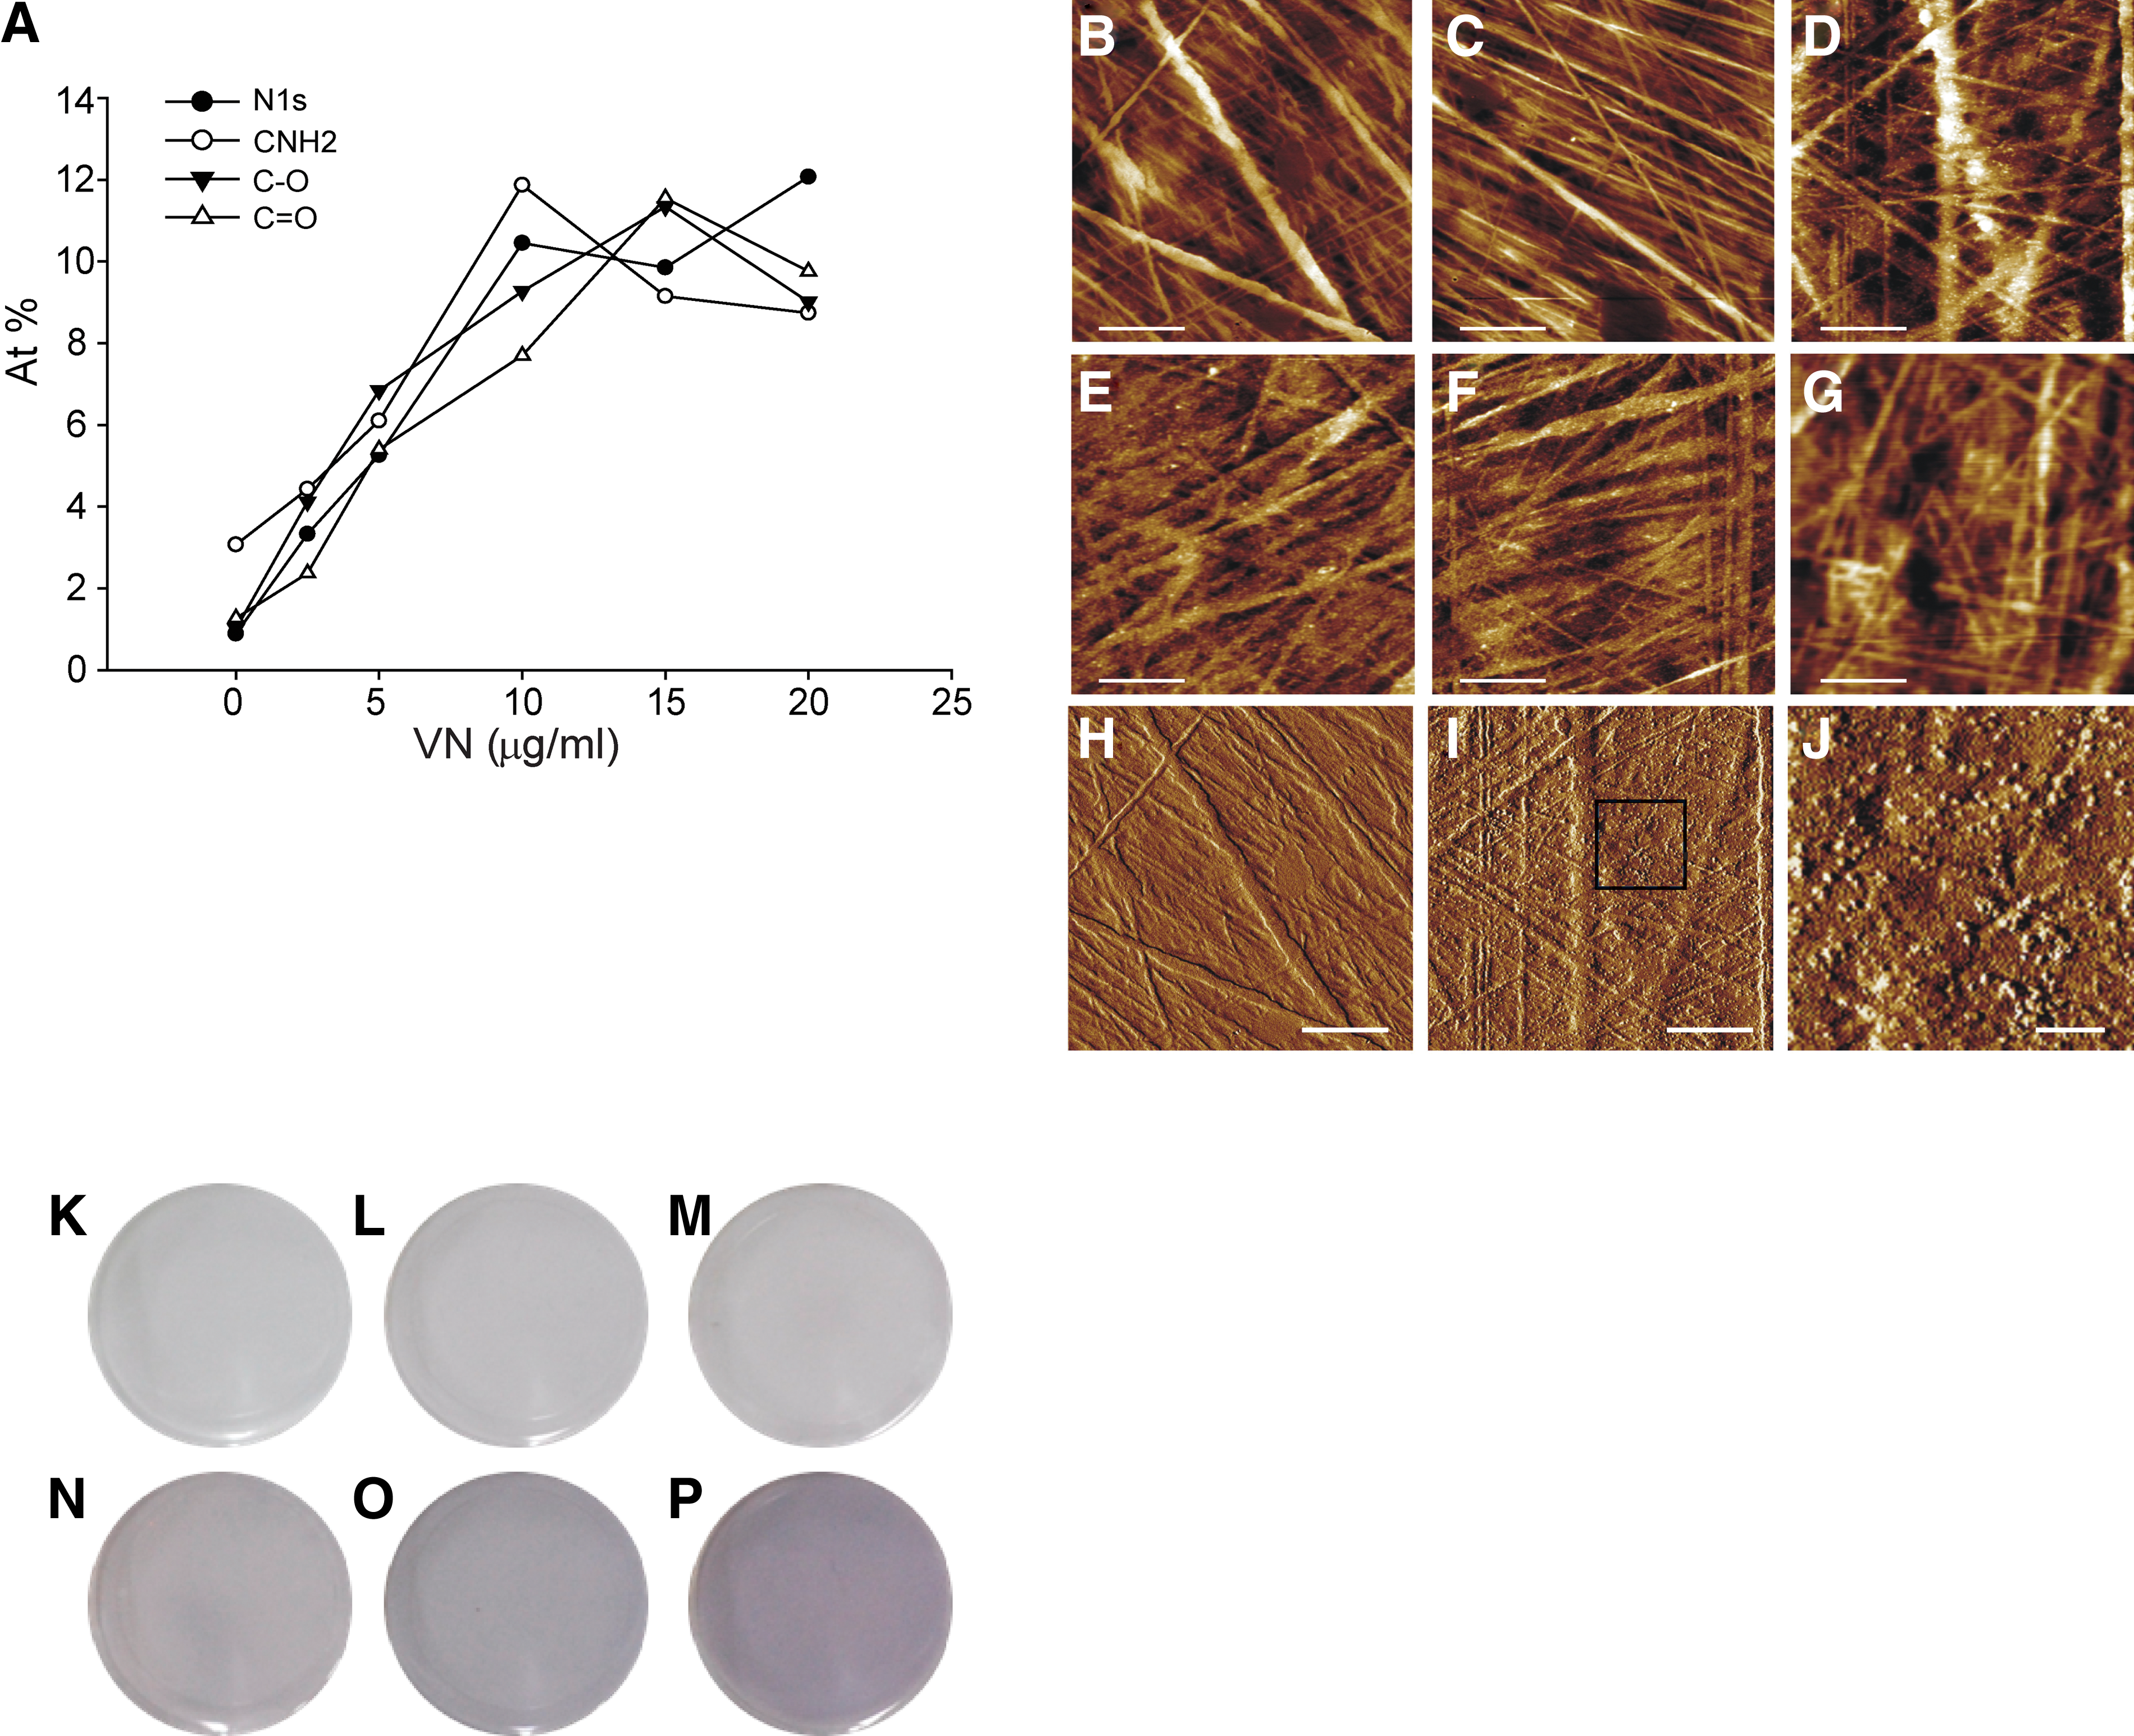
AFM height images depict surface profilometry of the cell culture substrate. Bare TCPS shows an intrinsic, structured surface roughness, consisting of random line features that are presumably introduced by the tissue culture plates' manufacturing process. These substrate features are observed across all samples, from bare to TCPS coated from 0, 2.5, 5, 10, and 20 μg/mL VN (Fig. 6B–G), The TCPS morphology remains unchanged after exposure to PBS solution alone, implying that the features associated with VN aggregates, as observed on VN2.5, VN5, or VN10, are not an artefact generated by the exposure of TCPS to PBS solution (Fig. 6C). The surface roughness, Ra, of the bare TCPS substrates was found to range from 2.7 to 3.2 nm. Deposited VN aggregates, in the form of spot-like features, are visible on VN2.5 to VN10 (Fig. 6D–F). AFM phase images offer an enhanced contrast, improving the visibility of adsorbed VN aggregates, as seen on VN2.5 (Fig. 6I). A higher magnification of a selected area in Figure 6I (VN2.5) is shown in Figure 6J. The absence of spot-like features, associated with VN aggregates, on the AFM phase image of bare TCPS (Fig. 6H) confirms that these arise from adsorbed VN. Adsorbed VN aggregates did not significantly increase the Ra value for coated samples beyond the range quoted above. Finally, the AFM profilometry of VN20 shows a loss in resolution, whose physical origin remains unexplained.
Colloidal gold staining confirms that the surface density of adsorbed VN increases with concentration of the depositing solution (Fig. 6K–P). The sample shown in Figure 6K is indistinguishable from the bare TCPS. This demonstrates the absence of colloidal gold staining on a substrate uncoated with VN. As the depositing VN solution concentration is increased, the samples shown in Figure 6L do not show any stain, whereas Figure 6M, which shows samples coated with 5 μg/mL VN solution, shows a barely discernible stain. Figure 6N–P, which shows samples from VN10, VN15, and VN20, respectively, shows a discernible and increasing colloidal gold stain, whose uniformity indicates that VN adsorbed to the surface of TCPS is homogeneous, when averaged over length scales ranging from hundreds of microns to millimeters.
Bearing analysis integrates the height measured by AFM profilometry over a two-dimensional map of the sample surface. This may be used to calculate the volume under the sample surface and thus derive an estimate of the protein volume required to coat 95% of the surface features.33,34 The volume required to fill in the TCPS surface roughness, leaving only 5%, by area, of its highest features exposed was calculated to be 0.22 μm3 from a typical region of bare TCPS. Projecting this volume into a film over a two-dimensional area of 16 μm2, this corresponds to an average coating thickness of 14 nm or a VN surface density of 1.7 μg/cm2 (assuming VN protein density as 1.2 g/cm3). 35
Quantification of surface-adsorbed VN
Surface-adsorbed VN is quantified by measuring the depletion of the depositing solution concentration. Completing Bradford assay measurement of protein solution concentration within 10–20 min, which is an order of magnitude smaller than the several hours required to saturate nonspecific adsorption of VN on TCPS (Fig. 5C), effectively minimized losses of VN by nonspecific adsorption. This measurement estimates the surface density of VN deposited solutions of VN ranging from 5 to 20 μg/mL. These solution concentrations resulted in surface-adsorbed VN of 250 ng/cm2 (VN5) to 500 ng/cm2 (VN20), respectively (Fig. 5A). Analysis of the bioresponse indicates that hESCs do not attach on <VN2.5 and (Fig. 3C, D) and long-term proliferation is not supported on <VN5. Thus, the minimum threshold VN surface density, which is required for the long-term propagation of hESCs, is estimated at 250 ng/cm2 (VN5).
Experimental data in Figure 5A allow a simple calculation of VN depletion from the depositing solution. From the surface density of VN adsorbed to TCPS, the reduction in solution concentration may be deduced. Given that 300 μL of 5 μg/mL solution contains 1.5 μg of VN and that 250 ng/cm2 of surface-adsorbed VN on 3.5 cm2 of TCPS is 0.88 μg, ∼50% of VN in the solution is deposited onto TCPS. This is the case for VN solution concentrations up to 10 μg/mL. For higher VN concentrations, the lack of an increase in surface-adsorbed VN reduces its depletion in solution. For an initial solution concentration of 20 μg/mL, the final solution concentration after VN is deposited on TCPS is ∼15 μg/mL, or 75% of the initial solution concentration. The staining uniformity of surface-adsorbed VN and AFM data indicate that this may be effectively considered as an average surface density, over length scales larger than tens of microns.
Discussion
Recent studies have demonstrated the ability of VN to support hESCs propagation, but they lack details concerning the characterization and quantification of VN on the culture surfaces.15,17 In this study, we varied the concentration of VN in solution and determined the amount that adsorbed to TCPS with a view to developing a quantifiable platform on which to expand pluripotent hESC over multiple passages, and in a stable manner.
We showed that a threshold VN surface density of at least 250 ng/cm2 (VN5) is required for the long-term expansion (>30 passages) of pluripotent hESCs in a serum-free defined medium (mTeSR1). Cells cultured at this VN threshold had sustained expression of Tra1-60 and OCT-4 at levels above 90%. The population doubling time for HES-3 cultured on VN5 is 32 h. For the same cells cultured on Matrigel, the doubling time is 25 h. These differences in cell growth rates are not associated with a loss in pluripotency for hESCs cultured on VN surfaces. They also retained the potential to differentiate to the three germ layers through EBs and readily formed teratomas when transplanted into the muscle pouch of SCID mice. Importantly, the cells had a normal diploid karyotype and they maintained a compact morphology. At VN surface densities below 250 ng/cm2 cell attachment and proliferation were compromised and the cells failed to differentiate in EBs and were unable to develop teratomas in vivo.
Noteworthy is the finding that only 50% of the VN dissolved in PBS was able to adsorb to TCPS from VN solution concentrations ≤10 μg/mL. As the VN surface saturates, this waste increases, reaching ∼75% from the higher initial solution concentration of 20 μg/mL. These findings may serve as process parameters, forming the basis of a scale-up system for hESCs, with a fully quantifiable, chemically defined culture conditions.
We also observed that hESCs cultured in mTeSR™ media achieved higher cell numbers after 1 week in culture than cells grown in CM. This observation was supported by Chin et al., who reported that a defined medium such as mTeSR1 reduces the doubling time of hESCs to ∼21 h, as compared to cells cultured in CM that require 28 h. 36 Another interesting observation was the absence of in vivo teratoma from the transplanted cells when cultured on VN2.5 with mTeSR1 media.
Previous studies by Braam et al. reported that VN adsorbed to TCPS from a solution containing 5 μg/mL is able to support hESC cultures and in another study, Rowland et al. coated TCPS with 10 μg/mL of human-plasma-purified VN for the culture of iPSCs (IMR90).15,17 In both cases no surface characterization was performed to quantify the amount of VN bound to the surface. By comparison, in the present study we show that a VN threshold surface density of 250 ng/cm2 (VN5) can be used as a xeno-free substrate for hESC culture. Although VN used in this study was purified from human plasma, this would serve as a bench mark for studies done with human recombinant VN in the future. More recently, Manton et al. demonstrated that a chimeric VN:insulin-like growth factor 1 complex when added into serum-free media could maintain pluripotent hESCs; however, in this study hESCs were cultured on a substrate of murine laminin that does not fulfill the requirements for a xeno-free culture platform. 37
VN is known to synergize with numerous growth factors to maintain both embryonic and adult stem cells in an undifferentiated state.38,39 Indeed, notable differences in the mitotic rate between embryonic and adult stem cells have been reported. 40 As such, there is a clear need to better understand the cellular context underlying hESC culture. An interesting aspect that merits further exploration is how ECM and growth factor signaling pathways interact in maintaining stem cell pluripotency.
Our characterization studies demonstrate that the long-term, stable propagation of hESCs is possible with VN5 and that this defined surface is a viable alternative to Matrigel. The threshold surface density is estimated at 250 ng/cm2 of protein by assuming a linear dependence of adsorbed VN with solution concentration, as predicted by the Langmuir adsorption isotherm and corroborated by Ponceau S staining and the Bradford protein assay (Fig. 5A, B). Thus, VN is effective for promoting cell adhesion and supporting the expansion of pluripotent stem cells at surface densities well below its saturation, which is estimated at 500 ng/cm2.
AFM image resolution was limited by the radius of the AFM probe tip, which is nominally 20 nm. This prevents the detection of individual VN molecules, which may be approximated by a cylinder of radius 3 nm and length 11 nm. 19 Larger VN aggregates appear as point-like asperities on the randomized line-feature background of the TCPS substrate. Only the height of VN aggregates is cited, since dimensions in the plane of the surface are convoluted with the tip diameter. Their size is comparable to that reported by Zhang et al., for VN molecule aggregates adsorbed onto smooth mica surfaces. 23 Lynn et al. describe the formation of VN aggregates in solution and Izumi et al. report the presence of VN aggregates with a Stokes radius of 6.5 nm in human plasma.19,41 Thus, the observed VN aggregates may have be adsorbed from solution or may be formed as VN adsorbs to TCPS. Higher VN solution concentrations may lead to its adsorption in a different configuration, potentially giving rise to the observed decrease in resolution when imaging VN20. This observation correlates with colloidal gold staining images (Fig. 6K–P). Colloidal gold staining, although not quantitative, may be used to discern increases in the adsorbed protein surface density. However, the increase in VN surface density deposited from solutions ≥10 μg/mL contrasts with Ponceau S staining, the Bradford assay, and XPS data.
An estimate of the minimum protein volume required for masking the roughness of the underlying substrate is obtained from bearing analysis of the AFM profile generated by bare TCPS. This yields a VN surface density of 1.7 μg/cm2, which exceeds the highest quantified VN surface density, of ∼0.5 μg/cm2 by a factor of three. Given that the adsorbed VN is not sufficient to fill in the roughness of the TCPS substrate surface, it is expected that only spot-like features associated with adsorbed VN aggregates are discernible.
We note that mTeSR1 is not a completely defined media, due to the presence of BSA. However, this is not expected to significantly alter our conclusion of a minimum threshold concentration of 5 μg/mL of VN to achieve a viable platform for long-term hESCs culture. A further examination of this threshold may be performed in a completely chemical defined xeno-free medium such as X-VIVO10. Although the field is moving toward the use of recombinant proteins, these proteins are cloned and expressed in animal cells that are a source of foreign antigen (Neu5Gc). Further, animal cells may provide an inappropriate glycosylation pattern to the protein of interest and thus render it inactive. Serum-derived proteins, despite being subject to lot-to-lot variability and the possibility of contamination from plasma, retain the biological activity of the protein. Future biotechnological innovations may provide the means to overcome these contradicting drawbacks in protein synthesis. 42
The observation of a minimum VN surface density raises the issue of its efficiency and cost effectiveness within the context of large-scale industrial manufacturing processes. Characterization and quantification of defined substrates suitable for hESCs expansion will render the translation of this technology into a scaled-up process for generating clinical-grade stem cells more feasible and reliable.20–22 As described above, the nonspecific adsorption of VN on TCPS results in ∼50% of VN in solution being deposited on the surface. Therefore, the production of large quantities of stem cells may benefit from an optimization of VN binding and VN bioactivity on these cell culture substrates.
Footnotes
Acknowledgments
This work was supported by the Joint Council Office, the Biomedical Research Council, the Science and Engineering Research Council, the Institute of Medical Biology, the Institute of Materials Research and Engineering, and the Bioprocessing Technology Institute of the Agency for Science, Technology and Research (A*STAR), Singapore.
Disclosure Statement
No competing financial interests exist.
References
Supplementary Material
Please find the following supplemental material available below.
For Open Access articles published under a Creative Commons License, all supplemental material carries the same license as the article it is associated with.
For non-Open Access articles published, all supplemental material carries a non-exclusive license, and permission requests for re-use of supplemental material or any part of supplemental material shall be sent directly to the copyright owner as specified in the copyright notice associated with the article.