
Abstract
In tissue engineering research, various three-dimensional (3D) techniques are available to study cell morphology, biomaterials, and their relations. To overcome disadvantages of frequently used imaging techniques, in the current study stereoimaging scanning electron microscopy (SEM) is proposed. First, the 3D SEM application was validated using a series of standardized microspheres. Thereafter, MC-3T3 cell morphology was visualized and cell parameters as cell height were quantified on titanium and calcium-phosphate materials using 3D reconstruction software. Besides 3D visualization of the cells, quantitative assessment showed significant substrate dependency of cell spreading in time. Such quantification of cell spreading kinetics can be used for optimization of tissue engineering scaffold surface properties. However, further standardization of SEM image acquisition and 3D SEM software settings are still essential for 3D cell analysis.
Introduction
In contrast to these micro-CT techniques, SEM can be used to analyze radiolucent materials as human tissue, radiodense materials as biomaterials and scaffolds, and the surface of radiopaque materials as titanium (Ti) implants and scaffolds. SEM creates highly magnified gray-scale images of the studied objects and approximately has a factor 1000×higher resolution than micro-CT. Also, SEM provides very high focus depth images, which give a pseudo-3D view. Still, only the surface of the samples can be analyzed. Newly developed SEM tools such as focus ion beam SEM can create and analyze the 3D structure4,5 immediately. However, such techniques are destructive so the original sample integrity will be lost.
To fill the obvious void in analysis techniques between micro-CT and routine SEM, stereoimaging SEM can be proposed. Weibel et al. already described practical stereological methods for morphological analysis of cells in 1966. 6 Stereoheight measurements in SEM were elucidated by Cripps et al. 7 3D stereoscopic imaging is used for various research purposes. Besides these virtual stereoscopic images, 3D morphometry information as depth, 3D profile, and volume can be generated from different structures and surfaces. Several studies describe algorithms and methods by8–10 , and nowadays specific 3D stereoscopic imaging software is commercially available.11–15 We can find the 3D SEM application in various research fields as in cosmetics, 16 food industry,17,18 wear of materials,19,20 and frequently in medical research.21,22 A major advantage is that this 3D SEM application could be used on mostly every material and specimen. Besides, the application is already combined and compared to other 3D imaging techniques as atomic force microscopy.23,24
However, such 3D SEM quantification has not been applied for tissue engineering scaffolds provided with cells, although this technique can yield important information.
In tissue engineering there is a constant focus on the improvement of scaffold materials. Overall design, physicochemical properties, and surface composition and roughness are modulated extensively to obtain smart scaffolds that can actively influence cell attachment, cell spreading, and cell morphology. However, it is difficult to study these phenomena quantitatively in the porous and/or nonopaque scaffold environments that are typical for tissue engineering.
Therefore, in the current study, SEM and 3D stereoimaging were combined to visualize and analyze 3D cell morphology25,26 and cellular interaction with biomaterials. We hypothesize that 3D SEM quantification could accurately be validated using standardized microspheres. Further we hypothesize that 3D SEM could be used to provide quantitative information of single cell spreading on the surface of a nonopaque scaffold material.
Materials and Methods
Three different sizes of polymethyl metacrylate microspheres (Fluka) were used: Ø 10, 20, and 100 μm. The microspheres were assessed on solid Ti discs (Ø 12 mm, 1.5 mm height), or mixed with calcium phosphate (CaP) cement. This cement consisted of 85% α-tri-calcium phosphate (α-TCP) sinterered powder (CAM Bioceramics BV), 10% CaP dibasic (Sigma), and 5% hydroxyapatite (Merck). A ratio of 380 μL (2%) Na2HPO4 (Merck) solution to 1 g CaP was used for hardening the cement. The final weight ratio of CaP to microspheres was 100 to 1. For each type of microsphere always at least 10 examples were selected at random for analysis. Subsequently, two types of biomaterial scaffolds were used for cell culture, that is, the Ti substrates, and preset CaP cement discs (Ø 6 mm, 3.0 mm height) made from the same material as above. These Ti and CaP discs were autoclaved and subsequently investigated with the addition of MC-3T3 cells.
Cell culture
Murine MC3T3-E1 subclone-14 preosteoblastic cells (ATCC) were cultured in α-Minimum Essential Medium (α-MEM) medium (Gibco BRL) supplemented with 10% fetal bovine serum at 37°C in an atmosphere of 100% humidity and 5% CO2. The complete medium was replaced every 1–2 days until subconfluency was reached. To study the cell morphology, cells were seeded on the surface of Ti or CaP scaffolds at a density of 5×10⁵/cm3. The cells were allowed to adhere to the scaffolds for 15, 30, 45, 60, 120, and 240 min until further analysis. Again, for each disc and at each time point, at least 10 representative cells were selected at random for analysis.
Scanning electron microscopy
Scaffolds with microspheres or cells were washed twice in phosphate-buffered saline and fixed for 5 min in 2% glutaraldehyde in 0.1 M sodium cacodylate buffer (pH 7.4), dehydrated in serial ethanol (70%, 80%, 90%, 96%, 100%, and filtered 100% ethanol) and dried using tetramethylsilane to air. The specimens were coated using a 30 nm thin layer of Au-Pd, using a Cressington Sputter Coater 208HR (Watford), while mounted onto Al stubs using carbon tape and imaged using a JEOL JSM 6330F Field Emission SEM (JEOL Corporation) operated at an accelerating voltage of 3 keV.
Three-dimensional scanning electron microscopy
Spheres were applied onto the Ti material, or into the CaP cement material. Standardized eucentric tilted high-quality SEM photomicrographs were collected at−5°C, 0°C, and+5°C and exported using the JEOL PC SEM V3.20 software package (JEOL). For imaging, the required illumination, contrast, sharpness, disparity, magnification, and tilting angle were determined. Also, SEM settings as working distance (WD), bar size, and eucentric tilting were recorded as these are essential for later 3D reconstruction and further 3D analysis.
Alicona MeX analysis
All tilted pairs of images of all samples, the calibration microspheres, and MC-3T3 cells on the different biomaterials were imported into Alicona MeX V4.1. software (Alicona Imaging GmbH). The SEM images were calibrated using the bar size, tilting angle, and WD, and subsequently a virtual anaglyph image was automatically created to get more insight into the real 3D structure. Both the path length (x-axis) and height (y-axis) of the calibration spheres and MC-3T3 cells were determined along the optimal axis using the primary profile analysis tool. Thereafter, the region of interest (ROI) of the cell was determined by selecting a defined area around the cell including cell processes using the volume analysis module. The Z-position of the reference plane was adjusted and defines finally the bounding frame of the base of the 3D model. The cutting plane was rotated around the x- and y-axis to set the volume of interest.
The total cell volume was calculated after adjusting and fine-tuning the surface of the cutting plane by visual inspection of the surface of the substrate and cutting plane.
After creating the final 3D volume of the object, all 3D data points were exported and saved in VRML2.0 (*.wrl) format files, which could be viewed with many plug-ins. To get more insight into the exact 3D model, the 3D data were imported and rendered using the more flexible 3D reconstruction software packages Rhinoceros V4.0 (Robert McNeel & Associates) and 3D Doctor (Able Software Corporation). Further, height and length of separate MC-3T3 cells on both Ti and CaP discs were determined by fine-tuning of the X, Y, and Z positions of the cutting plane.
Statistical analysis
Statistical analysis was performed to on the spreading of MC-3T3 cells on Ti versus CaP substrates. First, the spreading of the cells was calculated as the ratio of measured height over surface. Since not all combinations of CaP or Ti on different time points contained equal numbers of data, bootstrapping was used to resample the data 1000×and obtain estimated ratio's and standard deviations for each parameter. Subsequently, the ratios on the Ti and CaP material over time, and the differences between Ti and CaP were statistically compared using Student's t-test. The significance level was set at p<0.05. Calculations were performed in R™ (R Development Core Team).
Results and Discussion
Validation analysis
First, the 3D-SEM technique was validated on individual spheres using the profile analysis tool of the Alicona MeX software package (Fig. 1). The results on Ti showed that depth values ranged from 94 to 100 μm and width from Ø 95 to 100 μm for 100 μm microspheres. The diameter dimensions found for individual microspheres on Ti matched exactly with the Ø 10 and 20 μm materials used. However, the depth values varied in the CaP cements samples because of parts of the microspheres were situated within the cement.

Analysis of microspheres.
Initially, we had also performed the exact same study on the individual microspheres, using a conventional micro-CT system (Skyscan 1072; Kontich). In this approach it proved impossible to reliably quantify individual microspheres smaller than 20 μm (data not shown). Only the confirmed validation of 3D-SEM results obtained with the standardized microspheres allowed for subsequent 3D analysis of MC-3T3 cells.
Morphometric analysis
After the validation, the real 3D structure of cells was assessed (Fig. 2A). The profile analysis module of the Alicona MeX software was used to determine the object height and object width by drawing perpendicular multiple lines over the center of the object, as illustrated in Figure 2B and C. Both parameters were easily distilled from the profile graph. Thereafter, a slightly abundant ROI of the cell was determined by selecting a defined area around the cell to ensure that all cell processes were included, using the volume analysis module (Fig. 2D). The total cell volume was calculated after adjusting and fine-tuning the surface of the cutting plane by visual inspection of the surface of the substrate and cutting plane (Fig. 2E).
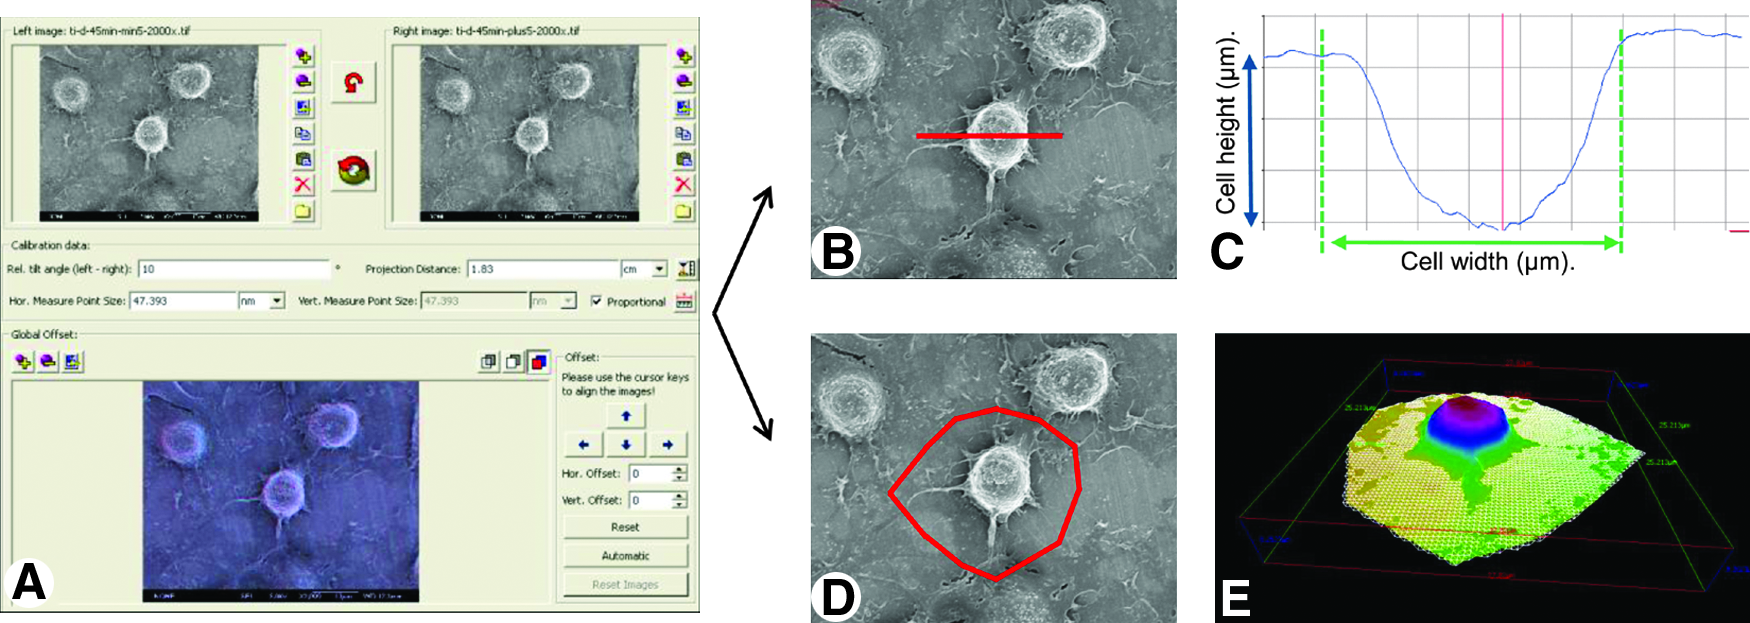
Quantitative analysis procedure.
After the measuring method was determined, the behavior of cells in time was regarded. Upon visual inspection of such SEM images, it was evident that the morphological shape of the cells changed in time. On Ti discs, the cells changed after 15–30 min from a spherical shape into more elongated phenotype, with branching membrane processes after 45 min (Fig. 3A–C). After 1 h, the cells became more flat and spread out on the surface. After 2 h the cells were completely flat and spread (Fig. 3D, E). On CaP discs, besides round spherical cells, some cells were already spread after 30 min showing extensive membrane processes. This difference in cell morphology in time clearly indicated a substrate dependency. After this visual inspection of the cell morphology, the cell volume, height, and width were quantified on both Ti (Fig. 3F–J) and CaP substrates in time. Logically, cell volume stayed equal and there were no significant differences in time or between substrates (data not shown). However, the quantitative data in the graph in Figure 3K show clearly the difference in spreading ratios of the MC-3T3 cells on Ti and CaP substrates in time. Initially, the cells render an equal measurement. However, the spreading ratio at each subsequent time period is significantly different between the materials (due to the totally completed cells spreading there are no measurement presented beyond the 60 min time point). The faster decrease in the cell spreading ratio of MC-3T3 cells on CaP discs indicates faster cell spreading compared to MC-3T3 cells on Ti discs. As expected, the surface chemical composition and/or rougher irregular surface of CaP discs initiated expeditious spreading of the MC-3T3 cells. In other words, this substrate dependency could be quantified on the basis of the 3D SEM method, as shown by the statistical differences in Figure 3K.
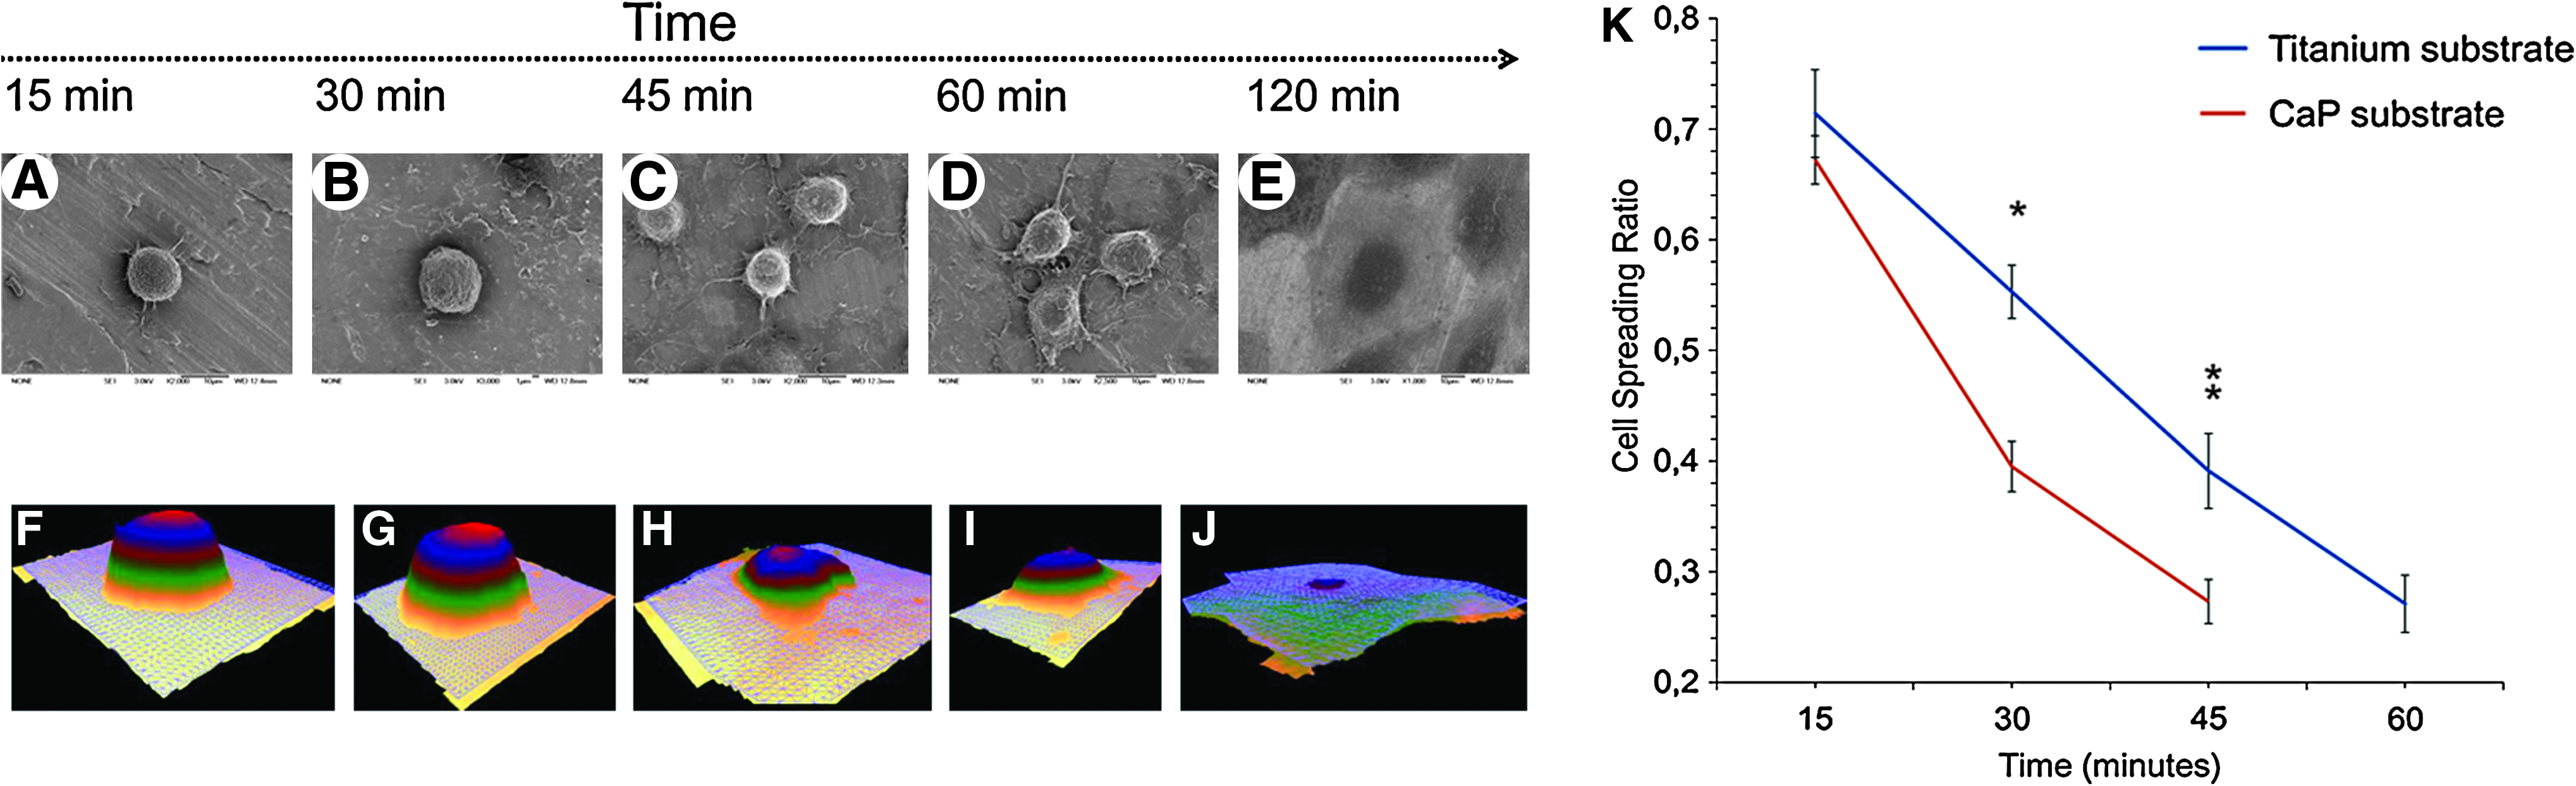
Cell spreading analysis.
In our analysis, the ROI, reference, and cutting plane adjustment is important for 3D analysis (Fig. 4). Especially for the rougher CaP material this proved critical (Fig. 4A–D). Incorrect ROI, reference, or cutting plane positions result in over- or underestimated results. When the cutting plane is placed lower, it becomes evident that material surface volume will erroneously get included in the estimation. For instance, when the plane is lowered by 0.1 μm, the volume increases by 3 μm3, which is 2% of the total volume. Opposite, when the cutting plane is placed too high, inclusion of cellular processes is lost, and for instance choosing a plane 0.1 μm too high results in the loss of 15 μm3 (i.e., 14%) of volumetric cell measurement (Fig. 4E–G). In other words, in our measurement system still careful visual inspection and adjustment of the cutting plane always had to be performed to achieve optimal final results. Reproducibility studies should be necessary to confirm these findings, as logically such results are highly dependent on user decisions. Still, it should be regarded more critical to develop standardization of the ROI, reference, and cutting planes. The development of further automation is required before this method of analysis can be routinely and swiftly applied on complex 3D scaffold architectures.

Cell morphology, substrate dependency, and critical software settings.
Calibration of the stereoscopic images is essential when using the Alicona MeX software algorithm for 3D SEM analysis. Bar sizes are automatically generated in the SEM acquisition, however, have to be transferred manually into the software module, so can causes errors in the X and Y dimensions. Second, the tilting angle is set by hand and also transferred into the software. To our experience this angle should be optimized dependent on the height of the sample, and generally lies in between −15°C and 15°C. In the current study values of −5°C and 5°C were found optimal. Related to the angle, also the WD will slightly vary and should be optimized by trial and error. An incorrect bar size causes errors in the X and Y dimensions, whereas incorrect tilting angle and WD provoke miscalculations and errors, all leading to inaccurate measurements and analysis. When optimal conditions are met, using the Alicona MeX software, relative basic software processing with easy to determine ROI and final volume of interest operations creates a final 3D model of the structure of interest.
A final remark would be the limitation of the technique as currently presented. Of course, by fixing and coating samples for SEM analysis still a technique is applied, which is destructive to samples, and thus longitudinal studies are not yet possible. However, such a shortcoming could be circumvented when using an environmental condition (e-SEM) approach, enabling true real-time measurements of spreading in time, and on the same sample.
Conclusion
In conclusion, we can maintain both our initial hypotheses. It was well possible to reliably validate stereo-SEM measurements using standardized microspheres. Further, 3D SEM stereoimaging is a useful and accurate tool to visualize and analyze 3D cell parameters, such as spreading and cell volume in tissue-engineered constructs. Besides 3D visualization of the cells, quantitative assessment showed significant substrate dependency of cell spreading in time. Such quantification of cell spreading kinetics can be used for optimization of tissue engineering scaffold surface properties. However, further standardization of SEM image acquisition and 3D SEM software settings are still essential for 3D cell analysis.
Footnotes
Acknowledgments
Three-dimensional stereo-SCM was performed at the Faculty of Science, Radboud University Nijmegen. The authors would like to thank the Microlab, Department of Geosciences, University of Delft, for the use of Alicona MeX software.
Disclosure Statement
No competing financial interests exist.