
Abstract
The three-dimensional environment is known to play an important role in promoting cell–matrix interactions. We have investigated the possibility of using Raman microspectroscopy—which has the great advantage of noninvasive sensing—for in vitro monitoring of extracellular matrix (ECM) formation in a medium-throughput pellet (3D) culture system with soft-litography, agarose-microwell arrays. Chondrocytes were seeded in the agarose microwells in basic or chondrocyte medium. After 3, 7, and 14 days of culture, samples were analyzed for ECM formation by Raman microspectroscopy, histology, and immunofluorescence. ECM formation in the chondrocyte medium-cultured samples was detected by histology and immunofluorescence, and also noninvasively by Raman microspectroscopy. The Raman band of collagen found at 937 cm−1 can be used as a Raman marker for collagen-containing ECM formation over time in the chondrocyte pellets. This culture system can be implemented as a medium-throughput platform for Raman applications and screening microtissue formation, since with these agarose-microwell arrays relatively large numbers of cell pellets could be screened in a short time in situ, without having to transfer the pellets onto microscopic slides. Moreover, in this manner the culture system is suitable for long-term, real-time live-cell measurements.
Introduction
We have investigated the possibility of using Raman microspectroscopy to monitor noninvasively the production of collagen-containing ECM in vitro. In this study chondrocytes and a medium-throughput pellet (3D) culture system with agarose-microwell arrays were used to evaluate the ECM formation.
Raman microspectroscopy allows the collection of data over a wide spectrum of nutrient, ECM, and cellular components of tissue-engineered samples at high-spatial resolution. 1 This vibrational spectroscopic technique employs an inelastic scattering effect (the Raman effect) to generate the molecular fingerprints of specific samples and to detect specific wavelength shifts caused by the vibrations of chemical bonds. The greatest advantage of Raman microspectroscopy is its noninvasive character 2 : it does not require any staining or special sample preparation steps. It has been shown that no cell damage is induced if suitable laser wavelengths and powers are used.3,4 Since the first application of Raman spectroscopy on cells, 5 this technique has been widely used for biological applications. High-resolution Raman spectral studies were performed and successfully applied to study cell cycle,6,7 cell death, 8 differentiation of cells,9,10 and, for example, chondrocyte response to bioactive scaffolds 11 in a noninvasive manner. Other researchers have reported in vivo measurements from the bladder and prostate, 12 esophagus, 13 skin, 14 the cervix,15,16 arteries, 17 and bone. 18
In cartilage engineering the monitoring of ECM products, such as collagen and glycosaminoglycans (GAG), is used to determine the tissue quality in tissue engineering. To obtain sufficient number of cells for tissue-engineering applications, chondrocytes are commonly expanded in two-dimensional monolayer-culture systems. However, this method of culturing is known to reduce the chondrogenic phenotype of primary chondrocytes with a resulting loss in their capability to form functional tissue.19,20 The main features of cartilage are also closely related to its 3D matrix of collagen and proteoglycans, which are generally lost in monolayer cultures. The 3D environment is known to play an important role in promoting cell–matrix interactions during chondrogenesis. 21
The increasing amount of ECM formation of chondrocytes in pellets over time leads to chemical and structural changes at the molecular level. In this study, we tested a hypothesis that these changes at the molecular level also change the vibrational spectra and Raman microspectroscopy can be used to detect these noninvasively. The results reported in this article show the feasibility of the Raman band specific for collagen found at 937 cm−1 to detect the increasing amount of collagen formation in chondrocyte pellets—already at day 3 of culture—in a noninvasive manner.
The micromolded nonadhesive hydrogels (agarose gel) used in this study are widely used and have already been applied to study self-assembly of complex cellular aggregates.22,23 Moreover, these pellet culture systems with soft-litography (agarose) microwells can also be applied as a medium-throughput platform for Raman applications and screening microtissue formation. The medium-throughput characteristic of the culture system means that with these agarose-microwell arrays relatively large numbers of cell pellets could be screened in a short time in situ without having to transfer the pellets onto microscopic slides for Raman measurements. In other words, using these agarose-microwell arrays a medium-throughput screening of the samples was possible.
Materials and Methods
Casting of agarose-microwell arrays
The agarose-microwell arrays were prepared with a soft-litography technique. Polydimethylsiloxane negative molds were used to routinely cast nonadherent microwell arrays in 3% agarose gel as described earlier. 22 Ultrapure© agarose (Invitrogen) was dissolved by heating in sterile phosphate-buffered saline (PBS; Gibco) to 3%. Seven milliliters of the dissolved agarose was pipetted into each well of a 6-well tissue-culture plate where the molds were previously placed (one mold/well) and centrifuged briefly to remove air bubbles. After setting in 4°C for 10 min, the solidified gels with the microwell arrays were separated from the mold using a spatula. The microwells were 200 μm in diameter.
Isolation of bovine chondrocytes and cell culture
Primary bovine chondrocytes were isolated from articular cartilage derived from the femoral-patellar groove of a 10-week-old calf by digestion with 10% collagenase type II (Worthington Biochemical). The freshly isolated—passage 0 (P0)—chondrocytes were subcultured in chondrocyte medium (CM): Dulbecco's modified Eagle's medium (Gibco) containing 10% fetal bovine serum (FBS; South American Origin; Biowhittaker, Lonza), 10 mM HEPES, penicillin G (100 units/mL; Invitrogen), streptomycin (100 μg/mL; Invitrogen), 0.1 mM nonessential amino acids (Sigma, St. Louis, MO), 0.4 mM proline (Sigma), and 0.2 mM ascorbic acid (Sigma) under an atmosphere of 5% carbon dioxide at 37°C.
After being cultured on tissue-culture plastic (T-flask; Nunc; Thermo Fischer Scientific), the chondrocytes (P1) were seeded on the previously prepared agarose-microwell arrays in basic (control) medium (BM) or in CM and spontaneously formed a pellet at the bottom of the microwells after 12 h. The BM contained Dulbecco's modified Eagle's medium supplemented with 10% FBS, penicillin G, and streptomycin. After 3, 7, and 14 days of culture period, samples were analyzed by histology, immunofluorescence, and Raman microspectroscopy.
Histology
After Raman measurements, samples were embedded in paraffin, sectioned at 5-μm intervals, and stained with Safranin-O (Sigma) for observation of sulfated GAGs (sGAG). This staining was also combined with Weigert's hematoxylin (Sigma) and Fast Green staining (Sigma) for the nuclei and cytoplasm, respectively.
Immunofluorescence
Immunofluorescent staining was performed on the deparaffinized 5-μm sections of the samples cultured in CM for 14 days. Collagen type 2 (Col2A1) monoclonal antibody (Purified mouse immunoglobulin IgG1, clone 3HH1-F9, Abnova, 1:100, diluted in PBS/BSA 1%) as primary antibody and Alexa Fluor 488-Goat antiMouse IgG1 (g1) (Molecular Probes, 1:1000, diluted in PBS/BSA 1%; Invitrogen) as a secondary antibody were used. The samples were also counterstained with 4′,6-diamidino-2-phenylindole (DAPI; Sigma). Samples were analyzed by using BD Pathway 435 Confocal bioimager (Becton Dickinson Biosciences).
Confocal Raman microscopy
Raman measurements were performed using a home-built confocal Raman spectrometer as described earlier. 24 Briefly, a Krypton ion laser (Coherent, Innova 90K) with an emission wavelength of 647.1 nm was used as the excitation source. A water immersion objective (Plan, Neofluar; Carl Zeiss; 63x, 1.0 NA) was used to illuminate the sample as well as to collect the Raman-scattered photons in the epi-detection mode. The scattered light was filtered by a razor-edge filter (Semrock) to suppress reflected laser light and Rayleigh-scattered light, and focused onto a pinhole of 15 μm diameter at the entrance of an imaging spectrograph/monochromator (HR460; Jobin-Yvon), which contained a blazed holographic grating with 600 grooves/mm. The spectrograph dispersed the Raman-scattered photons on an air-cooled electron-multiplying charge-coupled device (Newton DU-970N, Andor Technology). The system provided a spectral resolution of 1.85 to 2.85 cm−1/pixel over the wavenumber range from −20 to 3670 cm−1. Raman spectra were acquired in the so-called spectral scanning mode. In this measurement mode, a single full spectrum was obtained by raster scanning the laser beam with a laser power of 35 mW over an area of 17.5×17.5 μm in 30 s. The samples were scanned using a scanning mirror system (SM, MG325D, and G120D; General Scanning). The chondrocyte pellets were directly illuminated with the laser from the top and the scattered light is also collected with the same objective from the top. Since the pellets were not encapsulated with agarose—they were just seeded in the agarose microwells after the microwells were casted—the agarose material of the microwell did not interfere with the measurements.
Raman measurements were carried out both on living (nonfixed) and fixed chondrocyte pellets in situ in the microwells. First, the samples were washed with PBS (Gibco) (no fixation) and Raman spectra were acquired from three randomly chosen chondrocyte pellet samples from each condition and time point. After the short Raman measurements on the living chondrocyte pellets, samples were fixed in 2% paraformaldehyde and washed with PBS, and Raman spectra were acquired from 10 randomly chosen fixed pellets to collect statistically significant amount of Raman data for analysis.
As a reference, the Raman spectrum of pure collagen type II from bovine nasal septum (Sigma) was also obtained with a dry objective (Olympus Nederland B.V; 40x, 0.75 NA), 10 s accumulation time, and 35 mW laser power.
A spectrum from the substrate of the samples (agarose) was also taken—over the empty part of the agarose microwell—in the same focal plane as the focal plane in which the spectrum of a chondrocyte pellet was acquired.
A Raman calibration standard—toluene with accurately known peak frequences (521, 785, 1004, 1624, 2921, and 3054 cm1)—was used for wavenumber calibration of the spectra.
Raman data analysis
The preprocessing of the data were performed as described previously.25–27
The spectra were preprocessed by (1) removing cosmic ray events; (2) subtracting the camera offset noise (dark current); and (3) calibrating the wave number axis. The well-known band-positions were used to relate wavenumbers to pixels. The frequency-dependent optical detection efficiency of the setup was corrected using a tungsten halogen light source (Avalight-HAL; Avantes BV, Eerbeek) with a known emission spectrum. The detector-induced etaloning effect was compensated by this procedure.
After data correction, the 10 spectra from the pellets from each medium (BM or CM) on respective measurement days were averaged. Semi-quantitative univariate data analysis was performed by selecting specific vibrational bands of collagen in the averaged spectra from each medium condition and time point, and integrating each band after local baseline subtraction. Subsequently, band-area ratios were obtained from the collagen band over the integrated band of the nitrogen stretch-mode at 2328 cm−1 as an intensity standard. The calculations were made using normalized band-area ratios, not absolute values, so the system is rather semi-quantitative than quantitative monitoring of the collagen formation. Since we monitored the ECM formation in time using the same culture conditions, evaluating absolute values would not change the outcome of this article.
All data manipulations were performed using routines written in MATLAB 7.4 (The Math Works Inc.).
Results
Histology
Bright-field micrographs of the chondrocyte pellets in the agarose microwells (Fig. 1A) and measurements of pellet dimensions (Fig. 2) showed that the pellets incubated in CM grew extensively in size over time. Moreover, the Safranin-O staining of the samples demonstrated abundant sGAG production over time in CM (Fig. 1B). It was also noticeable that larger amounts of sGAGs were formed between day 7 and 14 of culture than between day 3 and 7 of culture.

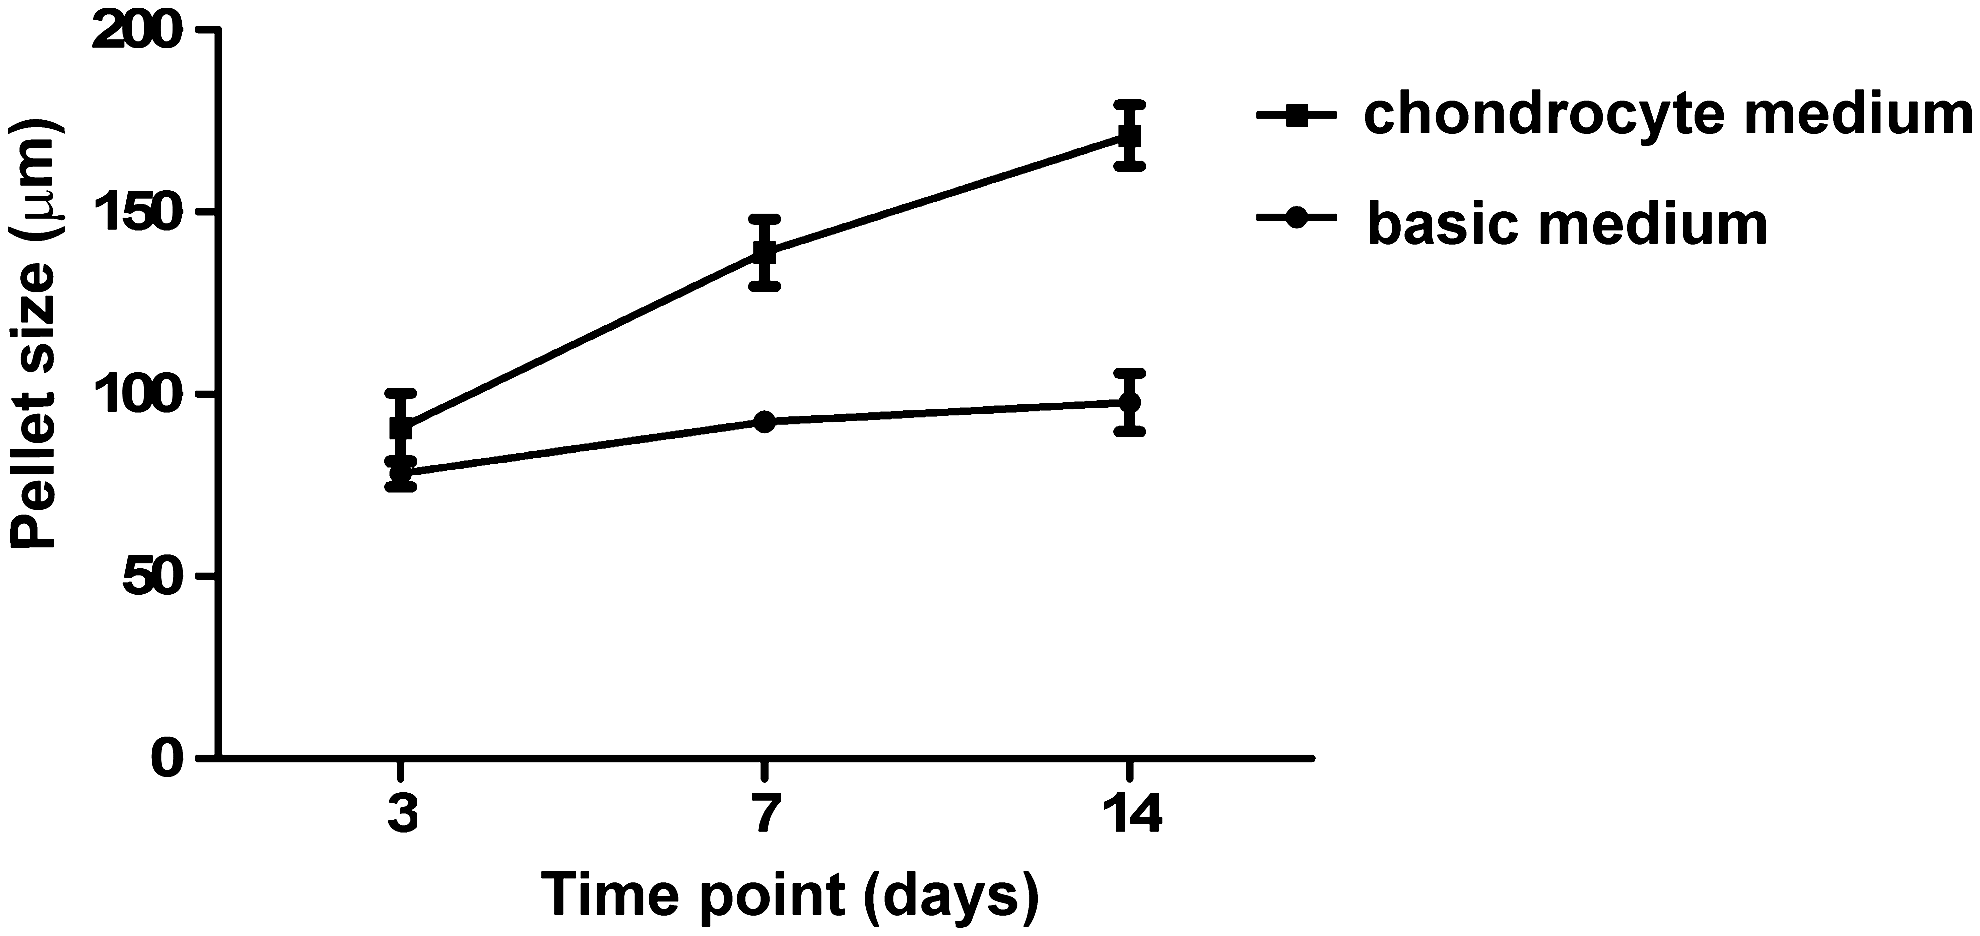
Size of the chondrocyte pellets cultured in CM or BM for 3, 7, and 14 days of culture. The samples cultured in CM grew extensively in size over time.
In contrast, the pellets cultured in BM did not grow in size and showed only a small amount of sGAG formation (Figs. 1C, D and 2).
Immunofluorescence
The chondrocyte pellets cultured for 14 days in CM were labeled with DAPI and collagen type 2 antibody. Samples from day 14 showed strong fluorescence with both DAPI (Fig. 3A, B—blue fluorescence) and collagen type 2 antibody (Fig. 3A, B—green fluorescence).

Immunofluorescent staining of chondrocyte pellets.
Confocal Raman microscopy and Raman data analysis
Average Raman spectra (n=10) of fixed chondrocyte pellets cultured in BM or CM were acquired by confocal Raman microspectroscopy after 3, 7, and 14 days of culture period (Fig. 4a–f). All spectra showed well-known bands corresponding to phenyl-alanine, 28 lipids/proteins, 29 and amide-I, 30 respectively (Table 1—see band assignments and wavelenghts). A notable difference between these spectra at 937 cm−1 had also occured. This band at 937 cm−1 is specific for collagen (proline/hydroxyproline/C-C skeletal of the collagen backbone). 31

As a reference, the Raman spectrum of collagen type II—the major type of collagen in cartilage—from bovine nasal septum was also obtained shown in Figure 4g. This reference spectrum showed the band at 937 cm−1 similar to the spectra of the chondrocyte pellets as shown in Figure 4a–f.
The results of the semi-quantitative univariate data analysis are shown in Figure 5 with the normalized band-area ratios for the band signifying collagen at 937 cm−1. The results shown in Figure 5 are based on the average spectra of chondrocyte pellets cultured in BM or CM after 3, 7, and 14 days of culture period. The normalized band-area ratio for collagen content had been significantly increased during the 14-day culture in CM. The collagen band could already be detected after 3 days of culturing and the contribution of collagen to the Raman spectra further increased from day 3 to 7 (p=0.3732) and from day 7 to 14 of the culture (p=0.0118).
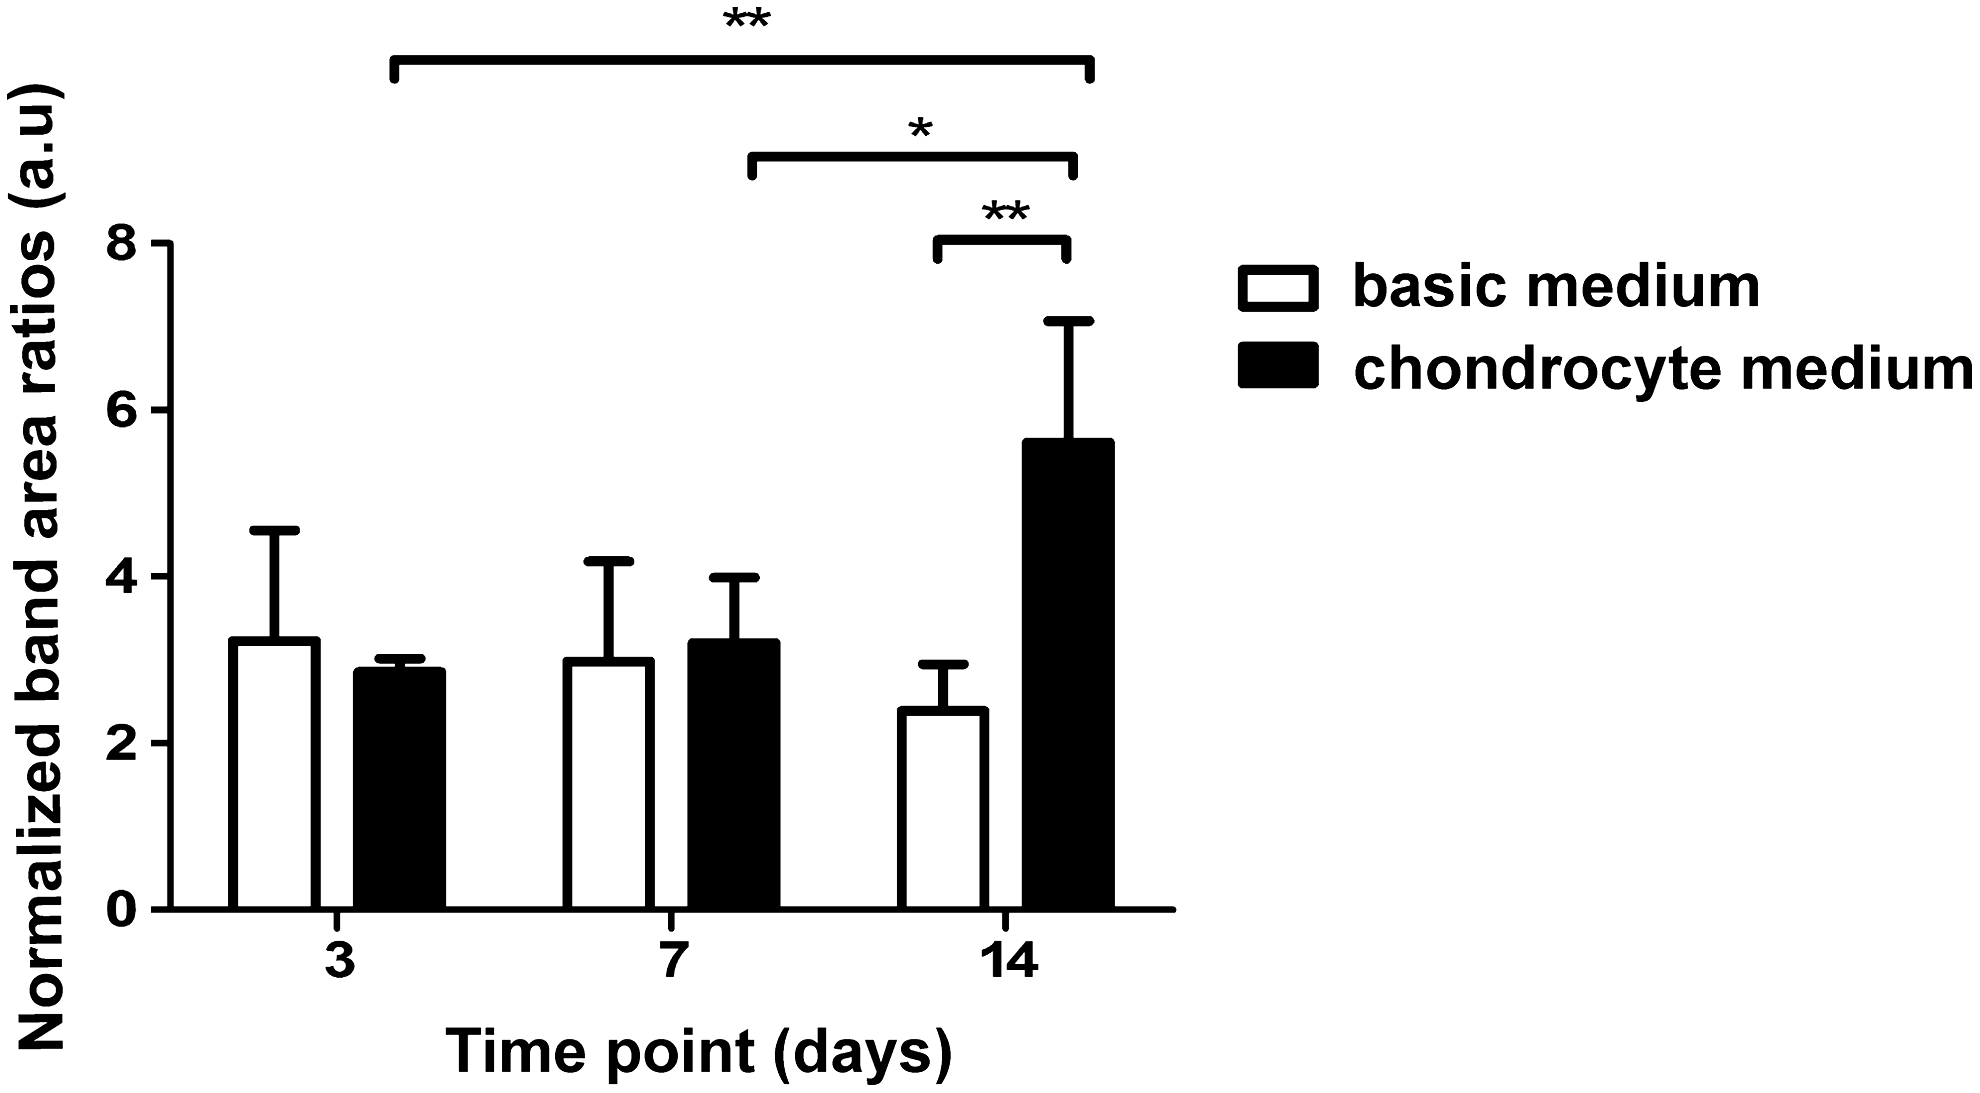
Semi-quantitative univariate data analysis shows normalized integrated band-area ratios of the collagen band for the spectra shown in Figure 4
Raman microspectroscopy is a very sensitive technique and can easily be hindered by background scattering of the measured samples. Therefore, a Raman spectrum from the agarose substrate of a chondrocyte pellet (Fig. 6B[b]) was also obtained and did not show any interfering bands at 937 cm−1.

In addition, Raman measurements were carried out on both living and fixed samples—cultured under the influence of CM for 14 days—in situ in the microwells to verify that the fixation process did not alter the Raman spectra of the samples. In the average Raman spectrum of the fixed chondrocyte pellets (n=10, Fig. 7b), no major changes could be observed compared with the average spectrum of the living chondrocytes (n=3, Fig. 7a).

Living versus fixed chondrocyte pellets.
Statistical analysis
Data were analyzed for statistical significance using the Student's t-test (Microsoft Excel, Microsoft Corporation).
Discussion
The aim of this study was to find specific Raman markers for the observation of chondrocyte differentiation. The results reported here showed the feasibility of Raman spectroscopy to detect collagen formation of chondrocyte pellets—already at day 3 of culture—in a noninvasive manner. The method described in our study is fundamentally different from the more conventional way of culturing, where pellets are formed in 10-mL centrifuge tubes, or in the wells of a 96-well (round-bottomed) tissue-culture plate and the pellets need to be transferred onto microscope slides for Raman measurements. Moreover, the cell pellets from any interested cell type can be constrained in a fixed position at the bottom of each microwell allowing for confocal measurements.
Bright-field micrographs of the chondrocyte pellets in the agarose microwells (Fig. 1A) and measurements of the pellet dimensions (Fig. 2) showed that pellets incubated in CM had grown extensively in size over time. Moreover, the Safranin-O staining of the samples demonstrated an abundant sGAG production already at 7 days of culture in CM (Fig. 1B). In contrast, the pellets cultured in BM did not grow in size and showed only minor amounts of GAG formation (Figs. 1C, D and 2) most likely because the BM does not contain any inductive factors, which can otherwise support ECM formation.
Collagen type II protein expression was also observed in the chondrocyte pellets—cultured for 14 days in CM—(Fig. 3A, B) by immunofluorescence. Although the initial aim of this study was not to identify the production of collagen specifically, but to evaluate the production of ECM components. However, we were able to show the change of collagen production during culture in the medium-throughput pellet culture system used in this study by Raman spectroscopy and immunofluorescence, and sGAG production by histology. The average spectra of the fixed (Fig. 4a–f) samples from each medium and time point showed well-known bands corresponding to phenyl-alanine, lipids/proteins, and amide-I, respectively, and the bands for collagen at 937 cm−1 (Table 1, band assignments).
To compare the intensities in the Raman spectra from different pellets on different days, we used the N2-stretch mode at 2328 cm−1 as an intensity standard for normalization. 32 The Raman signal from N2 originates from N2 in the ambient air in the optical beam path; therefore, it was a constant factor always presented in our measurements.
The normalized band-area ratios for collagen content had been significantly increased during the 14-day culture in CM (Fig. 5). Immunofluorescence confirmed the data obtained by Raman spectroscopy, indicating a specific collagen matrix deposition (Fig. 3). Moreover, the collagen band could already be detected after 3 days of culture and the contribution of collagen to the Raman spectra further increased from day 3 to 7 (p=0.3732) and from day 7 to 14 of the culture (p=0.0118). The significant increase between day 7 and 14 culture can be explained by the fact that the chondrocytes started to produce more collagen matrix after 7 days of culture. Figure 1B also shows that larger amounts of sGAGs were formed between day 7 and 14 of culture than between day 3 and 7 of culture.
Proline is known to be an essential amino acid in the production of collagen. Together with hydroxyproline and glycine, proline is the major constituent of the functional collagen molecule, also in collagen type II. Ascorbic acid can influence the collagen production of chondrocytes by modulating steady-state procollagen mRNA levels, 33 as well as through post-translational processing of procollagen. 34 The increasing amount of collagen could be the effect of proline and ascorbic acid added to the medium, since no specific differentiation growth factors—like TGFβ-3—was used in this study. This was also what confirmed by the fact that the pellets cultured in BM for 14 days showed a significantly lower amount of collagen compared with the collagen content in samples cultured in CM for 14 days (p=0.0017) (Fig. 5). The collagen deposition in the pellets cultured in the BM can possibly explained by the fact that direct cell–cell contact in the 3D pellet culture system was sufficient to induce matrix production in the cells without the addition of extra inductive factors.
Raman microspectroscopy is a very sensitive technique and can easily be hindered by background scattering of the measured samples. Therefore, a Raman spectrum from the agarose substrate of a chondrocyte pellet (Fig. 6B[b]) was also obtained and it did not show any interfering bands at 937 cm−1.
In addition, the average Raman spectrum of fixed chondrocyte pellets (n=10, Figure 7b) showed no major changes compared with the average spectrum of the nonfixed samples (n=3, Fig. 7a), indicating that the use of fixative—in this case 2% paraformaldehyde—had no major influence on the obtained Raman spectra. Therefore, the univariate data analysis and the statistical calculations could be safely made from the Raman data of the fixed pellets without interfering with the outcome of this study.
Conclusions
This study has demonstrated the feasibility of Raman spectroscopy to detect collagen-containing ECM formation in pellet culture systems in a noninvasive manner for future tissue-engineering purposes. In this study chondrocytes and a pellet (3D) culture system with agarose-microwell arrays were used to evaluate the ECM formation.
This agarose-microwell system can be implemented as a medium-throughput platform for Raman applications and screening microtissue formation, since relatively large numbers of cell pellets could be screened in a short time in situ, without having to transfer the pellets onto microscopic slides. Moreover, in this manner described here this culture system is also suitable for long-term, real-time live-cell measurements and 3D tissue formation.
In addition, Raman microspectroscopy provides a label-free and noninvasive tool for studying a wide spectrum of nutrient, ECM, and cellular components in tissue-engineered samples.
The future goal is to monitor the ECM formation—preferably in real time—in large and implantable cartilage constructs. In these future studies Raman microspectroscopy can possibly used as a quality-control tool and to evaluate proper cartilaginous matrix formation in tissue-engineered contructs.
Footnotes
Acknowledgments
We thank Dr. Vishnu Vardhan Pully for his technical assistance. This work was financially supported by the Dutch Program for Tissue Engineering through the Grant number TGT.6737.
Disclosure Statement
No competing financial interests exist.