
Abstract
Inhomogeneous and uncontrolled cellular and tissue responses in bone tissue engineering constructs, as a result of heterogeneous oxygen delivery throughout the scaffold volume, is one of the hurdles hampering clinical transfer of cell–scaffold combinations. This study presents an accurate and computationally efficient one-dimensional model that predicts the oxygen distribution for a regular cell-seeded scaffold in a perfusion bioreactor and the maximum (i.e., critical) scaffold length (Lmax) as a function of given oxygen constraints. After validation against computational fluid dynamics models, the one-dimensional model was applied to calculate Lmax in the perfusion direction, to ensure appropriate oxygen levels throughout the bone tissue engineering construct during in vitro culture. Both cell-related (cell density and oxygen consumption rate) and bioreactor-related (oxygen constraints and flow rate) culture parameters were varied. Results demonstrated the substantial influence of the culture parameters on Lmax. In conclusion, the presented computational tool was able to predict oxygen distribution and maximum scaffold length for regular cell-seeded scaffold. It can be used to design perfusion experiments wherein quantitative knowledge on both oxygen and flow characteristics is needed.
Introduction
Studies performed in vitro have shown that inhomogeneous delivery of oxygen throughout the TE construct volume can lead to inhomogeneous cellular and tissue responses. Local reduction of cell viability has been attributed to too low levels of oxygen tension, whereas increased cell density at the scaffold borders have been related to high levels of oxygen tension.8–11 These phenomena can be expected to become even more important with increased bone defect size, thus rendering the so-called upscaling of tissue engineering constructs to clinically relevant sizes a major challenge.12,13 Oxygen availability has been considered as a limiting factor for scaffold upscaling, 14 because of the low solubility and diffusivity of oxygen in culture medium, opposed to high cellular oxygen consumption. 15 Apart from its effect on cell viability, other studies have demonstrated that cell proliferation and differentiation are influenced by oxygen tension as well.8,16,17 Limiting ourselves to skeletal applications, low oxygen tension (oxygen levels around 5%) has been found to enhance the proliferation of progenitor cells and to stimulate chondrogenesis.18–21 Conflicting results have been reported with respect to osteogenic differentiation: some studies found enhanced osteogenesis at low oxygen tension, but this was not confirmed by others.22–24
All these studies suggest that oxygen tension is a crucial environmental signal that needs to be controlled during in vitro culturing. Perfusion bioreactors can be used to influence and control the oxygen tension inside TE constructs and to ensure adequate oxygen delivery by advective transport. At the same time, construct perfusion will also influence fluid flow-induced shear stresses, another environmental signal that has been shown to influence cell behavior. 25 Focusing here on the 3D culture of osteogenic cells in scaffolds, both proliferation and osteogenic differentiation can be enhanced by fluid flow, but conflicting results have been reported with respect to the corresponding values of wall shear stress (WSS).26,27 Excessive values in the order of 50 mPa have been related to increased cell apoptosis. 28
Quantification of both oxygen tension and WSS is crucial when studying the role of scaffold perfusion in tissue engineering. Different approaches have been taken to quantitatively study both the oxygen and the WSS distribution inside porous scaffolds. Regarding the quantification of the shear stress either analytical formulae or computational fluid dynamics (CFD) models were used.29–31 Experimental techniques such as microparticle imaging velocimetry (μ-PIV) can be used as well, either or not in combination with CFD calculations. 32
Similarly, computational models have been used extensively to quantify the oxygen distribution inside a perfused, cell-seeded scaffold.33–35 Cioffi et al. compared two CFD modeling approaches to predict the oxygen tension inside a perfused, irregular scaffold for cartilage engineering. 35 On the one hand, a microscale model was created, which considered the heterogeneous flow through the microarchitecture. On the other hand, a macroscale model was created as well, considering only the permeability and the porous medium flow through the scaffold. They demonstrated that the macroscale model was sufficiently accurate to predict the oxygen gradient along the flow direction, compared with a computationally more expensive microscale model. It must be noticed that in the microscale model the cells that consume oxygen were assumed to be homogeneously distributed throughout the fluid volume (pore volume). In reality, cells are attached to the scaffold surface, leading to a heterogeneous cell distribution and additional oxygen gradients, perpendicular to the scaffold surface. These gradients may affect the comparison between a microscale and macroscale modeling approach and, therefore, the validity of the macroscale approach. Further, the scaffold considered in this study was an irregular scaffold for which the geometry was reconstructed using microfocus computed tomography (μCT) images. The large computational cost, associated with a microscale model, did not allow modeling the entire scaffold. Hence, only part of it that served as a region of interest (representative volume) was considered and symmetry boundary conditions were assumed on the lateral walls of the region of interest. Maes et al., in another μCT-based CFD study of flow in irregular scaffolds, demonstrated that the size of the considered region of interest as well as the presence of the boundary conditions on the lateral walls can strongly influence the simulation results. 36 These results warrant for a careful selection of a region of interest and interpretation of model results, especially for strongly heterogeneous scaffolds.
In this context, it is easy to understand the advantage of using designed, regular scaffolds that are based on a repeatable unit cell geometry, in terms of both computational cost and model accuracy. Owing to the symmetry of the scaffold structure, the flow field will be symmetrical as well. The definition of a smaller region of interest becomes straightforward and the assumption of symmetry boundary conditions is fully valid.
The goals of this study are twofold. First, an accurate but, at the same time, computationally efficient model will be determined to predict the oxygen distribution for a regular cell-seeded scaffold in a perfusion bioreactor for a given cell type and density (i.e., snapshot of the cell-seeded scaffold, not taking into account any temporal changes in the cell density). Related to this first goal, we hypothesize that a computationally efficient one-dimensional (1D) model is sufficiently accurate to capture the oxygen distribution. Second, the 1D model will be applied to predict the maximum (i.e., critical) scaffold length as a function of given oxygen constraints. Both goals will be elaborated and illustrated by making use of a regular cell-seeded Ti6Al4V scaffold in an in-house–developed perfusion bioreactor. 32
Materials and Methods
Experimental setup
The experimental test case in this study was a one unit cell high version of an additive manufacturing (AM) Ti6Al4V scaffold produced by Selective Laser Sintering (SLS). This scaffold represents a simplification of the full AM 3D version and its design allows for a reliable representation of the flow field by considering just one unit cell. The scaffold overall dimensions are 6×10×0.5 mm3. The geometric features of the scaffold are shown in Figure 1 and consist of a regular structure with 0.5 mm by 0.5 mm struts and 0.3-mm-wide channels at a 45° angle with respect to the flow direction. The construct is perfused in a so-called 2D+ bioreactor chamber, which permits the real-time visualization of the fluid flow through the channels of the scaffold. A detailed description of this setup can be found in ref. 32
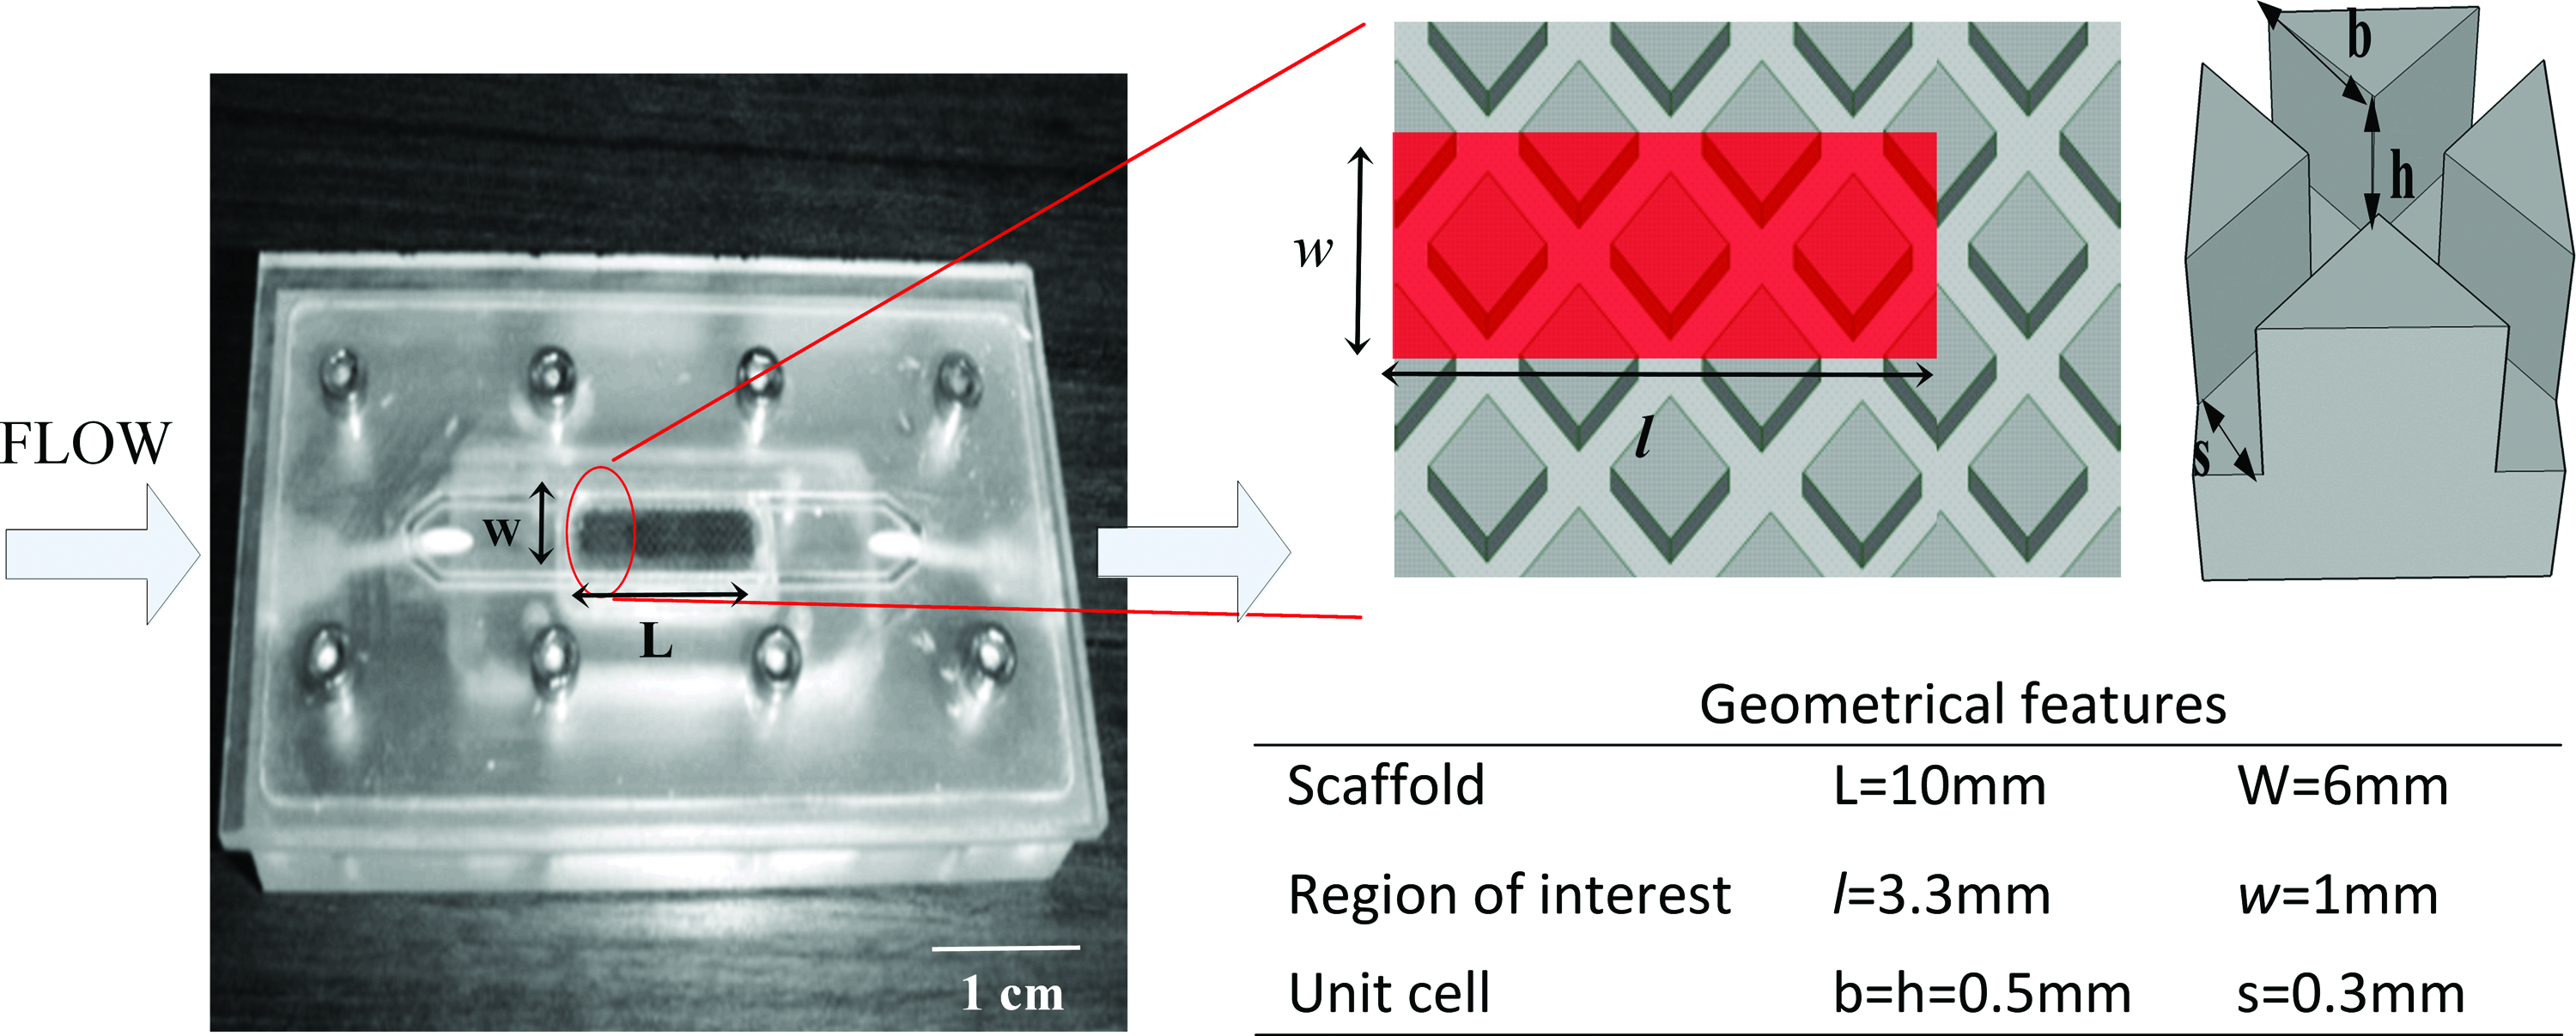
Perfusion 2D+ bioreactor (left) with part of the scaffold design and an enlargement of the unit cell (top right). The red zone represents the modeled region of interest. The white arrows represent the flow direction (left). The geometrical features of the scaffold and the modeled region of interest are summarized in the table (bottom right). Color images available online at
Computational models
Model description
Four different models (further denoted as model A to D) were developed to describe the medium flow and oxygen transport in a regular, cell-seeded scaffold. A description of the model characteristics in terms of the modeling of medium flow, oxygen transport (including oxygen consumption by the cells present in the scaffold), and the distribution of the cells inside the scaffold is given as follows. Each model has its own level of complexity, with model A being the most complex (and therefore most realistic with respect to the experimental conditions) and model D the simplest.
Three of the four models were CFD models of the culture medium flow inside the 2D+ scaffold: two detailed models (models A and B), both solving the Navier-Stokes equation, and one porous model (model C), solving Darcy's law.
The ACIS-based solid modeler Gambit 2.2 (Fluent) was used to build the 3D geometry and the mesh. The finite volume code Fluent 6.3 (Fluent) was used to set up and solve the CFD problem. Because of symmetry and repeatability of the scaffold geometry and flow field, the width and the length of the domain were limited to one and three unit cells, respectively. The fluid domain, corresponding to the region of interest in Figure 1, is depicted in Figure 2 and measured 5.3 mm in length (2 mm for the inlet region and 3.3 mm for the three unit cells), 1 mm in width, and 0.5 mm in height. The culture medium was modeled as an incompressible and homogeneous Newtonian fluid with a viscosity of 10−3 Pa s and a density of 103 kg/m3.

Geometry representation of the modeled fluid domain and boundary conditions. The white arrows represent the flow direction.
Detailed models (A and B): The detailed models A and B were built to evaluate the influence of the local microstructure on the velocity field and consequently on the oxygen distribution. The actual scaffold geometry was considered and the flow was described by means of the steady-state Navier-Stokes equation:
where ρ and μ are, respectively, the medium density and viscosity; p and
Porous model (C): The fluid-filled scaffold was considered as a porous continuous medium with a permeability K of 1.84×10⁻⁹ m2, as calculated by means of the detailed model A, and a porosity Φ of 61% (ratio between fluid volume and total volume). The porous medium flow was described by means of Darcy's law:
where
To compare this model with the detailed models described in the previous section, the same symmetric fluid domain was taken into account and the same boundary conditions were assigned. The mesh presented 182,384 tetrahedral volumes and the average tetrahedral edge length was 50 μm.
For both the detailed (A and B) and porous (C) models, the oxygen distribution inside the domain was obtained by solving the steady-state conservation law, taking into account advection, diffusion, and consumption:
where c is the oxygen concentration, expressed in terms of mass fraction (ratio between oxygen mass and fluid mass); D is the diffusion coefficient of oxygen (equal to 3×10⁻⁹ m2/s when assuming water as diffusion medium); and r is the volumetric oxygen consumption rate (in kg/[s m3]), which is assumed to follow a Michaelis-Menten (MM) kinetic law:
In the equation (4), rmax is the maximum volumetric consumption rate and k
m
corresponds to the oxygen concentration at which the consumption rate is equal to half of rmax. For a given cellular maximum consumption rate rmax,cell, the maximum volumetric consumption rate rmax is given by
with N being the total number of seeded cells and V the fluid volume to which cells (and therefore consumption) are assigned.
1D model (D): A further model simplification was developed to capture the oxygen distribution along the length of the scaffold (i.e., along the flow direction). In this case, a 1D mass conservation law was considered, assuming a constant (mean) velocity and neglecting the diffusive phenomena:
where x is the coordinate relative to the scaffold length (i.e., in the flow direction). The Matlab 7.1 code was used to solve this nonlinear equation by means of the finite difference method (FDM). A uniform grid with an element size of 10 μm was created and a backward finite difference scheme having a first-order approximation was adopted.
Cell distribution: Figure 3 shows how, for the three CFD models (A to C), the same number of cells was distributed into the fluid domain. In model A, the cells were considered to be attached (as a cell layer) to the scaffold walls and to the bottom walls of the channels. This was implemented by only assigning a consumption term in a 10-μm-thick fluid layer at the wall surfaces, resulting in a nonuniform oxygen consumption throughout the fluid domain (zero consumption outside the 10-μm-thick layer). In model B, the cells are assumed to be uniformly distributed throughout the entire fluid volume (equal in this case to the scaffold pore volume), similar to that in a previous study, 35 thus resulting in uniform oxygen consumption. Finally, as model C and also model D do not take into account the detailed architecture of the scaffold (and, therefore, do not make a distinction between scaffold pore volume and strut volume), the cells are assumed to occupy the entire region of interest (i.e., the red area in Fig. 1). The values for the volume to which cellular consumption was assigned [V in equation (5)] for the different models are summarized in Table 1.

Geometry of the scaffold unit cell with representation of the distribution of the oxygen-consuming cells for the detailed
The value of rmax for the different models was calculated according to equation (5), with N=62×103 and rmax,cell=3.8×10⁻¹⁷ mol/cell (ES cells 37 ).
Model evaluation
The accuracy in terms of the predicted distribution of oxygen tension pO2 was evaluated for each model, with model A being the reference model as it represents best the actual scaffold geometry and cell distribution. As an accurate prediction can be expected to be most challenging when strong oxygen gradients are encountered, culture conditions that favor such gradients were selected. This was achieved by selecting high maximum volumetric consumption rates—which in turn was obtained by choosing a high cellular consumption rate and a high cell density—and low bioreactor inlet velocities
For
Apart from strong oxygen gradients, it was important to assess model accuracy over a broad range of oxygen values, so that the effect of the MM nonlinear consumption rate, embedded in the MM kinetic law, could be determined. To this end, it is important that pO2 values in the range of km are encountered. The value adopted for km corresponded to an oxygen tension of 0.68%, a value previously used for ES cells. 37 The oxygen tension at the bioreactor inlet (pO2in) was taken equal to 5%. In combination with the selected volumetric consumption rate and the lowest inlet velocity (0.03 mm/s), it was verified that these conditions led to complete oxygen depletion at the outlet of the modeled region of interest (pO2out=0) (as will be shown in the Results section).
Model application: Scaffold upscaling
Once the model with the lowest computational cost that was able to accurately predict the oxygen tension along the flow direction was selected, it was applied to scaffold upscaling. To this end, the maximum (i.e., critical) scaffold length Lmax, which ensured appropriate oxygen tension levels throughout the cell-seeded scaffold, was determined as a function of both cell- and bioreactor-related parameters. Cell-related parameters included cell density and oxygen consumption rate, and bioreactor-related parameters concerned the oxygen constraints and bioreactor inlet velocity. The selected parameter values are summarized in Table 2. Cellular consumption rates corresponded to the values that were mentioned before for chondrocytes (low consumption rate 10 ) and ES cells (high consumption rate 37 ). As to the oxygen constraints, two target ranges of oxygen tension were selected: one corresponding to low values ([pO2in, pO2out]=[5%, 1%]) and one corresponding to high values ([pO2in, pO2out]=[21%, 10%]). Low values may be considered as an oxygen regime to promote the proliferation of progenitor cells (as mentioned earlier, see, e.g., ref. 18 ), whereas high values may (or may not) enhance osteogenic differentiation (see, e.g., ref. 24 ). As the goal is to merely illustrate the potential of the model for a number of selected oxygen constraints, the biological effect of these oxygen levels is not important in this setting.
L and H refer to low and high values, respectively.
The bioreactor inlet velocity
Results
Model evaluation
Oxygen distribution was evaluated for all four models in both the longitudinal (along the flow direction, x direction in Fig. 4A) and transverse (perpendicular to flow direction, y direction in Fig. 4A) directions. As to the longitudinal direction, several cross sections were considered perpendicular to it and for each cross section the average oxygen tension was calculated (Fig. 4B, D). For an inlet velocity of 0.03 mm/s, all four models predicted the same trend for the oxygen tension in the longitudinal direction: a linear decrease in the first part of the scaffold followed by a logarithmic decrease, leading to complete oxygen depletion at the outlet (Fig. 4B). In the transverse direction, models A and B presented a nonuniform oxygen distribution, whereas models C and D led to a constant oxygen tension (Fig. 4C; evaluated along a line, perpendicular to the longitudinal direction, at x=1 mm and z=0 mm). For the selected line, the absolute difference in terms of oxygen tension was smaller than 0.2% oxygen between models A and B, whereas it was smaller than 0.3% and 0.4%, respectively, between models A and C and between models A and D.

Oxygen distribution in a 2D+ bioreactor for a cell seeding density ρcell of 32×106 cells/mL, a maximum cellular consumption rate rmax,cell of 3.8×10⁻¹⁷ mol/(cell s) (ES cells
37
) and an inlet oxygen tension of 5%. Oxygen values were calculated by means of two detailed CFD models (models A and B), a porous CFD model (model C), and a one-dimensional model (model D).
For an inlet velocity of 0.1 mm/s, the agreement between the different models was confirmed, as shown in Figure 4D. In this case, a linear decrease of oxygen tension as a function of the longitudinal distance was predicted for the entire modeled region. The absolute difference in terms of oxygen tension, evaluated in the line selected in the transverse direction (Fig. 4A), was smaller than 0.09% between models A and B, whereas it was smaller than 0.13% and 0.15%, respectively, between models A and C and between models A and D.
As there were small differences in oxygen tension between all models, model D was preferred for studying scaffold upscaling, because of its low computational cost.
Model application: Scaffold upscaling
Prior to the application of model D to scaffold upscaling, the WSS distribution was studied to determine an upper limit for the inlet velocity

Wall shear stress contour plot in the modeled scaffold region for the detailed models A and B for an inlet velocity of 0.1 mm/s. Color images available online at
The results for the maximum scaffold length Lmax, as iteratively predicted by model D for different culture parameters, are shown in Figure 6. It can be noticed that Lmax is inversely proportional to the cell-seeding density. For instance, for the oxygen target range of [5%, 1%], its value decreases from 48.9 mm for 106 cells/mL to 1.5 mm for 32×106 cells/mL in case of an inlet velocity of 0.03 mm/s. Moreover, for this oxygen range and a cell density of 10×106 cells/mL, increasing the inlet velocity
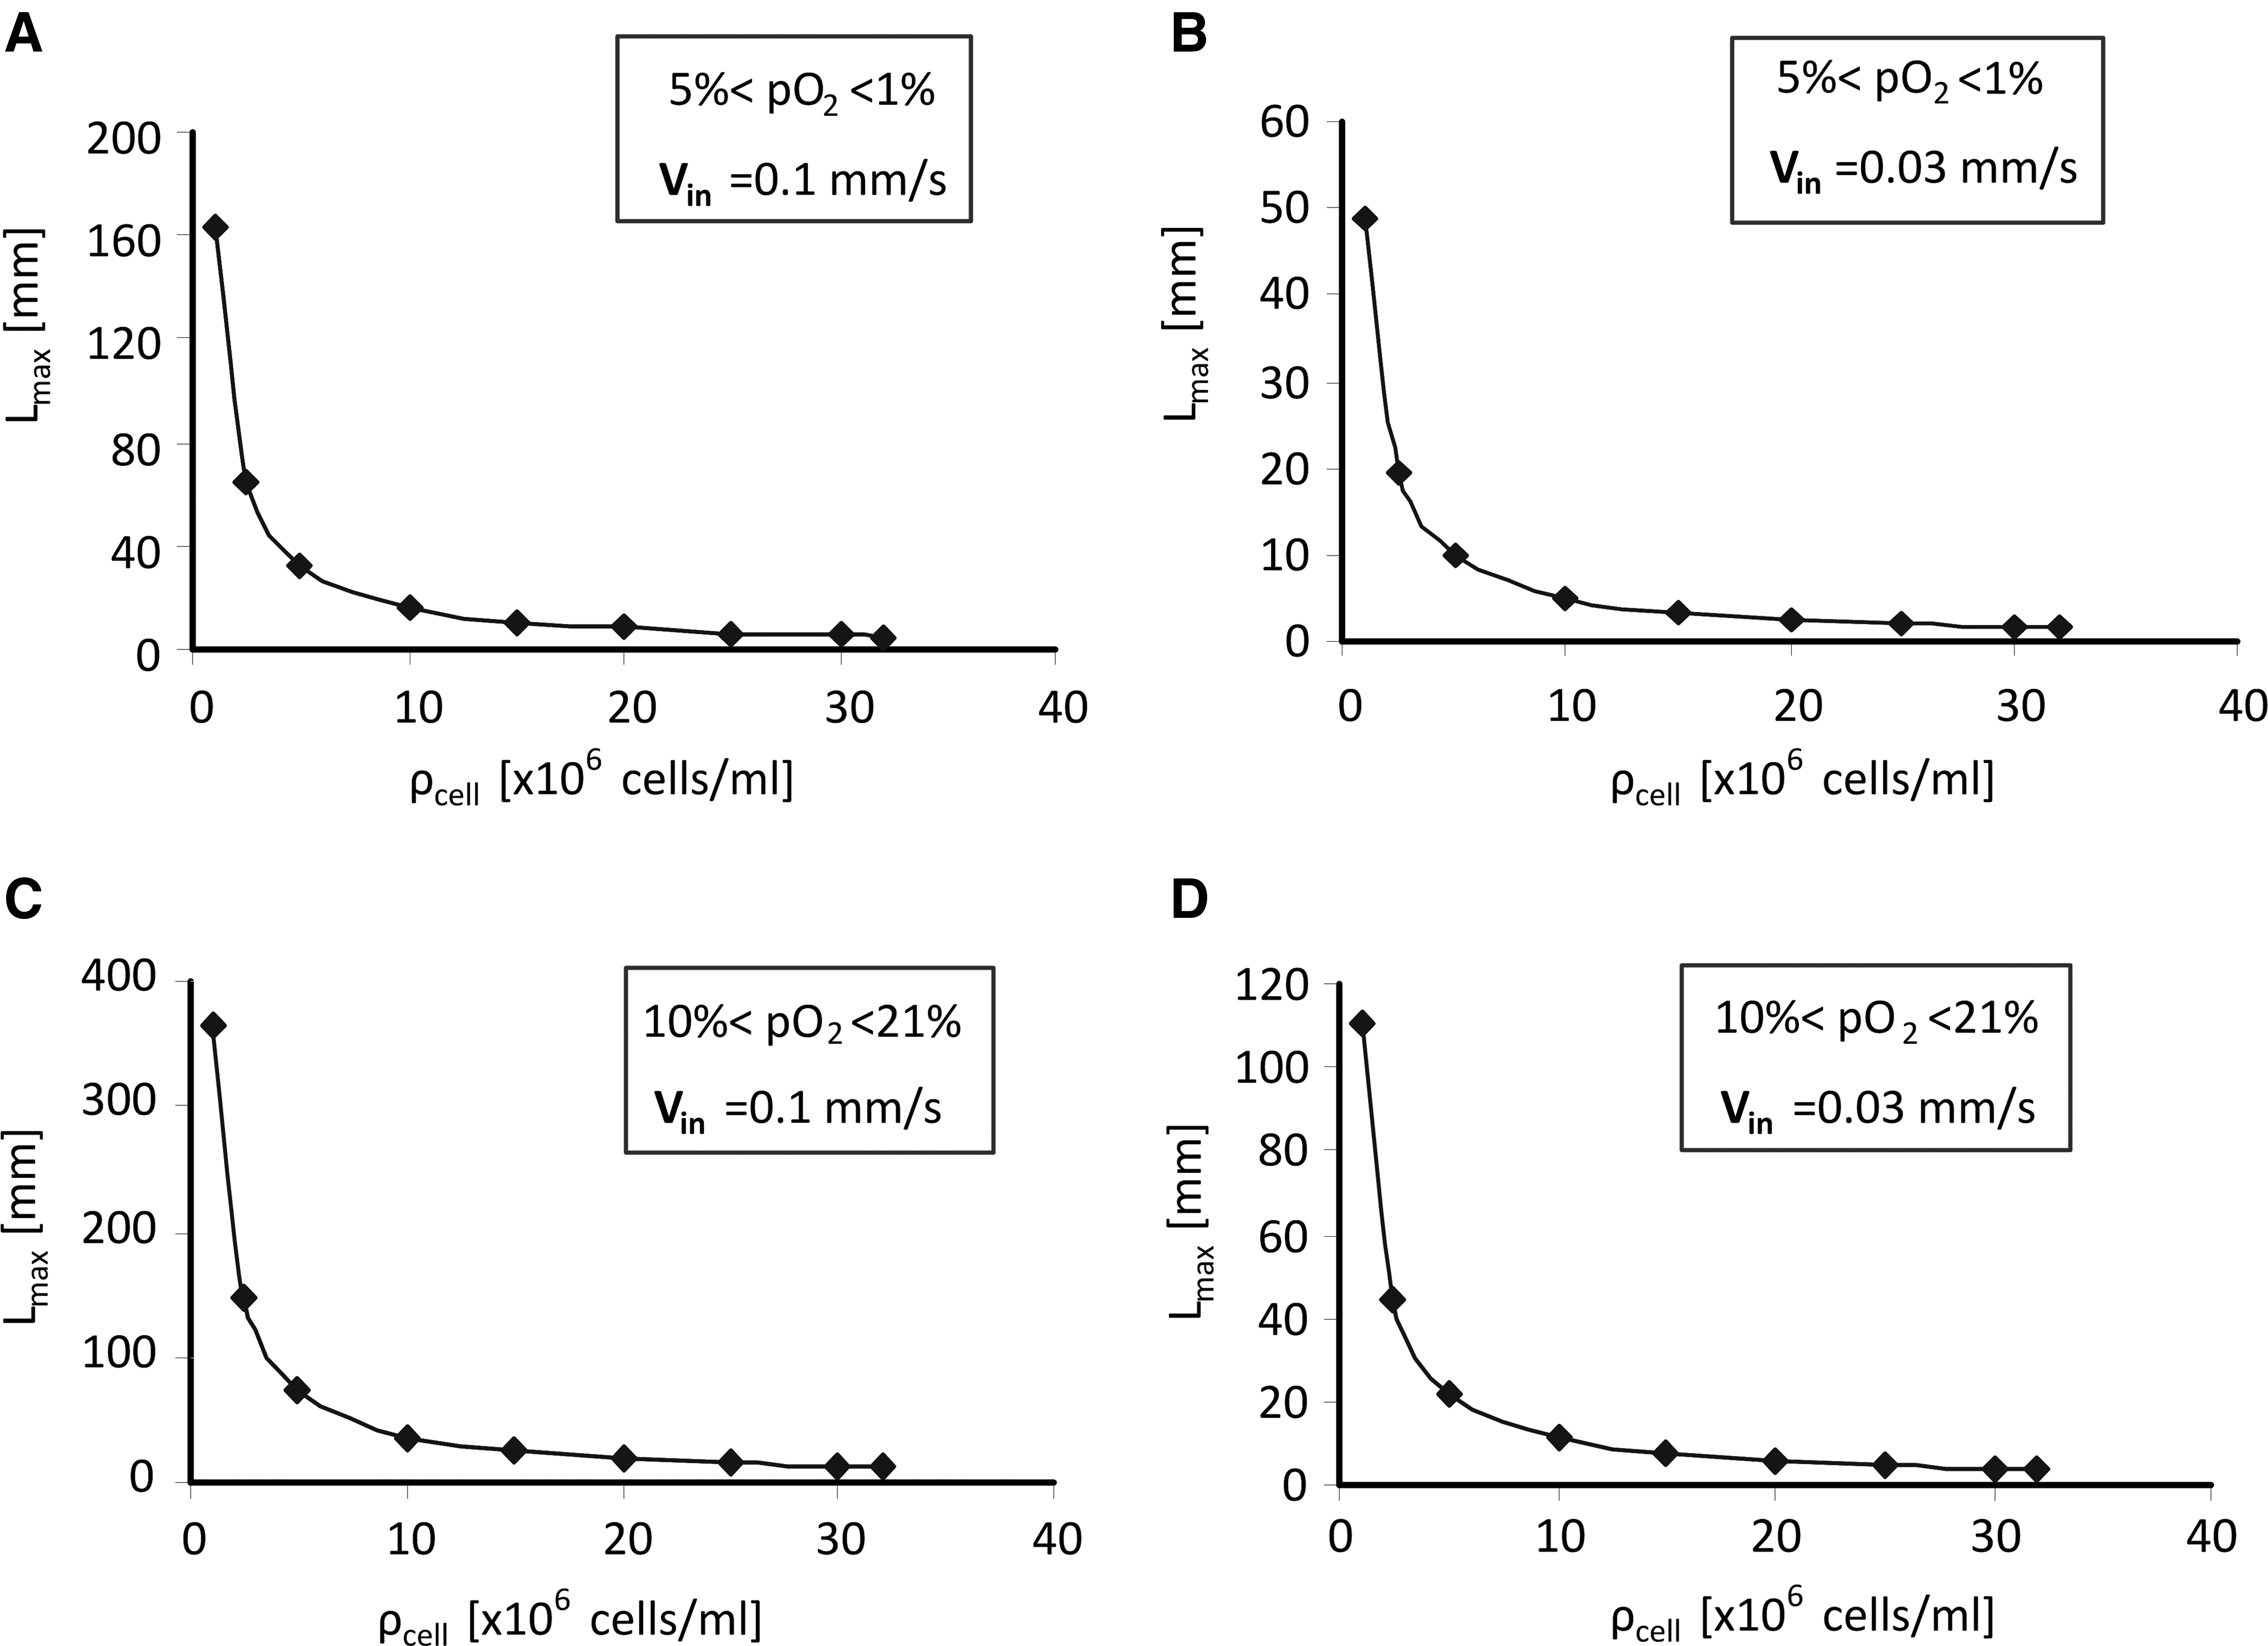
Maximum scaffold length Lmax as a function of cell seeding density ρcell, as predicted by model D. Results are shown for low ([pO2in, pO2out]=[5%, 1%])
The effect of combined changes of all culture parameters on Lmax is summarized in Table 4. The high (H) and low (L) values for the inlet velocity
Low (L) and high (H) values for
Discussion
The first part of this study was focused on the determination of the most efficient computational model (in terms of computational cost) that is still sufficiently accurate in capturing the oxygen tension inside a regular cell-seeded scaffold, placed in a perfusion bioreactor. As was evident from Figure 4B and D, all models predicted very similar results for the oxygen gradients in the longitudinal (i.e., flow) direction, with the maximum error between the most complex (detailed CFD model A) and the simplest model (1D model D) being only 0.4% in terms of average oxygen tension. For the oxygen gradients in the transverse direction, the models behaved differently (Fig. 4C, E). Owing to its porous medium description, model C had a constant velocity (uniform velocity field) and a uniform oxygen consumption in each cross-section perpendicular to the flow direction. As a result, oxygen tension was constant in a transverse direction. As model D only took into account the change of oxygen tension in the longitudinal direction [see also equation (6)], it inherently led to a constant value of oxygen tension in a transverse direction as well. On the contrary, for models A and B, a nonuniform oxygen distribution was found in the transverse direction, owing to the nonuniform cell distribution (for model A) and the nonuniform velocity field (for models A and B). Despite this qualitatively different behavior, the absolute differences between models A and D remained low in the transverse direction as well, with the maximum error being located in the regions close to the scaffold walls and being less than 0.4% of oxygen tension. As it is unlikely that such small errors in oxygen tension would be relevant for predicting a biological outcome, it was concluded that model D is the most appropriate (computationally most efficient) model for the application envisioned here, which is the prediction of a maximum scaffold length for a given target range of oxygen tension and cell type. Moreover, given the fact that model comparison was performed for conditions that led to strong (local) oxygen gradients (due to high cell densities and cellular consumption rates) and for oxygen values that covered the entire range of the MM kinetic law (including the nonlinear part), it strengthens the applicability of model D to these more challenging (from a computational point of view) culture conditions. These results confirm the research hypothesis on the accuracy of the 1D model.
The nonlinear consumption rate, expressed by the MM kinetic law, becomes important for oxygen tensions in the range of km (which can also be appreciated from Fig. 4). This can be clearly seen in Figure 4B, wherein a nonlinear oxygen gradient was found in the longitudinal direction for the lowest (0.03 mm/s) inlet velocity. In contrast, for the higher (0.1 mm/s) inlet velocity, oxygen tensions were well above km, leading to a linear oxygen gradient (Fig. 4D). These results also imply that for sufficiently large oxygen tension (pO2≫ km), equation (4) can be replaced by a constant consumption rate (which is equal to the maximum consumption rate rmax). As a consequence, the 1D mass conservation law of model D [equation (6)] can be further simplified and solved analytically. Therefore, for pO2≫ km, a very simple expression for Lmax can be written:
In the second part of this study, model D was applied as a computational tool to tackle scaffold upscaling and to calculate the maximum scaffold length for a given target range of oxygen tension and as a function of cell- and bioreactor-related culture parameters. The approach was illustrated for both high (10%<pO2<21%) and low (1%<pO2<5%) oxygen ranges. Although equation (7) is sufficiently accurate for the calculation of Lmax for the high oxygen range, it underestimates Lmax of about 13% for the low oxygen range. Nevertheless, it is instructive to qualitatively explain the results in Figure 6 and Table 4 by means of this equation. Basically, this equation shows that Lmax is proportional to the bioreactor inlet velocity and the oxygen target range ΔpO2 (which equals [pO2in−pO2out]) and inversely proportional to the cellular consumption rate and cell density.
In general, one can notice from the results in Table 4 the substantial effect of culture parameters on Lmax, which varies over 3 orders of magnitude (from millimeter to meter scale). Obviously, values of Lmax of the order of meters are not realistic from a production or clinical point of view. In such cases, the model simply points out that oxygen availability inside the scaffold is not the limiting factor for upscaling. This is, for example, the case for the lowest cell density (106 cells/mL), where even for the most demanding culture conditions (low inlet velocity and oxygen range, and high consumption rate) Lmax amounts to 48.9 mm. The values for Lmax changed considerably between the low and high oxygen range: for an inlet velocity of 0.1 mm/s and for a seeding density of 30×106 ES cells/mL, Lmax equaled 5.44 and 12.16 mm, respectively, for the low and higher oxygen range. This effect follows from equation (7), wherein an increase of the length of the oxygen target range ΔpO2 (from 4% to 11%) leads to an increase of Lmax. However, as equation (7) is not valid for the low target range of oxygen tension (due to the nonlinearity of the Michaelis-Menten law for low oxygen tension), it leads to an underestimation of Lmax with 13% for this range.
As mentioned earlier, the maximum specific cell consumption rate rmax,cell is inversely proportional to Lmax. However, in contrast to, for example, the bioreactor inlet velocity, the value of rmax,cell cannot be varied to obtain the required Lmax, as it is intrinsic to a certain cell (pheno)type. Therefore, once the cell of interest is selected, the value of rmax,cell becomes a constant in the analysis. On the other hand, it is interesting to notice how the value of Lmax changes with cell type. As an example, Table 4 shows that Lmax values were about 10 times higher when chondrocytes were used instead of ES cells, which follows from the fact that rmax,cell is about 10 times lower for chondrocytes.
Finally, and again following equation (7), Lmax increases linearly with an increase of the inlet velocity
In summary, for a regular scaffold, based on a repeatable unit cell, an expensive CFD analysis, performed on the entire scaffold, can be fully replaced by a CFD study of the fluid flow in one unit cell (for the determination of the WSS distribution) and a 1D model for the prediction of the oxygen distribution and the determination of Lmax. Figure 7 summarizes the different steps of the approach. A CFD model of the representative unit cell is performed by imposing an arbitrary (but reasonable, i.e., sufficiently low to obtain a laminar flow) value for the inlet velocity and the WSS distribution is determined. Experimental input on the effect of WSS on cell behavior is required to have an upper limit for the WSS, which is not detrimental (or beneficial) for cell behavior. Consequently, because of the proportionality of the WSS to the inlet velocity, an upper limit
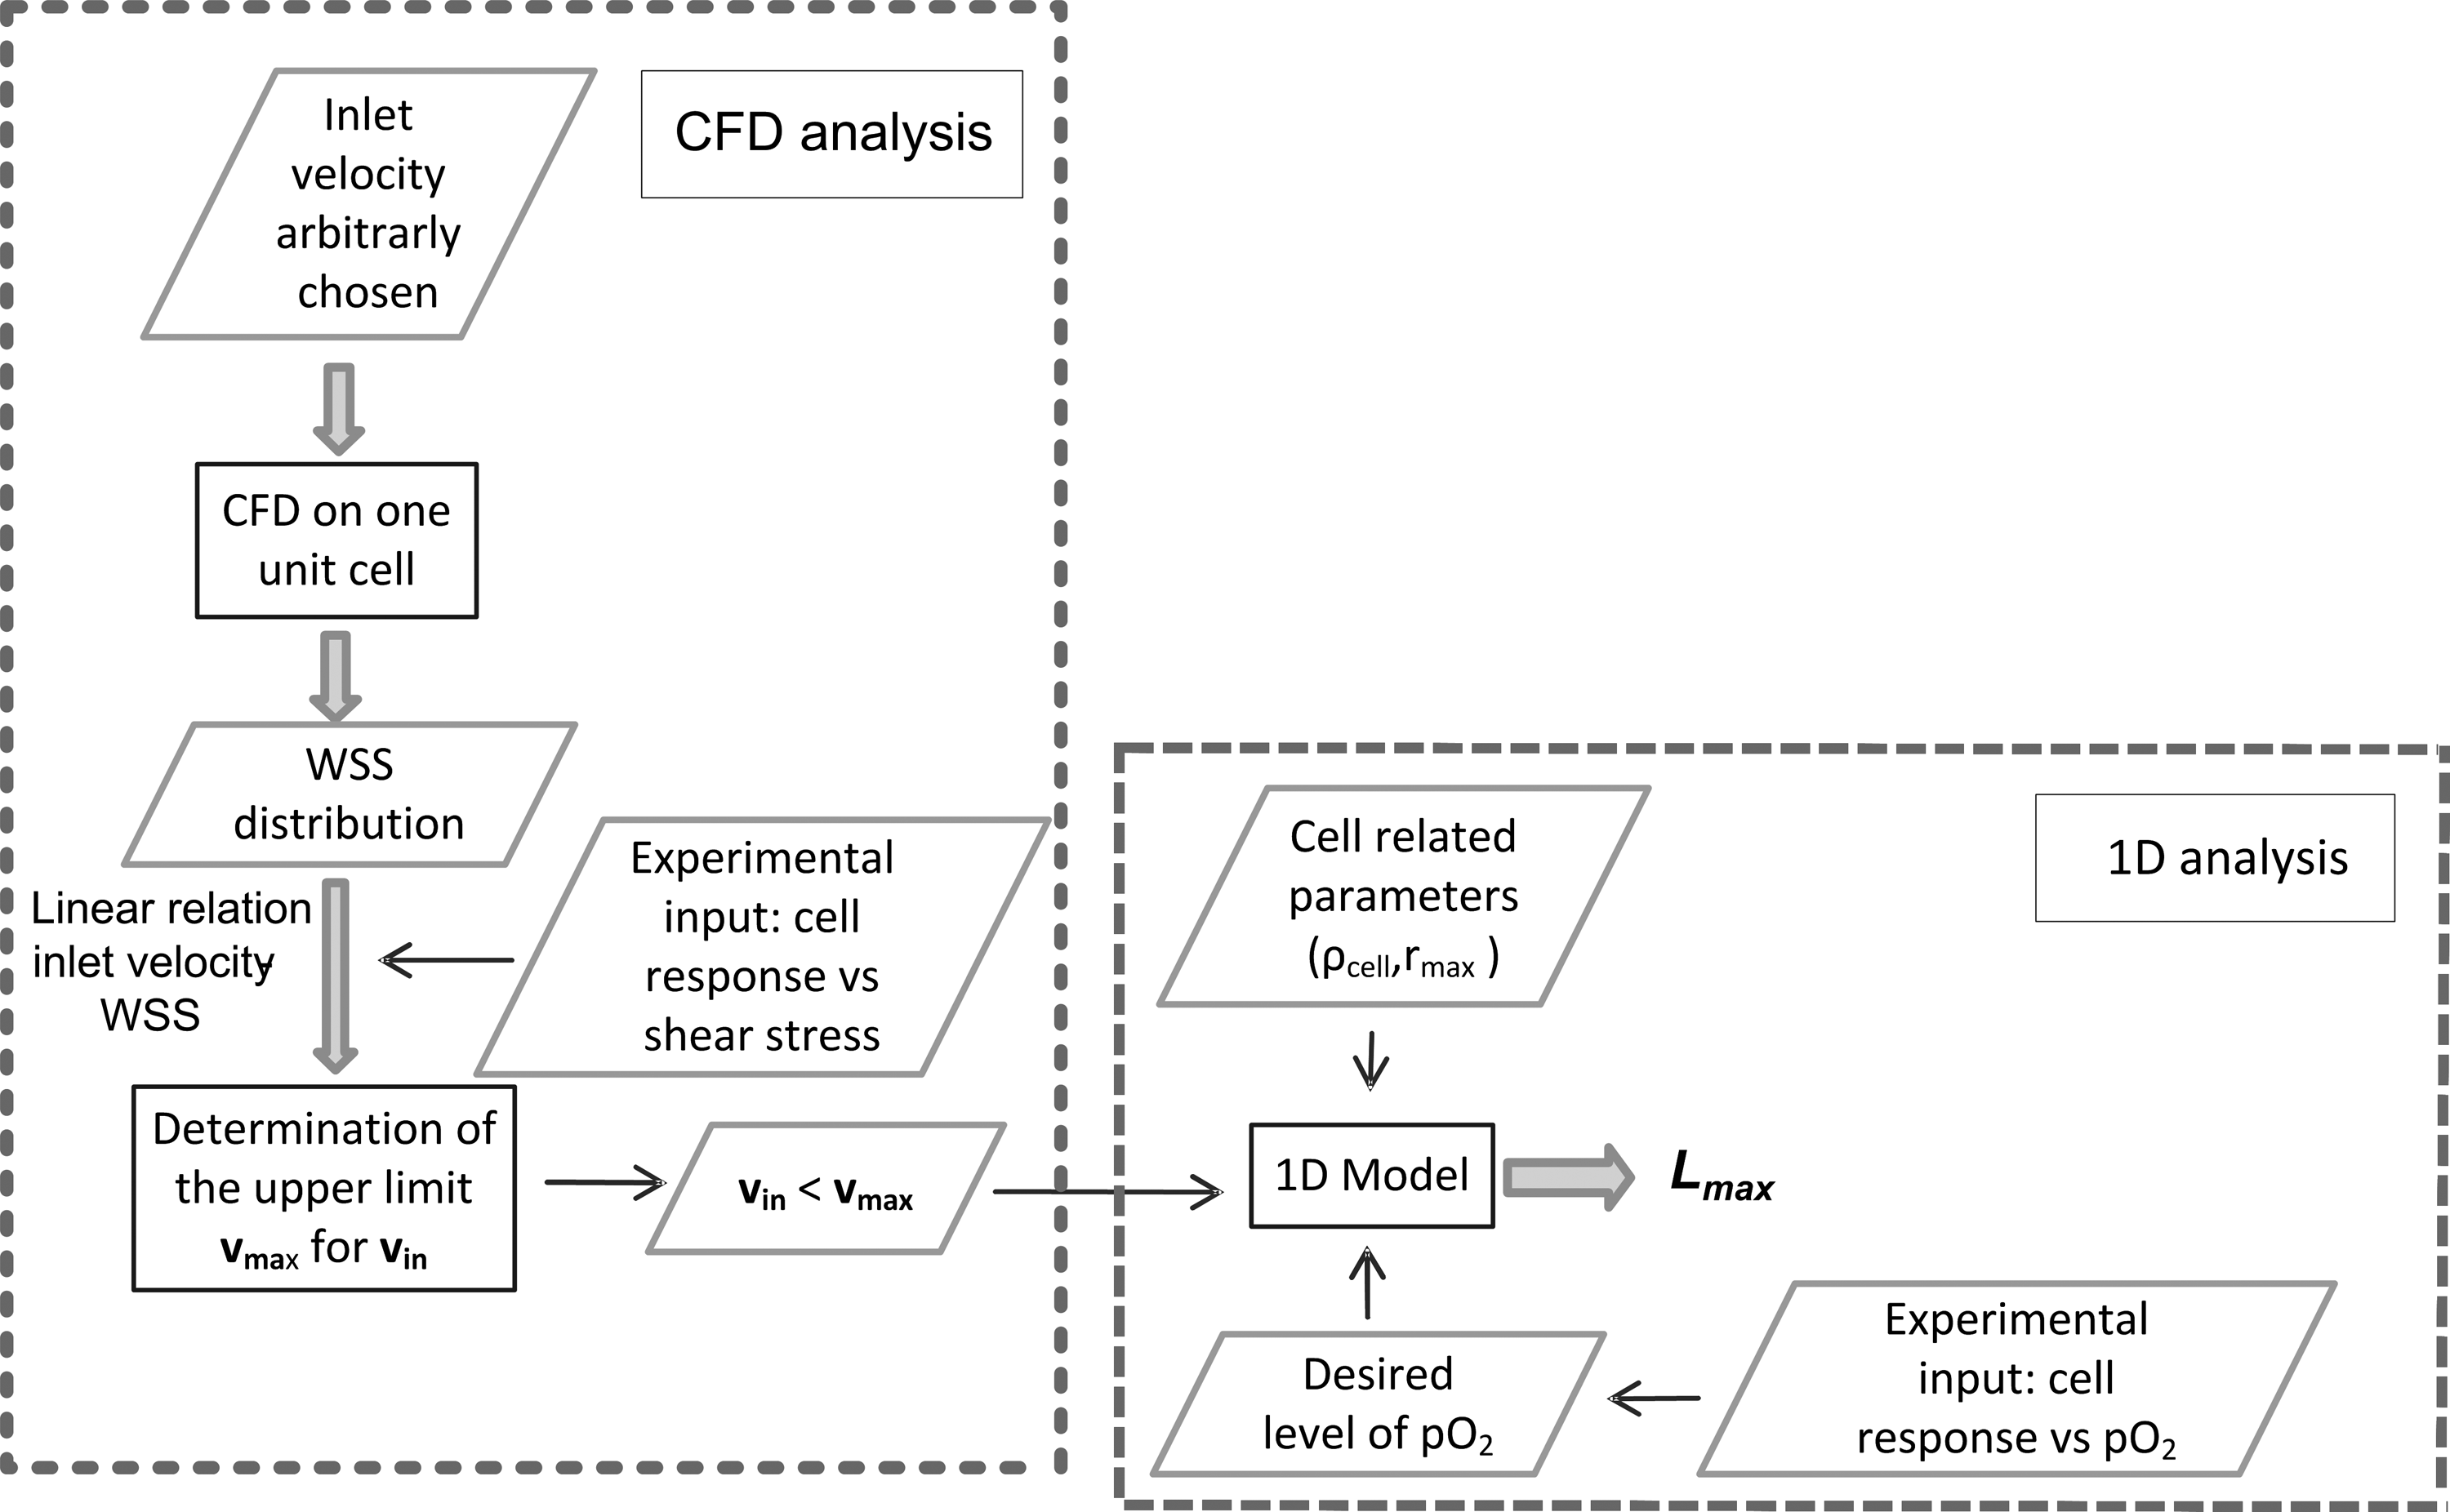
Flow chart of the computational approach for the determination of Lmax as a combination of a detailed CFD analysis of a unit cell and a one-dimensional analysis of oxygen transport.
Alternative applications of the proposed computational approach can be thought of, depending on the problem definition (i.e., what are the dependent and independent variables). Figure 8 illustrates how for a given scaffold length, oxygen target range, and oxygen consumption rate, the minimal inlet velocity to meet these requirements can be calculated. If the inlet velocity exceeds the upper limit
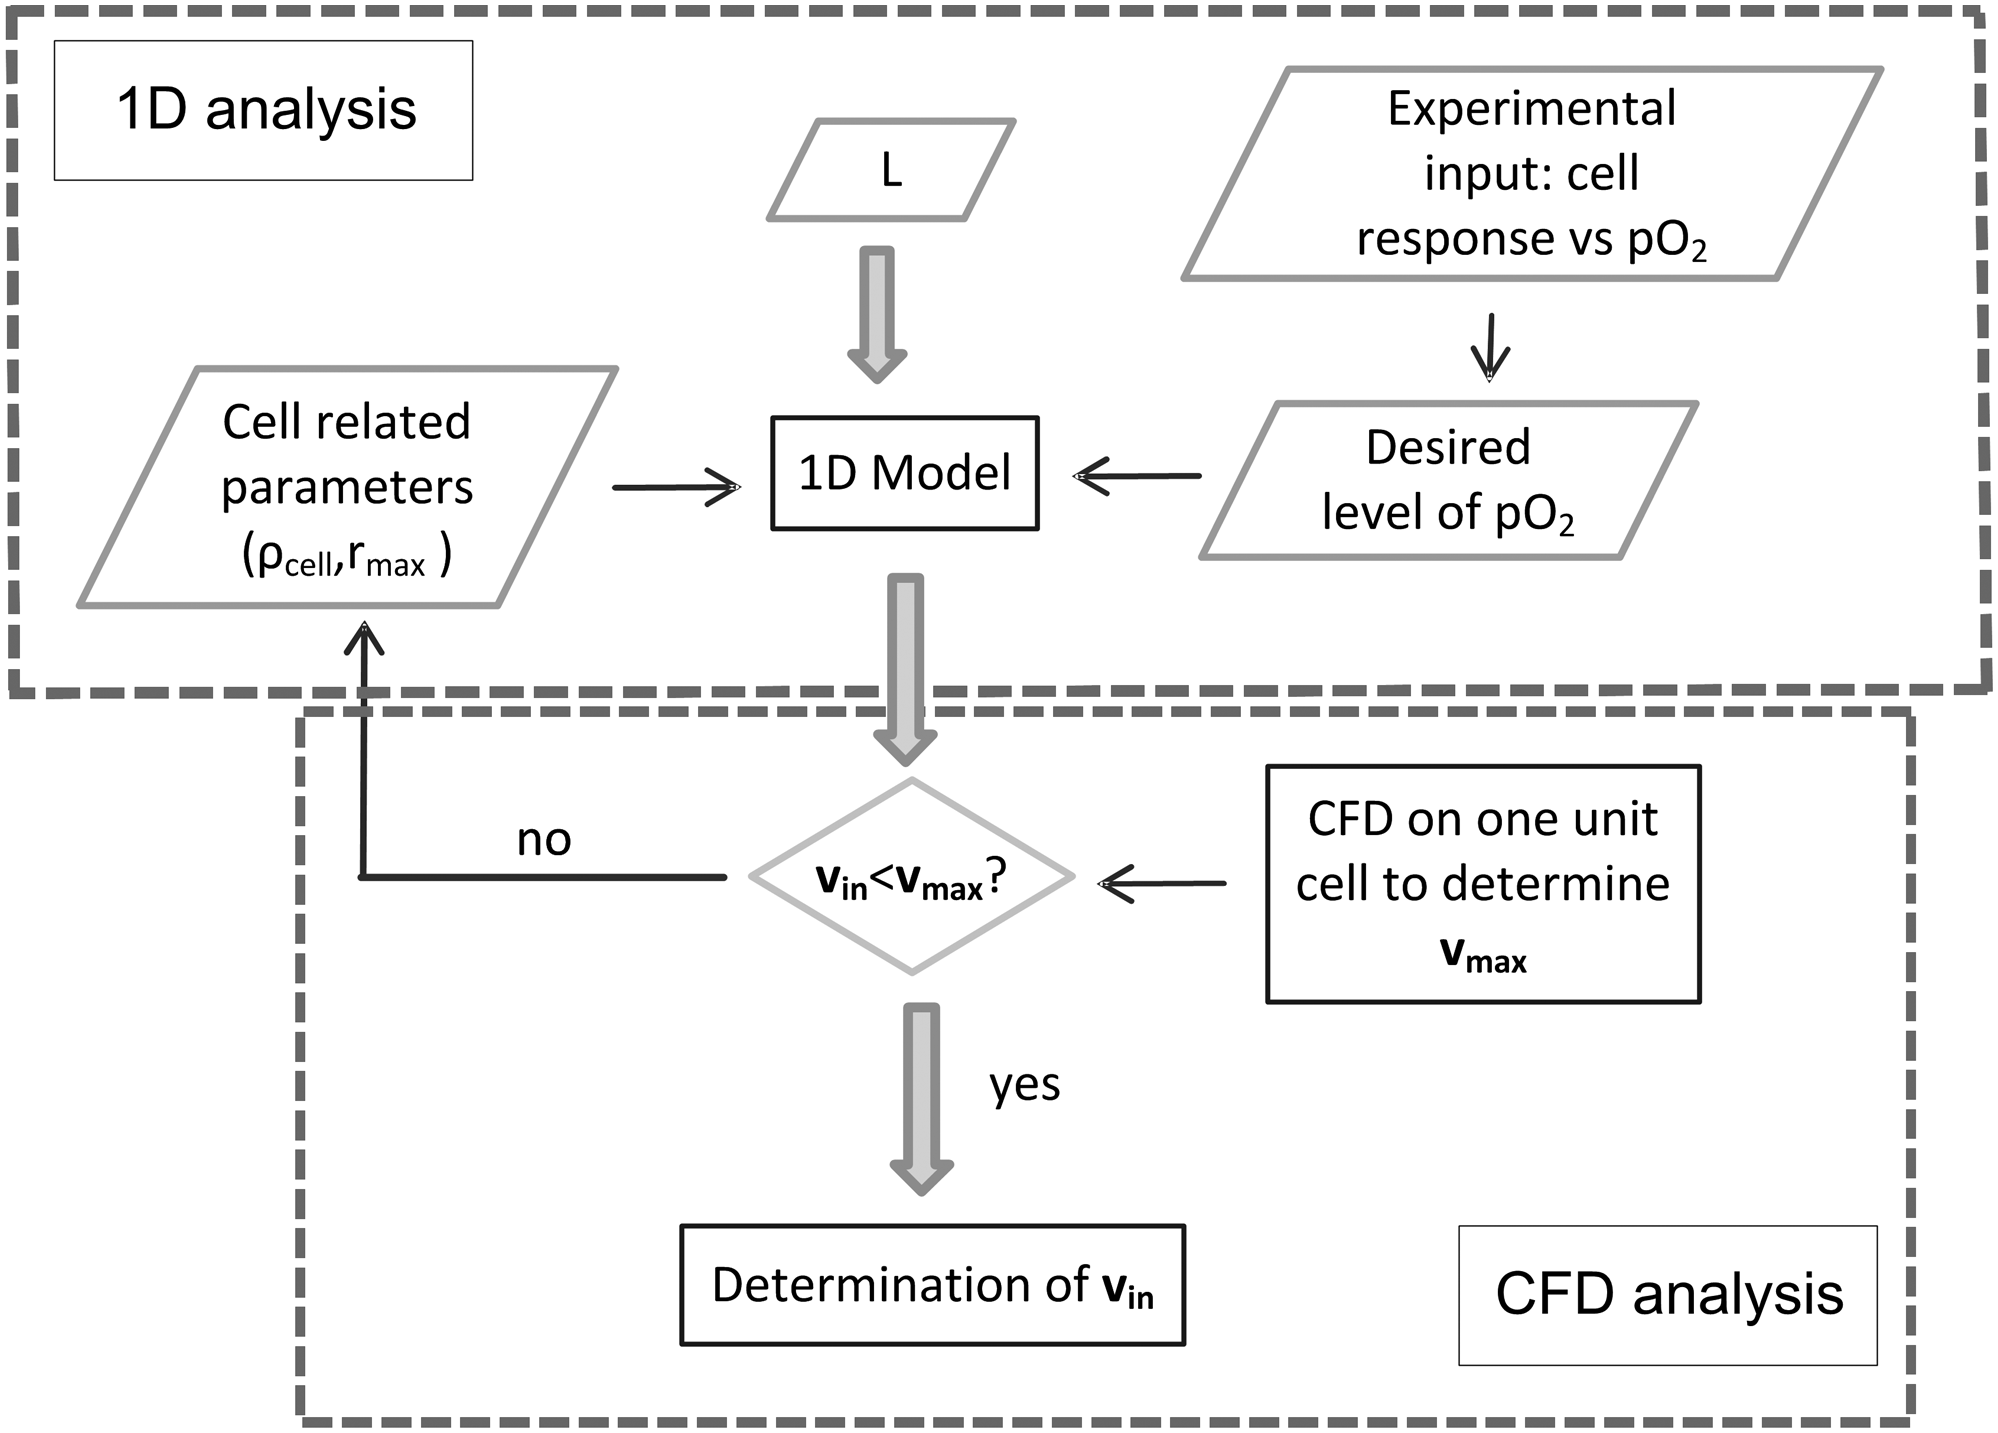
Flow chart of the computational approach for the determination of the inlet velocity for a given scaffold length L.
The presented computational methodology relies on a number of assumptions, which need to be discussed to better appreciate its applicability.
The study was performed on a thin (0.5-mm-thick) scaffold, which was dictated by the previously developed (2D+) bioreactor. Although it limits the use of this setup to laboratory applications, it does not limit the applicability of the computational approach. As long as the scaffold architecture is regular and periodic, the approach can be extended to several true 3D scaffolds geometries (i.e., thickness of the same order as length and width).
In the detailed model A, cells were assumed to be attached to the scaffold surface, which is more realistic than a homogeneous distribution throughout the entire pore volume (model B, which is similar to that described by Cioffi et al. 35 ). As it was found that the cell distribution only had a minor effect on the oxygen distribution (which followed from the comparison between models A, B, and C, the latter being a porous model), our study confirms and extends the findings of Cioffi et al. with respect to the applicability of a porous (macroscale) model. Model A assumes that the cell surface density (number of cells per unit of scaffold area) is constant. Real cell distributions, as obtained after cell seeding, may be heterogeneous either at a macro- or microscale and may involve phenomena such as cell clustering, such as described by Wendt et al. 40 At the same time, this study demonstrated that the cell distribution strongly depends on the seeding protocol and that perfusion seeding may result in fairly homogeneous cell distributions, both at the macroscale (entire scaffold) and the microscale (one scaffold pore). Given the fact that these results were obtained with irregular scaffolds and that one can expect an even higher cell uniformity for regular scaffolds, it supports the assumption made for detailed model A.
Nevertheless, in case of a strongly heterogeneous cell distribution, higher oxygen gradients may develop through the scaffold because of highly localized consumption. As a result, diffusive effects may start to play a role as well, rendering model D invalid. Therefore, the validity of a uniform cell surface distribution must be checked experimentally.
The cell dynamics (change of cell density due to, e.g., cell proliferation or death) was not considered in the study. Instead, a static snapshot of the cell density was considered, which can be interpreted as the initial seeding density. This also means that the model cannot be used to predict the long-term (days, weeks) oxygen dynamics during culturing. The modeled cell density may therefore be regarded as the initial seeding density. Only if, during culturing, the effect of cell dynamics and extracellular matrix synthesis on the scaffold pore volume would be negligible (see also discussion below), the modeling approach may provide a static snapshot of the oxygen distribution at an arbitrary time point (provided one knows the cell density for that time point). To verify that the assumption on constant cell density was valid for the goals set out in this study (and particularly the accurate calculation of oxygen distribution for a given time point), a transient mass transport simulation was performed for model A (reference model). The time to reach the steady state for the oxygen distribution was compared with typical cell duplication times. The oxygen distribution inside the region of interest of the scaffold reached a steady state after 80 s. As cell duplication times can vary from 21 to 36 h for adult chondrocytes 41 and ES cells, 42 respectively, it confirms the validity of the assumption on constant cell density.
In addition, in the detailed model A, the thickness of the oxygen-consuming cell layer near the scaffold surface was kept constant and equal to 10 μm, which corresponds to a volume fraction (with respect to the pore volume) of 7%. This layer only plays a role for the calculation of the oxygen transport. For the flow calculation, it is considered as part of the fluid domain, and therefore, the cell volume is neglected. One can estimate the total cell volume as follows: assuming a value of 850 μm3 for the volume of a single (spherical) cell, 43 it leads to a total cell volume fraction (with respect to the pore volume) of 0.1%–4.5% for the considered range of cell densities of 106 to 32×106 cells/mL. As these values are small, neglecting the cell volume seems valid, even for large cell densities.
Apart from cell dynamics, tissue dynamics was neglected as well. In case of extensive extracellular matrix synthesis, this assumption may no longer be valid. The approach can be extended by modeling the tissue volume (and if necessary also the cell volume) more correctly. At different time points, more narrow channels (for the detailed models A and B) and lower permeability (for porous model C) can be implemented. This will lead to larger pressures and WSS for the same inlet velocity, therefore affecting the upper limit for the inlet velocity. Further, for thick layers of cells and tissues, the diffusion through these layers may be the dominant transport mechanism, which must be taken into account for an accurate prediction of the local oxygen values.
The approach developed in this study focuses on the quantification of important environmental signals, such as oxygen tension and WSS, for a given cell density. As mentioned in the Introduction section, these signals are important mediators of cell viability, proliferation, differentiation, and matrix synthesis. As our computational approach was developed to address the scaffold upscaling for a given time point, no attempt was made here to perform dynamic simulations of the interaction between these signals and cell and tissue growth. Examples of such simulation studies can be found in the literature, wherein cell and tissue growth (and differentiation) in tissue engineering constructs are made dependent on local oxygen tension16,44 or mechanical stimuli, such as stress, strain, or fluid flow.45–47 In the future, our computational approach could be embedded in a larger simulation platform that takes into account cell and tissue dynamics and their regulation by means of local WSS and oxygen tension.
Conclusion
In conclusion, a computationally efficient methodology that enables to predict the oxygen distribution inside perfused, regular scaffolds has been developed. Further, by combining a detailed CFD model of a scaffold unit cell and a 1D model of oxygen transport, the maximum scaffold length can be calculated as a function of given oxygen and WSS constraints. The computational tool can be used to design perfusion experiments wherein quantitative knowledge on both oxygen and flow characteristics is needed. In this way, it avoids any trial and error concerning the role of these environmental signals.
Footnotes
Acknowledgments
This work was funded by the K.U. Leuven IDO project 05/009 (QuEST) and is part of Prometheus, the Leuven Research and Development Division of Skeletal Tissue Engineering of the Katholieke Universiteit Leuven (
Disclosure Statement
No competing financial interests exist.
Part of this work has been presented at the TERMIS-EU conference in June 2010 and at the 17th congress of the European Society of Biomechanics in July 2010.