
Abstract
Cellular alignment plays a critical role in functional, physical, and biological characteristics of many tissue types, such as muscle, tendon, nerve, and cornea. Current efforts toward regeneration of these tissues include replicating the cellular microenvironment by developing biomaterials that facilitate cellular alignment. To assess the functional effectiveness of the engineered microenvironments, one essential criterion is quantification of cellular alignment. Therefore, there is a need for rapid, accurate, and adaptable methodologies to quantify cellular alignment for tissue engineering applications. To address this need, we developed an automated method, binarization-based extraction of alignment score (BEAS), to determine cell orientation distribution in a wide variety of microscopic images. This method combines a sequenced application of median and band-pass filters, locally adaptive thresholding approaches and image processing techniques. Cellular alignment score is obtained by applying a robust scoring algorithm to the orientation distribution. We validated the BEAS method by comparing the results with the existing approaches reported in literature (i.e., manual, radial fast Fourier transform-radial sum, and gradient based approaches). Validation results indicated that the BEAS method resulted in statistically comparable alignment scores with the manual method (coefficient of determination R2=0.92). Therefore, the BEAS method introduced in this study could enable accurate, convenient, and adaptable evaluation of engineered tissue constructs and biomaterials in terms of cellular alignment and organization.
Introduction
Various approaches have been developed to align cells, including topographical pattern (e.g., microgrooves),16,17 mechanical stimulation (e.g., shear stress, 11 cyclic tension,18,19 and combined stimulation), 20 electrical stimulation, 21 and bioprinting.22–27 Quantification of cellular alignment is necessary to validate the effectiveness of these approaches and the engineered microenvironment. Therefore, quantification of cellular alignment and organization with a rapid, accurate, and adaptable method would be significant in assessing the organization of cells in engineered tissues and biomaterials.
Quantification of cellular alignment is generally performed on microscope images obtained with imaging techniques, including phase-contrast (e.g., cell monolayers), bright-field (e.g., histological sections), and fluorescent microscopy (e.g., immunostaining and confocal microscopy). Cellular alignment evaluation generally involves one or combination of the following processes: (1) identification of cell outlines and determination of the relative orientations of the cells, (2) identification of elongation and cumulative orientation of the cellular nuclei, and (3) identification and assessment of orientation of cytoskeletal components (e.g., actin, vimentin, and tubulin filaments). Therefore, a method developed for the assessment of cellular alignment should be adaptable to recognize the type of information available in the images and to assign a score in close agreement with manual quantification in an automated manner.
Although quantification of cellular alignment by measuring its physical consequences (e.g., mechanical anisotropy or polarization of infrared light) have been achieved before, 28 this is generally performed in the laboratories primarily by analyzing microscope images using manual measurements29,30 or automated methods.11,31,32 Although manual measurement is reliable, 33 it suffers from several limitations: (i) it is tedious and time consuming, (ii) the processing efficiency is low especially when multiple images with hundreds of cells are needed to be processed, and (iii) it has inter-operator variability. Various automated image-processing methods have also been employed to quantify cell alignment from images, a majority of which are based on the Fast Fourier Transform-Radial Sum (FFTRS) 31 and gradient based11,32 methods. Here, FFTRS follows the FFT-based radial sum approach described in reference. 34 However, these automated methods were not specifically developed for recognizing and quantifying cellular alignment, and hence display complexities as listed above. Specifically, being an indirect measure of cellular orientation, FFT-based methods yield low alignment scores even on images having perfect alignment of cells since the frequency spectrum of an image has frequency components other than in the direction of cell orientation. Therefore, these methods do not necessarily recognize the type of information available (i.e., cellular outline, nucleus, or cytoskeleton) in the microscope image and produce a result accordingly. To address the aforementioned challenges associated with the currently available automated techniques, we propose a rapid, accurate, and adaptable method (binarization-based extraction of alignment score [BEAS]) to quantify cellular alignment from microscope images obtained with various methods: phase-contrast, bright-field, and immunofluorescent microscopy. BEAS method works with unlabelled cells, immunolabeled cells, and cells displaying bipolar morphology (e.g., SMCs, cardiomyocytes, and neurons). We show here that BEAS cellular alignment quantification method provides a rapid, accurate, and adaptable alternative to currently available automated methods with results that more closely agree with manual quantification results.
Methods
Images
To compare BEAS method with existing methods, we used test images with manually measured score for cell alignment. Test images (Fig. 1a and Fig. 2a) were prepared using Adobe Flash (Adobe Systems Incorporated, San Jose, CA). The first test image (Fig. 1a) examined the signal that each method produced from a set of perfectly aligned objects (all the objects aligned in the same direction with orientations of 90°). It consisted of an array of solid black ellipses mimicking bipolar type cells or cellular nuclei, each 75 pixels tall and 25 pixels wide (approximating cell size in 10× images). The ellipses were arranged into columns, with 7 pixels of white space between neighboring ellipses. Each column was vertically offset 25 pixels down from its left neighbor. Each ellipse was then randomly moved upward to five pixels left or right and up to five pixels up or down. The second test image examined each method's ability to discern orientation distribution for less sharp objects (i.e., with blurred boundary, Fig. 2a). An image consisting of 16 ellipses (200×67 pixels), each with a black center that fades out to light gray at the edges, was prepared. The ellipses had orientations with respect to horizontal direction of 45° (1), 60° (2), 75° (3), 90° (4), 105° (3), 120° (2), and 135° (1).
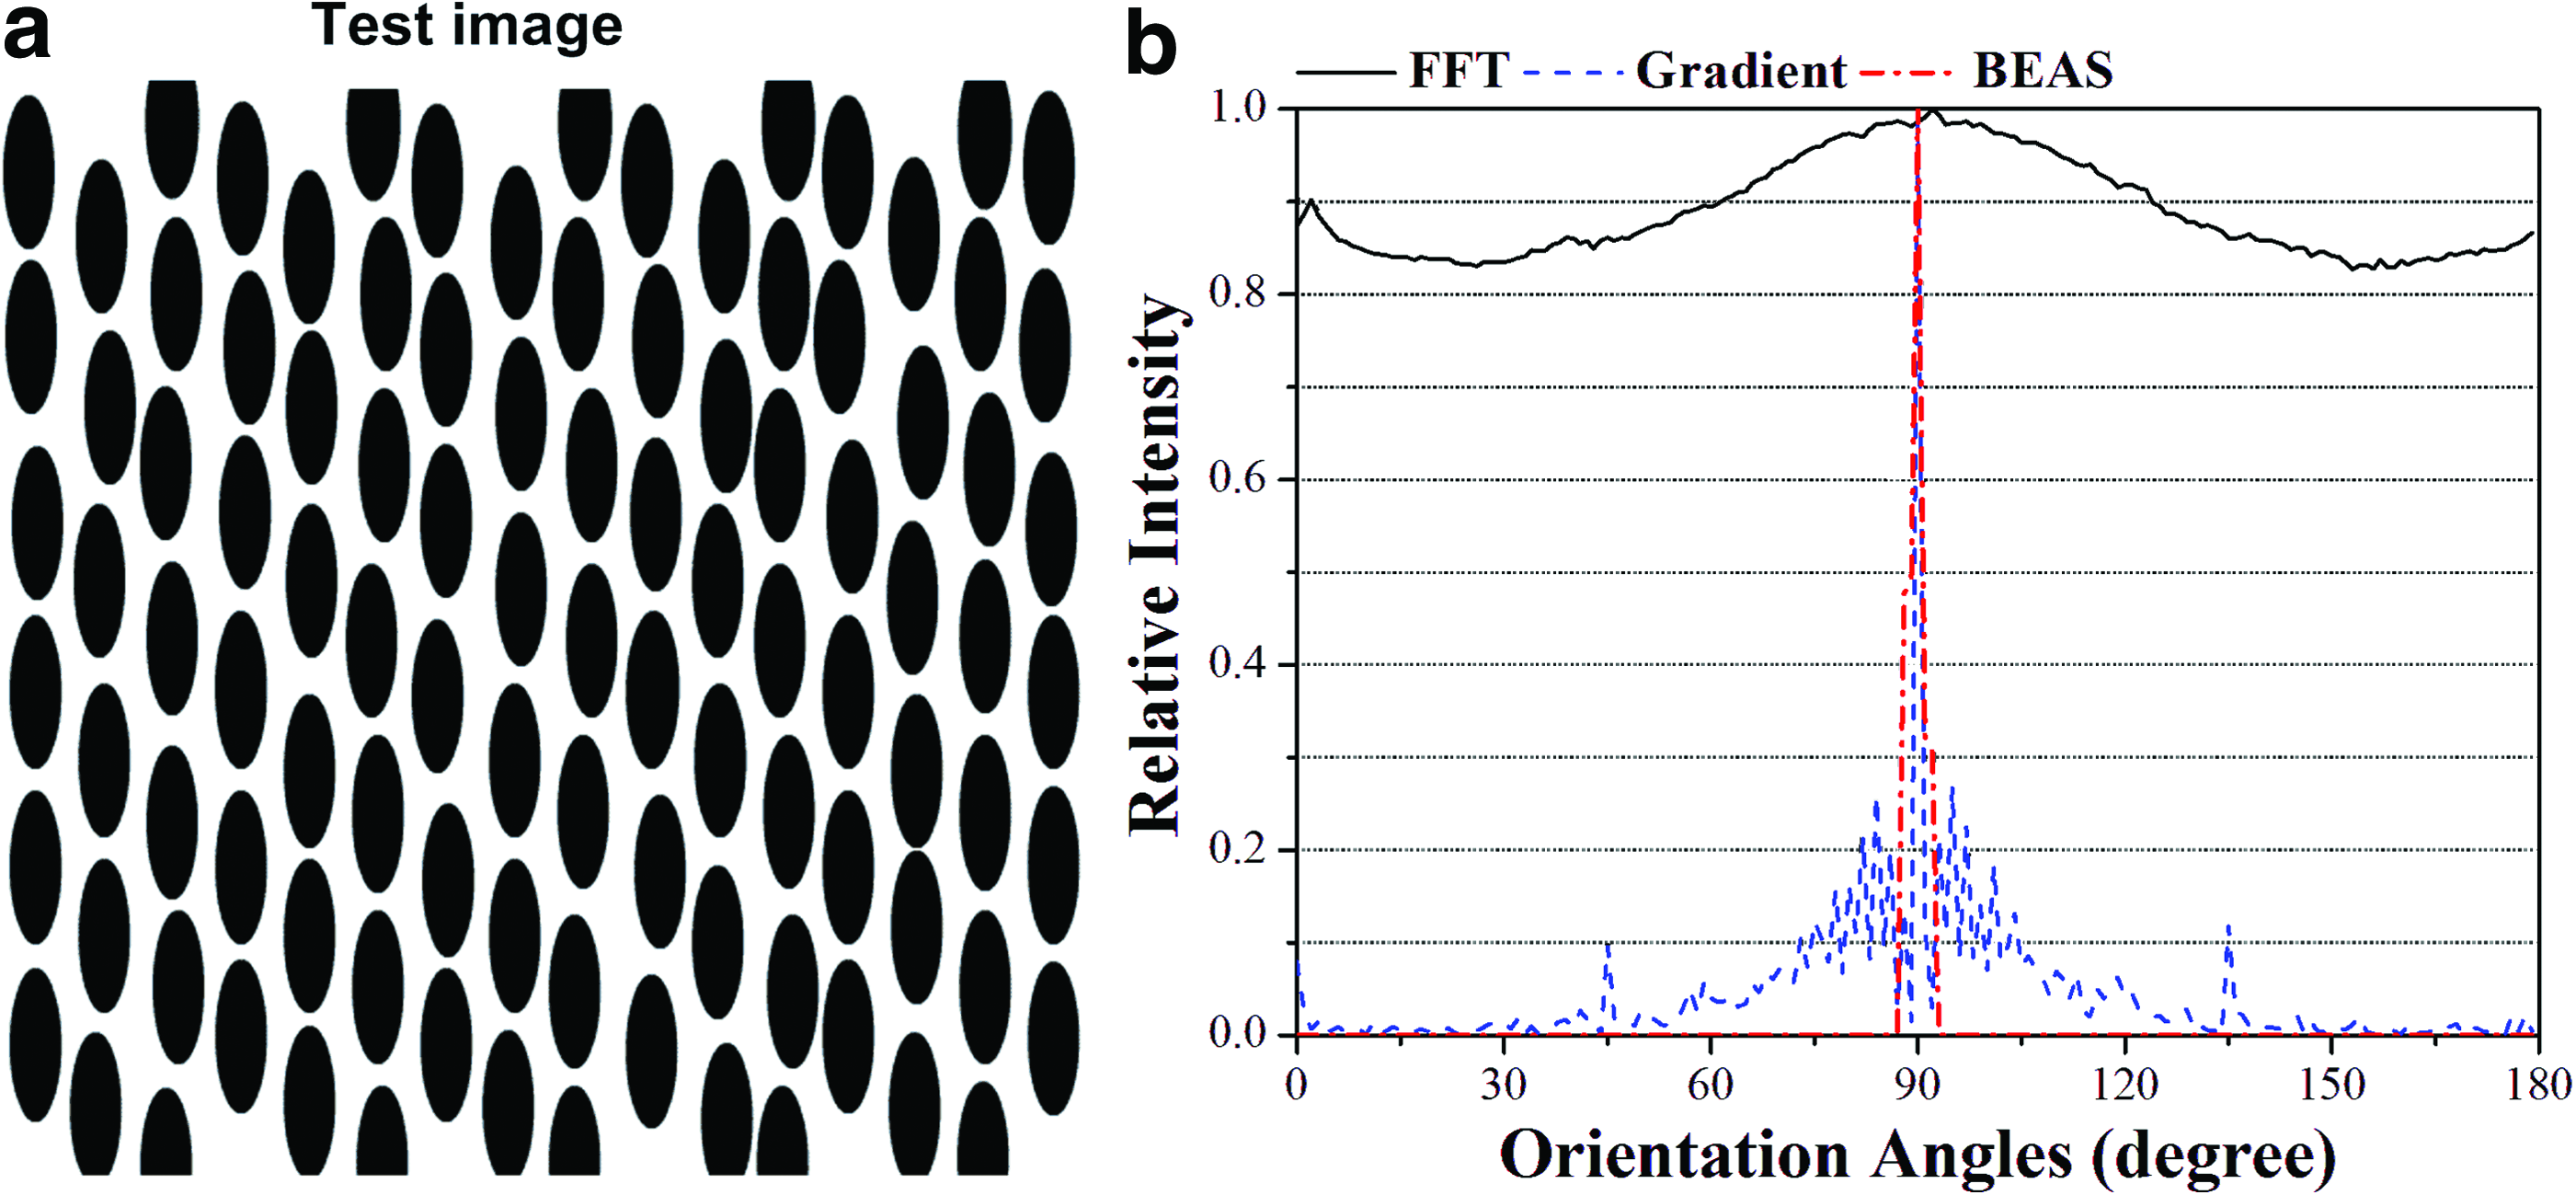
Performance of existing automated methods for quantifying a test image composed of representative cells (ellipsoid objects). The orientation distribution of an array of ellipses

BEAS method accurately measures orientation distribution for images with objects aligned in multiple directions.
Cell images from our laboratory were taken of printed primary SMCs isolated from rodent (Sprague-Dawley rat, female, 250–300 g) bladder tissue, sacrificed under the approval of Institutional Animal Care and Use Committee. Other cell images were taken from published literature as the source of each image is noted in Supplementary Table S1 (Supplementary Data are available online at
Overview of alignment quantification process
Methods to quantify cell alignment can be broken down into three basic steps: (i) image transformation, in which the microscopic image is converted to a form (e.g., binary image) from which orientation information (e.g., orientation angle of individual objects, object size) can be extracted, (ii) cell orientation extraction, in which an orientation distribution is generated from the transformed image, and (iii) cell alignment score representing the degree of cell–cell alignment is calculated from the orientation distribution.
The orientation distribution is a periodic function f(θ) with a period of π radians such that for any angle
Preprocessing
Images were preprocessed using a despeckle filter followed by a (Gaussian) Band-pass filter (see Supplemental Materials) using the public domain NIH ImageJ program (developed at the U.S. National Institutes of Health and available at
Binarization
Binary images were generated by Sauvola's local thresholding algorithm (using the Auto Local Threshold plug-in in ImageJ software 35 ) with a user-defined radius to each preprocessed image 36 (see Supplemental Materials). Local thresholding was used because global thresholds performed poorly on our images (Fig. 3 and Fig. S1), since global thresholding uses a single threshold value for the whole image. Global thresholding may bring more errors to the binary image due to uneven image features varying across the image (e.g., brightness and background intensity) and that would cause misdetection of background as cells.
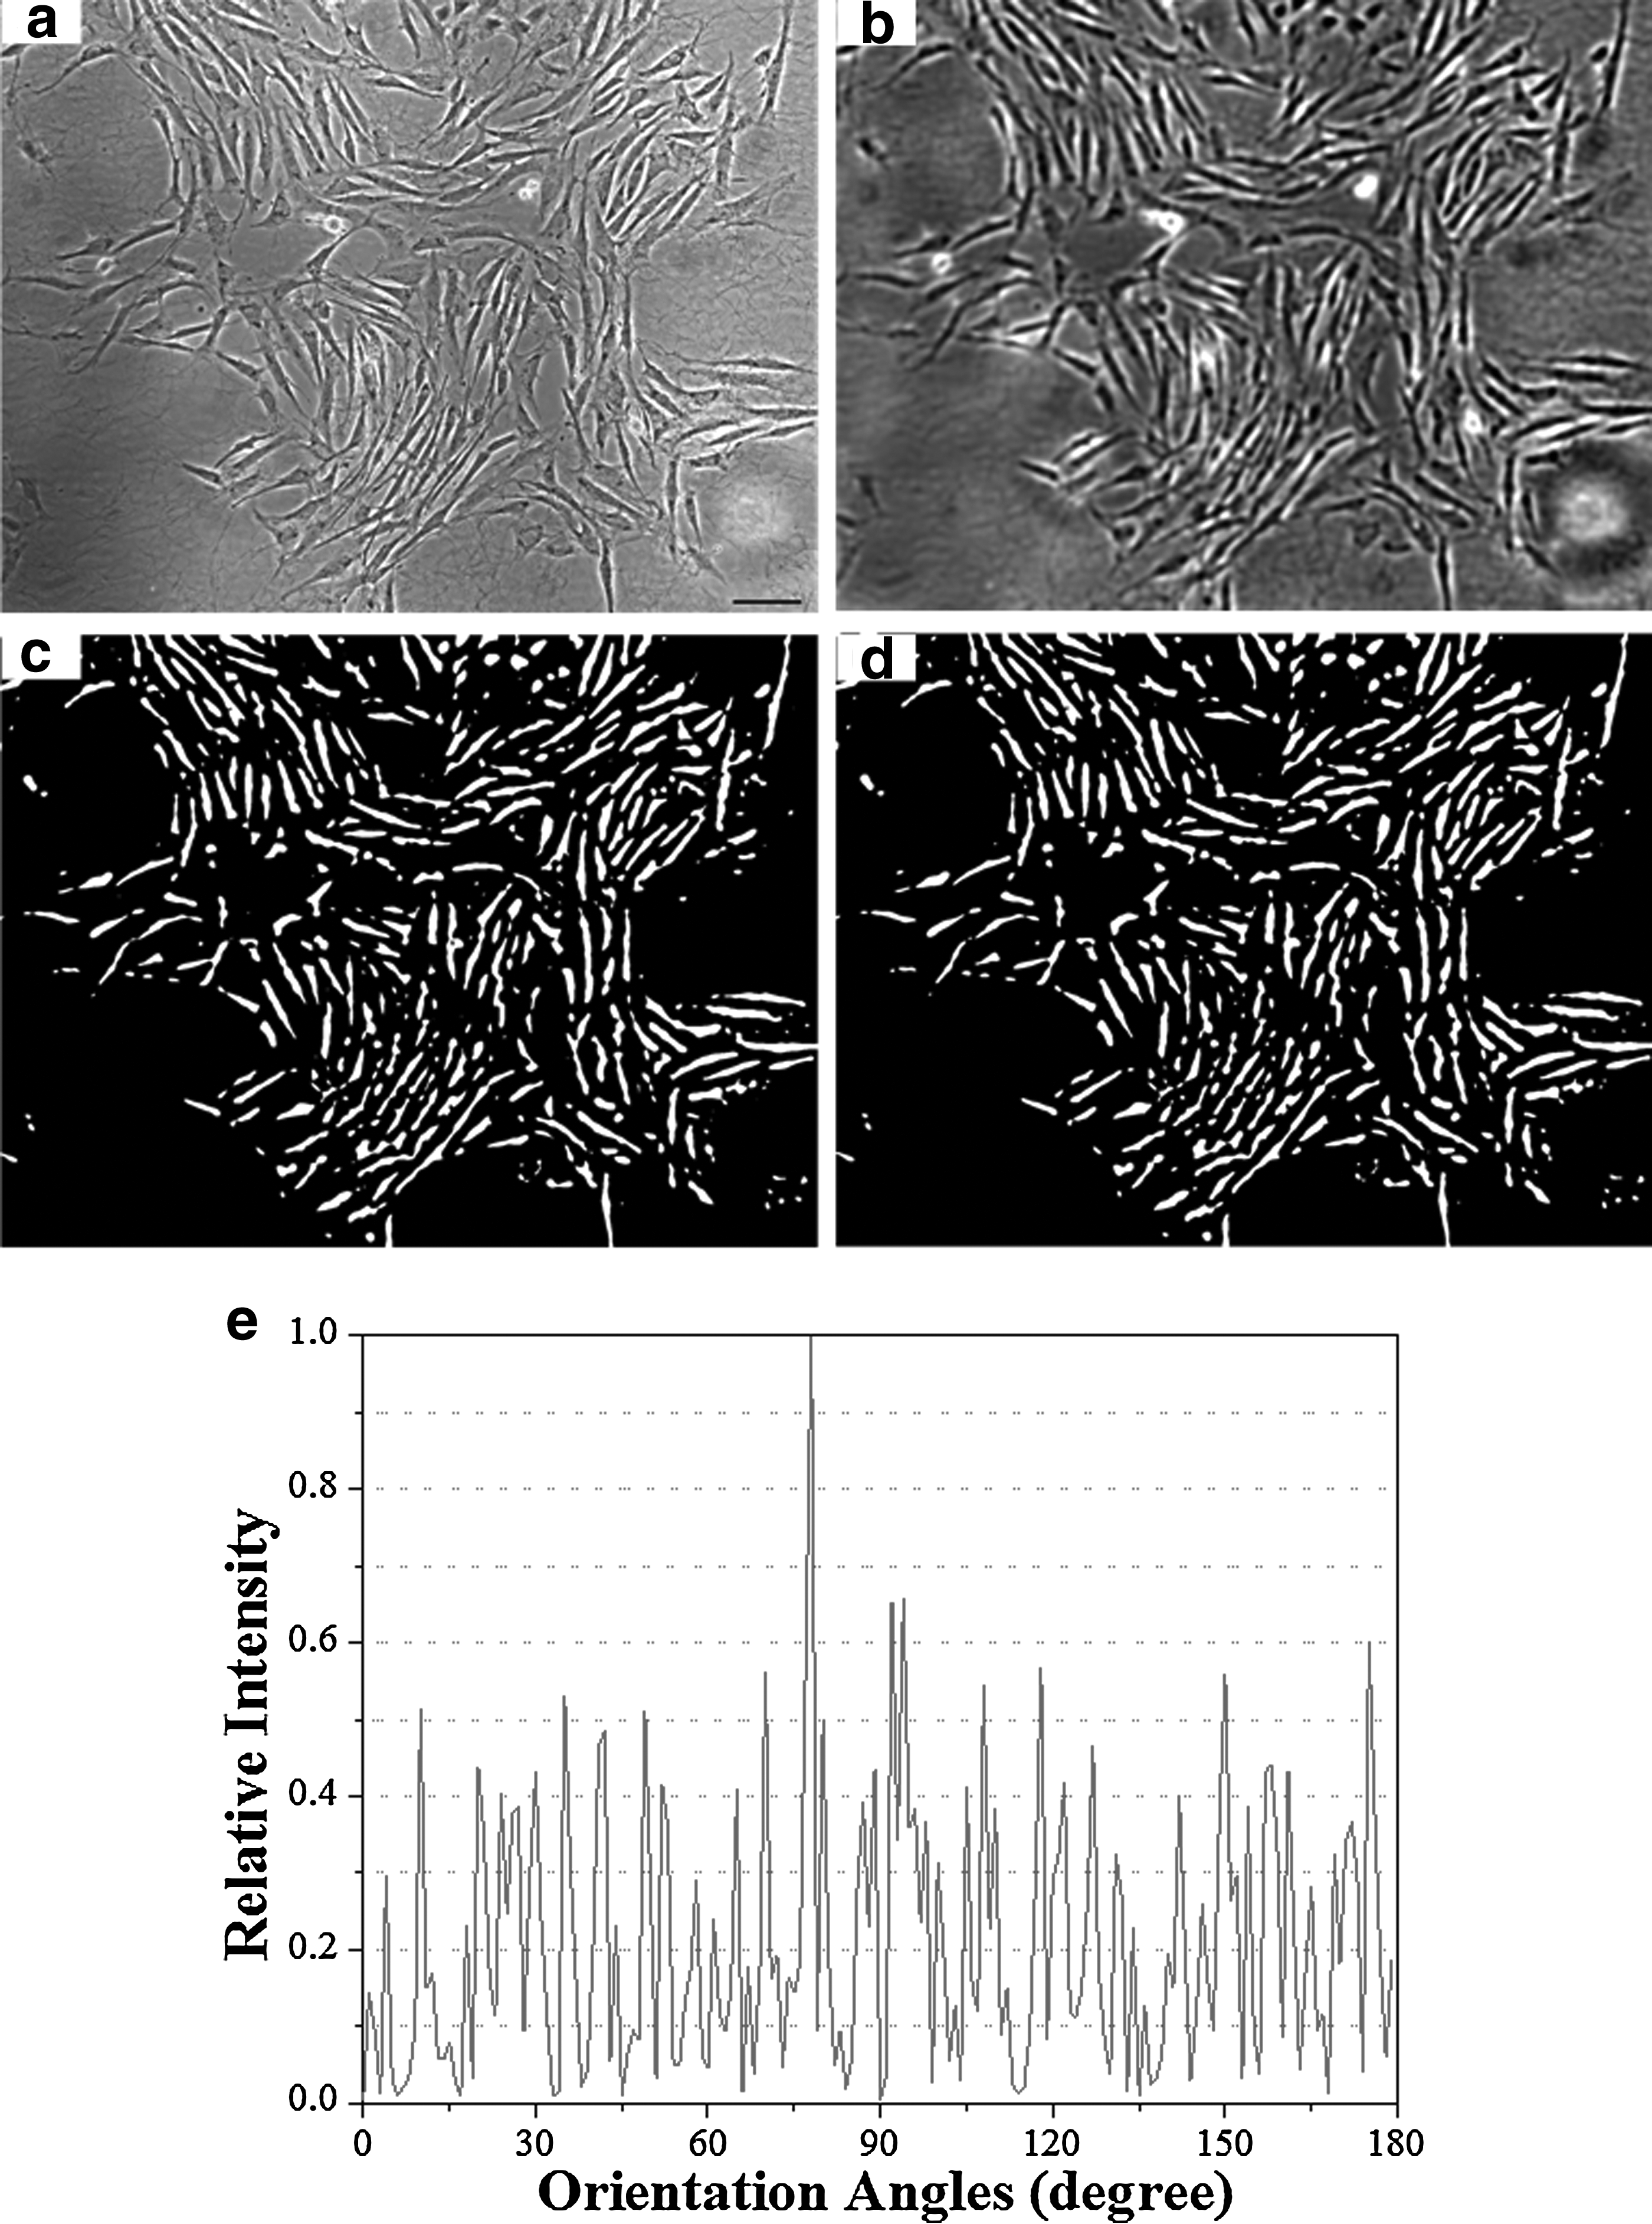
The steps of BEAS method for quantify cell alignment are illustrated using an image of cultured smooth muscle cells.
This challenge can be addressed by using multiple thresholds for local areas of the image. Each contiguous block of pixels less than the threshold brightness was then treated as an object (for fluorescence images, pixels greater than the threshold brightness were used). All holes (regions of “background” completely enclosed by cells) in detected objects were filled, followed by the “open” operation (erosion and dilation, which removes features of single-pixel width) using the Open and Fill Holes functions in ImageJ software. 35 The remaining objects were considered to be cells, and their size and orientation were then calculated. These operations were implemented MATLAB (2008a, The MathWorks, Natick, MA).
Determination of orientation distribution
Orientation distribution, defined as the amount of the objects that are oriented in each direction, was determined from the size T and orientation
The distribution f is repeated with period π. Tn was defined as the area of each cell for the area-weighted distribution, and the length of each cell for the length-weighted distribution.
Automated measurement of cell properties in the image
Cell properties in the image such as the area, center location, and orientation were calculated for each cell as these parameters are defined as follows. The area was taken to be the number of pixels each cell contained. The center of each cell was determined by taking the average x and y coordinates for all the pixels of cell area. To find cell orientation, a line was drawn through the center, and the orientation that gave the minimized sum of the squares of each pixel's shortest distance to the line was used (Supplementary Fig. S2), as follows.
Cell length was considered to be the length of the major axis of the best-fit ellipse for each cell.
Quantification of alignment and overall orientation
Functions performing quantification of alignment and extracting overall orientation are implemented in MATLAB (2008a, The MathWorks) as follows: For each angle θ, the degree A(θ) to which the cells were aligned in the θ direction was calculated by taking the average, weighted by cell size, of the cosine of twice each cell's angle relative to θ:
The overall direction of alignment θ* was defined to be the value of θ that maximized A(θ). The degree of cell–cell alignment A* was defined to be A(θ*). A weighted average was used because it is not possible to guarantee that every recognized region is a cell, and very small objects are more likely to represent false positives than cell-sized objects. Further, if two cells are recognized as a single object, that object will be approximately twice as large as a single cell; weighting by size means that an object that represents two cells is given twice the weight of an object that represents only one. This means that this method is a function of cell density. Although it cannot fully characterize a grown bundle of cells, it can monitor them as the tissue construct matures.
Using
Comparison of orientation distributions
Automated methods of generating orientation distributions were evaluated according to two separate metrics as described below. Each method's ability to determine accurate alignment scores was assessed by the degree to which A* scores from manually measured orientation distributions predicted A* values from that method (determined using r 2 ). r 2 was used because it is not sensitive to scores that differ only by a constant or a scale factor. The FFTRS and gradient methods necessarily give lower A* scores than BEAS method and manual measurement do (see Supplementary Materials), but this does not preclude the possibility that their A* scores could be scaled to match those of manual measurement.
Manual measurement and current automated methods
Four researchers manually analyzed the cellular alignment independently using the line drawing function using ImageJ to obtain an angle for each object. For each image, a line segment was manually drawn end-to-end through each cell. The size of each cell was taken to be the length of the line segment drawn through the cell, and its orientation was taken to be the orientation angle of the line segment relative to the x-axis. The data for each object were transferred to a spreadsheet, and the average alignment was calculated. The results from four manual counters were averaged. Two current automated methods (e.g., gradient method and FFTRS method) were compared with BEAS method in this study. In the gradient method of cell alignment, the gradient of the image is calculated at each point using the Sobel operator. 37 The orientation distribution is determined by the gradient direction at each point, with points weighted by the gradient magnitude. In the FFTRS method, first the FFT of the image is calculated, and then shifted so that the DC component (constant component) is in the center. A circle is then drawn tangent to the boundaries of the transformed image, and the contribution of cells oriented at each angle is equated to the sum of the intensity magnitude along the circle diameter at that angle, using ImageJ software.34,35
Statistical analysis
Cellular orientation scores obtained from BEAS, FFTRS, and Gradient-based methods were statistically compared with the scores obtained from the Manual method by utilizing paired t-test. A variety of microscopic images (i.e., phase-contrast, bright-field, and fluorescent microscopy) were used to validate the methods (n=15). Linear regression with least squares method was used to apply a linear fit for the data to observe the relation between the BEAS, FFTRS, Gradient based methods, and the Manual Method. Statistical significance threshold was set at 0.01 (p<0.01). Error bars in the figures represent standard deviation.
Results
Comparison of FFTRS, gradient, and BEAS methods using test images
We tested FFTRS, gradient, and BEAS methods to determine cell orientation distribution using prepared test images with known distributions. The true orientation distribution in the first test image (Fig. 1a) was a signal at 90° and no signal at other angles, with θ*=90 and A*=1. The gradient method gave a θ* value of 89.99°; the other two methods gave less accurate θ* values (0.0443 for FFTRS method and 0.6796 for gradient method), though both were within one degree of 90°. Only BEAS method gave accurate A* values (0.9998 for both the length-weighted and area-weighted variants). BEAS method gave an orientation distribution consisting of a single sharp peak, with non-zero signal only in the range of 87°–93°. The gradient method gave a broad peak at 90°, with small but nonzero background signal throughout. The FFTRS method gave large background signal throughout, with a strong, broad peak at 90° and a small peak at 0°.
Next, we tested each method's ability to discern orientation distribution for less sharp objects (Fig. 2). An image consisting of 16 ellipses (200×67 pixels), each with a black center that fades out to light grey at the edges was prepared. The ellipses had orientations of 45° (1), 60° (2), 75° (3), 90° (4), 105° (3), 120° (2), and 135° (1); the true value of θ* was 90° and the true value of A* was 0.6998. Although the true orientation distribution was symmetrical about 90°, the FFTRS method gave a highly asymmetric distribution. The gradient method and BEAS method gave more symmetrical distributions. The gradient method had a large number of small peaks (noise signal), plus large peaks at 45°, 90°, and 135°. BEAS method gave sharp peaks at the angles at which the ellipses were oriented, and the areas under the peaks were close to the correct ratio for the ellipses' orientations.
Quantification of cell orientation and cell–cell alignment
BEAS method was tested using 15 bipolar cell images (described in Supplementary Materials Table S1), containing a variety of cell types and imaging modalities. Some of the images were adapted from the published literature (see Table S1), and some were produced in our lab. Each image was processed as described to give a binary image (illustrated in Fig. 3a–d; each image in each major step is shown in Fig. S3). The orientation distribution was extracted from each binary image as described (distributions are graphed in Fig. S3), and from each original image by the FFTRS and gradient methods. The cell orientations in each image were also manually measured by three students. The different orientation distributions produced for each image were compared (Table S2).
The adaptability of the BEAS method was validated by conducting the cellular alignment analysis a variety of microscope images: phase-contrast, bright-field, fluorescent microscopy, and confocal imaging (Supplementary Fig. S3, Fig. 3, Fig. 4, Fig. S4). BEAS method successfully adapted to each image type by consistently producing comparable results with the manual method.

Quantification of the cytoskeletal and nuclear alignment of cells stained with fluorescent dyes.
BEAS method resulted in statistically comparable (p>0.1) alignment scores with the manual method for the 15 different images analyzed, whereas the FFTRS and gradient-based method scores were significantly different (p<0.01) from the manual method results (Fig. 5a). Further, alignment scores obtained from BEAS method displayed a linear correlation with the results obtained via manual method (coefficient of determination [R 2 ]: 0.92) (Fig. 5b). The gradient method values were consistently lower than manual results with a correlation of R 2 =0.74. Similarly, the FFTRS method scores were lower than all methods, and these scores did not correlate with scores produced manually (R 2 =0.04, Fig. 5b).

Comparison of scores from manual measurement with BEAS, Gradient, and FFTRS methods.
Discussion
The results presented here illustrated the comparison between orientation results obtained from manual measurement, BEAS, the FFTRS, and gradient based methods. In the gradient method, each cell contributes to the score in almost all directions (though unequally), whereas in BEAS method and manual measurement, each cell contributes to the score only in its putative direction or orientation. Similarly, FFTRS method possesses significant signal components in almost all directions since a certain cell image, even comprising cells perfectly aligned in one direction, cannot be represented by only one frequency component. This effect might especially be significant in determining cell orientation rather than fiber as perfectly aligned fiber images would be more similar to a cosine-like image (having only one frequency component), which might make them more suitable to be processed with FFTRS method.
This difference can be clearly seen in Figure 1, which shows the orientation distributions that each method produces for an image where all objects are oriented in one direction. The difficulty posed by each cell contributing signal in all angles is apparent in Figure 2, where BEAS method gives an orientation distribution very close to the manual scoring, whereas the FFTRS and gradient methods do not.
BEAS method produced alignment scores that strongly predict those produced manually (Table S2, Fig. 5) and orientation distributions that are, on average, as similar to manually measured distributions as the manually measured distributions are to each other (Fig. 5a). Linear regression (Fig. 5b) showed that BEAS method more accurately predicted the results of manual measurement of cell–cell alignment than the gradient method, and the FFTRS method did not appear to predict at all. This result indicated that the alignment scores that the FFTRS and gradient method gave are not simply off by a scale factor. They produced distributions that reflect both cell–cell alignment and other unknown factors, and isolating the alignment information from the other information present is a complex task that likely must be done on a case-by-case basis. The difference in the alignment results on Table S2 between the manual and BEAS is mainly due to the fact that the cells in the images cannot be easily differentiated from the background. In these images, some of the background was identified as cells and some of the cells were not fully captured by the code, and assessed as background. Potential sources of this difference are confluence of cells, and lack of contrast between the cells and the background in the images. By improving the image quality, the outcomes can be significantly improved to allow a better agreement between the manual and software analysis.
Despite the high accuracy for measuring alignment and orientation, our method does not precisely identify all individual cells. Rather, the binary images it produces disregard some cells, count some artifacts that are not associated with cells, and merge some cells into single objects. Size-based weighting enables it to give accurate results despite these errors. The noncell objects mistakenly registered as cells are, for the most part, smaller than cells. As a result, their contribution to the overall orientation distribution is small, particularly when the distribution is weighted by object area. When the number of cells in an image is large, the failure to pick up a few poorly illuminated cells is unlikely to significantly alter the overall distribution. If two cell areas are fused into one, the resulting object will have approximately twice the area of a single cell, and will consequently be weighted as two cells. The image recognition aspect of the code can be modified to perform orientation per cell and number of objects processed. Currently, the program provides the overall average cell orientation of a sample. Further, for cell types whose primary function is mechanical, the quantity of intracellular cytoskeletal components (e.g., f-actin filaments inside the cells) is generally more important than cell number, and an area-weighted distribution more accurately reflects the distribution of these elements (Fig. 4).7,38 If multiple images in a time series are compared, cells can divide without affecting the orientation distribution, because each daughter cell will initially have half the area of the mother cell. A length-weighted distribution, meanwhile, more closely resembles the way in which manually measured distributions are calculated, and consequently serves as a direct comparison between manual and automated results.
BEAS method was able to determine orientation distribution and cell–cell alignment in images of multiple cell types using multiple imaging modalities. It was able to work with these different images because of key features that they have in common: the objects of interest are contiguous regions either increased (fluorescence) or decreased (bright field and phase contrast) luminosity, they are much wider than fragments not of interest, and they have a bipolar morphology.
BEAS method calculates cell orientation relative to a rectangular coordinate system without regarding to each cell's position. The scoring method we used assumes that uniaxial alignment (all cells orienting in a single direction) is to be measured. If another form of alignment (e.g., circumferential alignment of vascular SMCs in blood vessels) is needed, BEAS method can be used to produce an orientation distribution, which can then be scored. Besides, in BEAS method the code picks the two far most distant locations of the object to draw a line for alignment. As long as the object shape is not a perfect circle (Fig. S4), the code will be able to process the image and determine the orientation of the object.
Conclusions
In this study, we developed a BEAS method for quantifying the alignment of cells in biomaterials and tissue-engineered constructs. The results indicated that BEAS alignment scores agreed closely and correlated with the manual method results, indicating that this method is rapid, accurate, and adaptable. Therefore, BEAS method has the potential to find widespread applications in accurately and rapidly quantifying cellular alignment in biomaterial development and tissue engineering research.
Footnotes
Acknowledgments
This work was supported by NIH R21 (AI087107), NIH R01 (AI081534), Coulter Foundation (Early Career Award), and Integration of Medicine and Innovative Technology (CIMIT) under U.S. Army Medical Research Acquisition Activity Cooperative Agreement. Also, this research was made possible by a research grant that was awarded and administered by the U.S. Army Medical Research and Materiel Command (USAMRMC) and the Telemedicine and Advanced Technology Research Center (TATRC), at Fort Detrick, MD. This work was performed at Demirci Bio-Acoustic MEMS in Medicine (BAMM) Labs at the HST-BWH Center for Bioengineering, Harvard Medical School. We would like to thank Dr. SangJun Moon and Dr. Edward Haeggstrom for their helpful discussions.
Disclosure Statement
No competing financial interests exist.
Author Contributions
F.X. and U.D. suggested the idea; T.B., E.F., and F.X. developed the program; T.B., F.X., E.F., U.A.G, and U.D. performed image analyses; F.X., T.B., E.H.,
References
Supplementary Material
Please find the following supplemental material available below.
For Open Access articles published under a Creative Commons License, all supplemental material carries the same license as the article it is associated with.
For non-Open Access articles published, all supplemental material carries a non-exclusive license, and permission requests for re-use of supplemental material or any part of supplemental material shall be sent directly to the copyright owner as specified in the copyright notice associated with the article.