
Abstract
The increasing use of three-dimensional (3D) cell culture is because it reproduces in vitro results similar to in vivo results. Multicellular tumor spheroids generated in vitro exhibit important characteristics of avascular tumors, mainly with respect to tumor physiology and microenvironment. The interaction among cells in a tridimensional culture environment enhances cell differentiation and leads to luminal formation in some breast-derived cell cultures. The present work describes a method that permits luminal formation in breast adenocarcinoma cell (MCF-7)-derived spheroids in a 3D environment. In the proposed model, several relevant parameters, such as cell survival, apoptosis, autophagy, and E-cadherin expression, were analyzed to understand the organization of MCF-7 cells during different culture phases, including luminal and bud formation.
Introduction
Despite its establishment in the initial works of Holtfreter, Moscona, and Leighton,9–14 the systematic application of 3D cell culture (mainly multicellular spheroids) began in studies by Sutherland.15–17 Multicellular tumor spheroids have a well-organized spherical symmetry and are composed of different cell populations in a concentric arrangement.18,19 The cell heterogeneity within the tridimensional arrangement is similar to the in vivo tumor microenvironment, thus allowing the results of the 3D model to more faithfully replicate those expected in vivo. The tridimensional environment therefore permits the study of different aspects of breast cell biology, as cell proliferation, cell death, and cell differentiation can all be observed during luminal morphogenesis.2,20–23
The plurality of factors associated with lumen formation has increased the need for different experimental approaches. In the present work, we employed a 3D cell culture model using the MCF-7 cell line without the addition of basement membrane components. 24 Morphological changes in spheroids were analyzed, and they showed the efficacy of this technique for better understanding the processes related to autophagy, cell survival and cell death. The method also permitted the production of spheroids that differentiated into luminal structures as a consequence of MCF-7 cell selection in a 3D environment.
Materials and Methods
MCF-7 cell spheroids
The MCF-7 cell line (ATCC®) derived from the pleural effusion of a breast adenocarcinoma was used in this study. The cells were transferred to 25 cm2 tissue culture bottles containing Dulbecco's modified Eagle's medium supplemented with 10% fetal bovine serum (FBS). Thereafter, the cell line was maintained in an incubator with an atmosphere containing 5% CO2 at 37°C. The cells cultured in monolayer were dissociated enzymatically with 0.2% trypsin and 0.02% ethylenediaminetetraacetic acid. After neutralization of enzymatic activity using the same culture medium plus 10% FBS, suspended cells were counted by a flow cytometry Guava® easy cycle mini machine (Millipore Biosciences®). A cell density of 80 cells/μL of culture medium was used for 3D culture.
To remove any polystyrene fragments, the Petri dishes (60×15 mm) were first washed with phosphate buffered saline (PBSA, without calcium and magnesium), and the presence of surface hydrophobicity was confirmed. To check this hydrophobicity, drops of PBSA were placed on Petri dishes surface and were observed the maintenance of these drops (as shown in Fig. 1A). Petri dishes that did not show this pattern were discarded. The technique used for spheroid formation was cell culture with liquid overlay, which consisted of preventing adhesion on the surface of the plate (Fig. 1C). In each Petri dish, 4×10⁵ cells in 5 mL of culture medium were plated. Dishes containing spheroids were kept at 37°C with 5% CO2. Every 3 days, the dish contents were poured into conical centrifugation tubes (15 mL). By gravity, MCF-7 cells (now arranged as spheroids) concentrated at the bottom of the tubes (Fig. 1B). This procedure enabled the spheroids to separate from the culture medium, and the spheroids were then washed and plated in new culture medium. The spheroids were then collected on days 7, 30, and 50 of culture. All results obtained from the 3D culture were compared with results of MCF-7 cells grown in a monolayer.
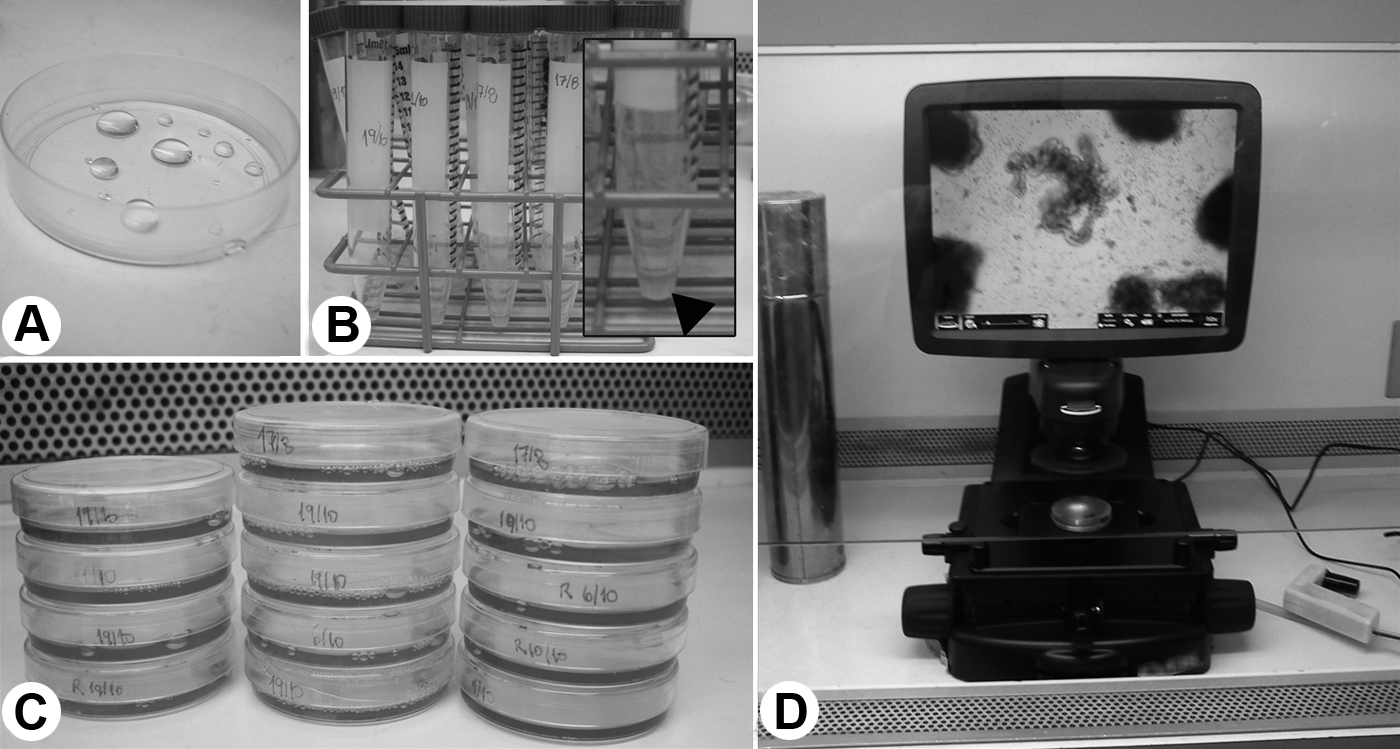
Petri dish hydrophobicity test
Light microscopy
Digital images were obtained at all development stages of the spheroids by both phase contrast and bright field microscopy using a digital inverted microscope (EVOS® AME-3302) (Fig. 1D).
Selection of differentiated spheroids
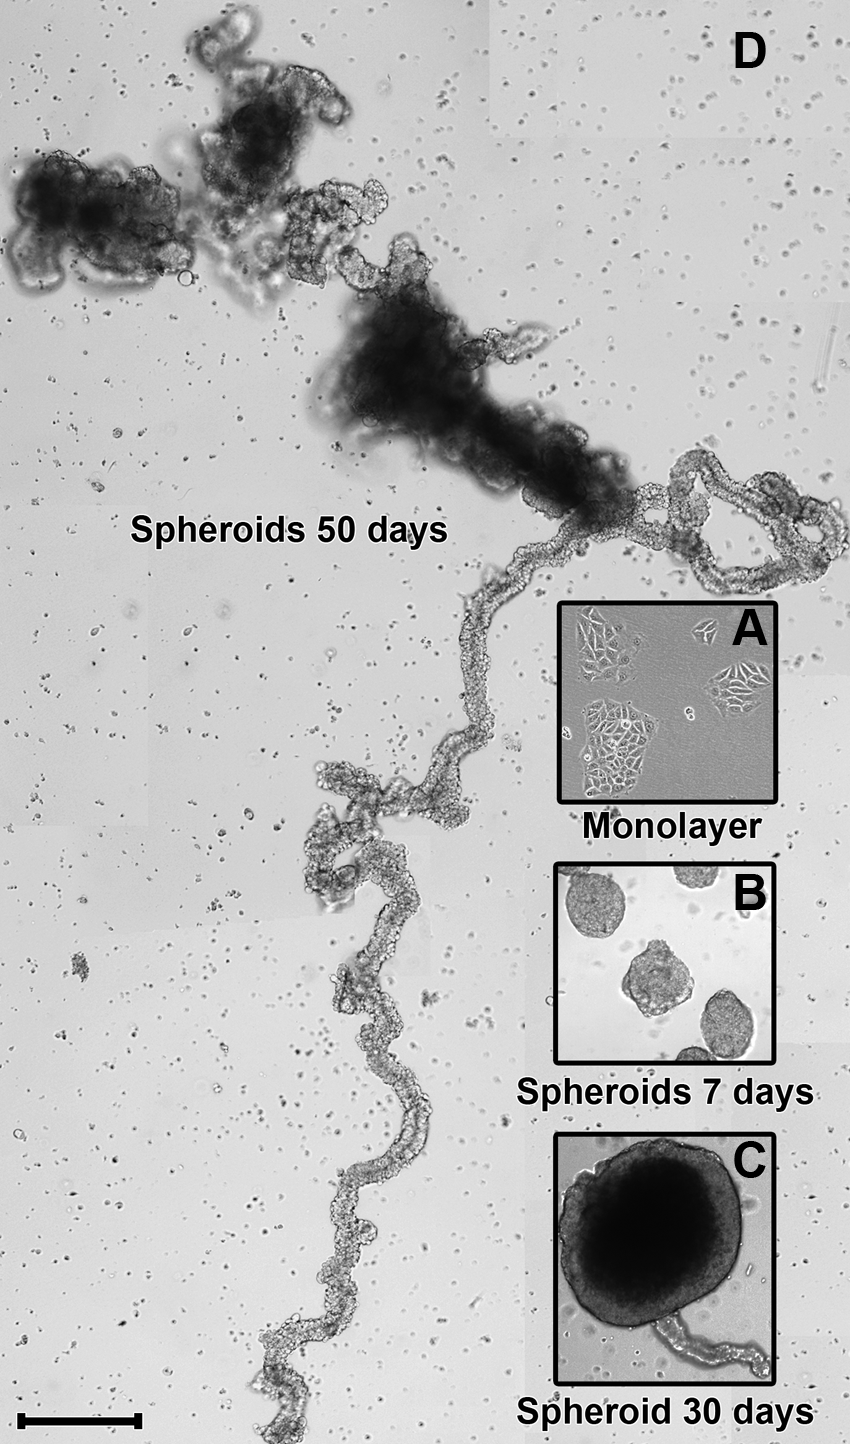
The spheroids were collected on day 50 of 3D culture using a micropipette under a digital inverted microscope (EVOS AME-3302) inside a laminar flow hood (shown in Fig. 1D). As a selection criterion, spheroids with an elongated arrangement (Fig. 2D) and without large spherical masses (which were predominant on day 30 but only in smaller numbers on day 50 of culture) were isolated.
Changes in morphology of MCF-7 cells grown in monolayer
Confocal laser scanning microscopy
MCF-7 cells grown on glass slides (monolayer) and in 3D culture were fixed in 3.7% formaldehyde in PBSA for 30 min. After washing with PBSA, the cells were treated with 0.5% Triton-X 100 for 30 min for the monolayer and 1 h (under agitation) for the spheroids. After another wash, the cells were blocked using 3% albumin in PBSA. After 1 h, cells were once again washed with PBSA and submitted to immunofluorescence. The primary antibodies (Table 1) were used according to the manufacturers' recommendations. Volumes of 10 and 30 μL were added to the monolayer and spheroids, respectively. For the spheroids, exposure to primary antibodies occurred in 1.5 mL tubes. To avoid evaporation, the slides were placed in a wet chamber. The cells were incubated for ∼12 h, and the spheroids were constantly agitated. After another wash with PBSA, the aforementioned procedure was repeated for application of secondary antibodies (Table 1) with the exception of the incubation times; for the monolayer, 3 h was sufficient, and for the spheroids, the incubation period was extended to 6 h. Actin microfilaments were stained with 7.5 μM FITC-phalloidin (Sigma®) or Alexa Fluor 633-phalloidin (Invitrogen®) for 40 min and 4 h for the monolayer and spheroids, respectively, and the cells were then washed with PBSA. After treatment with RNase (10 mg/mL) for 1 h nucleus staining was performed using propidium iodide at a concentration of 10 μg/mL (Sigma). The coverslips containing the MCF-7 cell monolayers and the spheroids were mounted on histological glass slides with anti-fading solution (Vectashield®). To avoid spheroid flattening between the slides and cover slips, the four corners of the coverslips received drops of nail polish. The slides were sealed with nail polish and kept in a dark box at −20°C. Cell analysis was done using confocal laser scanning microscopy (Zeiss LSM 510), and fluorescent images were acquired using the argon green (458, 488, and 514 nm), Helium-Neon1 (543 nm), and Helium-Neon2 (633 nm) lasers. Optical slices were obtained at adequate intervals on the Z axis (between 0.5 and 1 μm). Different modules of the LSM 510 3D software (Carl Zeiss®) were used in the confocal analysis, including slice projections, orthogonal projections, and animations. Some reconstructions and animations were made using the IMARIS 7.1 software (Bitplane®).
E-Cadherin mRNA expression profile
RNA was extracted using the ChargeSwitch total RNA cell kit (Invitrogen) and quantified using a NanoDrop ND1000 spectrophotometer. Quantitative reverse transcriptase (q/RT)-polymerase chain reaction (PCR) were done in a Rotor Gene 6000 real-time cycler (Corbett Research®) with AgPath-ID One-Step RT-PCR kits (Applied Biosystems®). Real-time PCR conditions were as follows: 45°C for 10 min, 95°C for 10 min, 40 cycles of 95°C for 15 s; 55°C for 20 s; and 72°C for 40 s, followed by melting. Annealing temperatures were specifically determined for each primer pair. The following primers were utilized:
qE-Cadherin forward: TACCTGCTCACGTCAAATGC
qE-Cadherin instead: AAAGTGATGACCTCCCATGC
Analysis of protein expression by western blot
Monolayer cells grown in 3D culture were homogenized in RIPA buffer (150 mM NaCl, 1% Nonidet P-40, 0.5% sodium deoxycholate acid in Tris, and 50 mM HCl at pH 7.5) containing protease inhibitors at a final concentration of 2% (Sigma). After centrifugation at 12,000 g for 10 min, the supernatant was collected, and aliquots were quantified by the bicinchronic acid method. Absorbance was determined at 562 nm on an ELISA reader. The samples were diluted 4× in sample buffer (0.5 M Tris-HCl, pH 6.8, 10% glycerol 1% sodium dodecyl sulfate, bromophenol blue, and 1% beta mercaptoethanol) and boiled for 5 min. Thirty micrograms of protein per well was loaded and separated in 5%–15% polyacrylamide gel. Proteins were transferred onto polyvinilydene fluoride membranes (Amersham GE®). Blocking was done using 0.02 M TBS containing 5% skim milk powder and 0.05% Tween-20 for 1 h at room temperature under constant agitation. The primary antibodies (Table 1) were diluted in blocking solution, and the membrane was incubated for 12 h at 4°C under agitation. After repeated washing with TBS and TTBS (tris buffered saline and 0.05% Tween-20), the membrane was incubated with secondary antibodies (1:5000) (ECL kits; Amersham GE), washed again, and revealed by chemiluminescence (ECL; Amersham GE) according to the manufacturer's specifications. The results were developed on Hyperfilm (Amersham GE). Anti-β-tubulin and anti-β-actin antibodies were utilized as loading controls.
Assay for caspase 9 detection
After enzymatic dissociation of the monolayer and spheroid cells using trypsin, 100 μL of each sample at a concentration of 1×10⁵ cells/mL was isolated. Ten microliters of Caspase Reagent working solution was added to the samples, and the cells were incubated for 1 h at 37°C. After incubation, 100 μL of 1× Apoptosis Wash Buffer was added, and the samples were centrifuged at 300 g for 7 min. The cells were resuspended in 200 μL of Caspase 7-AAD working solution diluted 1:40 with 1×Apoptosis Wash Buffer. After 10 min of incubation at room temperature in the dark, the samples were analyzed using the flow cytometry Guava easy cycle mini machine (GE). Each experiment was performed in triplicate. All reagents described in this section are part of the Guava Caspase Kit (Millipore®).
Immunofluorescence for M30
After fixation and permeabilization, cells were treated with RNase (10 mg/mL) for 30 min. The cells were then washed with PBSA and incubated with M30 monoclonal antibodies against cytokeratin-18 fragments conjugated to FITC (CytoDEATH-Roche®). The samples were incubated overnight (12 h) at room temperature in a dark wet chamber. After washing with PBSA, the nuclei were stained with propidium iodide.
DNA quantification using flow cytometry
After trypsin neutralization with culture medium, cells were transferred to 15 mL centrifugation tubes and spun at 300 g for 5 min. The pellet was resuspended in 1 mL of PBSA. Three milliliters of 100% methanol kept at 4°C was added, and the tubes were maintained on ice for 1 h. The cells were then washed twice with 1 mL of PBSA, and the pellet was resuspended in a solution containing 200 μL of PBSA, 20 μL of RNase (10 mg/mL), and 20 μL of propidium iodide (10 μg/mL). The cell suspension was carefully shaken and maintained on ice for 1 h. For analysis of the cell cycle, the DNA was assessed using a flow cytometry Guava easy cycle mini machine (GE). Each experiment was performed in triplicate.
Statistical analysis
Statistical analysis of the data was performed using the Chi-square test with the monolayer group as reference. In all analyses, differences were considered significant at p-values<5% (p<0.05).
Results
Spheroid formation and morphological changes over time
Immediately after removal of MCF-7 cells from the 2D environment (Fig. 2A), the majority of the cells were observed as single cell suspensions in culture medium. After 24 h, cell aggregates predominated over single cells, and in 3-day-old 3D cultures, typical spheroids were observed. These data suggested that spheroid formation in the 3D environment mostly occurred through cell aggregation, not by cellular division of single cells. We observed that the spherical morphology (Fig. 2B) changed throughout the culture period due to constant cell aggregation or merging of spheroids. These processes along with cell proliferation contributed to an increase in spheroid size over time. Roughly on day 20 of culture, MCF-7 cell spheroids with a mean diameter of 30 μm began to exhibit a darkened central area when analyzed by light microscopy. Over time, this region increased, and on day 30 of culture, the dark region became stable in size. Simultaneously with the increasing area of the medullar region, the cortical region showed cell budding (Fig. 2C). The presence of these structures was noted on day 20, and they caused the spheroids to assume a tubular arrangement with a very elongated morphology (Fig. 2D and movie in the Supplementary Materials; available online at
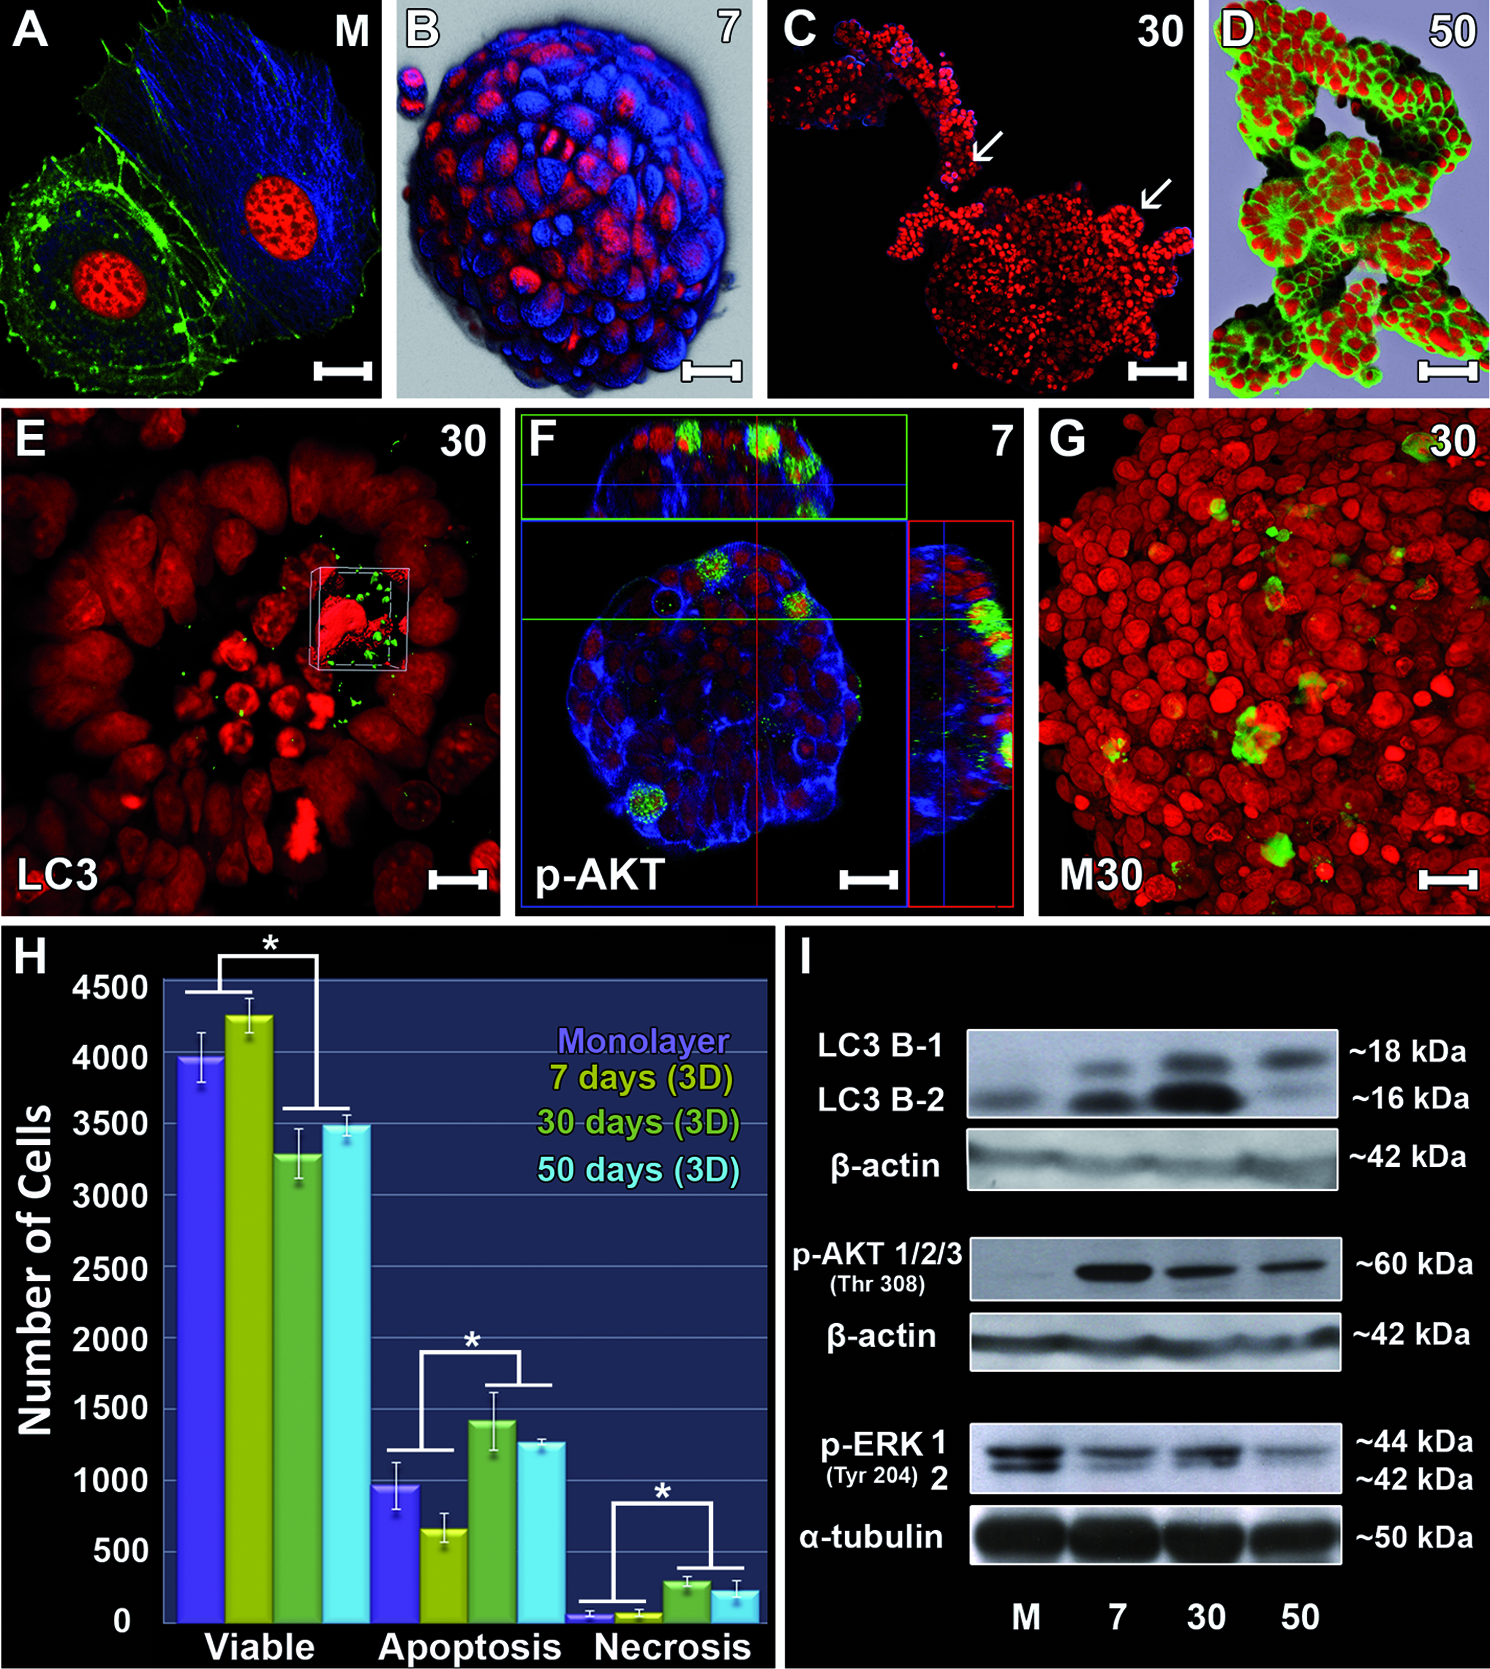
F-actin filaments were observed by FITC-phalloidin staining. MCF-7 cells in monolayer culture showed cytoplasmic protrusions that were rich in F-actin (Fig. 3A). Microtubules were concentrated in the perinuclear region in a radial arrangement in both monolayer (Fig. 3A) and spheroids (Fig. 3B). During 3D culture, the cortex of the spheroids showed a marked cell proliferation, leading to the formation of structures referred to as cortical buds. As shown in Figure 3C, sequential phases of this process were observed from its initial phase, and more developed buds formed at the same time in a single spheroid (on day 30 of culture). At this timepoint, two features in particular were noted: increasing cell death (evidenced by the presence of cell fragments and picnotic nuclei) and elongated morphology adopted by the buds. In larger spheroids (300 μm in diameter), cell death could be due to increased hypoxia and nutrient reduction. The presence of cell death within the elongated structures and the active role of the cell death process in spheroid modification, which led to acinar morphology, were noteworthy. After 50 days of 3D culture, although present from day 30 of culture, elongated branches predominated on the spheroids. By reconstructing optical sections obtained by confocal laser scanning microscopy, formation of a continuous layer comprising one layer of cells was observed. This was present in both acinar and tubular structures (Fig. 3D).
MCF-7 cells grown in monolayer and showing the arrangement of actin microfilaments (green) and microtubules (blue)
Autophagy
The analysis of autophagy processes in the 3D system was performed using the LC3B protein, which is an indicator of autophagy. Within cells, LC3B is present in its cytoplasmic form (LCB3-I) or is directly associated with the plasma membrane of autophagosomes (LCB3-II).
Western blot analysis of the LC3B protein showed that its cytoplasmic form (LCB3-I) was expressed at lower levels compared to its autophagosome-associated form (LCB3-II) in monolayer cell cultures. When protein expression in 3D cultures was analyzed, increasing levels of LC3B-I and LC3B-II expression were observed throughout the culture period. Expression of LCB3-II was consistently increased from monolayer to spheroids after 30 days of culture (the point of the highest intensity). On day 50 of culture, a significant reduction in LCB3-II protein (Fig. 3I) occurred. Spheroids after 30 days of culture were submitted to immunofluorescence with an antibody against LCB3, and the strongest staining occurred in the medullary region before lumen formation (Fig. 3E).
Phosphorylated AKT
We also analyzed expression of a serine/threonine kinase, AKT, which is a molecule downstream of growth factor signaling that mediates cell survival. Expression of AKT in monolayer cultured cells was lower compared with 3D cultured cells. However, in the initial phases of 3D culture, there was an increase in phosphorylated AKT (p-AKT) (shown here after 7 days of culture), which decreased over time (at 30 and 50 days of culture, see Fig. 3I). Immunofluorescence showed high positive staining for p-AKT in cortical spheroid cells after 7 days of culture (Fig. 3F).
Apoptosis
We next assessed cell death by apoptosis using the M30 antibody, which recognizes and binds the cleaved portion of cytokeratin 18. This cleavage process occurs at the initial phase of apoptosis, permitting the observation of early apoptotic cells. Predominance of apoptotic cells at the medullary region was observed by immunofluorescence, and the staining became more intense on day 30 of culture (Fig. 3G). In spheroids cultured for longer periods, M30-positive staining was observed within the luminal space. To further determine the role of apoptosis in this system, we also analyzed expression of an early caspase, caspase 9. Expression of caspase 9 permitted the identification of viable, necrotic and apoptotic cells with and without cell membrane integrity in spheroids after various times in culture (Fig. 3H). The results confirmed our previous morphological observations, suggesting a decrease in the number of viable cells and an increase in the number of cells undergoing death throughout the 3D culture periods. However, a pattern was observed that allowed for separation into two groups; the first group comprised monolayer cells and spheroids after 7 days of culture, and the second group comprised spheroids after 30 and 50 days of culture. The number of apoptotic and necrotic cells was higher in the second group, and the highest frequencies were consistently found in spheroids after 30 days of culture.
Phosphorylated ERK
Expression of the phosphorylated ERK protein (tyrosine 204) was analyzed in the 3D culture environment. The results showed that spheroid cells had decreased expression of this protein during the term of 3D culture. The lowest expression was observed on day 50 of culture (Fig. 3I).
The difference in protein expression between the culture times in each of the culture methods (2D vs. 3D) showed a concomitant increase in three physiologic processes: autophagy, necrosis, and apoptosis, after 30 days of culture. Further, based on all the obtained results, protein expression changed agreed with morphological changes.
Ploidy and cell cycle
On days 7, 30, and 50, the DNA from MCF-7 cells in 3D culture and in a monolayer was stained with propidium iodide, and cells were analyzed by flow cytometry (Table 2). The hypodiploid population increased throughout the culture period, but when compared to results obtained in the monolayer culture, the hypodiploid cells were more frequent in the monolayer than in spheroids on day 7. The percentage of cells in G1 phase significantly increased after the environment changed from 2D to 3D. However, over time, the percentage of cells in G1 was maintained in 3D cultures. The highest frequency of S phase cells was observed in cells grown in monolayer cultures. In the 3D environment, the frequency of cells in S phase decreased throughout the 3D culture periods. The data also demonstrated that the frequencies of hypertetraploid cells (DNA content ≥5C) significantly decreased in 2D cultures compared to 3D culture.
Bold numbers do not present significant differences among them. p<0.05.
2D, two-dimensional; 3D, three-dimensional.
Selection of cells grown in 3D culture and their maintenance
To maintain a homogenous spheroid population with tubular and acinar morphology, we harvested differentiated spheroids on day 50 of culture (Figs. 1D, 2D, and 4A) and returned them to monolayer culture. During the first 24 h after removal from the 3D environment, it was already possible to observe a strong attachment of these cells to the substrate (Fig. 4B). With longer culture times, increasing migration of the cells was observed; migration proceeded from the margin of the spheroids, and over time, the cells assumed a radial direction around them (Fig. 4C). During this process, a gradual decrease in cells in the 3D arrangement became evident, and this impeded spreading and cell migration. After establishment of a monolayer, cells were once again submitted to 3D culture conditions (Fig. 4D). Cells in suspension grouped themselves into a similar pattern already described for spheroids; they assumed an increasing spherical arrangement due to high cell–cell interaction (Fig. 4E on day 5 of culture). After 15 days, it was evident that the selection process for differentiated spheroids was very efficient because at this time, a large population of tubular spheroids was observed (Fig. 4F). In addition to differentiation, spheroids with an acinar arrangement were observed (Fig. 4G). When analyzed for other 10 days (a total of 25 days of culture), spheroids resulting from the selection process showed a morphology very similar to those in which of the spheroids in culture for 50 days that were used for cell line formation. Figure 5C and D show spheroids with a tubular arrangement, and we observed the highest concentration of actin microfilaments in the luminal space both in the tubular (Fig. 5A) and acinar (Fig. 5B) sections with the latter being highly developed.
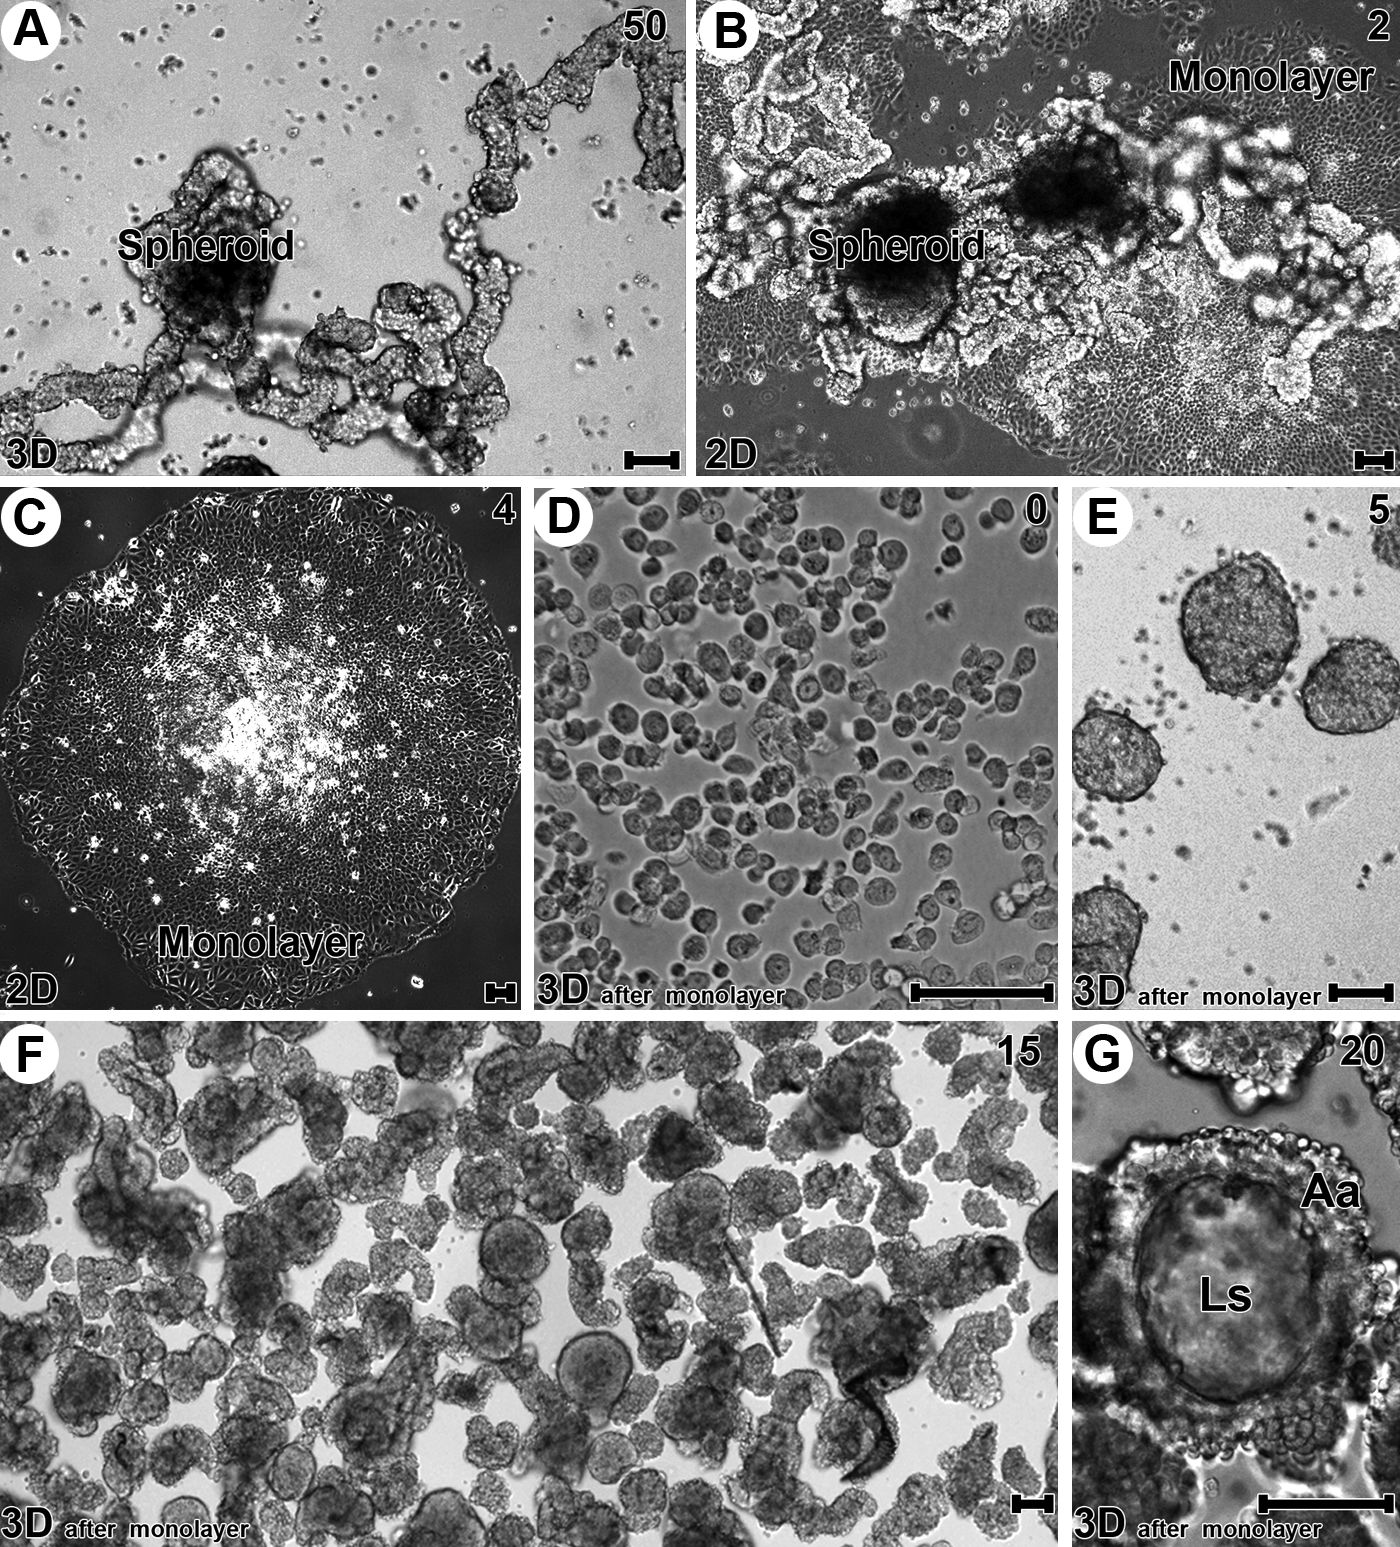
Spheroids after 50 days of culture
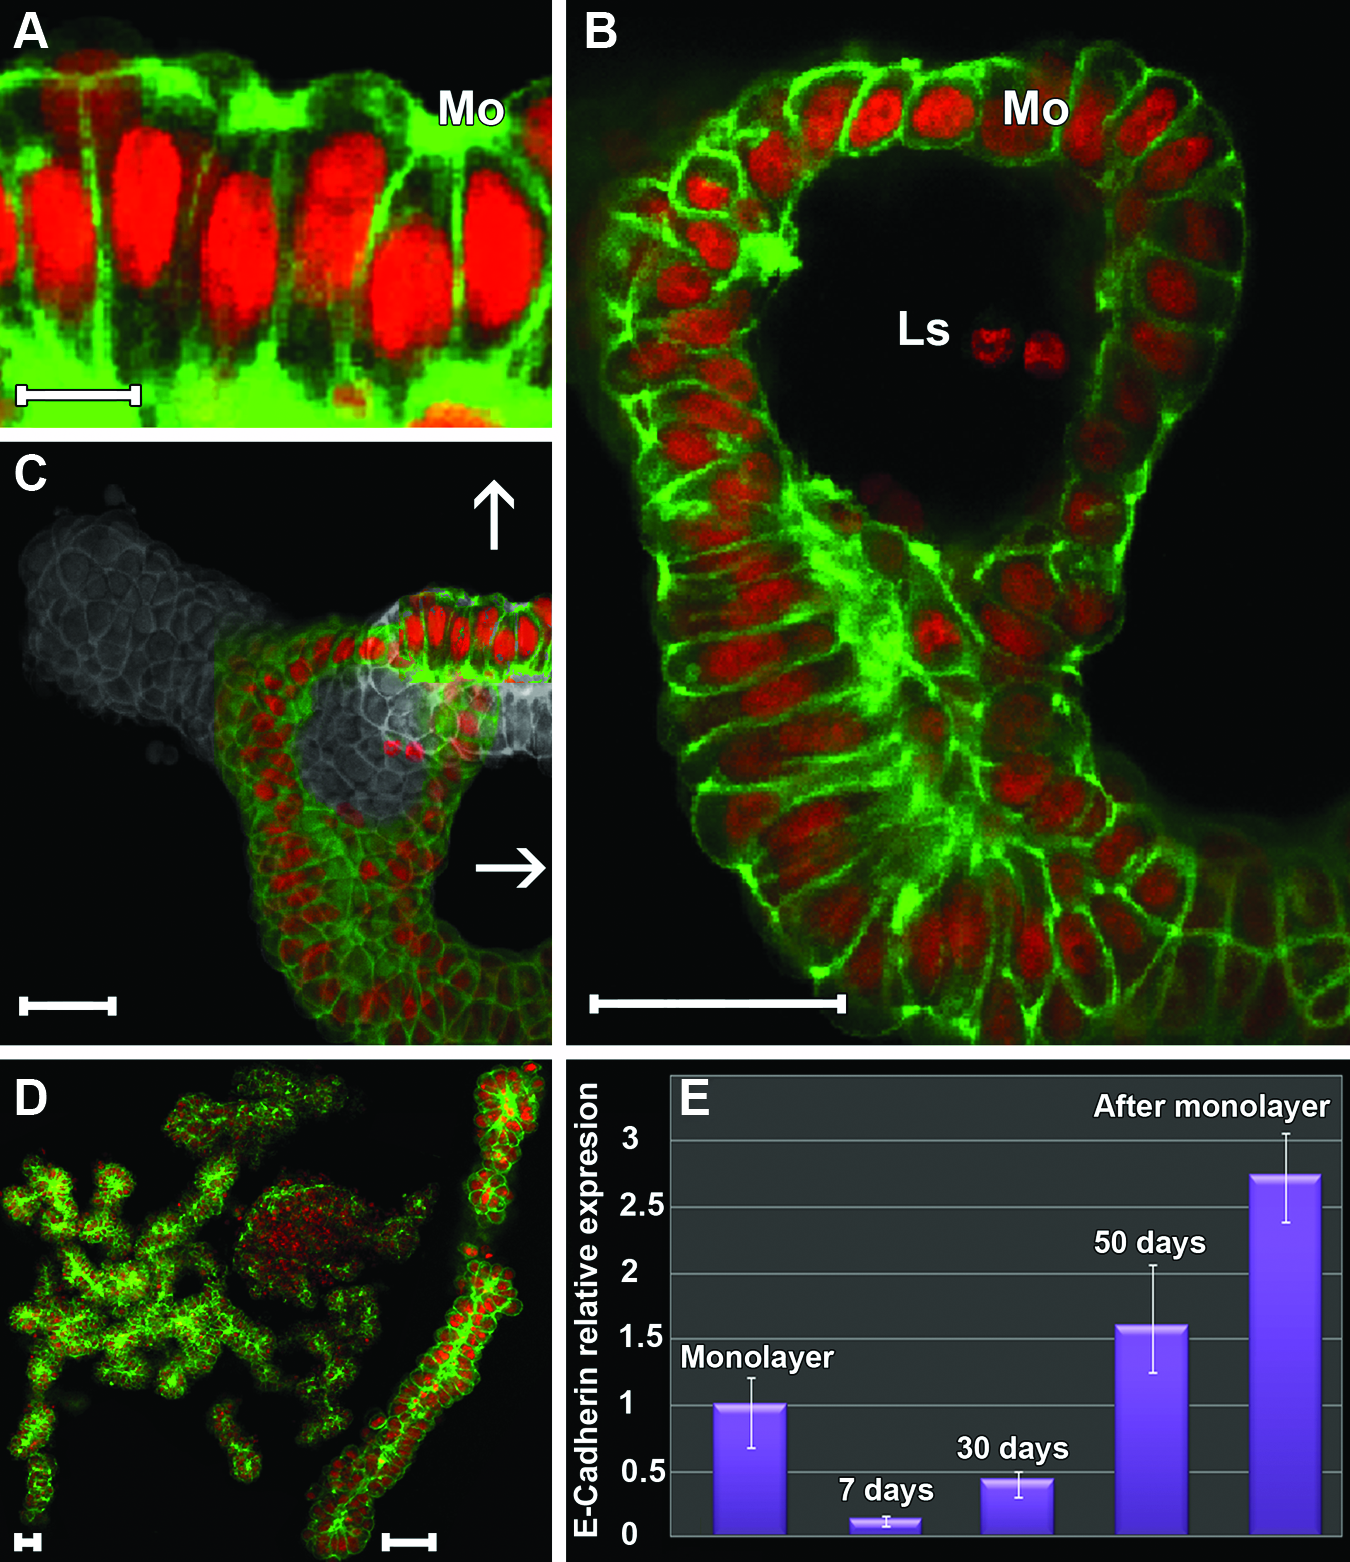
The elongated characteristic of MCF-7 cell spheroids was selected and maintained as a new cell line. After 25 days of 3D culture, these elongated spheroids were sufficiently differentiated. When analyzing reconstructions
E-cadherin mRNA expression
The E-cadherin protein plays an important role in processes related to cell–cell interaction. We thus sought to verify whether E-cadherin was expressed in MCF-7 cell spheroids. The monolayer culture was used as a control, where the relative expression of E-cadherin was standardized to 1. E-cadherin mRNA expression decreased on day 7 in 3D cultures in comparison to monolayer cultures, but it was about 1.6-fold higher than the monolayer culture on day 50 of 3D culture. Notably, mean E-cadherin mRNA expression in spheroids derived from the selection process (after monolayer culture) was 2.73-fold higher (Fig. 5E). It is noteworthy that cells comprising these spheroids underwent monolayer culture (2D) and were later returned to 3D culture. Hence, we conclude that cells expressing more E-cadherin were mainly selected in this process.
Discussion
The development of luminal structures throughout epithelial organogenesis is essential for the formation of different types of vessels, and it is also important in the genesis of organs, such as the pancreas, lungs and mammary glands.25,26 The complexity intrinsic to luminal morphogenesis of breast tissue results from an intimate relationship between epithelial cells and their microenvironment. Recapitulation and analysis of this process in vitro are challenging due to the different regulatory pathways that participate in lumen formation.
The MCF-10A line (derived from normal breast tissue) has proven to be the standard model for in vitro studies on luminal formation.22,27,28 A majority of the studies of spheroids derived from MCF-10A cells use Matrigel to mimic the basement membrane. 29 This method has advanced studies on luminal formation and tumorigenesis, particularly in experiments by Petersen et al. 30 and Weaver et al. 31 The results presented in this article suggested that MCF-7 cells in 3D culture conditions for long periods of time and without Matrigel supplementation could produce unusual spheroids.
Gradual loss of cellular polarization is one of the indications of neoplastic transformation in breast tissues.32,33 It is therefore expected that cellular modifications that result in luminal space formation may be manifested differently in MCF-7 cell lines. This occurs because MCF-7 cells were derived from an invasive ductal carcinoma metastasis,34,35 a condition that would very much distinguish it from normal tissue. MCF-7 cells in a 3D environment with Matrigel rapidly organize themselves into spheroids with substantial cell–cell interactions. This cell arrangement in the form of a mass (according to the classification suggested by Kenny et al. 23 ) does not undergo cavitation; in other words, it does not undergo lumen formation as a result of the death of cells in the medullar region. This morphology is unaltered even when the spheroids are submitted to different substrates, such as polysaccharides (chitosans) and polymers (polylactic acid).36,37
In 2003, Kirshner and collaborators 38 investigated a cell–cell adhesion transmembrane glycoprotein known as CEACAM1. Because this glycoprotein is constitutively expressed in normal cells, its absence in MCF-7 cells promotes significant morphological alterations. In contrast to what had previously been described in the literature, when MCF-7 spheroids transfected were placed in contact with Matrigel, Kirshner, and collaborators showed that lumen formation was similar to that of MCF-10A cells. Recently, Chen and collaborators, 39 working with MCF-7 cells in 3D culture, described the role of calpain-9 and PKC delta in luminal formation in MCF-7 cell spheroids. Lumen formation in MCF-7 cells was eventually reproduced in a co-culture system. Krause 40 developed the coculture system, which comprised a primary fibroblast culture, MCF-7 cells and a mixture of Matrigel and type I collagen. Another important factor in the coculture system was the culture period, which lasted 6 weeks. Interpretation of these results led us to compare the current models with our own model presented in this work. As shown before, 3D culture developed by our group not only permitted the formation of acinar spheroids but also tubular arrangements, indicating the involvement of both cavitation and budding processes in the formation of luminal structures. 24 These characteristics were shared only with spheroids grown in the coculture model. 40
Several factors can affect the selection process of cell populations within cell lineages.34,41 3D cell culture acts as a pressure on selection by favoring the proliferation of cells that are nonresponsive or only slightly responsive to anoikis signaling. Thus, we conclude that during the initial growth stages of spheroids, some MCF-7 cells are better suited to the loss of substrate adhesion. Although it was established in the 1970s, increasing numbers of studies have demonstrated the existence of distinct MCF-7 cell subpopulations. A recent well-studied example is the presence of stem cells in cell lines derived from normal breast tissues. In tumor populations, the small fraction of stem cells is characterized as CD44+ and CD24− cells, thus permitting the separation of these cells by flow cytometry.42,43 When separated from the rest of the population, stem cells arrange themselves into small aggregations known as mamospheres, which have proven to be much more resistant to chemotherapy and radiotherapy treatments. 44 Such cell heterogeneity was also shown in the lumen formation observed in our work. The results presented here indicated that some cell populations could revert to this tumoral phenotype, even in the context of tumor cell lines.
3D cell culture has allowed the observation of differences in hypertetraploid cell numbers. Lu et al. 45 has shown that in the breast tumor MDA-MB 231 cell line, growing numbers of hypertetraploid cells exhibit increased metastatic potential. Therefore, from our results, a reduction in hypertetraploid cells in the 3D environment was also an indication of the gradual selection of a cell population with potential for differentiation. Another difference was the increased percentage of cells in G1 phase after changing to 3D culture. Regulation triggered at checkpoints, such as the G1 checkpoint, plays an important role in the normal progression of cells through the cell cycle. This feature is significantly affected in cancer. 46 Our results showed that the tridimensional environment interfered with the G1 phase of the cell cycle, as indicated by the same percentage of cells found in G1 during the entire 3D culture period.
E-cadherin is one of the best-studied breast cancer suppressors. E-cadherin plays an important role in epithelial tissue organization and polarity, and its dysfunction is associated with tumor progression and metastasis.47,48 The loss of E-cadherin was sufficient to confer metastatic capacity in breast cells by increasing cell motility, invasiveness and resistance to apoptosis. 49 Our qRT-PCR data showed an increase in E-cadherin mRNA expression during the 3D culture period. Along with the morphological analysis, these data indicated that 3D culture led to better cell–cell interaction during the culture period. These results support the viability of our model, as it permits formation of luminal structures with complex cell–cell interactions.
The expression of E-cadherin remained upregulated throughout the duration of the 3D culture, even after differentiated spheroids (after 50 days) were transferred to monolayers. This suggests that cells selected by the 3D culture model maintained higher E-cadherin expression, which would explain the formation of differentiated spheroids in a shorter period.
Returning to discussion on 3D culture models that utilize MCF-7 line, Matrigel's value used in different 3D culture systems is unquestionable. However, the present data showed that addition of Matrigel was not necessary to initiate processes related to spheroid cavitation. Our results show new possibilities for 3D cell analysis because they demonstrated that morphogenesis can be stimulated by factors produced by the cells themselves, not only by exogenous sources as the use of Matrigel. A 3D culture experiment with MCF-7 cells that achieved results similar to ours used a complex system containing collagen, Matrigel and fibroblasts. 40 Our hypothesisis that MCF-7 cells have characteristics similar to those found in normal tissues. These cells would therefore be better adapted in the model of 3D culture proposed in this work.
Through different approaches, apoptosis was found to be related to the cavitation process in lumen formation. In our model, apoptosis induced a gradual reduction in the cells at the medullar region, and in the final timepoints of analysis (30 and 50 days of culture), apoptotic cells increased. In 2002 and 2005, Debnath et al. 50 and Debnath and Brugge, 32 respectively, showed that blocking the apoptotic pathway (using anti-apoptotic proteins of the Bcl-2 family) did not prevent lumen formation. Using a similar model, Mills et al. 51 suggested that cavitation of MCF-10A cell spheroids would be a consequence of cell elimination through autophagy and apoptosis, two distinct but complementary pathways. Autophagy and apoptosis processes were also observed in this work. The highest expression of the LC3B protein that associated with autophagosomes 52 occurred approximately on day 30 of 3D culture, corresponding to the timepoint with the largest numbers of cells undergoing apoptosis.
The effect of ERK activation on pro- and antiapoptotic molecules 53 coincided with our results indicating that the phosphorylated form participated in the process of luminal formation. Anderson et al. 27 found that RAF 1 activation in MCF-10A spheroids promoted the phosphorylation of ERK. The phosphorylated ERK then triggered the activation of a pro-apoptotic protein from the Bcl-2 family, BIM. 54 The latter study showed that the higher the expression of phosphorylated ERK, the smaller the luminal space formation, and the authors indicated that this was due to the degradation of phosphorylated BIM via the proteasome. We obtained similar results where spheroids with more developed lumens (50 days of 3D culture) had lower expression of phosphorylated ERK.
PTEN is a phosphatase with tumor suppressor activity that, via interaction with P13K, regulates AKT activity. 55 When activated, p-AKT promotes cell survival due to its interaction with antiapoptotic molecules, such as Bad and caspase 9.55,56 AKT also influences the cell cycle through regulation of cyclin D1 and inhibition of p27Kip1.57,58 Our results showed intense activity of AKT in the initial phases of the 3D culture, which may be related to two main factors, resistance to anoikis and cell proliferation. Debnath and collaborators 58 also showed an increase in AKT expression in the initial phases of morphogenesis, and they correlated its increase to increased resistance to anoikis. In our model, we found that higher p-AKT expression resulted in less cell death. However, because the immunofluorescent cells were located in the cortical region (mostly during cell division), our results may indicate the role of this protein in the cell cycle.
In conclusion, the 3D cell culture method established in this work improved our understanding of processes related to luminal space formation. Similar to results in models that use normal cell lines, our data further confirmed that normal cell characteristics can be reestablished. We also showed that when selecting spheroids with tubular and acinar morphology, these characteristics remained in the MCF-7 line, permitting us to obtain differentiated spheroids at shorter culture periods.
Footnotes
Acknowledgments
We thank Roberto Cabado Modia Jr. for aid with the artwork 3D reconstructions and cover art, Michelle Menezes, Evandro Niero and Marina Rosa for experimental support. This work was supported by Fundação de Amparo à Pesquisa do Estado de São Paulo (process number 06/01026-0); CNPq (Conselho Nacional de Desenvolvimento Cientifico e Tecnológico); Capes (Coordenação de Aperfeiçoamento de Pessoal de Nivel Superior); and by the Secretaria da Educação do Estado de São Paulo.
Disclosure Statement
No competing financial interests exist.
References
Supplementary Material
Please find the following supplemental material available below.
For Open Access articles published under a Creative Commons License, all supplemental material carries the same license as the article it is associated with.
For non-Open Access articles published, all supplemental material carries a non-exclusive license, and permission requests for re-use of supplemental material or any part of supplemental material shall be sent directly to the copyright owner as specified in the copyright notice associated with the article.