
Abstract
Morphological analysis is an essential step in verifying the success of a tissue engineering strategy where the presence of a desired cellular phenotype must be determined. While morphometry has transitioned from observational grading to computational quantification, established quantitative methods eliminate information by relying on two-dimensional (2D) analysis to describe three-dimensional (3D) niches. In this study, we demonstrate the validity and utility of 3D morphological quantification using two common angiogenesis assays in our fibrin-based in vitro model: (1) the microcarrier bead assay with human mesenchymal stem cells and (2) the rat aortic ring outgrowth assay. The quantification method is based on collecting and segmenting fluorescent confocal z-stacks into 3D models with 3D Slicer, an open-source magnetic resonance imaging/computed tomography analysis program. Data from 3D models are then processed into biologically relevant metrics in MATLAB for statistical analysis. Metrics include descriptive parameters such as vascular network length, volume, number of network segments, and degree of network branching. Our results indicate that 2D measures are significantly different than their 3D counterparts unless the vascular network exhibits anisotropic growth along the plane of imaging. Additionally, the statistical outcomes of 3D morphological quantification agreed with our initial qualitative observations among different test groups. This novel quantification approach generates more spatially accurate and objective measures, representing an important step toward improving the reliability of morphological comparisons.
Introduction
Over the last decade, computational methods have facilitated the transition from observer-based histology to more quantitative measures.2,3 Powerful commercial suites (e.g., Imaris, Lucis, and Metamorph) capable of 3D and 4D image analysis and data processing are now available.4,5 Unfortunately, these packages are often cost-prohibitive; hence, many computational techniques utilize and modify open-source packages such as NIH's ImageJ (Bethesda, MD). For example, plug-ins enable ImageJ users to manually trace microscope images for quantifying branch-like cellular morphologies.6,7 More semi-automated algorithms rely on image segmentation to quickly derive surface area, perimeter length, and lacunarity measurements of tissue structures or cell growths.8–13 However, these methods are based on 2D image analysis, which approximates 3D cellular architecture with 2D planar projections. 2D approaches are even less accurate when tissues exhibit anisotropic growth patterns that fall outside the plane of imaging.
A number of challenges exist in morphological quantification of engineered microvasculature. This subset of cardiovascular tissue engineering aims to repair ischemic tissues by enhancing the natural processes of angiogenesis and vasculogenesis. 14 On the gross morphological scale, native microvasculature exhibits an arborealized hierarchical organization; however, on the microscale, these tubular structures have highly irregular geometries, making morphological analysis a complex and difficult process. 15 Traditionally, histological sections were subjectively scored according to the degree of network extensiveness (e.g., graded 1–5) or vessel numbers were manually determined with Chalkley counts.16,17 Since the advent of computational methods, 2D metrics such as vascular outgrowth lengths, network surface area-to-perimeter ratios, and microvascular densities are now commonly reported.16,18 While such techniques provide measures for comparison, the indirectness of 2D quantification creates two fundamental flaws: these morphological metrics fail to capture all possible spatial information and can lead to misleading conclusions when taken out of context. Varying degrees of observer (or user)-based subjectivity may further diminish the data's credibility. Hence, a need exists to improve the current approach of morphological quantification in vascular tissue engineering and in tissue engineering as a whole.
To overcome some pitfalls of 2D methods, we assembled a quantitative pipeline for 3D morphological analysis based on 3D Slicer (
Materials and Methods
Experimental design
To illustrate the utility of this 3D quantification method, we explored two variables of fibrin-based gel composition: PEGylation and fibrin concentration. In PEGylated fibrin gels, the molar ratio of fibrin-to-PEG remained constant across fibrin concentrations. From these two variables, we devised three experimental groups: 10 mg/mL fibrin +1 mg/mL PEG, 7.5 mg/mL fibrin +0.75 mg/mL PEG, and 5 mg/mL fibrin +0.5 mg/mL PEG. Each fibrin concentration had a corresponding fibrin (only) control: 10 mg/mL fibrin, 7.5 mg/mL fibrin, and 5 mg/mL fibrin. Matrigel, as a well-characterized commercial material for angiogenesis, served as a reference-type control. 30
Materials
Dulbecco's phosphate buffered saline (PBS), phenol red-free low-glucose Dulbecco's modified Eagle's medium (DMEM), fetal bovine serum (FBS), GlutaMAX™-I (100×), and Calcein AM were obtained from Invitrogen (Carlsbad, CA). Endothelial growth medium-2 (EGM-2) was purchased as a bullet kit from Lonza (Basel, Switzerland). Fibrinogen from human plasma (50%–70% protein, ≥80% clottable), thrombin from human plasma (≥1,000NIH units/mg protein), collagen-coated Sigma-Solohill MCBs, and 37% formaldehyde were obtained from Sigma-Aldrich (St. Louis, MO). Penicillin–streptomycin and trypsin/ethylenediaminetetraacetic acid were obtained from ATCC (Manassas, VA). Phenol red-free growth factor-reduced Matrigel was obtained from BD Biosciences (San Jose, CA). Homo-difunctional succinimidylglutarate polyethylene glycol [PEG-(GS)2, 3400 Da] was obtained from NOF America (White Plains, NY).
Cell maintenance
Bone marrow-derived hMSCs (Lonza, Basel, Switzerland) were cultured and expanded in tissue culture-treated plastic flasks (Corning, Corning, NY) with DMEM containing 10% FBS, 1% penicillin–streptomycin, and 2 mM GlutaMAX™-I. As stated by the manufacturer, hMSCs were derived from normal bone marrow culture; this subpopulation tests positive for CD105, CD166, CD29, and CD44 and tests negative for CD14, CD34, and CD45. All cell cultures were incubated at 37°C with 5% CO2.
Cell seeding of MCBs
Collagen-coated MCBs were autoclaved in PBS according to the manufacturer's instructions. MCBs were primed in serum-supplemented DMEM for 1 h at 37°C. hMSCs (passage 3–5) were then trypsinized, centrifuged into a pellet, and re-suspended with collagen-coated MCBs at a concentration of 1.4×10⁶ cells/20 mg MCBs. The culture was gently agitated every 30 min over a 4-h incubation period to minimize MCB aggregation. After seeding, the MCB culture was passed through a 70 μm cell strainer and rinsed with PBS to remove unattached cells. The MCB culture was finally resuspended in the medium at a concentration of 20 mg MCBs/mL.
Preparation of gel components
Human fibrinogen (Fgn) was prepared at concentrations of 80 mg/mL, 60 mg/mL, and 40 mg/mL in PBS, pH 7.8, and solubilized for 2–3 h in a 37°C water bath. PEG-(GS)2 was solubilized immediately before use at 8 mg/mL, 6 mg/mL, and 4 mg/mL in PBS, pH 7.8. Human thrombin (Thr) was reconstituted in sterile ddH2O at 100 U/mL per the manufacturer's instructions and frozen at −80°C. Frozen Thr aliquots were thawed and diluted to a final concentration of 25 U/mL in30 mM CaCl2. All three solutions were sterile-filtered (0.22 μm pore size).
PEGylation of fibrinogen and gelation
Fgn was combined with an equal volume of PEG-(GS)2 (1:10 molar ratio) for 3 min at room temperature to allow for PEGylation. In control gels, PBS was substituted for PEG-(GS)2. The MCB suspension was diluted 1:5 with the medium and combined with an equal volume of PEGylated Fgn (or PBS + Fgn) in two-chambered coverglass (Nuncbrand Lab-Tek II; Thermo Scientific, Rochester, NY). The solution was briefly mixed to evenly suspend MCBs. Gels were enzymatically crosslinked with an equal volume of Thr, yielding a final concentration of 10 mg/mL Fgn and 1 mg/mL PEG-(GS)2. For the 1 mL gels made here, exact volumes of each component were 125 μL Fgn, 125 μL PEG-(GS)2 (or PBS), 250 μL of 1:5 diluted MCBs, and 500 μL Thr. Unreacted PEG-(GS)2 was removed by rinsing the gels with 3–4 volumes of the medium. Finally, the serum-supplemented medium was added to the gels and changed daily for 7 days.
Rat aortic ring culture
Rat aortas were a gift from the lab of Dr. Christine E Schmidt. Briefly, Fischer rats were given an intraperitoneal injection of 1000 U/kg heparin 15 min before perfusion with PBS. Proximal aortas were harvested and rinsed in PBS. Under a dissection scope, fibroadipose tissue was removed and aortas sliced into 1-mm-thick rings. Rings were rinsed three times in an anti-contamination cocktail (EMG-2 with Gentamicin) before a final rinse with EMG-2. PEGylated fibrin gels (10 mg/mL Fgn, 1 mg/mL PEG-(GS)2) were prepared as described above. To encapsulate aortic rings, 125 μL of gel was first polymerized in each well of an eight-chambered coverglass (Nuncbrand Lab-Tek II). Aortic rings were vertically placed in the center of each well, and another 125 μL of gel was polymerized on top. As before, gels were rinsed to remove unreacted PEG-(GS)2. Aortic rings were cultured for 7 days with EGM-2.
Fluorescent staining
On day 7, gels were rinsed with fresh PBS (with Ca+2 and Mg+2) every 15 min for a total of 90 min. PBS was removed and 10 μM Calcein AM was added for 1 h. Gels were subsequently rinsed with PBS every 5 min for a total of 20 min, fixed with 4% neutral-buffered formalin for 30 min, and then rinsed again 2–3 times with PBS.
Confocal microscopy
A confocal scanning microscope (SP2 AOBS; Leica Microsystems, Bensheim, Germany) was used to collect fluorescent image stacks. Under a 10×objective with 512×512 image resolution, Calcein AM was excited with an Argon laser at 496 nm and emission was detected from 510–520 nm. The z-slice thickness was adjusted to maintain isotropic voxel dimensions (∼3 μm in each plane). Three z-stacks were collected per experimental group. For the MCB assay, each stack focused on one MCB and its cellular outgrowth. For the aortic ring assay, we limited each field of view to ∼50% of the specimen due to size constraints.
Image processing and 3D data generation
All image processing was done in a 64-bit Linux (Ubuntu, Natty Narwhal distribution) environment with 8 GB of memory. Each confocal stack (Fig. 1A) was first converted into a Visualization Toolkit (.vtk) file using the VTK Writer in ImageJ's 3D IO plug-in (Release 1.2.4; ImageJ Plugin Project). The resulting binary .vtk was loaded into 3D Slicer (Release 3.6, 64-bit Linux) as a volume and processed as follows (default values were used unless otherwise stated):
1. An additive arithmetic filter was twice applied to quadruple original pixel values. This enhanced dimly fluorescent regions and improved the detectability of valuable pixels. 2. Prepared image volumes were preprocessed in VMTK's Vessel Enhancement module (downloaded June 2010), based on Frangi's vesselness function. Settings were changed to a minimum diameter of 0.1, maximum diameter of 5.0, plate-like and line-like structure of 0.2, blob-like structure of 200, and a contrast threshold of 10. This algorithm predicts which image regions contain tubular structures via eigenvalue analysis of the local Hessian matrix at multiple length scales.31,32 Therefore, continuous paths of fluorescence were intensified while background noise was suppressed (Fig. 1B). 3. Before segmentation, source seeds were manually placed at all network origins directly connected to the MCB and the threshold slider set to 0.05. Cell origins not directly attached to the MCB were ignored. These user-placed seeds initialized the Fast Marching Upwind Gradient (FMUG) used by VMTK's Easy Level Set Segmentation module.23,33–35 By omitting target seeds at this step, the algorithm was allowed to determine terminal points for each network instead of the user. The 3D polydata model produced by FMUG (Fig. 1C) was then smoothed by Geodesic Active Contours evolution (Fig. 1D, E). Evolution settings were changed to an inflation of 60, curvature of 60, and attraction to ridges of 40. Adequate model inflation was essential since the next step is extremely sensitive to surface noise. 4. In VMTK's Centerlines, target seeds were manually placed at all network ends as they appeared in the evolved 3D model (Fig. 1F). Source and target fiducial lists were used by VMTK to calculate an imbedded Voronoi diagram (Fig. 1G). Geometrically, the connected vertices of the Voronoi diagram correspond to the circumcenters of internal tetrahedra (based on Delaunay's tessellation).23,33,35 Thus, these vertices represent a path equidistant to local surfaces at each plotted point, that is, the model's centerline. Centerlines data were extracted (Fig. 1H) and exported to a text (.txt) file as xyz-coordinates with associated radii.
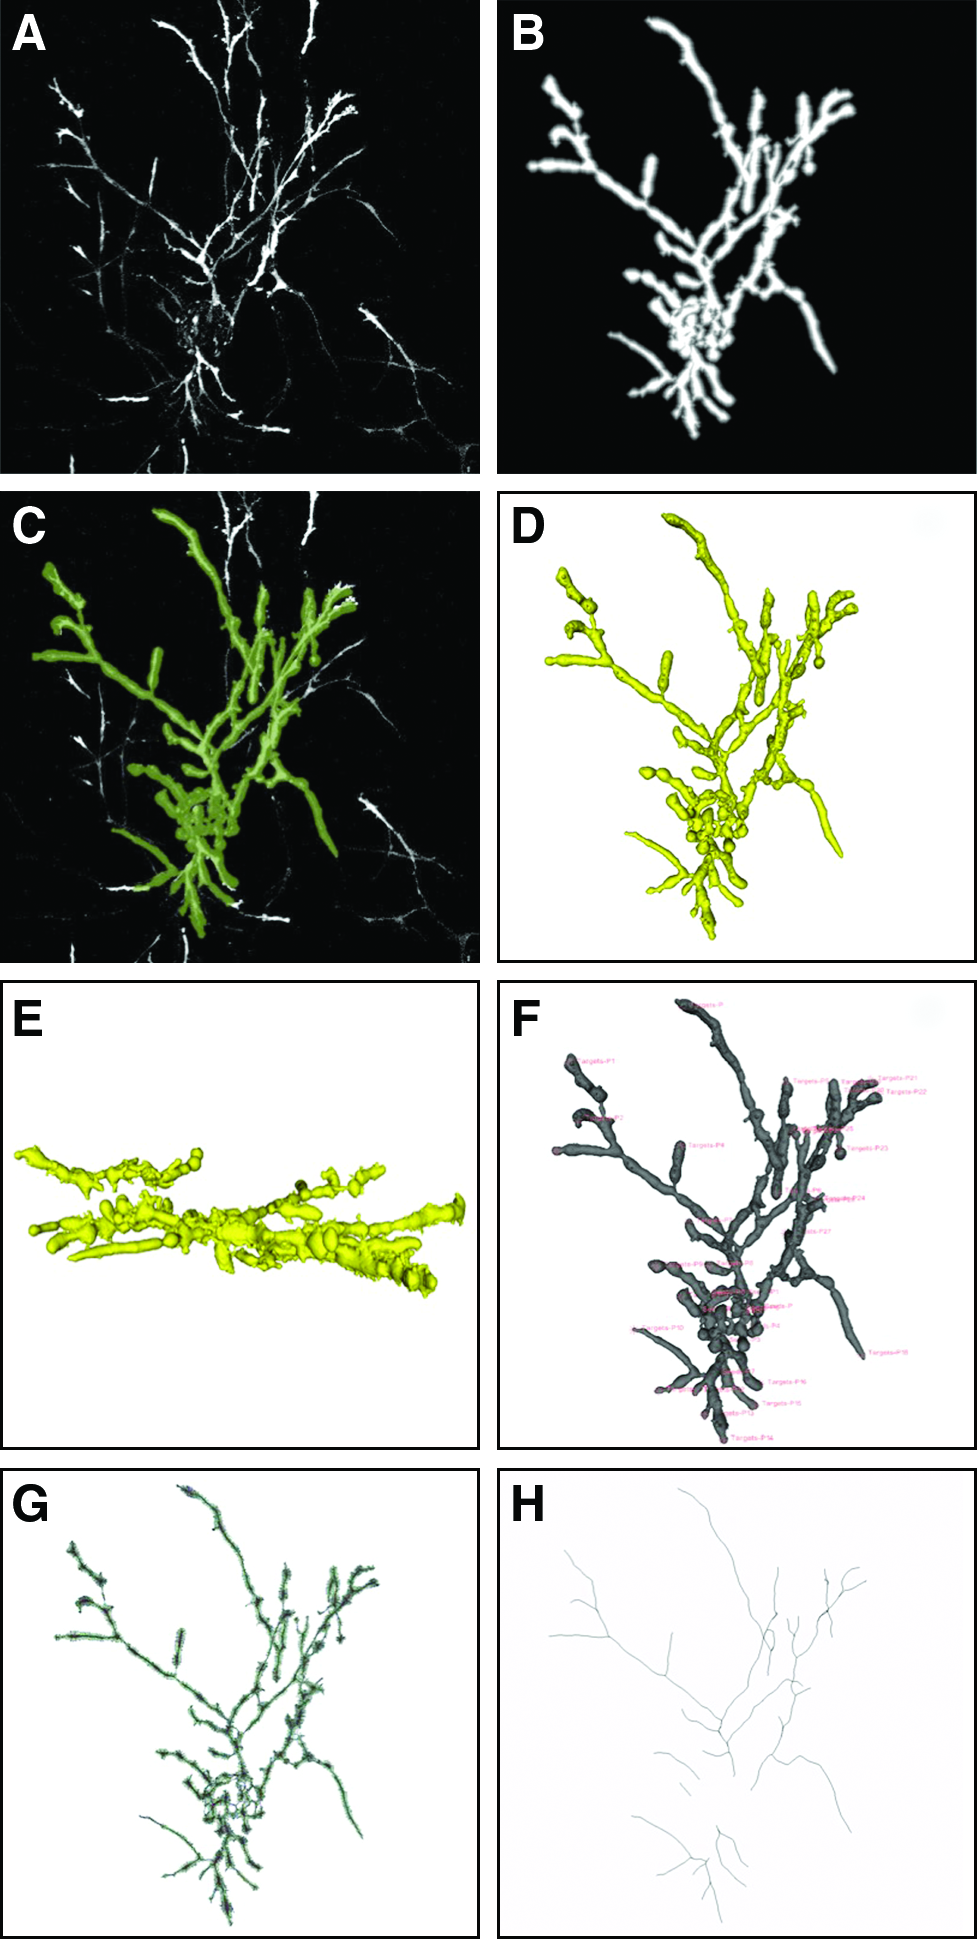
Image processing steps in three-dimensional (3D) Slicer's Vascular Modeling Toolkit. Sample shown is from the 10 mg/mL PEGylated fibrin group.
Image data analysis and quantification
A brief MATLAB (Release 2008a for Macintosh) program was coded to process the centerlines .txt file into descriptive metrics. Table 1 lists and describes key terms and metrics used to define these data; a corresponding schematic of these definitions is provided in Figure 2. Nonunique coordinates were removed before parsing the remaining coordinates into their respective discrete paths (i.e., microvascular network segments) such that no regions were retraced. A user-input threshold determined the start of a new segment such that a distance greater than the threshold indicated a nonconsecutive coordinate; in all cases, a value of 5–10 voxels was sufficient. Voxel space was converted back to original physical dimensions (microns) using the scalar information recorded during image capture. Five metrics were directly calculated from this coordinate data: (1) segment volume, 36 (2) 3D segment length, (3) 2D xy-plane segment length, (4) 2D xz-plane segment length, and (5) 2D yz-plane segment length. Two additional metrics, (6) number of segments per network and (7) degree of branching per network were directly taken from the number of segments parsed and source/target fiducial lists, respectively. Segment metrics (1–5) were summed to obtain whole network metrics.
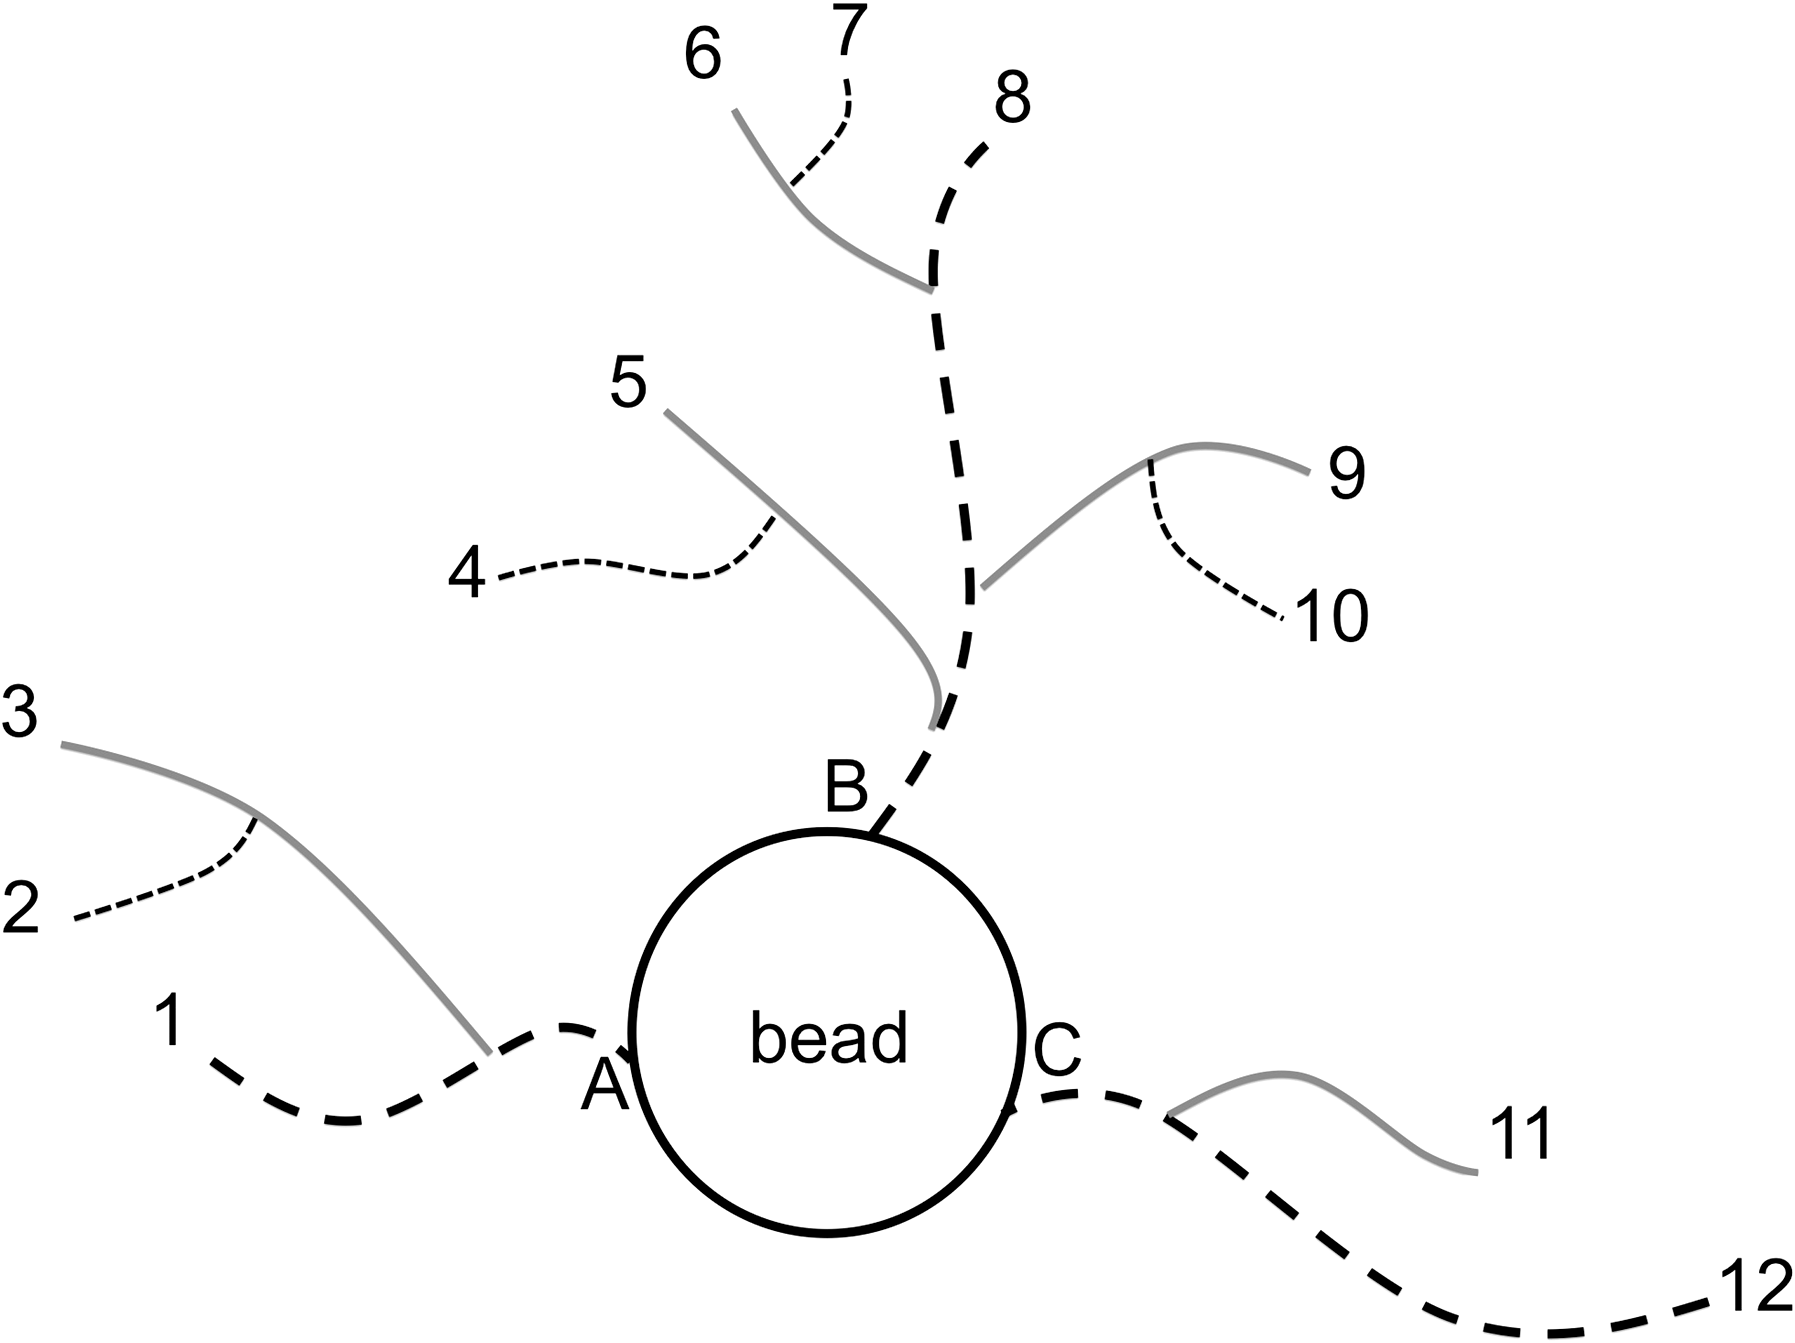
Centerline traces of an MCB with tubular outgrowths. Each numbered line represents a segment defined by a unique, nonoverlapping path; all segments together (12 total) represent one network. Similarly, numbers correspond with target fiducials, while letters correspond with source fiducials. MCB, microcarrier bead.
3D, three-dimensional; 2D, two-dimensional.
Statistical analysis
The assumption of normality was first confirmed with a Shapiro-Wilk w-test. A two-way analysis of variance was applied to each quantitative metric to determine significance between fibrin concentrations and PEGylation. Where significance was found, post-hoc tests were performed to further determine specific relationships of statistical significance. Bonferroni was applied where appropriate. Linear regression was used to determine the strength of correlation between types of length measurements (e.g., 3D vs. 2D xy-plane) with a supplementary analysis of variance (ANOVA) to ascertain whether the slope was zero. All statistical tests were completed in JMP (Release 9.0.2; SAS Institute Inc., Cary, NC).
Results and Discussion
Samples were stained, fixed, and imaged on day 7 of culture. Representative confocal images with overlaid models are given for each MCB group in Figure 3. From these images, we observed that PEGylated fibrin encouraged more extensive vascular networks than fibrin. hMSCs in fibrin possessed a more proliferative and migratory phenotype instead, with more cells present but fewer incorporated into networks. Marginal, if any, differences were evident between the fibrin concentrations examined within both the PEGylated fibrin and fibrin groups. These qualitative observations collectively suggest that fibrin PEGylation is the greater contributing factor in hMSC tubulogenesis than fibrin concentration within our in vitro system.

Confocal z-stack projections. Image stacks for each experimental group were captured under 10× objective; shown is a z-projection using the standard deviation of pixel values. Segmented 3D models are overlaid in green. Scale bar=200 μm. Color images available online at
Validity of 3D slicer and computational artifacts
We noticed a consistent computational artifact during the generation of 3D models: in networks with extensive branching (primarily the PEGylated fibrin groups), some branches appeared to be prematurely cropped before their natural termini. We suspect inhomogeneous intracellular dye distribution created regions of weak fluorescent signal that the marching front segmentation algorithm was unable to bridge. To verify that this computational error did not adversely affect our results, we benchmarked our method against an existing 2D approach based on manual tracing of network outgrowths (ImageJ Simple Neurite Tracer). Lengths from each method were appropriately matched in the 2D xy-plane. Figure 4 shows 2D network lengths generated in 3D Slicer alongside those generated in ImageJ for 10 mg/mL PEGylated fibrin and its corresponding (unmodified) fibrin control group. Network lengths calculated from 3D Slicer and ImageJ were not statistically different, indicating that the computational artifact did not skew the value of our calculations. Similarly, both methods were able to demonstrate that PEGylated fibrin networks were significantly longer than fibrin controls. This study led us to conclude that our method is reasonably calibrated to previously reported techniques, producing similar values and maintaining statistical discrimination power.

Validation of systematic error. X-axis indicates concentration of fibrin in mg/mL. Network branches were traced on z-projections of confocal stacks using ImageJ's Simple Neurite Tracer plug-in. Calculated network lengths based on our computational method were not significantly different than lengths manually traced. However, both methods were able to discern significance between vascular networks formed in PEGylated fibrin and fibrin controls; bars indicate standard error, *p<0.05, **p<0.01.
Comparison of 2D versus 3D morphological quantification of vascular networks
Four different measures of vascular network length were calculated for all seven experimental groups (Fig 5): 3D length, 2D length in the xy-plane, 2D length in the xz-plane, and 2D length in the yz-plane. All measures were derived from 3D Slicer data. When comparing the four different length measures within each experimental group, we found that 2D lengths repeatably failed to agree with their 3D counterpart. This trend appears to directly correlate with the extent of network outgrowth, with PEGylated fibrin groups having the greatest variability. Despite overall inconsistencies, linear regression models indicated strong similarities between 2D xy-plane and 3D network lengths (R2>0.99). ANOVA confirmed this correlation for the 7.5 mg/mL and 5 mg/mL PEGylated fibrin groups (p<0.05). These results suggest that 2D projections in the imaging (xy) plane are a reasonable estimate of true network length. However, this similarity is likely an incidental product of our vascular networks exhibiting significant growth bias in-plane with imaging; confocal volume aspect ratios ranged from 3:1 to 5:1 (xy-plane:z-axis). Such anisotropic growth bias maximized spatial information in the xy-plane and facilitated a near-accurate 2D approximation of network length.

Comparison of 3D and 2D measurement of network length. X-axis indicates concentration of fibrin in mg/mL. 2D measures did not reliably agree with corresponding 3D values and underestimated network length by as much as 40%; bars indicate standard error, *p<0.05.
In culture systems with isotropic growth or with anisotropic growth that occurs out-of-plane with imaging, reliable correlation of 2D and 3D measures cannot be presumed. To substantiate this claim, we applied our 3D morphological quantification method to measure aortic ring outgrowth in 10 mg/mL PEGylated fibrin gels. Outgrowth lengths plotted in Figure 6 show significant disagreement between (all three) 2D estimates and the actual 3D value. We observed no statistically significant difference in 2D lengths between each of the three planes (xy, xz, and yz), suggesting the aortic ring approximates an isotropic growth pattern. Typically, this ring outgrowth would be quantified via manual tracing of a 2D image, similar to the protocol typically entailed by the MCB assay. The results of this study suggest that previously reported network lengths in fact significantly underestimated the true length of aortic ring outgrowth.
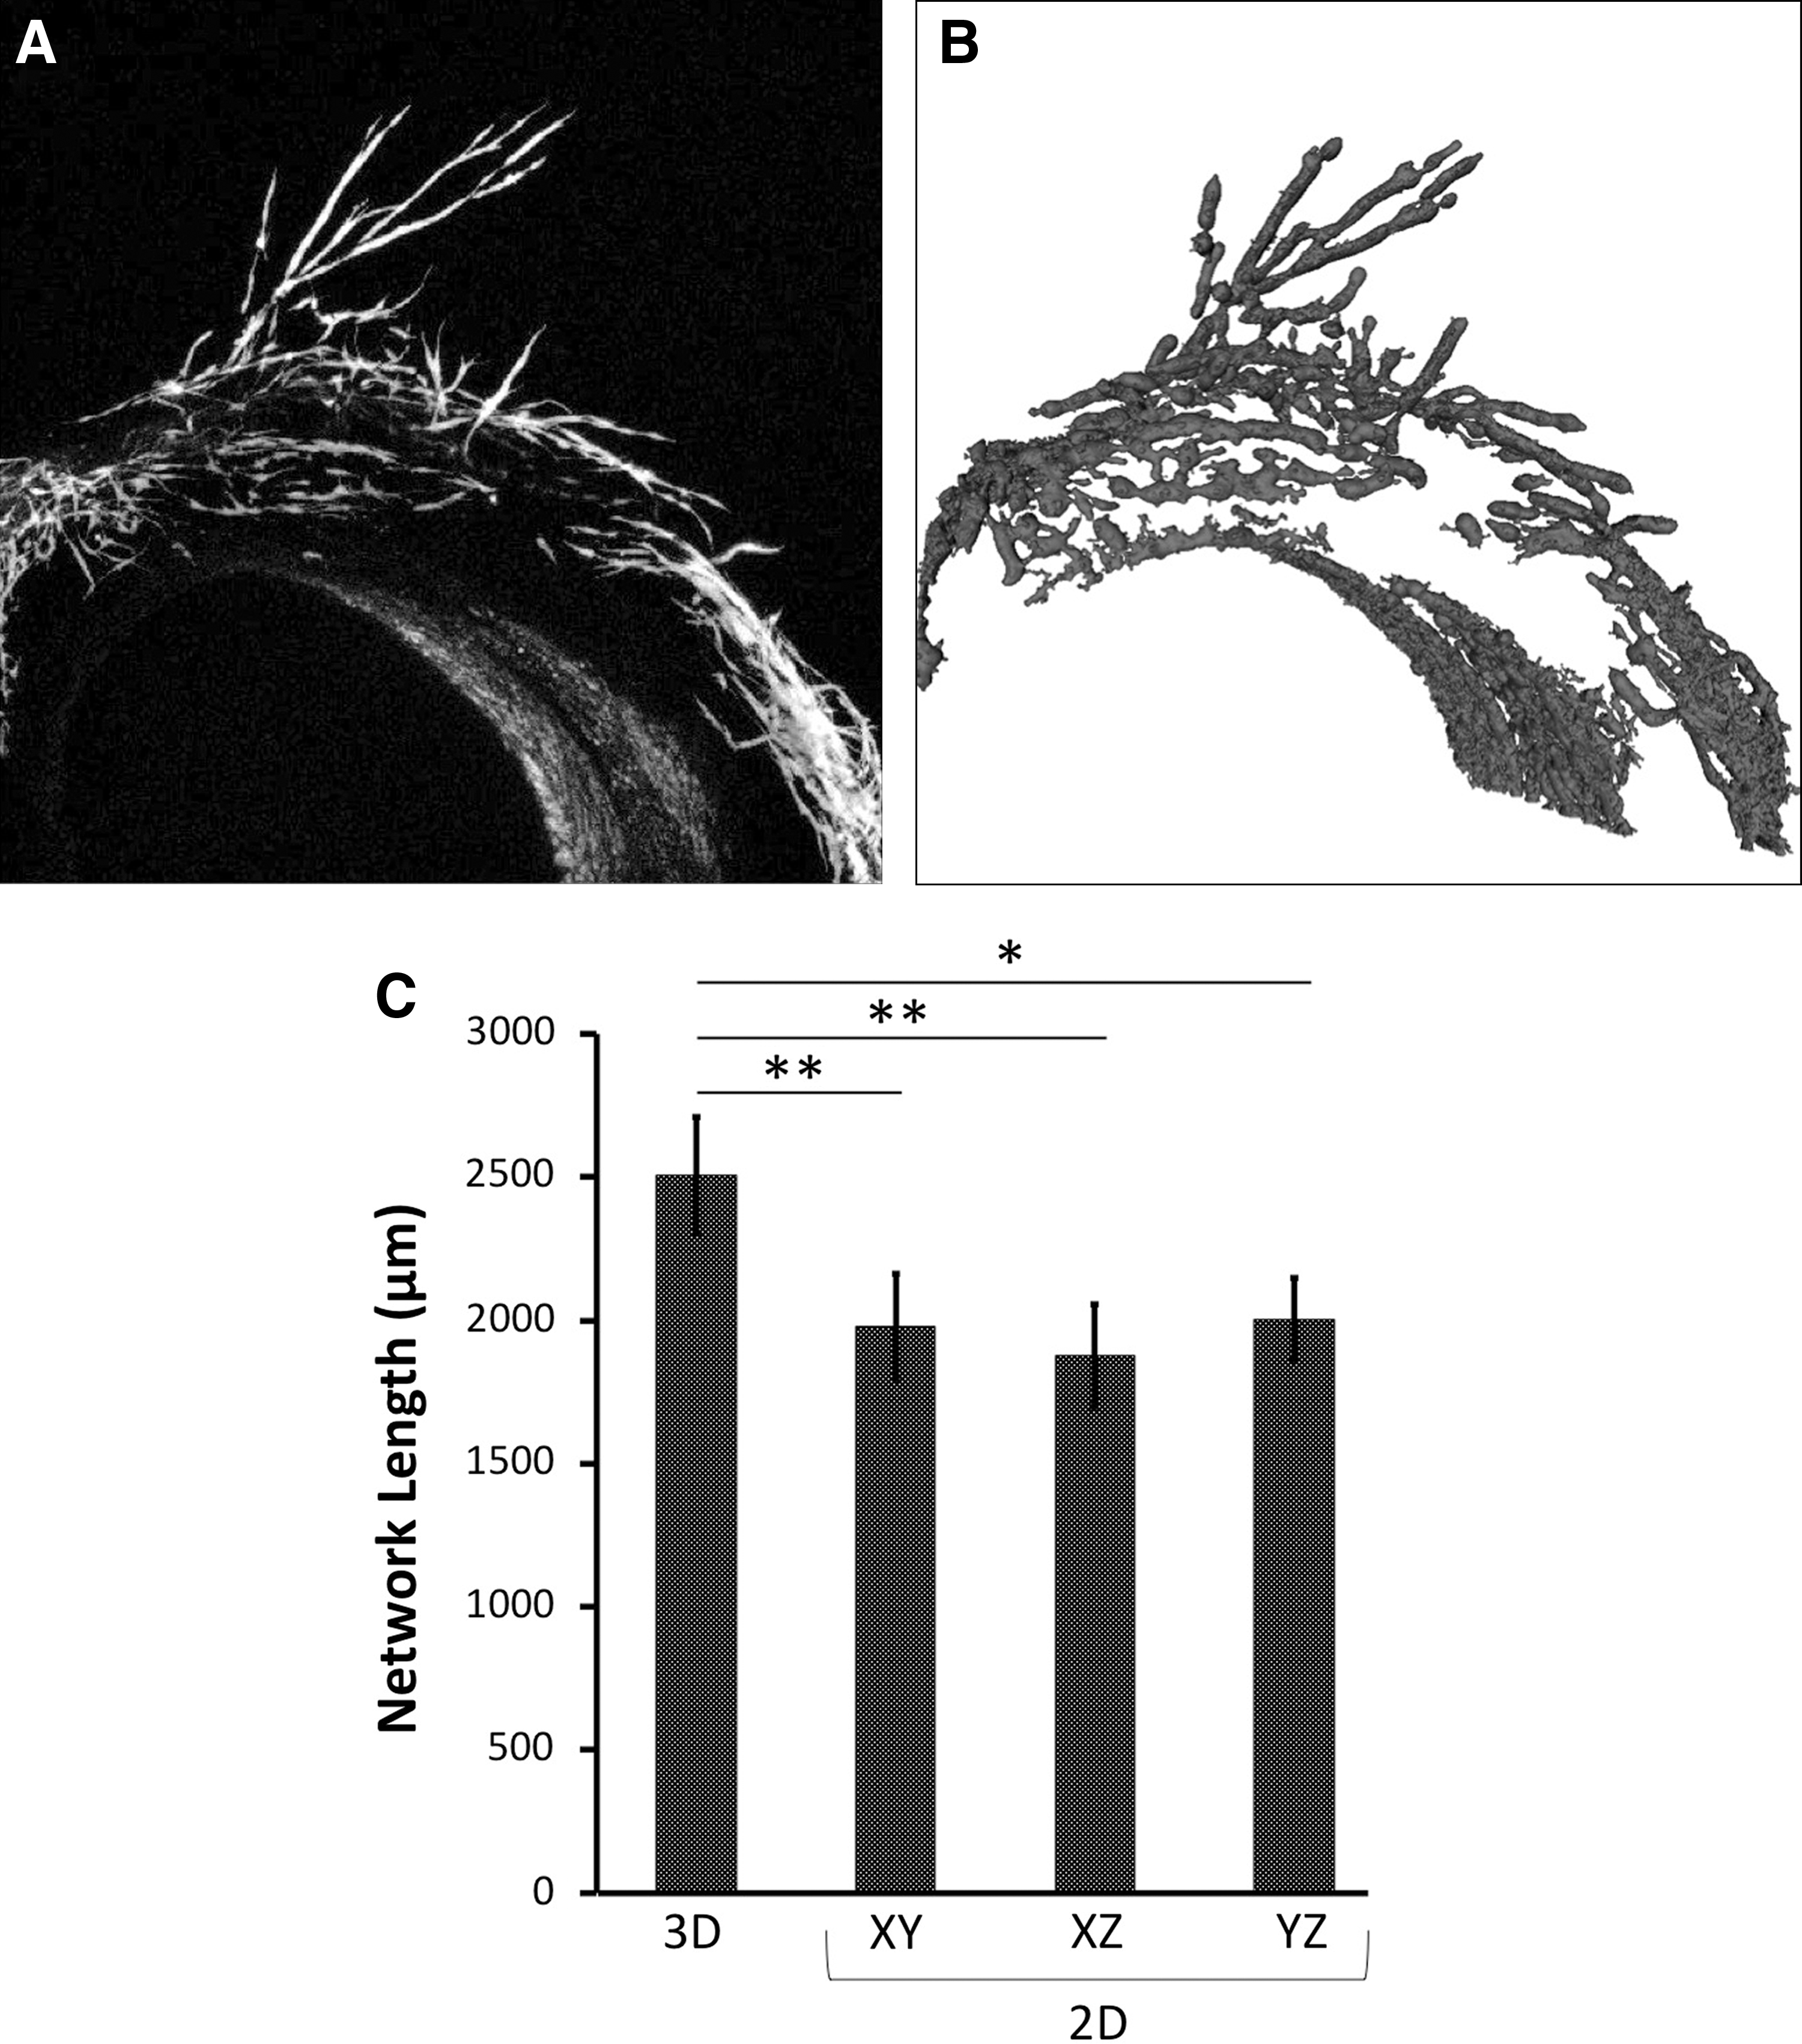
Comparison of 3D and 2D measurement of aortic ring outgrowth.
3D morphometry provides more biologically relevant metrics
As previously mentioned, 2D morphological analysis of vasculature is limited to reporting basic metrics such as surface area, perimeter length, and network length. While important, these 2D metrics fail to provide a complete picture. For example, studying the lumenal architecture of vascular networks necessitates accurate estimates of network volume. Volume estimates from current 2D analytical methods require simplifying assumptions that could distort or misrepresent the true spatial structure of the vascular network. Direct estimates obtained from 3D analysis would overcome such issues and provide clearer, more accurate measures. The 3D morphological analysis easily provides a measure of volume (Fig. 7A) in addition to network length (Fig. 5) and other basic metrics such as the number of network segments and degree of network branching (Fig. 7B, C, respectively). Through further studies, a predictive model may even be developed to correlate volume with lumen formation. More broadly, quantitative morphological outcomes may form the basis of predicting vascular function.

Quantification of angiogenesis-related metrics as processed in MATLAB. X-axis indicates concentration of fibrin in mg/mL; “PEG” indicates PEGylated fibrin and “(-)” indicates fibrin control.
Translating qualitative observation into the quantitative domain
The premise of morphological quantification is to convert qualitative observations into numerical values that enable meaningful statistical analysis. In this sense, any one metric, especially one derived from 2D analysis, is unable to fully and accurately represent the complex morphologies of vascular networks. For example, two networks may exist with similar lengths but possess very different morphologies (e.g., short with many branches vs. long with few branches). Here, we illustrate how a set of biologically relevant 3D metrics is able to fully capture the nuances of vascular network morphology, thus providing more robust quantitative support for our conclusions previously drawn using only qualitative observations.
From confocal images, we observed that (1) PEGylated fibrin produced more extensive vascular networks than fibrin only gels, and (2) fibrin PEGylation was more influential to vascular network development than fibrin concentration. Network length (3D and 2D), volume, and number of segments all trended in agreement with this qualitative assessment. ANOVA revealed fibrin PEGylation to be highly significant in hMSC-derived vascular network formation (volume, p<0.001; length and segment number, p<0.0001). Post-hoc tests confirmed that PEGylated fibrin networks had significantly longer lengths (Fig. 8), larger volumes (Fig. 7A), and more segments per network (Fig. 7B) than fibrin controls. Matched for PEGylation, no statistically significant differences were observed among samples with varying fibrin concentrations, including the degree of network branching (Fig. 7C).

Comparison of PEGylated fibrin and fibrin network lengths as measured in 3D and 2D. “PEG” indicates PEGylated fibrin and “(-)” indicates fibrin control. PEGylated fibrin gels stimulated more extensive human mesenchymal stem cell network formation with significantly longer outgrowth than fibrin controls; bars indicate standard error, *p<0.05, **p<0.01.
Interestingly, volume and number of network segments (Fig. 7A and B, respectively) indicated that Matrigel networks were similar to those of PEGylated fibrin. Network length, on the other hand, suggested a significant difference between the two materials. As previously discussed, the use of a single metric produces misleading conclusions, and only the additional context from multiple metrics can provide a full picture of the network morphology. Here, the collective metrics suggest that Matrigel networks are much shorter and broader than PEGylated fibrin networks despite having a similar number of branches.
Summary
Our 3D morphological quantification method was able to numerically capture the qualitative observations regarding vascular network development in fibrin-based gels. Final numerical outcomes paralleled the original observations: significant experimental differences (PEGylation) were highlighted while negligible differences failed to be recognized (fibrin concentration). Quantifying complex tissue properties such as morphology helps limit the error associated with subjective versus objective measures. Minimizing user-based decisions and relying more heavily on semi-automated computational approaches further improve objectivity. Additionally, matching the 3D nature of complex tissues with an appropriately 3D analytical technique can sharpen the accuracy of morphological assessment. As the field of tissue engineering continues to progress and produce increasingly complex constructs, methods of construct assessment must progress in tandem to ensure that our results remain robust and relevant. The method described here will hopefully serve as a basic platform to grow more detailed 3D quantification approaches.
Footnotes
Acknowledgment
The authors would like to acknowledge financial project support from the American Heart Association (AHA) Grant-in-Aid. Salary support for J.R. was provided by the Department of Defense through the National Defense Science and Engineering Graduate (NDSEG) Fellowship and the Cockrell School of Engineering through the Tucker Family Endowed Graduate Fellowship in Engineering. This material is also based upon work supported by the National Science Foundation under Grant No. CBET-0845239. Confocal image collection was performed at the Microscopy and Imaging Facility of the Institute for Cellular and Molecular Biology at UT Austin. All other work was performed in the Laboratory for Cardiovascular Tissue Engineering in the Biomedical Engineering Department of UT Austin. We would like to thank Dr. Christine Schmidt for generously providing the rat aortic rings. We would also like to thank Dr. Mia Markey for her image-processing expertise, sharing computational resources during preliminary data collection, and serving as an article reviewer.
Disclosure Statement
No competing financial interests exist.