
Abstract
Tissue engineering constructs and other solid implants with biomedical applications, such as drug delivery devices or bioartificial organs, need oxygen (O2) to function properly. To understand better the vascular integration of such devices, we recently developed a novel model sensor containing O2-sensitive crystals, consisting of a polymeric capsule limited by a nanoporous filter. The sensor was implanted in mice with hydrogel alone (control) or hydrogel embedded with mouse CD117/c-kit+ bone marrow progenitor cells in order to stimulate peri-implant neovascularization. The sensor provided local partial O2 pressure (pO2) using noninvasive electron paramagnetic resonance signal measurements. A consistently higher level of peri-implant oxygenation was observed in the cell-treatment case than in the control over a 10-week period. To provide a mechanistic explanation of these experimental observations, we present in this article a mathematical model, formulated as a system of coupled partial differential equations, that simulates peri-implant vascularization. In the control case, vascularization is considered to be the result of a foreign body reaction, while in the cell-treatment case, adipogenesis in response to paracrine stimuli produced by the stem cells is assumed to induce neovascularization. The model is validated by fitting numerical predictions of local pO2 to measurements from the implanted sensor. The model is then used to investigate further the potential for using stem cell treatment to enhance the vascular integration of biomedical implants. We thus demonstrate how mathematical modeling combined with experimentation can be used to infer how vasculature develops around biomedical implants in control and stem cell-treated cases.
Introduction
A major factor limiting host tissue–implant integration is the foreign body reaction (FBR) that biomedical implants often elicit from the host. An FBR is the natural response of the body against foreign objects, and is characterized by an initial, wound healing-like phase during which fibroblasts and inflammatory cells, including neutrophils, monocytes, lymphocytes, and macrophages, localize to the implant site. Wound healing is followed by the formation of an avascular sheath comprising of fibroblasts embedded in dense collagen matrix, as well as monocytes, differentiated macrophages, and giant cells adjacent to the implant. 5 A schematic of this process is presented in Figure 1. The avascular sheath can severely limit the exchange of molecular species between the device and nearby microcirculation, which proves to be a handicap to many of the intended applications of such implants. 6 Therefore, we and others,6,7 are developing a tissue engineering approach to tackle the enduring problem of FBR. Our method involves the co-implantation of progenitor stem cells with biomedical devices to improve vascularization in the region that surrounds the implants.

An important measure of the success of our approach is the density of functional microvasculature in the peri-implant space, as well as the local O2-tension. To measure the O2-tension noninvasively and in real time, we have developed a novel implantable device containing an O2-sensitive spin probe that is placed inside a nanoporous filter-limited capsule. 8 The device was implanted subcutaneously in mice adjacent to a hydrogel plug that contains a population of c-kit/sca-1-positive bone marrow progenitor cells. Using this experimental paradigm, we have demonstrated a long-lasting stimulation of neovascularization at the implant site and a corresponding increase in implant-level oxygenation, as detected by continuous in vivo electron paramagnetic resonance (EPR) oxymetry. Immunohistochemistry of the implants at 10 weeks revealed clear evidence of an FBR-like reaction to the control devices, with collagen deposition, F4/80-positive macrophages, and giant cells detected. In contrast, an active process of adipogenesis, coupled with extensive neovascularization, was detected on the cell-treated implants. Further, the partial pressure of O2 was observed to be consistently higher in the cell-treated case than in the control one (compare Fig. 2A, B).

Fit to time-course partial O2 pressure (pO2) measurements at the implant edge in the case of
The experimental results reported in Butt et al. 8 suggest that the application of stem cells has therapeutic potential in terms of improving peri-implant vascularization. To assess the benefit of stem cell therapy fully, it is important to gain a quantitative interpretation of the experimental data. In this article, we develop a mathematical model of peri-implant vascularization, which provides a possible mechanistic explanation and quantitative evaluation of the experimental observations. The model consists of a system of coupled ordinary and partial differential equations that relate angiogenesis and tissue oxygenation to either an FBR-induced inflammatory response (for the control experiments), or adipogenesis (for the cell-treatment experiments). While several models of wound healing angiogenesis9–12 and glucose transport to implanted glucose sensors13,14 have been proposed, to the best of our knowledge angiogenesis related to FBR or adipogenesis has not previously been modeled.
By fitting our model to the O2 tension data reported in Butt et al. 8 , we are able to estimate values of key parameters relating to the rate of avascular sheath formation in the case of FBR; rates of pre-adipocyte proliferation and differentiation in the case of adipogenesis; and rates of angiogenic factor production in both cases. The validated model is then used to predict the thickness of the stem cell coating that surrounds the sensor and the density of stem cells implanted within it that would give rise to sustained vascularization of the peri-implant space. An important advantage of the model is that it automatically generates spatiotemporal data relating to both the degree of vascularity and the O2 tension in the space adjacent to the implant. This underscores the utility of our model as a valuable aid to experimentalists as they try to improve the design of nanoporous filter-limited biomedical implants.
Description of the Mathematical Model
The vascularization and remodeling of the peri-implant space can be described in mathematical terms by a system of reaction-diffusion-advection equations that govern the spatiotemporal dynamics of the key biophysical variables involved in this process. The core variables are the angiogenic factor concentration (U) in units of μM, the microvascular density (V) in units of number per mm2 cross-sectional area, and the O2 tension (C) in units of mmHg, and their spatiotemporal evolution is described by a system of partial differential equations. To distinguish between vascularization resulting from FBR or adipogenesis, we propose two submodels comprising ordinary and partial differential equations that describe the time-rate of change of dependent variables peculiar to each response. The FBR submodel is used to simulate the control experiments and introduces the inflammatory cell density (M) and the density of the cellular constituents of the avascular sheath (G) as FBR-specific variables. The adipogenesis submodel simulates the cell treatment experiments, by introducing variables for the stem cell density (S) and pre-adipocyte density (A).
As the implant is cylindrical, with the O2-sensitive crystals located at one end 8 , we consider a two-dimensional, radially symmetric geometry (Fig. 1B) in which all model variables depend on r, the distance from the center of the implant, and time t. We assume further that the center of the implant is located at r=0, that r=Ri denotes the radius of the implanted sensor, that r=L0 represents the initial radius of the hydrogel plug that surrounds the implant, and that as r→∞ the tissue is healthy.
Core model equations
The core model variables are microvascular density V(r,t), O2-tension C(r,t), and angiogenic factor concentration U(r,t). These variables are defined on the region Ri≤r<∞ (see Fig. 1B). The equations governing the dynamics of V, C, and U are discussed in detail below.
Microvascular density, V(r,t)
We assume that microvessels form as a result of the proliferation and chemotactic movement of endothelial cells that are stimulated by the angiogenic factor U. A background rate of vessel formation and remodeling is incorporated to account for microvessel turnover in healthy tissue. Further, emergent vascular sprouts are assumed to exhibit a small degree of random motion, and also to move chemotactically in response to angiogenic cues.10,15,16 Combining these processes, the equation governing the microvessel density V(r,t) is given by
In Equation (1), Dv represents the assumed constant random motion coefficient of the vascular sprouts, while the function χ(U) is a measure of the chemotactic sensitivity of sprout tip cells to the angiogenic cue U. We use a receptor-kinetic law prescribing
O2 tension, C(r,t)
We assume that the dominant processes regulating the distribution of O2 within the tissue are delivery via the vascular network, diffusion through the tissue, and uptake by the tissue. The equation governing the tissue O2 tension C(r,t) is given by
Here, Dc represents the diffusion coefficient of O2 in tissue, while
Angiogenic factor concentration, U(r,t)
We assume that angiogenic factors diffuse through the tissue, are produced by the tissue (via an inflammatory response or adipogenesis), are removed by the vasculature, and undergo natural decay. Combining these processes, we deduce that the equation governing the angiogenic factor concentration U(r,t) is
Here, Du represents the constant diffusion coefficient of angiogenic factors in tissue. The functional form of the production term fu depends on the experimental conditions: for the control experiments, inflammatory cells M are assumed to produce angiogenic factors at a rate fu=fFBR(M,t,r), while for the cell treatment experiments, differentiating pre-adipocytes A produce angiogenic factors at a rate fu=fAdip(A,t,r). The functional forms of these rates are discussed below in the relevant subsections. Finally, angiogenic factors undergo natural decay at a rate λu and are removed by the vasculature at a rate β. We assume that U=0 in vessels.
Initial and boundary conditions
As the O2 sensor is hermetically sealed, zero-flux boundary conditions for V, C, and U are imposed at the implant edge. We assume further that V and C approach normal values of Vh and Ch and that U vanishes in healthy tissue, as r→∞. That is,
Finally, we suppose that at t=0, the region 0<r≤L0 is devoid of vessels and O2, while the region r>L0 contains healthy tissue, with vessel density Vh and O2 concentration Ch. Additionally, the entire tissue is assumed to be devoid of angiogenic factors. Thus, initial profiles for V, C, and U can be written as
FBR submodel
The FBR-specific variables are the inflammatory cell density [(M=M(r,t)] that is defined on the region Ri≤r≤∞ and the avascular sheath density [G=G(t)] that is defined at r=Ri (see Fig. 1). The equations governing the dynamics of M and G are as follows:
where H(.) represents the Heaviside step function defined as
Vascularization of the implant space is assumed to occur in two phases. Initially, vessel formation and migration occur while the hydrogel plug is being invaded by inflammatory cells (M), a process that we model with a first-order convection equation [Equation (4)]. In the absence of suitable experimental data, we assume that the cells invade the plug at a constant speed λF, reaching the edge of the sensor (r=Ri) after some time t=tF. The hard plastic material of the implant stimulates the inflammatory cells to produce an FBR, resulting in the formation of an avascular sheath at the site of the implant (r=Ri). The density of the cellular components of the sheath is modeled by Equation (5), and the sheath is assumed to remain spatially localized at r=Ri. The first term on the right hand side of Equation (4) represents recruitment of inflammatory cells and fibroblasts to the implant, this rate being inhibited by the developing avascular sheath G. 5 Once G reaches a width of about 1–2 cells thick, the FBR is assumed complete and the inflammatory response becomes negligible. 5 The second term in Equation (4) represents loss of M at a rate λM due to natural death and the conversion of monocytes into giant cells that contribute to the avascular sheath. A corresponding source term appears in Equation (5) to describe the rate at which the sheath forms. The rate constant cM represents the rate of conversion of monocytes into giant cells and the production of collagen by the fibroblasts that are part of the M cell population.
For the control experiments (without stem cell supplementation) we couple the core model to the FBR submodel via the angiogenic factor production term fFBR [see Equation (3)]. We assume that this rate is proportional to the inflammatory cell density M, and is given by
where KM is a constant of proportionality.
Initial and boundary conditions
For the control experiments, the following boundary and initial conditions are prescribed for the inflammatory cell and avascular sheath densities.
Here, M0 is the (initial) density of inflammatory cells localized at the hydrogel edge in response to the wound created by the implantation of the O2 sensor.
Adipogenesis submodel
The adipogenesis-specific variables are the stem cell density [S=S(r,t)] and the pre-adipocyte density [A=A(r,t)], both variables being defined on the region Ri≤r≤∞ (see Fig. 1). The equations governing the dynamics of S and A are as follows:
Death
Proliferation Differentiation
In the cell-treatment case, we assume that the stem cells are uniformly distributed in the hydrogel plug and undergo natural death at rate λS [see Equation (7)]. The stem cells are assumed to stimulate from the host an adipogenic, rather than an FBR, response, with circulating pre-adipocytes recruited to the hydrogel plug in response to growth factors released from the stem cells.
In the absence of suitable experimental data, these growth factors are not explicitly included in our model. Instead, we assume that the migration and proliferation/differentiation of pre-adipocytes, as modeled by Equation (8), is a direct response to the presence of the stem cells. Briefly, the pre-adipocytes are assumed to invade the hydrogel at a speed that is an increasing and saturating function of the stem cell density S. The constant λA denotes the maximum speed of invasion, and KA is a measure of the sensitivity of the invasion speed to stem cell density. We denote by tA the time at which the pre-adipocytes first reach the implant and assume that thereafter they cease migrating. We further assume that the pre-adipocytes are stimulated to proliferate by the stem cells at a rate that is an increasing and saturating function of S. The constant aA denotes the maximum rate of pre-adipocyte proliferation, and bA is the stem cell density at which rate of pre-adipocyte proliferation is half its maximum value. Finally, pre-adipocytes differentiate into adipose tissue at a constant rate cA.
The core model is coupled to the adipogenesis submodel via the angiogenic factor production term fAdip in Equation (3). Guided by experiments in which adipose-derived stromal cells were found to secrete high levels of vascular endothelial growth factor (VEGF) in vitro, and to induce a strong angiogenic response when transplanted in the vicinity of polyurethane implants in vivo,
17
we take fAdip to be proportional to the pre-adipocyte density A, with constant of proportionality ξA, so that
Initial and boundary conditions
The following boundary and initial conditions are used to close the partial differential equations for the pre-adipocyte and stem cell densities when considering the cell treatment experiments.
Here, A0 represents the initial concentration of pre-adipocytes that are localized to the hydrogel plug edge in response to the chemotactic cues that are assumed to originate from the stem cells, and S0 is the initial density of stem cells seeded in the hydrogel plug.
Model simulation and parameterization
Equations (1)–(3) are common to both the control and cell treatment cases. When simulating the control experiments, Equations (1)–(3) were solved with Equations (4)–(6), which define the FBR submodel. The cell treatment experiments were simulated by solving Equations (1)–(3) and Equations (7)–(9), which represent the adipogenic submodel. Our numerical method was an explicit finite difference scheme, with forward stepping in time, centered differencing in space for diffusion terms, and upwinding for chemotactic terms. Where possible, model parameters were estimated from the literature or by fitting time courses of O2 tension in experiments as reported in Butt et al.
8
, with best fits shown in Figure 2A and B. Matlab's in-built nonlinear curve fitting tool “lsqcurvefit” was used for obtaining these fits (further details of parameter estimation, and a list of parameter values can be found in the Supplementary Data; Supplementary Data are available online at
Results
Numerical simulation results are described in the sections that follow. All simulations were carried out over a time period corresponding to 10 weeks, the timescale of the experiments in Butt et al. 8
FBR model validation
Simulations of Equations (1)–(6) were fit to experimental data in Butt et al. 8 in order to estimate parameters in Equations (1), (4), and (5) relating to the chemotactic sensitivity of developing microvascular sprouts and the FBR process. The results presented in Figure 2A reveal that predicted values of the O2 tension at the implant edge are in good agreement with the experimental data.
Our model allows us to predict the strength of the angiogenic signal released by the inflammatory cells during the FBR. The model also predicts how the microvascular density and O2 concentration in the peri-implant space change over time. During the first week, as the hydrogel is being degraded by invading inflammatory cells, new blood vessels form and migrate into the wound space that is created by the degradation of the plug. The O2-tension in the wound space rises as it becomes vascularized. Once the inflammatory cells reach the implant, there ensues a period during which vascular granulation tissue forms adjacent to the implant edge (weeks 1–4). The inflammatory cell density increases as the host reacts to the implant, causing levels of the angiogenic factor to rise. This, in turn, stimulates a high degree of angiogenic activity, with the microvascular density within a 0.5-mm radius of the probe rising rapidly to its maximum level by the end of week 4. As a result, the local O2 tension rises to its maximum level. The density of the cellular components of the avascular sheath surrounding the implant also increases.
Over time, the FBR and associated angiogenic activity diminish so that by weeks 4–10, the angiogenic factor concentration in the wound space is negligible. Now, vessel remodeling becomes dominant and the microvascular density and the O2 tension return to near-normal levels associated with the surrounding healthy tissue (see Supplementary Movies showing how the spatial distributions of V, C, and U evolve over time, and time-courses of the angiogenic factor concentration and the avascular sheath density at the implant edge).
Cell treatment model validation
Equations (1)–(3) and (7)–(9) were simulated to model the peri-implant vascularization resulting from adipogenesis. Time-course O2 tension data were fit to experimental data in Butt et al. 8 in order to estimate parameters relating to adipogenesis, which appear in Equations (1), (7), and (8). The best fit is shown in Figure 2B.
During the first few weeks, as the density of pre-adipocytes within the plug increases, and as they infiltrate more of the plug, the angiogenic factor concentration is predicted to increase. By about 2 weeks, the entire plug is infiltrated by pre-adipocytes, which act as sources of angiogenic factors. There follows a sharp increase in the microvessel density at the edge of the plug, and over these 2 weeks, the newly formed microvessels invade the plug, causing the local partial O2 pressure (pO2) to rise. As the concentration of angiogenic factors increases and reaches its maximum value (by the end of week 4), the microvessel density and local pO2 also attain maxima. However, in contrast to the FBR case, where the increase in microvascular density is localized to the region adjacent to the implant, here the vascular response is much stronger, being uniformly high throughout the region that was previously occupied by the stem cell-containing hydrogel plug.
Over time, the pre-adipocytes differentiate into adipose tissue, and the stem cells die out, causing the angiogenic signal to decline (week 4 onward). As in the FBR case, vessel remodeling now becomes dominant. At longer times, the vascular density and, hence, the degree of tissue oxygenation relax to the normal levels associated with healthy tissue (see Supplementary Movies showing how the spatial distributions of V, C, and U evolve over time, and time-courses of angiogenic factor concentration and stem cell density at the implant site).
Model predictions
Having validated our model against experimental data, we now use it to investigate the potential for using stem cell supplementation to enhance the integration of biomedical implants within the body. In order to predict the effect of varying key design parameters on the degree and longevity of peri-implant vascularization, we perform a parameter sensitivity analysis. The design parameters of interest are the density of stem cells co-implanted with the devices and the thickness of the stem cell coating.
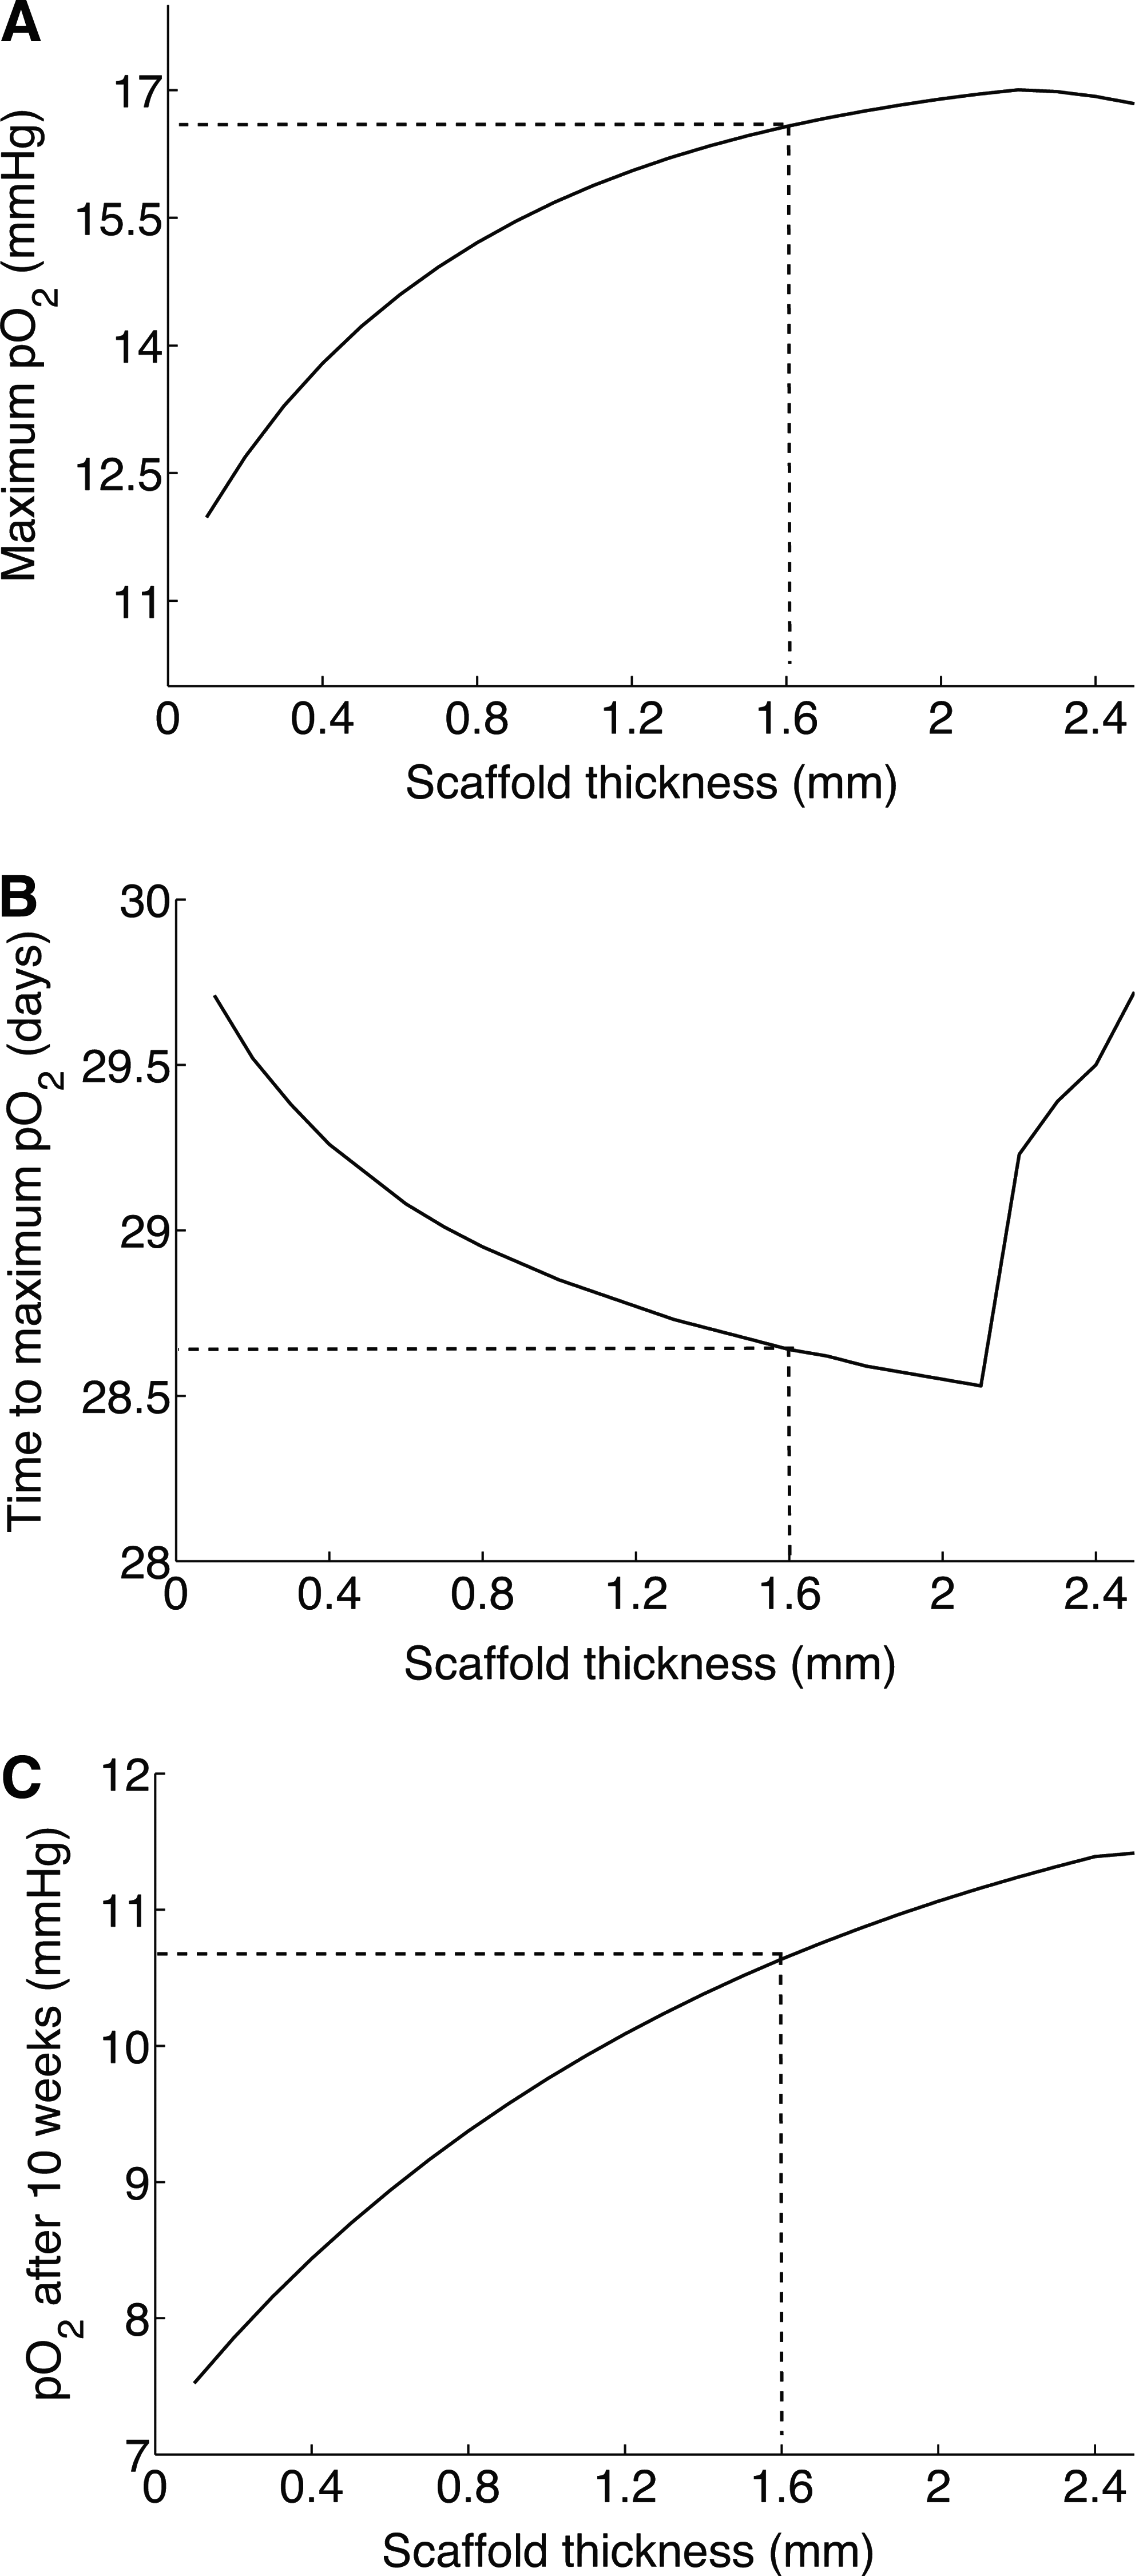
Effect of thickness of stem cell coating on peri-implant vascularization
We first vary the thickness L of the stem cell coating around the implant, assuming a constant stem cell density within the coating. In so doing, we increase the number of stem cells initially implanted, and the volume within which adipogenesis can occur. L is varied over the range 0.1–2.4 mm (with 1.6 mm corresponding to the value being used to generate the baseline simulations from the previous sections). Figure 3A reveals that the maximum O2 tension increases with L. However, a threshold thickness of 2.2 mm is predicted at which the O2 tension peaks: increasing L beyond this value causes the peak O2 tension value to fall. Correspondingly, the predicted time taken to reach this maximum O2 tension decreases from 29.75 to 28.5 days as L increases from 0.1 to 2.2 mm. Increasing L beyond this point increases the time to reach the maximum O2 tension (Fig. 3B). An important indicator of the success of the technique is the degree of vascularization and, hence, oxygenation at the implant edge at long times (here taken to be 10 weeks). Figure 3C reveals that the O2 tension at the sensor end of the implant after 10 weeks of implantation increases with L.
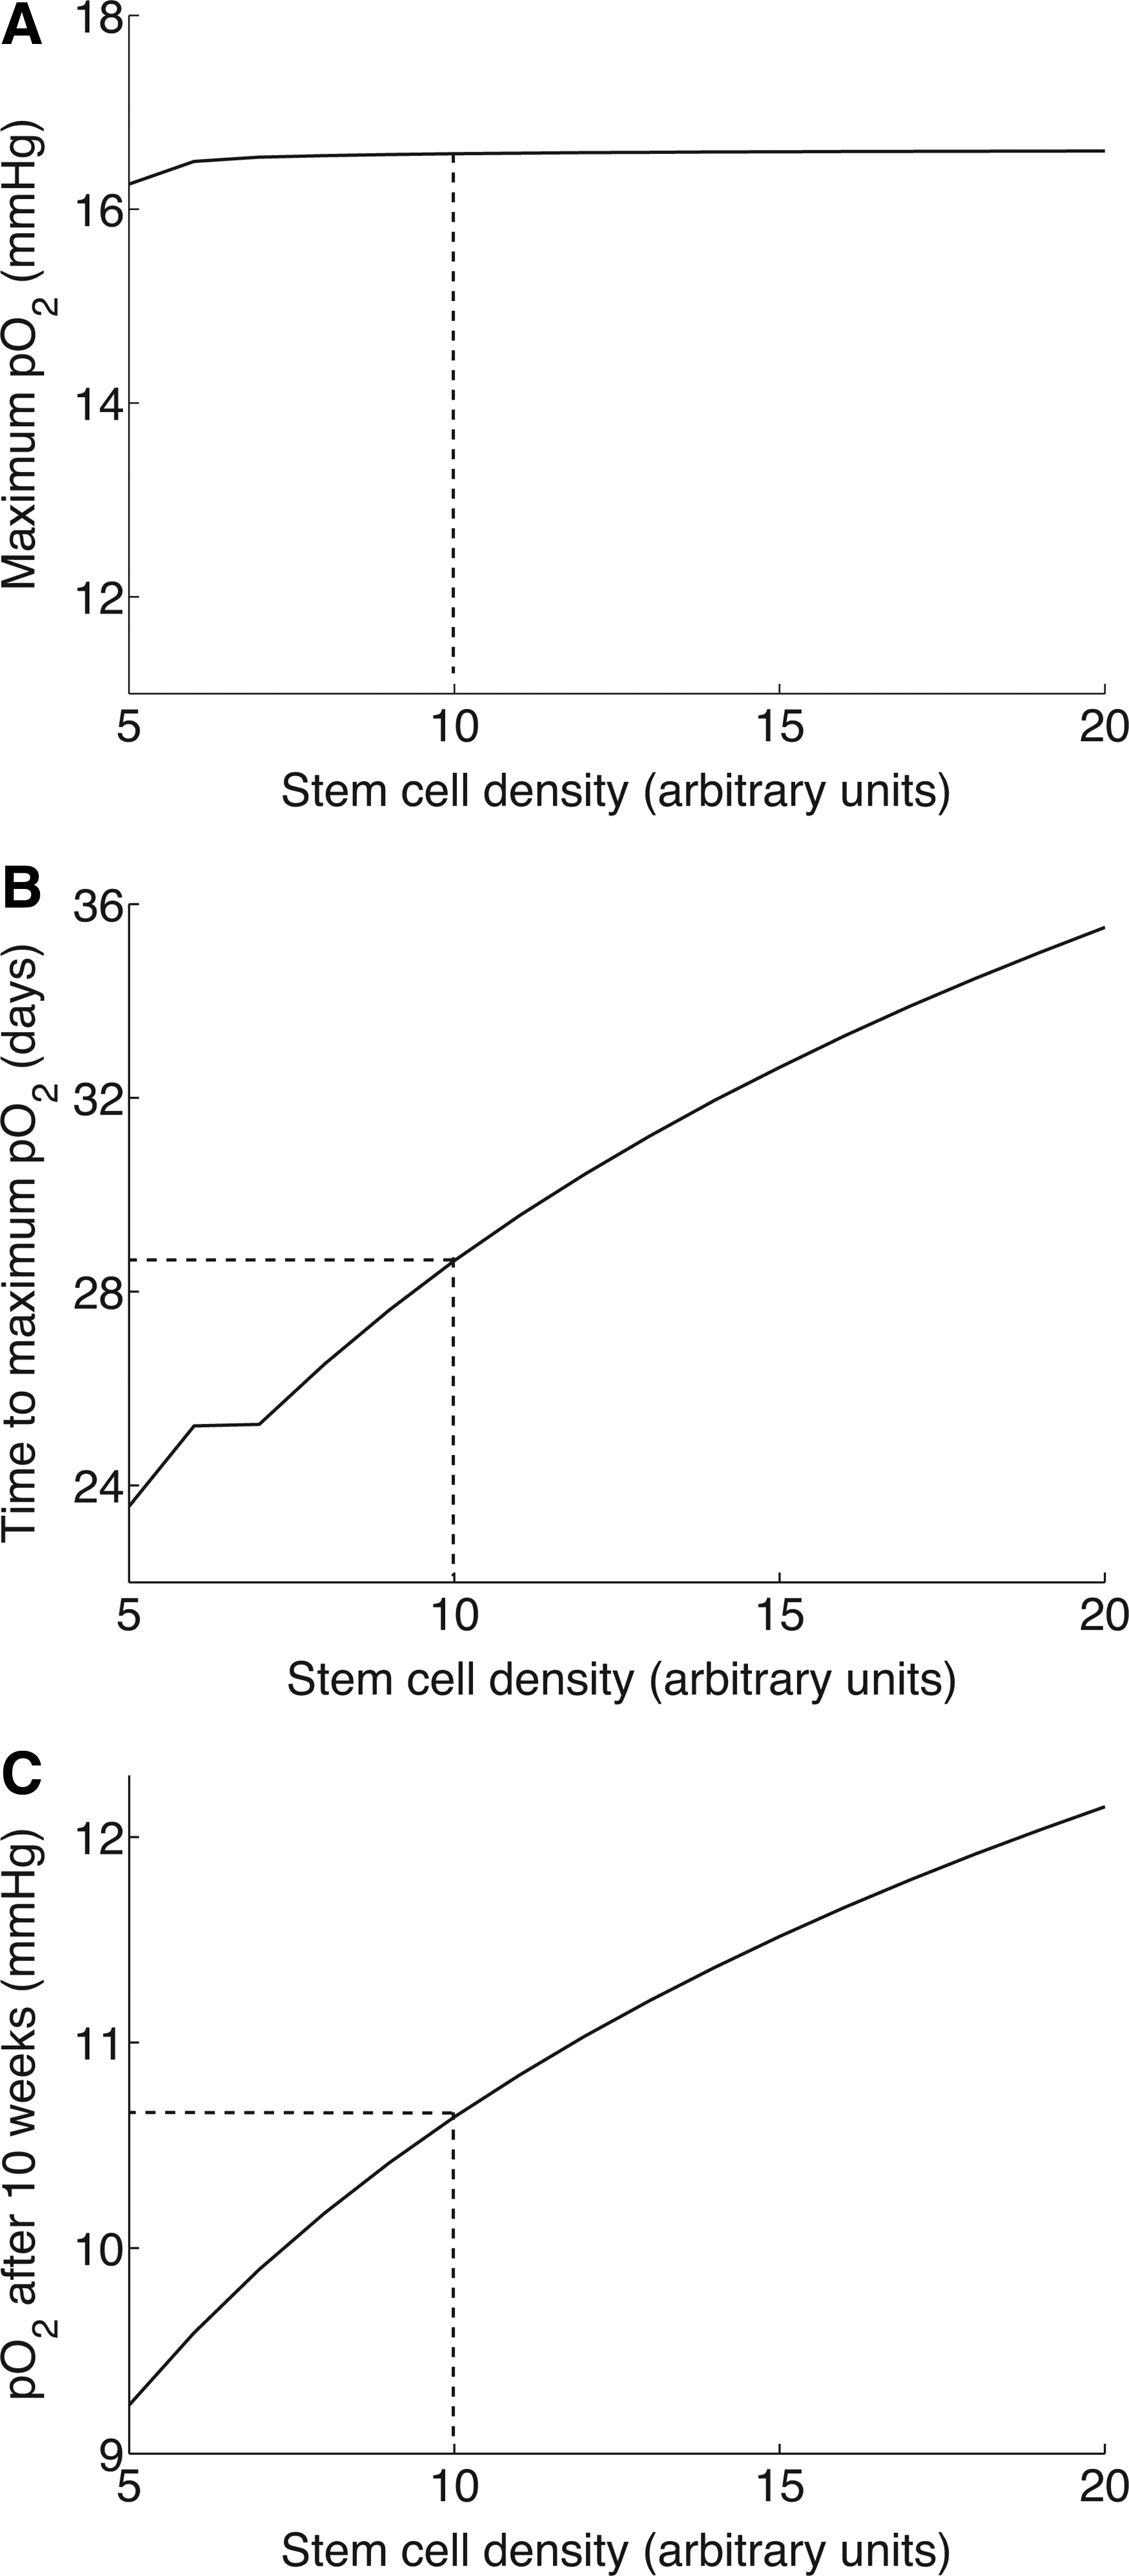
Effect of stem cell seeding density of hydrogel plug on peri-implant vascularization
Holding the thickness of the plug fixed (L=1.6 mm), we varied the density of the stem cells co-implanted with the hydrogel in the range 5<S0<20, with S0=10 corresponding to the baseline simulations in the preceding sections. Figure 4A shows that while increasing S0 has a negligible effect on the maximum O2 tension attained at the implant, it has a pronounced effect on the time at which this maximum is attained, the time increasing with S0 and indicating a prolonged phase of vascularization of the peri-implanted space (see Fig. 4B). Correspondingly, the O2 tension at the sensor edge after 10 weeks of implantation increases from 9.2 to 12.1 mmHg as S0 increases from 5 to 20, indicating a longer lasting vascular response (see Fig. 4C).
Limitations of stem cell approach
Our model can be used to arrive at a quantitative measure of the limitations of stem cell treatment in minimizing an FBR. From Equation (8), we can derive the following expression for tA, the time it takes for the leading edge of the invading pre-adipocytes to reach the implant (r=Ri).
An infinite value for tA would indicate treatment failure, due to the inability of the pre-adipocytes to reach the implant edge. Equation (10) can be used to derive a relationship between the initial stem cell density S0 and the thickness of the stem cell coating L that can be used to give a minimum value of S0 in terms of L (or a maximum value of L in terms of S0), in order for the invading pre-adipocytes to reach the implant edge.
Figure 5A shows the dependence of tA on L. As can be seen, as L increases beyond 2.25 mm, tA→∞. Figure 5B shows the dependence of tA on S0. For S0<5.92, the pre-adipocytes are predicted to not reach the implant edge.

Discussion
Butt et al. 8 have recently developed a new type of implantable O2 sensor, detectable by noninvasive EPR oximetry, and showed that isolated bone marrow stem/progenitor cells can elicit a strong and lasting angiogenic response in the vicinity of the implant. The resulting vasculature was functional, substantially increasing the local O2 tension at the implant level. To explain the experimentally observed O2 tension profiles at the site of the implant, we have developed a mathematical model describing how the microvascular density, O2 tension, and angiogenic factor concentration within the tissue change over time. The resulting equations are coupled to either an FBR submodel (control experiments), or an adipogenic one (cell treatment experiments). By fitting the model to measurements of O2 tension at the edge of the implant, excellent qualitative and quantitative agreement has been obtained, suggesting that the model provides a good mechanistic description of the underlying biology.
In formulating our model, we assumed that the long-term decrease in implant vascularization could be attributed to angiogenesis and fibrous encapsulation of the implanted sensor. The validated model was used to investigate the effect of varying two key control parameters relating to the design of the implantable O2 sensor. Increasing the thickness of the stem cell-treated coating of the implant was predicted to increase vascularization around the implant, provided the thickness did not increase beyond a threshold value. The limiting effect of the coating thickness is due to the dependence of pre-adipocyte infiltration into the plug on stem cell density S: the rate of pre-adipocyte invasion is assumed to be an increasing and saturating function of S. When the plug is excessively thick, the stem cells die out before the advancing front of pre-adipocytes reaches the implant edge. Further studies revealed that increasing the initial seeding density of stem cells in the plug would prolong the vascular response, causing it to peak at later time points. Whilst sustained long-term vascularization of the implant is desirable, delaying the development of effective vascularization in the immediate vicinity of the implant could be detrimental and may lead to early rejection of the implanted device. As the enhanced and long-term vascularization in the cell treatment case was predicted to be the result of a much stronger angiogenic signal strength that the control, supplementation with growth factors such as VEGF is also suggested as a potential therapy leading to a more stabilized neovascularization. These results have practical implications for both in vivo O2 monitoring and for cell therapy and tissue engineering of peri-implant spaces.
An important advantage of our approach is that we can combine our model with limited experimental data, from a few spatial locations, to infer spatiotemporal dynamics at all locations within the healing tissue. Further, it allows for the testing of therapeutic strategies aimed at increasing the vascular integration of nanoporous filter-limited implants and, as such, represents a valuable tool for guiding the future development of these implants. To increase the practical utility of our mathematical model, we propose to validate the predicted O2 and vascular profiles by collecting spatially resolved imaging technology. Such information would also enable us to determine whether O2 probe measurements taken at a single point (the edge of the implant) are sufficient to infer how healing occurs in response to the wound that is created by the implantation of biomedical devices, especially in the case of stem cell treatment.
In future work, we plan to combine the FBR and adipogenesis modules, anticipating that in practice both processes contribute to the vascular response that the implant elicits. The advancing healthy tissue edge may also be regarded as a moving boundary, and mechanical properties of tissue surrounding the implant could have a large impact on the healing process. Combining experimentation and modeling in this fashion would give us greater confidence in the therapeutic predictions of the O2 sensor. A major challenge faced by the tissue engineering community is being able to monitor noninvasively and in real time the quality of the implanted tissue. The situation is confounded by a lack of knowledge of the changes in the implant environment as tissue regeneration takes place. 18 Quantitative modeling, such as that presented here, has the potential seamlessly to integrate localized data collected from biosensors, such as the O2-probe, and provide predictions of cell growth, differentiation, and tissue changes, as well as spatiotemporal variation in the concentrations of molecular species of interest in and around the implanted device. The ability to generate such dynamic data from the same animal for the duration of the experiments could have far reaching implications for the translation of knowledge gained from the bench to the bedside.
Footnotes
Acknowledgments
The authors thank Drs. Markus Owen and Holger Perfahl for many helpful discussions. This work was made possible in part by a U.S. partnering award from the Biotechnology and Biological Sciences Research Council (Grant BB/G530484/1), which facilitates collaboration between the University of Nottingham and the Mathematical Biosciences Institute. H.V.J. acknowledges support from the MBI and the National Science Foundation (Grant 0635561). N.I.M. was supported by National Institutes of Health Grants R01 HL065983 and R01 HL096524. This publication is based on work supported in part by Award No. KUK-C1-013-04, made by King Abdullah University of Science and Technology (KAUST).
Disclosure Statement
No competing financial interests exist.
References
Supplementary Material
Please find the following supplemental material available below.
For Open Access articles published under a Creative Commons License, all supplemental material carries the same license as the article it is associated with.
For non-Open Access articles published, all supplemental material carries a non-exclusive license, and permission requests for re-use of supplemental material or any part of supplemental material shall be sent directly to the copyright owner as specified in the copyright notice associated with the article.