
Abstract
A major limitation in tissue engineering is the lack of nondestructive methods that assess the development of tissue scaffolds undergoing preconditioning in bioreactors. Due to significant optical scattering in most scaffolding materials, current microscope-based imaging methods cannot “see” through thick and optically opaque tissue constructs. To address this deficiency, we developed a fiber-optic-based imaging method that is capable of nondestructive imaging of fluorescently labeled cells through a thick and optically opaque scaffold, contained in a bioreactor. This imaging modality is based on the local excitation of fluorescent cells, the acquisition of fluorescence through the scaffold, and fluorescence mapping based on the position of the excitation light. To evaluate the capability and accuracy of the imaging system, human endothelial cells (ECs), stably expressing green fluorescent protein (GFP), were imaged through a fibrous scaffold. Without sacrificing the scaffolds, we nondestructively visualized the distribution of GFP-labeled cells through a ∼500 μm thick scaffold with cell-level resolution and distinct localization. These results were similar to control images obtained using an optical microscope with direct line-of-sight access. Through a detailed quantitative analysis, we demonstrated that this method achieved a resolution on the order of 20–30 μm, with 10% or less deviation from standard optical microscopy. Furthermore, we demonstrated that the penetration depth of the imaging method exceeded that of confocal laser scanning microscopy by more than a factor of 2. Our imaging method also possesses a working distance (up to 8 cm) much longer than that of a standard confocal microscopy system, which can significantly facilitate bioreactor integration. This method will enable the nondestructive monitoring of ECs seeded on the lumen of a tissue-engineered vascular graft during preconditioning in vitro, as well as for other tissue-engineered constructs in the future.
Introduction
Optimizing the preconditioning phase is often a challenging and time-consuming process during which a cell-seeded construct should be periodically assessed with regard to the progress of tissue development. Conventional scaffold assessment methods typically require removal of the sample from the bioreactor followed by fixation, histological sectioning, and staining at a given time point. This method, however, destroys the sample and can only provide “snapshots” of tissue development at a limited number of time points.10,11 This inefficiency severely limits our understanding of the biological processes associated with tissue growth during the in vitro preconditioning phase and is resource and time intensive.
Due to the aforementioned limitations, researchers have begun developing alternative nondestructive methods for assessing tissue development. For example, methods based on confocal or nonlinear microscopy have been employed to nondestructively monitor cells in their microenvironment.12–17 Of particular relevance are two recently reported microscope-based methods that can monitor tissue development during preconditioning in bioreactors.18,19 Despite these advances, current microscope-based methods for nondestructive tissue assessment remain constrained by two major drawbacks: a limited imaging depth and a short working distance.
The main focus of this study is to develop a fiber-optic-based (FOB) imaging method that can significantly extend the depth of cell-level resolution imaging as well as greatly improve the working distance of the imaging system. In particular, we focus on developing a novel imaging method that evaluates bioengineered vascular grafts, where the assessment endothelialization on the lumen (inner surface) of synthetic bioengineered blood vessels is of significant interest. 20 From an imaging standpoint, it is exceedingly difficult to monitor endothelialization on the lumen through a thick and optically opaque tubular vessel using conventional microscopy techniques. Furthermore, the preconditioning of such vessels in pulsatile-flow bioreactors poses additional geometrical constraints on the objective's working distance. Therefore, the key significance of this study is the design and validation of an entirely new imaging technique that is capable of performing nondestructive imaging of endothelial cells (ECs) through a thick and optically opaque electrospun scaffold housed within a bioreactor.
Our approach is based on embedding thin and flexible microimaging channels (MICs) directly into a fibrous scaffold. The validity of our method was demonstrated by imaging through an opaque scaffold model and visualizing green fluorescent protein (GFP)-labeled ECs located on the luminal surface. The accuracy of our method was quantified through a direct comparison with conventional, direct-line-of-sight fluorescence microscopy. To further illustrate the advantage of this method, we compared its performance with a confocal laser scanning microscope (CLSM) and demonstrated that the imaging depth of this method exceeded that of the CLSM by at least a factor of 2. To demonstrate future potential of our imaging method, we nondestructively tracked the migration and cytokinesis of ECs through the opaque scaffold by capturing several consecutive images at 30-min time intervals. Another practical yet important advantage of this imaging method is the dramatically increased working distance (up to 8 cm), which significantly facilitated the integration of our imaging platform with a parallel-plate bioreactor for nondestructive cell tracking. Given the advantages offered by a significantly enhanced imaging depth and working distance, this imaging method may find numerous in vitro or in vivo applications in other tissue-engineered constructs that contain epithelial tissues.
Materials and Methods
Design principle
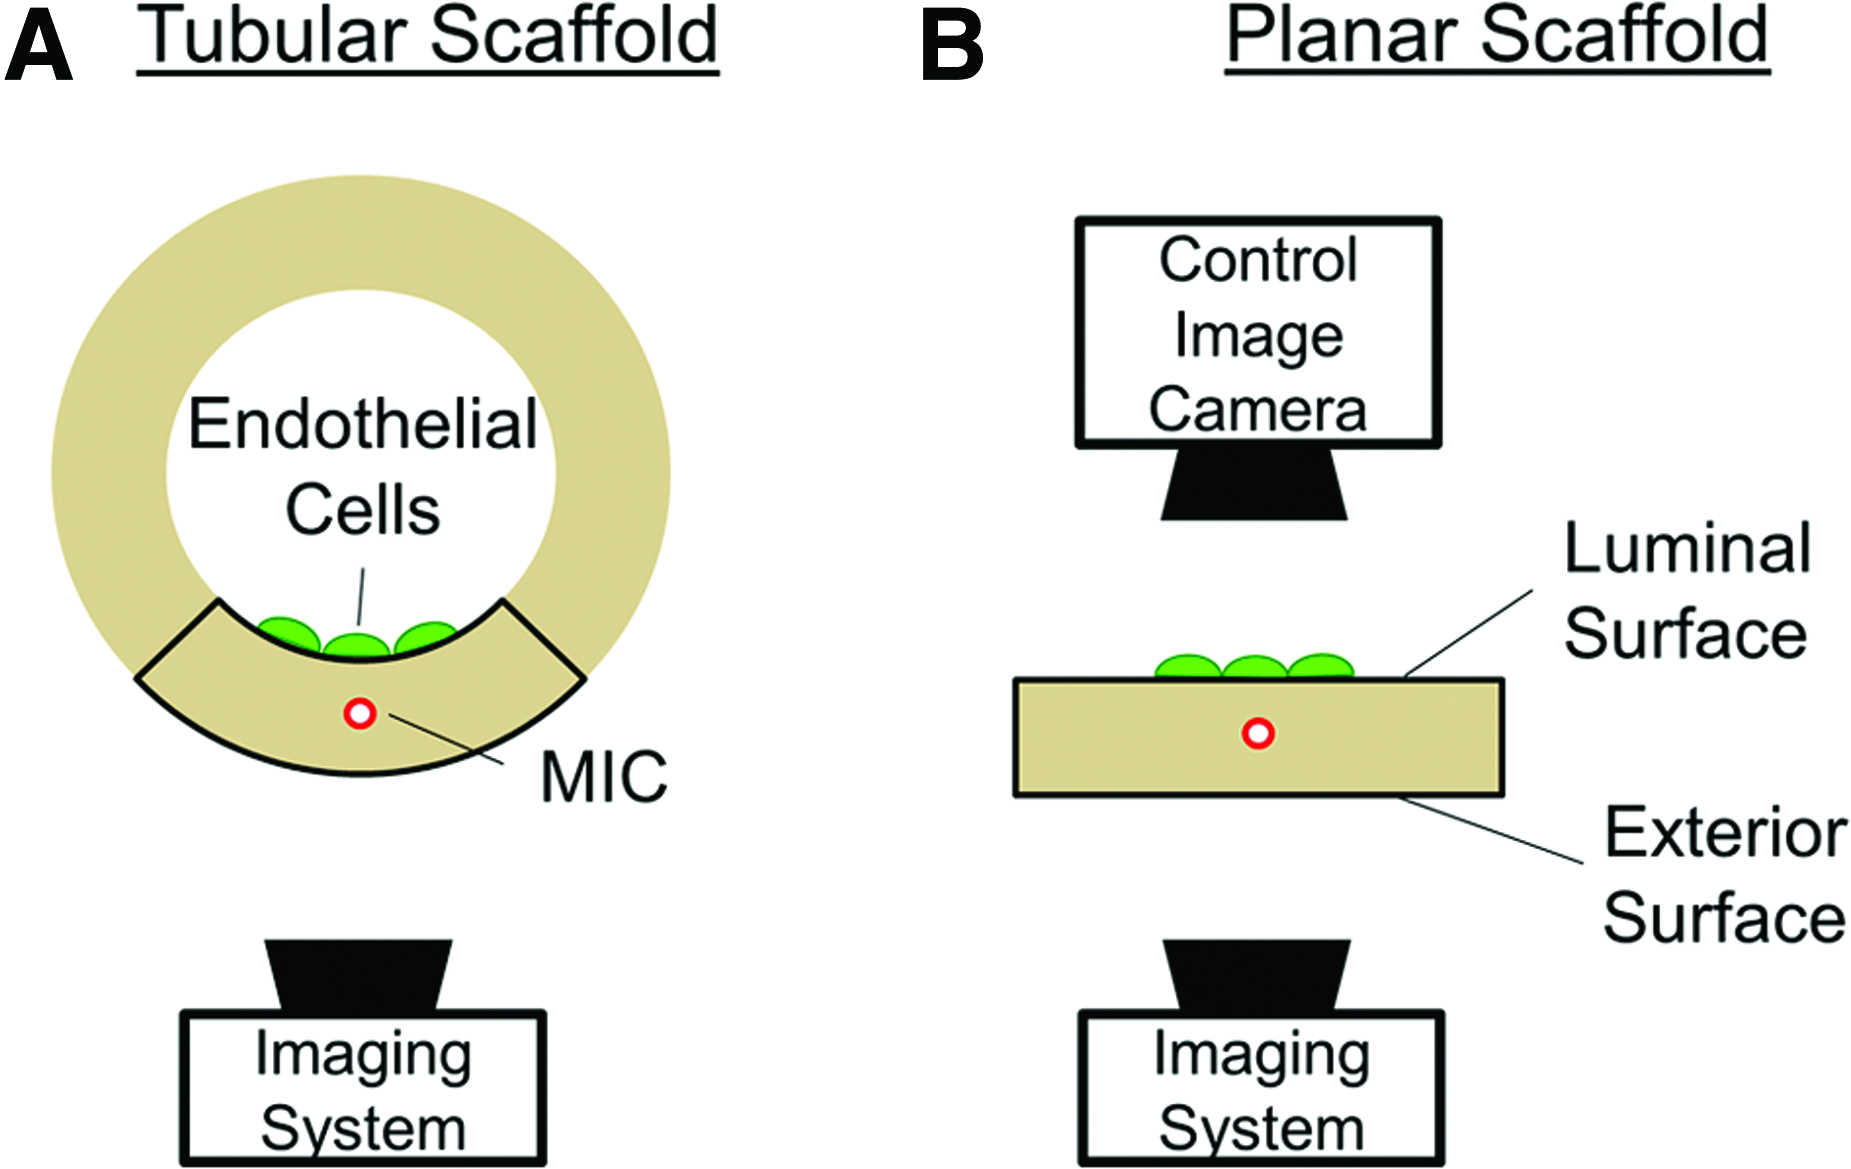
The basic principle of our imaging system is illustrated in Figure 1. Through each MIC, a fiber micromirror is inserted to locally deliver pump light for fluorescence excitation across a region of interest (ROI) on the lumen. By collecting the cell-emitted fluorescent signals from the scaffold's exterior and mapping them to the scanning position, the distribution of ECs on the scaffold lumen can be reconstructed through signal processing. The system shown in Figure 1A is sufficient for the purpose of vascular studies. However, in order to quantify the resolution of our imaging system, the imaging results need to be compared with a current gold standard such as conventional, direct line-of-sight, fluorescence microscopy.
Experimental design.
To facilitate a direct comparison with conventional fluorescence microscopy, the imaging study was carried out using the planar scaffold model shown in Figure 1B. After “unwrapping” the tubular scaffold in Figure 1A, all GFP-labeled ECs are located on one side of the model scaffold—the luminal surface. As a result, their distributions can be directly imaged using standard, direct-line-of-sight, fluorescence microscopy to obtain control images. The opposite of the luminal surface is referred to as the exterior surface. As indicated in Figure 1, both before and after “unwrapping,” the imaging system required to perform FOB imaging remains on the side of the exterior surface. The results obtained through FOB imaging are referred to as fluorescence-mapped images, or simply, mapped images. By comparing the difference between the control and the mapped images, both the resolution and the accuracy of the imaging method could be quantitatively determined. We emphasize that the main purpose of the system design in Figure 1B is to ensure that after validation using the planar scaffold model, the FOB imaging method can be directly applied to the investigation of tubular scaffolds.
Scaffold fabrication
The scaffolds used in this study were fabricated by electrospinning bioabsorbable poly(D,L-lactide) (PDLLA). 21 Briefly, a 22% w/v PDLLA (Mw=80,000 g/mol) (Sur Modics Pharmaceuticals) solution was prepared in a 3:1 ratio of tetrahydrofuran:dimethylformamide (Fisher Scientific) under gentle stirring for 4 h. Next, a 5-mL syringe with a 18G blunt-tip needle was filled with the solution and delivered at a flow rate of 5 mL/h. A 16-kV voltage difference provided by a DC power supply (Gamma High Voltage Research) was applied between the needle tip and a 2′′ diameter aluminum mandrel rotating at 60 rpm. The distance between the needle and the mandrel was set at 15 cm. Electrospun scaffold mats with an approximate thickness of 300 μm were fabricated and placed in a desiccator overnight to remove the residual solvent. An SEM image of the scaffold is shown in Figure 2A.

Vascular scaffold model fabrication and bioreactor design.
MIC integration
A transparent MIC for excitation light delivery was embedded into a PDLLA scaffold via heat sintering. 22 The MIC is a flexible silica glass capillary (Polymicro Technologies) with an inner and outer diameter of 150 and 245 μm, respectively. The scaffold composite was fabricated by placing the MIC between two 3×2 cm rectangular sections that were cut from the electrospun PDLLA mats, as illustrated in Figure 2B. Next, the scaffold sections with the MIC were placed between two glass slides and compressed with a 32 g weight in an oven at 54°C for 15 min. This technique effectively sintered the scaffold sections together to produce a one-piece planar scaffold with an MIC securely embedded, as shown in Figure 2C.
For this study, a total of 3 MIC-embedded planar scaffolds were fabricated with an average thickness of 513±21 μm. These scaffolds were used to conduct the imaging study illustrated in Figure 1B. The top surface of the scaffold represents the luminal surface of a blood vessel. As previously discussed, the planar configuration allowed a direct-line-of-sight access to the luminal surface for quantitative image comparison and validation.
Cell culture and scaffold seeding
A human microvascular EC line was used for this experiment (hTIME; American Type Culture Collection), and cells were cultured in endothelial growth medium-2 (Lonza Biomedical). The cells were genetically modified by a lentivirus vector to stably express eGFP. The EC-GFP cells were sorted by fluorescence-activated cell sorting (FACS Aria; BD Biosciences) for the highest ∼5% GFP expressing cells. ECs were grown in a 95% relative humidity atmosphere of 5% CO2 at 37°C, and culture media were changed every 3 days.
Before cell seeding, the scaffolds were sterilized using 70% ethanol for 30 min, followed by three sterile phosphate-buffered saline (PBS) washes for 10 min each. A 300 μL aliquot of media containing 100 μg/mL fibronectin (Sigma Aldrich) was then added to the scaffold for 30 min to enhance cell adhesion. ECs were trypsinized, and cell viability was determined using trypan blue staining (Vi-cell; Beckman Coulter). Cells were then re-suspended in 100 μL of media and seeded onto the luminal surface of the scaffold at a density of 1×10⁴ viable cells/cm2. The scaffolds were placed in the incubator for 2 h to allow cell attachment and were then washed gently with PBS to remove any unattached cells. The scaffolds were then placed in the bioreactor with cell culture media for imaging experiments.
Excitation light delivery
The delivery of fluorescence excitation light was achieved by inserting an optical fiber with a micromirror tip into the MIC. The fiber micromirror was fabricated by angle polishing a standard single mode optical fiber (SMF430; Nufern, Inc.). The polishing angle was selected to be 45° so that the incidence angle of the excitation light exceeded the critical angle for total internal reflection at the polished air-silica interface. This created an optical fiber mirror through which excitation light could be launched at a 90° angle relative to the fiber (Fig. 2D). By inserting the fiber mirror within the MIC, a highly localized beam of excitation light can be generated on the luminal surface of the scaffold.
Spectral measurements and signal-to-noise ratio
To investigate the signal-to-noise ratio (SNR) of cell fluorescence versus the background noise produced by scaffold autofluorescence, the spectral response of the cells and the scaffold were measured from 450 to 750 nm using a spectrometer (S2000; Ocean Optics). To quantify the background autofluorescence noise, the excitation spot was aimed toward a location on the scaffold that was void of cells. Conversely, the excitation spot was aimed directly at a cell to collect GFP fluorescence from the cells. The response signal was then collected through the scaffold by an EM-CCD camera (iXon+; Andor), and the excitation light was filtered out with a long-pass filter with a cutoff at 490 nm (BLP01-488R; Semrock). By using a long-pass filter, the spectral band with the largest SNR could be determined.
Confocal laser scanning microscopy
Three PDLLA scaffolds of varying thicknesses (100, 230, and 460 μm) were fabricated using the same electrospinning and sintering technique as previously described. GFP-labeled ECs were seeded onto one side (luminal surface) of the scaffolds at a density of 1×10⁴ viable cells/cm2, incubated for 2 h to allow cell attachment, and then placed into a culture dish with a 170 μm glass coverslip bottom on which the scaffold rested. The CLSM (Zeiss LSM510 META; Carl Zeiss, Inc.) equipped with a 10×Plan-Apochromat 0.45 NA objective (Carl Zeiss, Inc.) was then used to obtain a direct-line-of-sight image of cells on each scaffold and, subsequently, used in an attempt at “looking” through each scaffold to resolve the cells on the luminal surface.
Statistical analysis of mapping results
To quantify the accuracy and reliability of the imaging method, both the mean absolute error (MAE) and the root mean squared error (RMSE) were calculated between 25 pairs of fluorescence-mapped images and their corresponding control images for all three scaffold samples. Both the MAE and RMSE estimation method are widely accepted for comparing two sets of data obtained by intrinsically different methods.
23
The MAE is defined as follows:
The RMSE is defined as,
In these equations, i is the trial number that ranges from 1 to 25, n is a specific pixel in each image, Ci,n are the control images, Pi,n are the fluorescence-mapped images, and N is the total number of pixels in the control as well as mapped images. Before error estimation, each Ci,n/Pi,n image pair was normalized to values between 0 and 100 such that MAE and RMSE represented percent error. It is critical that the fluorescence-mapped image and the control image pairs overlap precisely to allow accurate error estimation. Therefore, a custom MATLAB image registration script was written to calculate the best spatial fit between Ci and Pi before error estimation. 24
Results
Bioreactor
A custom bioreactor was designed to house the scaffold while simultaneously enabling FOB imaging via the MIC. The bioreactor was based on a parallel-plate flow chamber as previously reported in Ref. 25 The major difference was the use of a biocompatible silicone adhesive (Dow Corning, Midland, MI) to seal the portion of MIC that extended beyond the scaffold between a series of polydimethylsiloxane (PDMS) (Specialty Manufacturing, Inc., Saginaw, MI) gaskets and glass slides. The cavity created by the PDMS gaskets formed a sterile growth chamber, while the glass slides provided viewing access to both the luminal and exterior surface of the scaffold. A photograph of the bioreactor is shown in Figure 2E.
Procedure for fiber scanning and fluorescence mapping
The imaging procedure is summarized in Figure 3A–C. First, a ROI is designated on the luminal surface, and then, the ROI is divided into a two-dimensional (2D) grid of imaging pixels (Fig. 3A). By adjusting the position and the angle of the fiber micromirror inside the MIC, a localized beam of excitation light can be delivered toward any given imaging pixel on the luminal surface, as indicated in Figure 3B. The light spot formed on the luminal surface is referred to as the excitation spot. The position and the angle of the fiber micromirror is carefully chosen such that the center of the excitation spot always coincides with its corresponding imaging pixel on the luminal surface. By repeating this process for each imaging pixel, a one-to-one correspondence is established between a specific set of fiber micromirror locations and the 2D grid of imaging pixels.
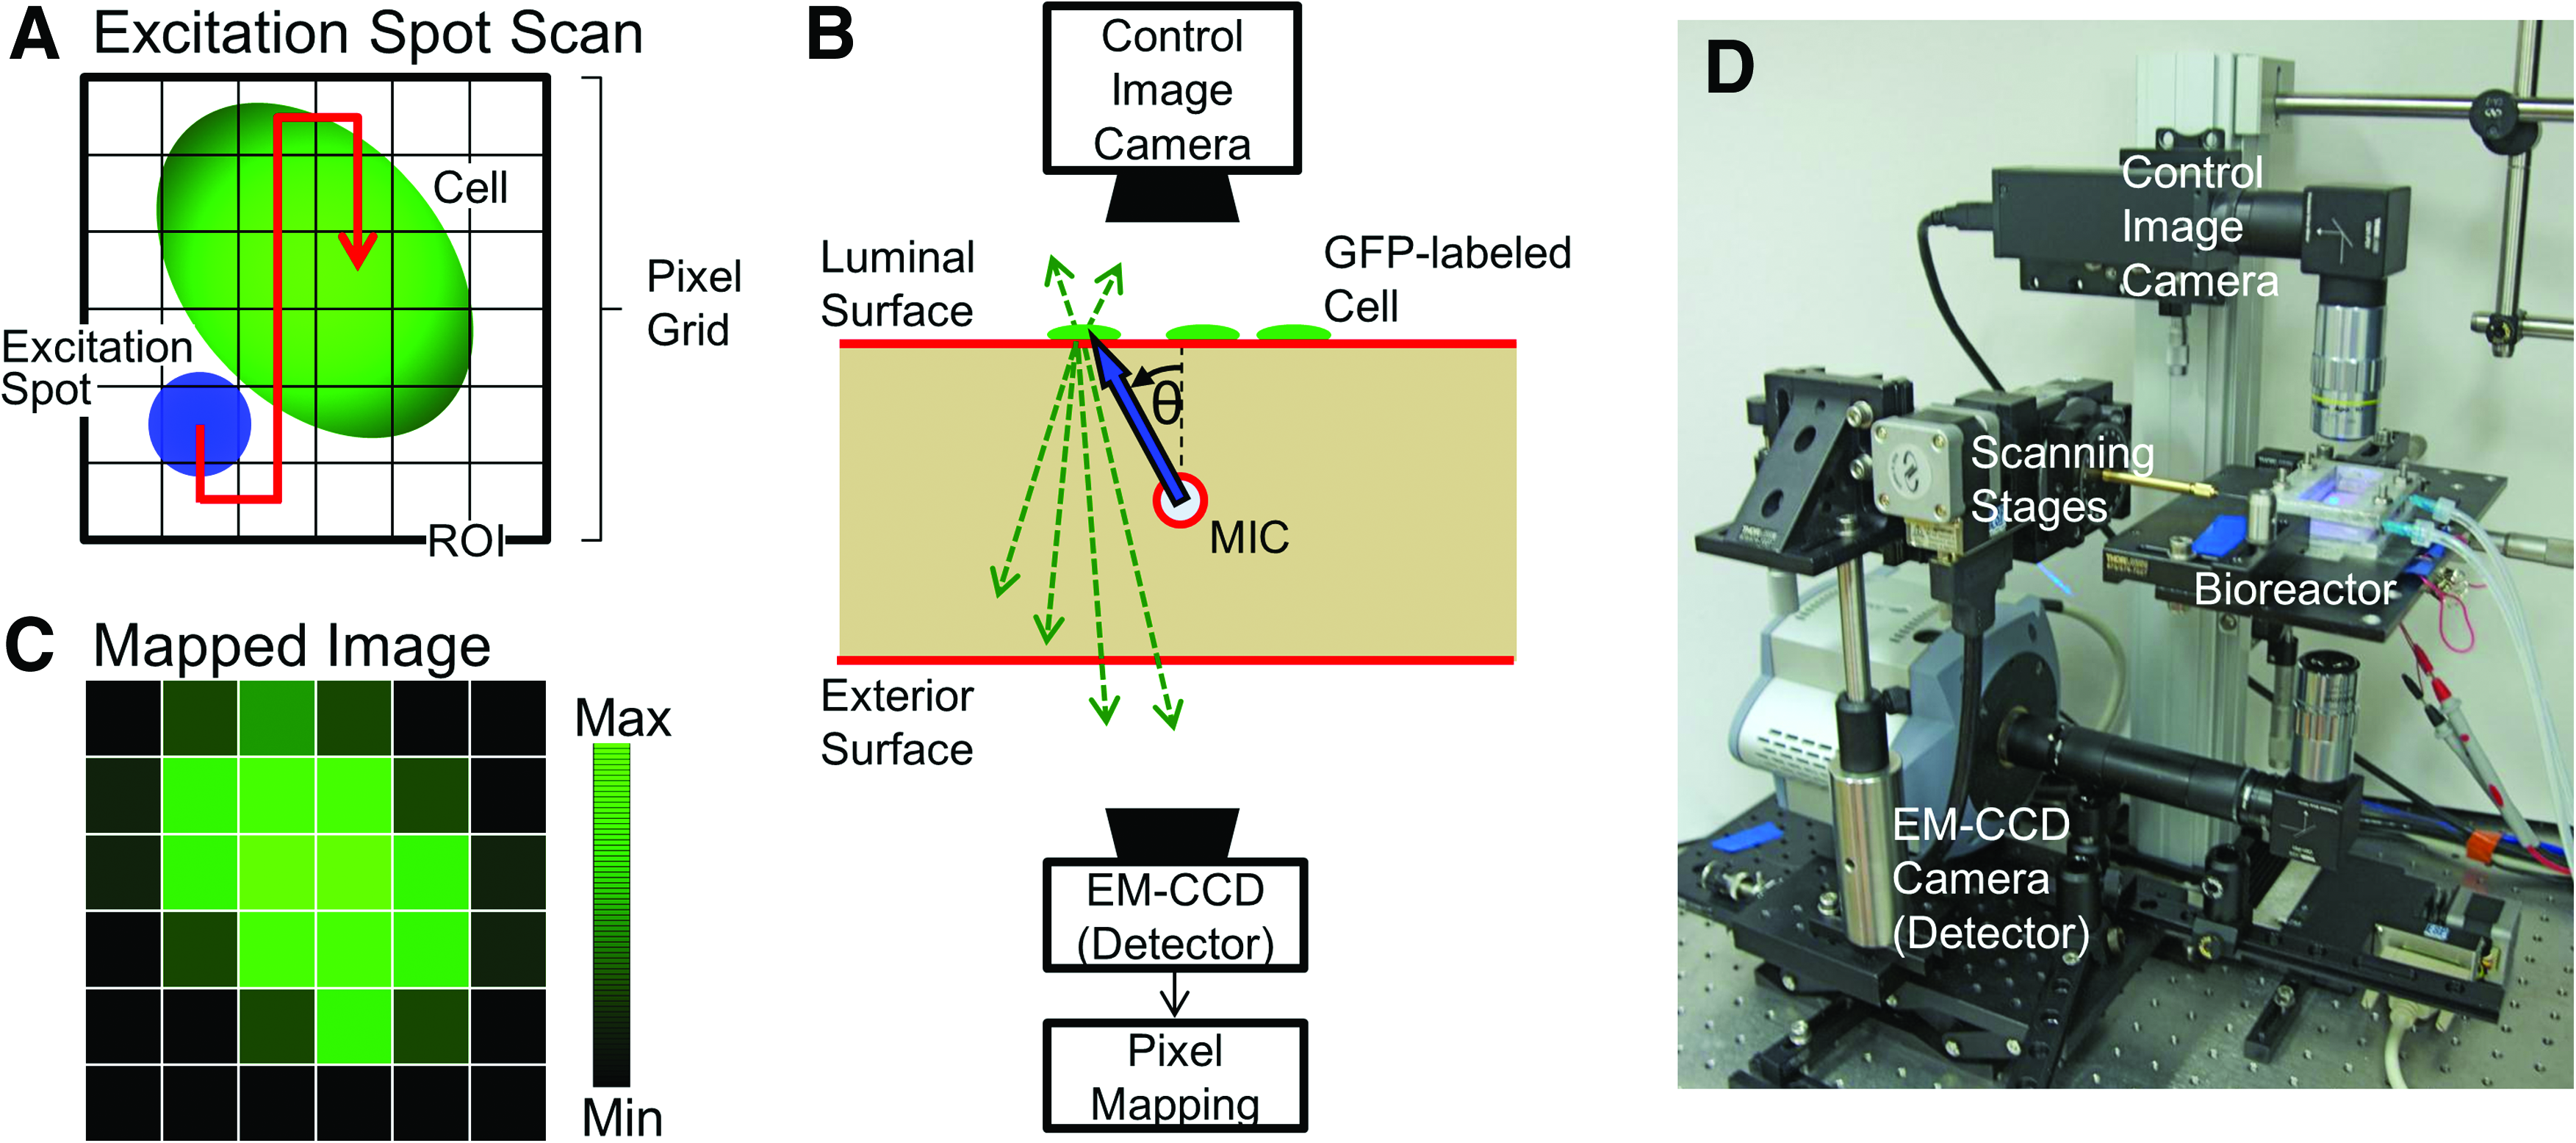
Image mapping procedure and scanning system.
After linking the 2D imaging pixels with the fiber micromirror locations, the principle of the FOB imaging method can be explained as follows. If a GFP-labeled EC overlaps with the chosen imaging pixel, then the portion of the luminal surface illuminated by the excitation spot can generate significant green fluorescence. A part of the green fluorescence then travels through the scaffold to the exterior surface, and its intensity is measured using a sensitive detector. On the other hand, if the particular imaging pixel is void of GFP-labeled ECs, then the resultant fluorescence intensity captured by the detector would be noticeably weaker. Consequently, the fluorescence intensity measured by the detector provides a quantitative indication of the “amount” of GFP-labeled ECs within the specific imaging pixel on the luminal surface.
With this capability, the fiber micromirror can be moved such that the center of the excitation spot is sequentially scanned across all imaging pixels within the ROI, as indicated in Figure 3A. At each illuminated imaging pixel, the detector is used to record the amount of green fluorescence transmitted through the exterior surface of the scaffold. Finally, the measured values are assigned to each imaging pixel to generate the pseudo-color map, as shown in Figure 3C. This image is referred to as a fluorescence-mapped image. In Figure 3C, the pixels associated with low GFP intensity are plotted black, whereas the pixels with high GFP intensity are plotted green. As shown later in the Results section, such fluorescence-mapped images provide an accurate depiction of EC distributions on the luminal surface.
To implement the fiber scanning and fluorescence mapping procedure, we built a custom imaging system, as shown in Figure 3D. A heated platform was designed to firmly support the bioreactor containing the cell-seeded scaffold in place and to maintain a constant 37°C environment inside. Fluorescence excitation light was provided by a 473 nm continuous wave solid-state laser (BLM-100; Extreme Lasers, Inc.) operated at 0.5 mW and coupled into the optical fiber with the micromirror tip. The micromirror's position inside the MIC was controlled using a fiber chuck that was clamped to a motorized translation stage (UTM100PP.1; Newport) and a 0.01°-precision motorized rotation stage (URM100APP; Newport). Both motorized stages were controlled by a program developed in LabView (National Instruments). The fluorescence excitation light traveling through the scaffold to the exterior surface was measured using a high-sensitivity EM-CCD camera (iXon+; Andor) with a 2× long working distance objective attached (M-Plan; Mitutoyo). The distance from the objective to the bioreactor was 8 cm. Bandpass filters (525/45 BrightLine; Semrock, Rochester, NY) were used to block the excitation light while letting GFP fluorescence emission light pass to the EM-CCD camera. The 500–545 nm band pass region was selected after selecting the spectral region with the highest SNR.
Control image capture
To evaluate the accuracy of the fluorescence-mapped images, a CCD camera (XCD-X710; Sony) with a GFP band-pass filter in front was mounted above the bioreactor to capture control images. In Figure 3B, this CCD camera is represented by the “control image camera.” An external 473 nm light source (not shown in Fig. 3B) was used to illuminate the entire luminal surface and provided excitation light for the control images. The control images were obtained using conventional, direct-line-of-sight fluorescence microscopy, and can, therefore, be used as the gold standard for image comparison and analysis. By quantitatively comparing the fluorescence-mapped images to the control images, the quality and reliability of the imaging system was calculated using a custom image comparison script written in MATLAB (MathWorks). It should be emphasized that such control images were only available using the “unwrapped” planar scaffold instead of the original tubular scaffold.
Imaging results and image analysis
The goal of this research is to develop a method that images “through” an optically thick and opaque scaffold. For all fiber-scanned images, a 300×300 μm ROI was selected on the scaffold's luminal surface, where the ECs were seeded. Afterward, fiber scanning and fluorescence mapping was performed to image the GFP-labeled ECs, as previously described. After each fluorescence mapping, we used direct-line-of-sight access to take a control image of the same ROI to quantify the experimental error. Both the mapped and the control images were plotted in a false-color black-green, where the brightness of the green color represents the intensity of GFP fluorescence (Fig. 4). When comparing the mapped images with the control images, we observe that the spatial distribution of the GFP-labeled ECs are in good agreement between the corresponding image sets. Furthermore, from the mapped images, it is evident that individual cells could be resolved through the ∼500 μm thick scaffolds.
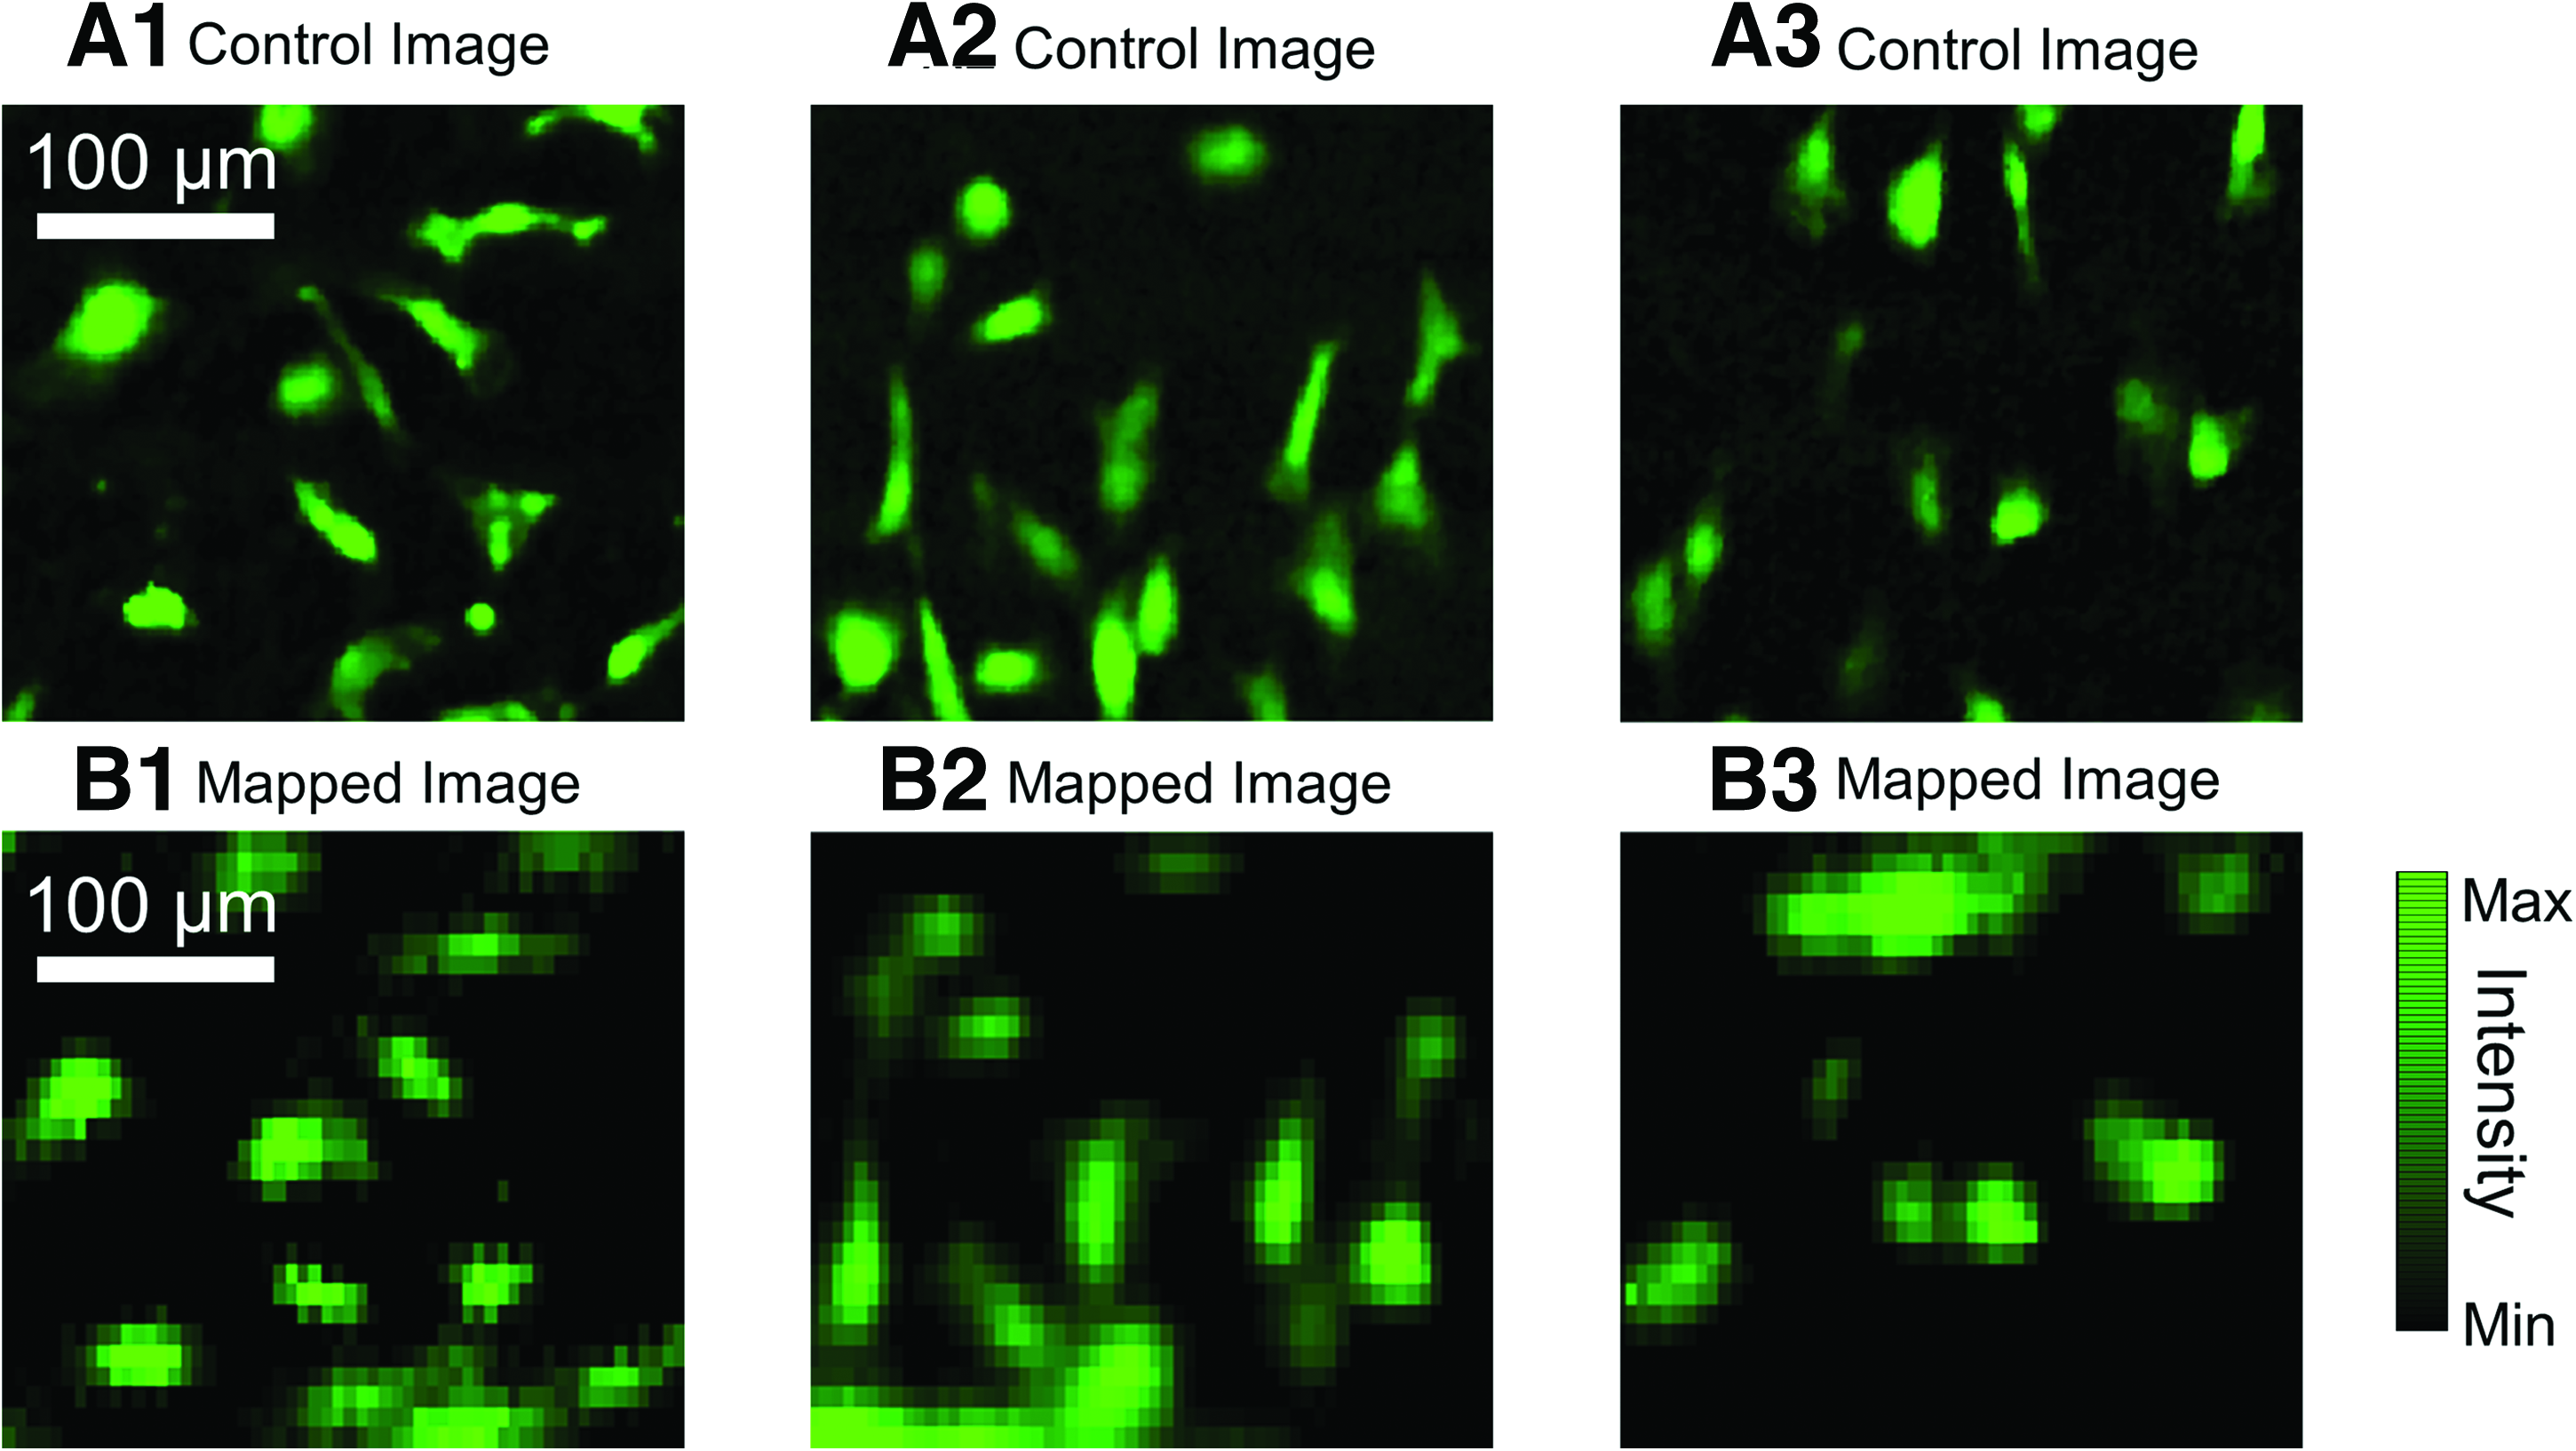
Fluorescence mapping results and comparison.
To quantify the overall accuracy of the imaging method, the MAE and RMSE were calculated for 25 pairs of fluorescence-mapped and control images. The MAE and RMSE results for each scaffold were plotted as histograms in Figure 5, showing overall error deviation for both image comparison methods. The mean±SD of the MAE and RMSE between the three scaffolds was found to be 5.83%±0.88% and 10.26%±1.14%, respectively.
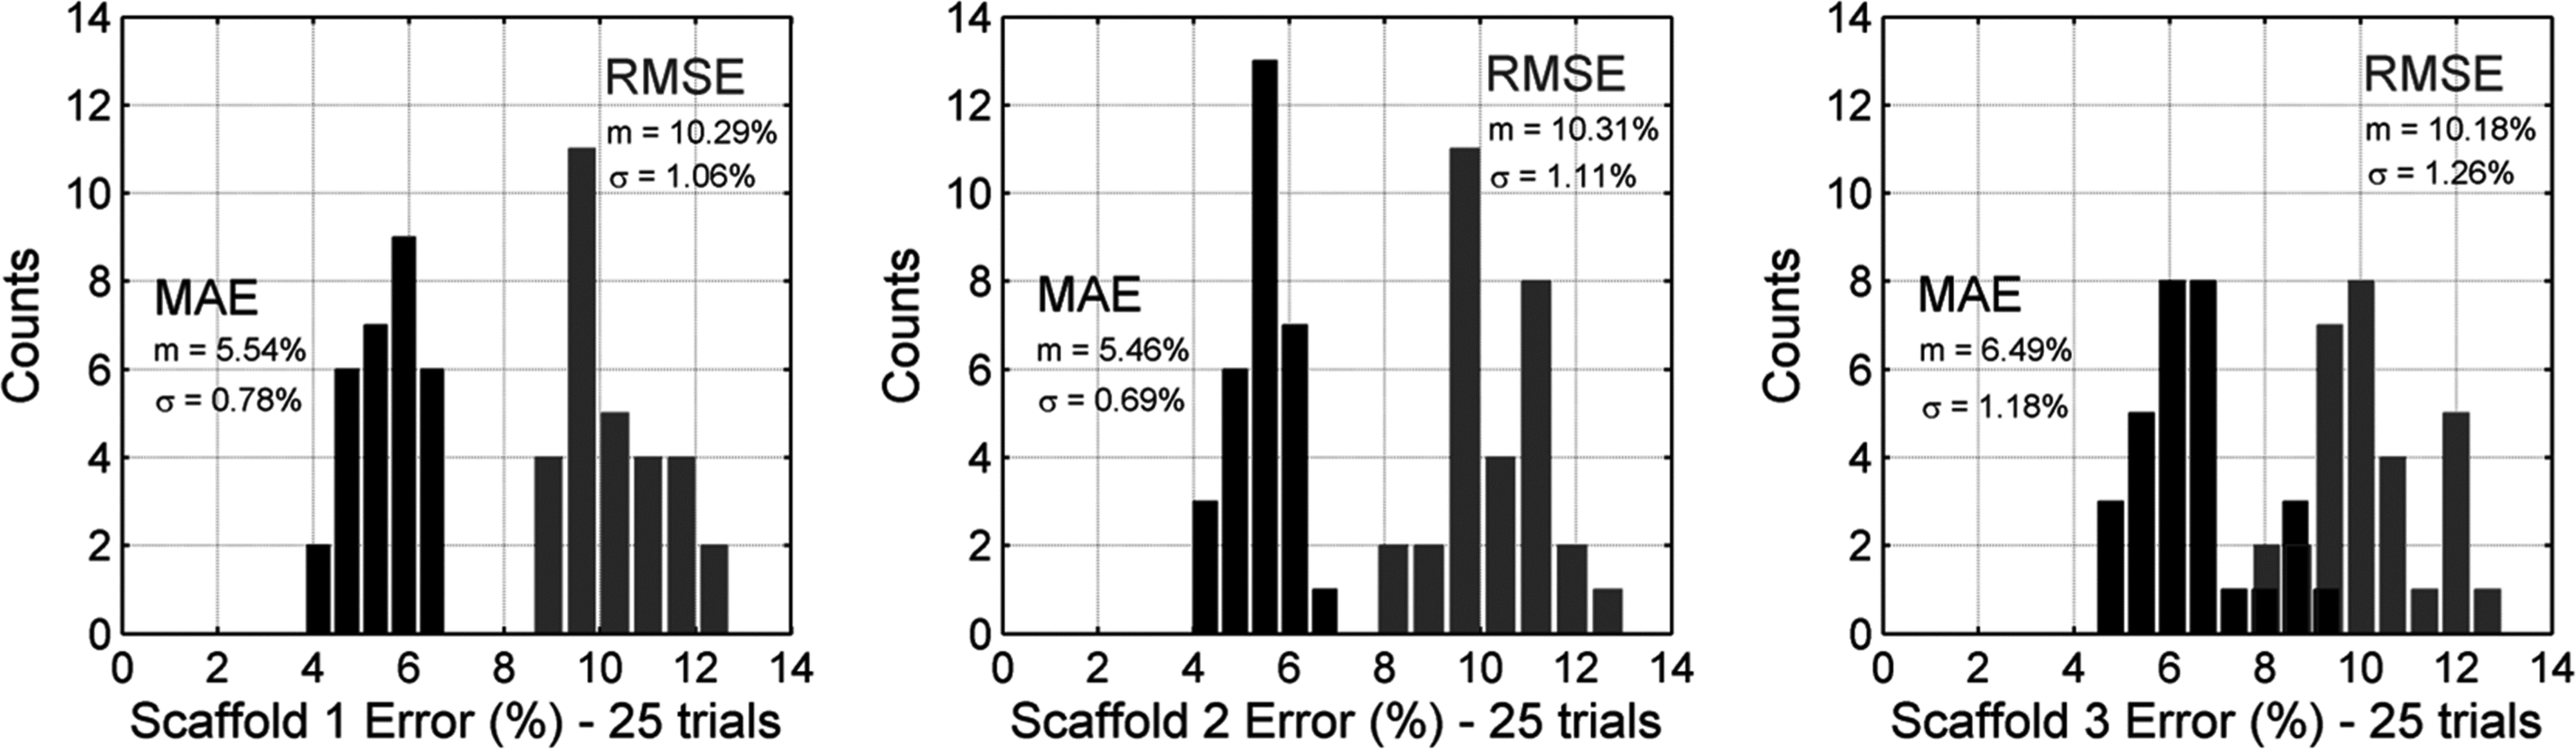
Statistical validation of the fluorescence-mapping method. Mean absolute error (MAE) and root mean squared error (RMSE) histograms for comparison between pairs of fluorescence-mapped and control images for each scaffold. The mean±SD of the MAE and RMSE between the three scaffolds was 5.83%±0.88% and 10.26%±1.14%, respectively.
Comparison with confocal microscopy
The penetration depth of the FOB imaging method through the PDLLA scaffold was compared with that of confocal laser scanning microscopy, which is widely used in tissue engineering to image through biologically thick tissues and scaffolds. 15 We used the experimental configuration shown in Figure 6A and B to quantify the quality of the optical image when we attempt to image “through” the scaffold.
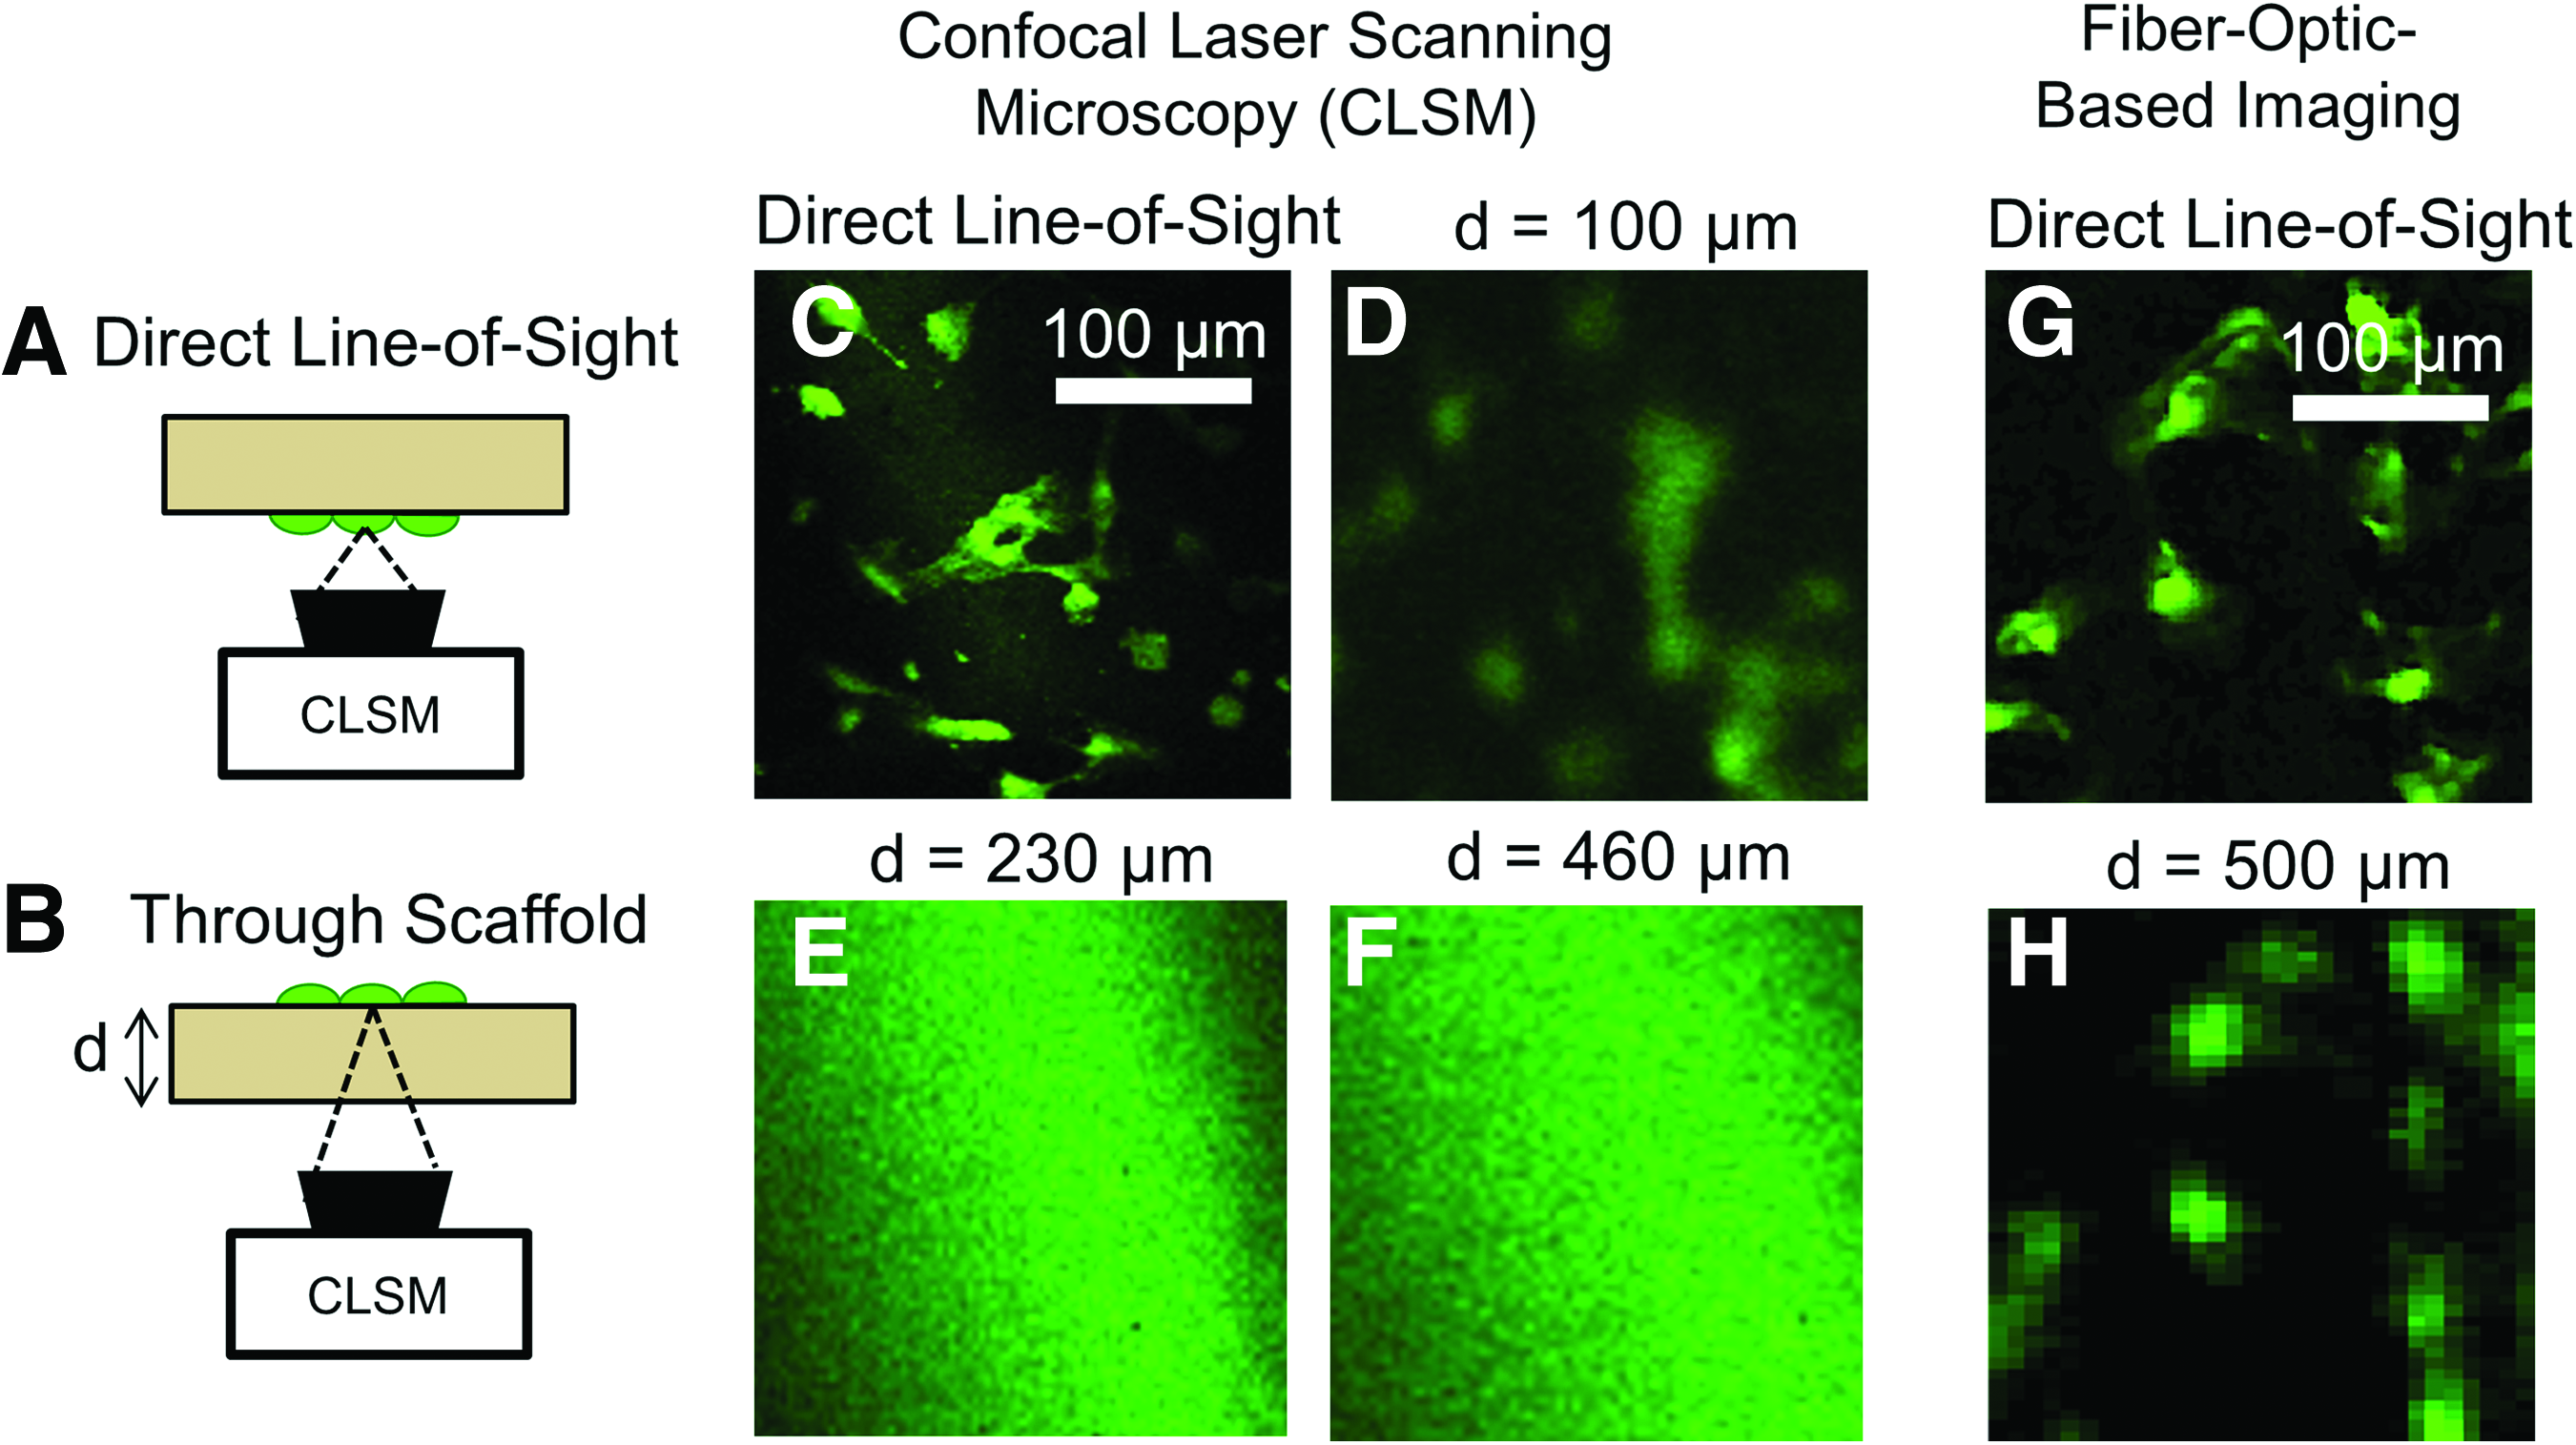
Imaging depth comparison of confocal laser scanning microscope (CLSM).
First, the CLSM was used to obtain a direct-line-of-sight image of cells in each scaffold sample (Fig. 6A). Next, the scaffolds were reversed, and the CLSM was used in an attempt to image the cells “looking” through the scaffold (Fig. 6B). To obtain the sharpest possible image of cells on the luminal surface when imaging through the scaffold, a z-stack was performed at 5-μm increments until the luminal surface reached the imaging focal plane. This measurement is analogous to placing the confocal microscope outside a blood vessel (i.e., exterior surface) and trying to image through the scaffold to capture EC distributions on the luminal surface.
GFP-ECs can easily be imaged if placed in the direct line of sight to the CLSM objective (Fig. 6C); however, the resolution of confocal images is greatly diminished when “seen” through the 100 μm-thick PDLLA scaffold (Fig. 6D). Furthermore, confocal microscopy failed to visualize individual cells through the thicker 230 and 460 μm PDLLA scaffolds (Fig. 6E and F, respectively). In contrast, the FOB imaging method was able to detect and accurately identify individual EC distribution through the ∼500 μm-thick PDLLA scaffold (Fig. 6H). The corresponding direct-line-of-sight image in Figure 6G confirmed the accuracy of the fluorescence-mapped image in Figure 6H.
Mapping resolution
Based on the mapping procedure and image processing theory, the resolution of this imaging method is directly determined by the size of the excitation spot. For quantitative analysis, the size of the excitation spot is defined as the full-width-half-maximum (FWHM) of the excitation light intensity profile on the luminal surface. Mathematically, the scanning process is equivalent to performing a discrete convolution of the features inside the ROI with the excitation spot profile. 26 Hence, the mapped image can be regarded as the convolution between a given control image and a kernel defined by the corresponding excitation spot profiles.
To measure the size of the excitation spot, the filters on the control image camera were removed, and images of the luminal surface were captured while varying the fiber launching angle θ from −45° to 45° in five-degree increments. This was repeated at five random locations on a scaffold in the absence of cells. The FWHM was then extracted from each successive image and plotted as a function of launching angle θ (Fig. 7). The angle θ=0° denotes the case where the excitation light was launched directly toward the luminal surface and produced an FWHM of 16.5±0.5 μm. At±45°, the FWHM roughly doubled to 31.6±3.7 μm. Since the spatial profile of the excitation spot directly determines the resolution of the imaging method, the imaging system can achieve an effective resolution in the order of 16.5 to 31.6 μm. The plot in Figure 7 indicates that the resolution of the imaging system was highest at 0° and decreased with fiber micromirror rotation.
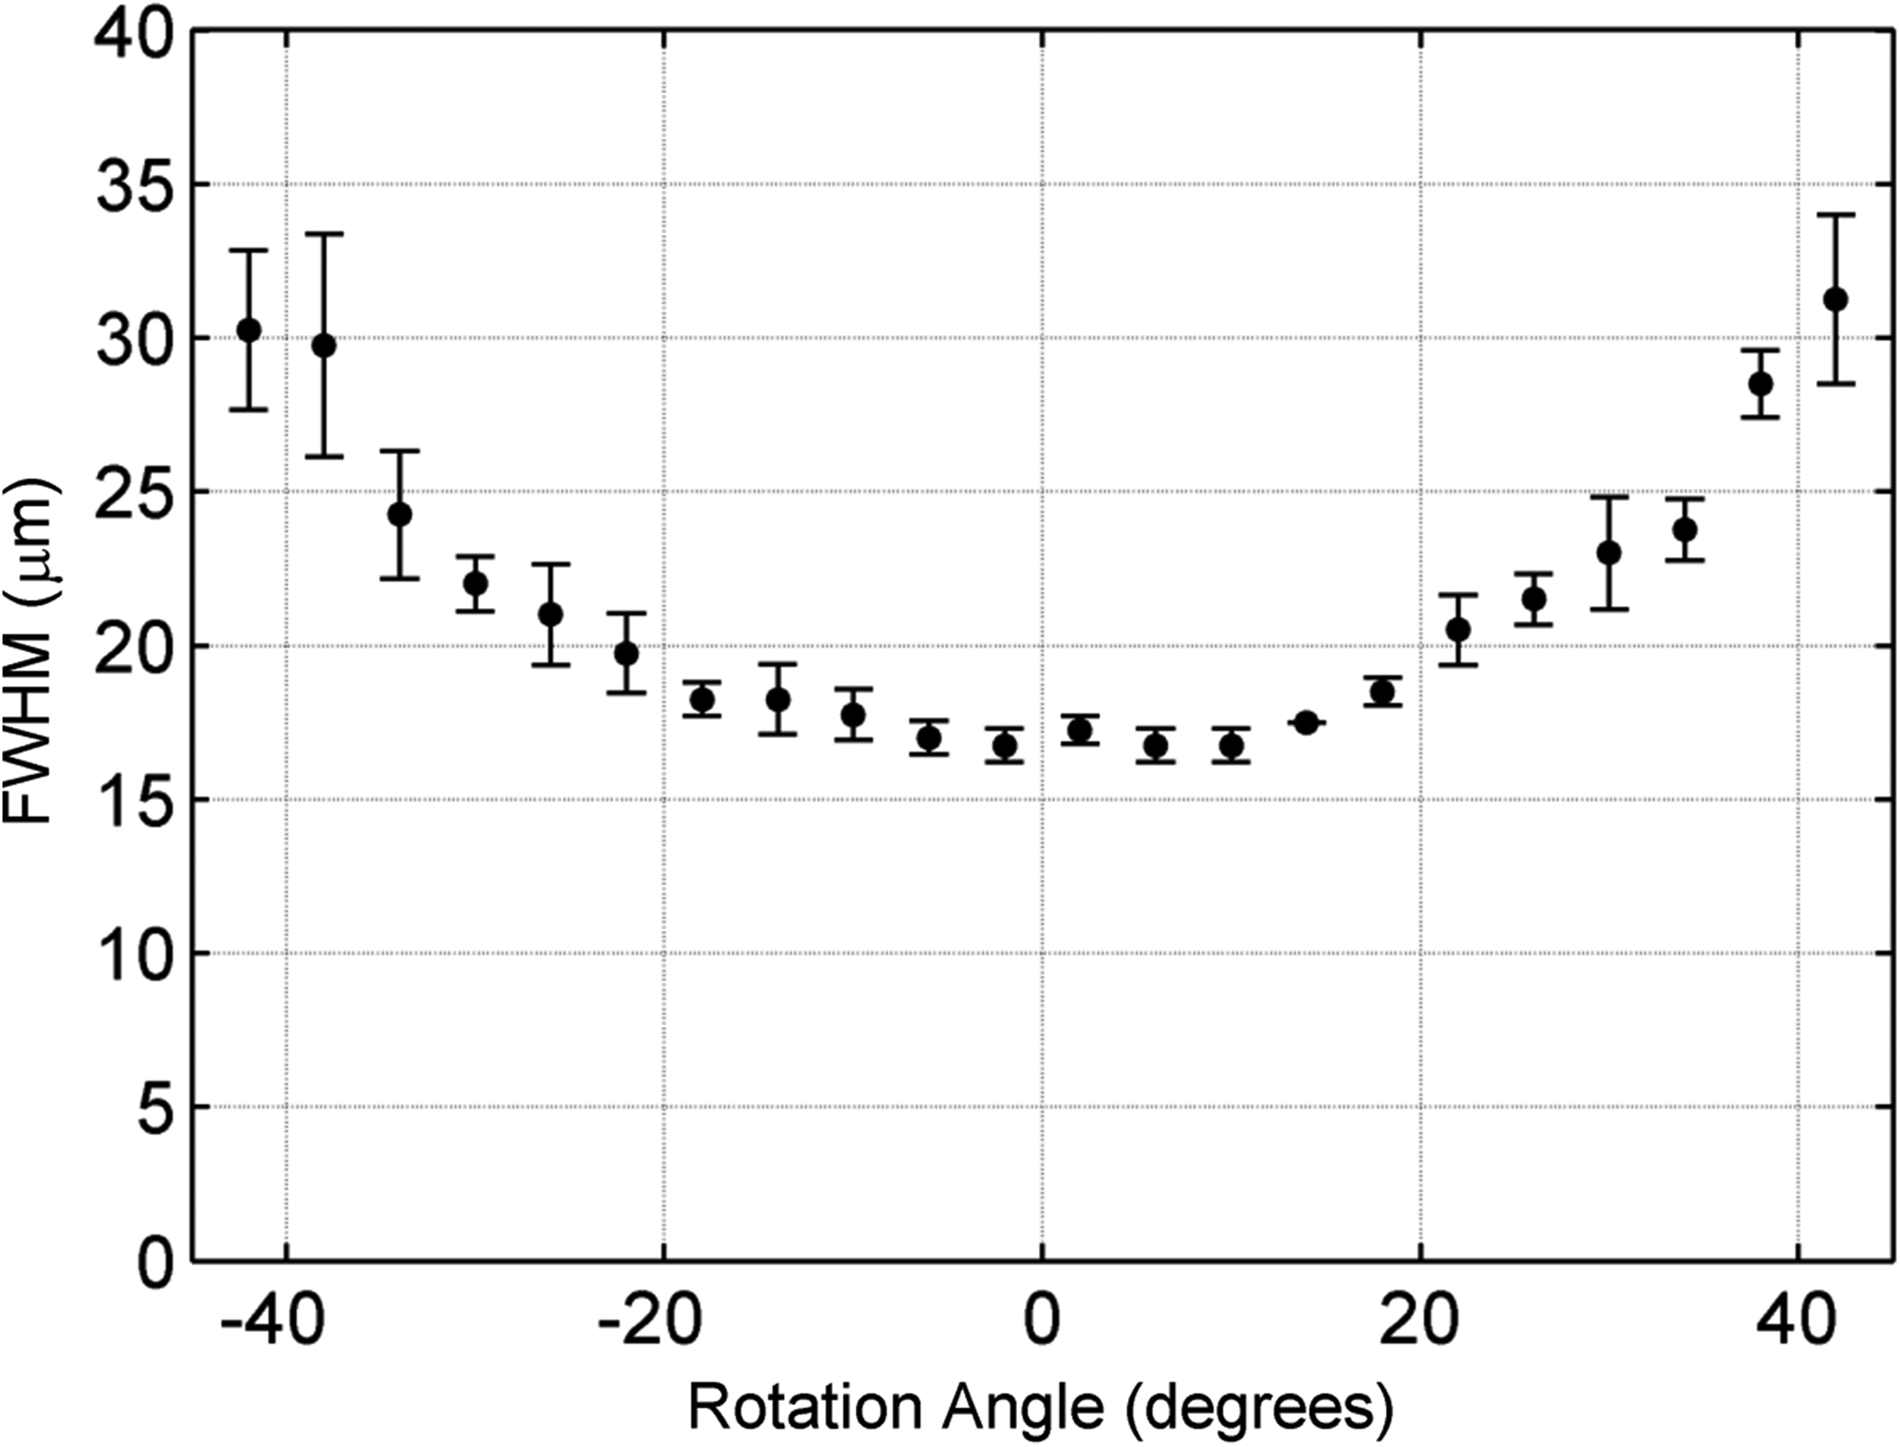
Image mapping resolution. Full-width-half-maximum (FWHM) of the excitation spot on the luminal surface for micromirror launching angles θ=−45° to +45° (mean±SD of n=5 trials). This plot indicates that the resolution of the system is best when the excitation light is launched directly toward the luminal surface (θ=0) and deteriorates by ∼1/2 when the fiber micromirror is rotated to θ=± 45°.
Spectral emission response and SNR
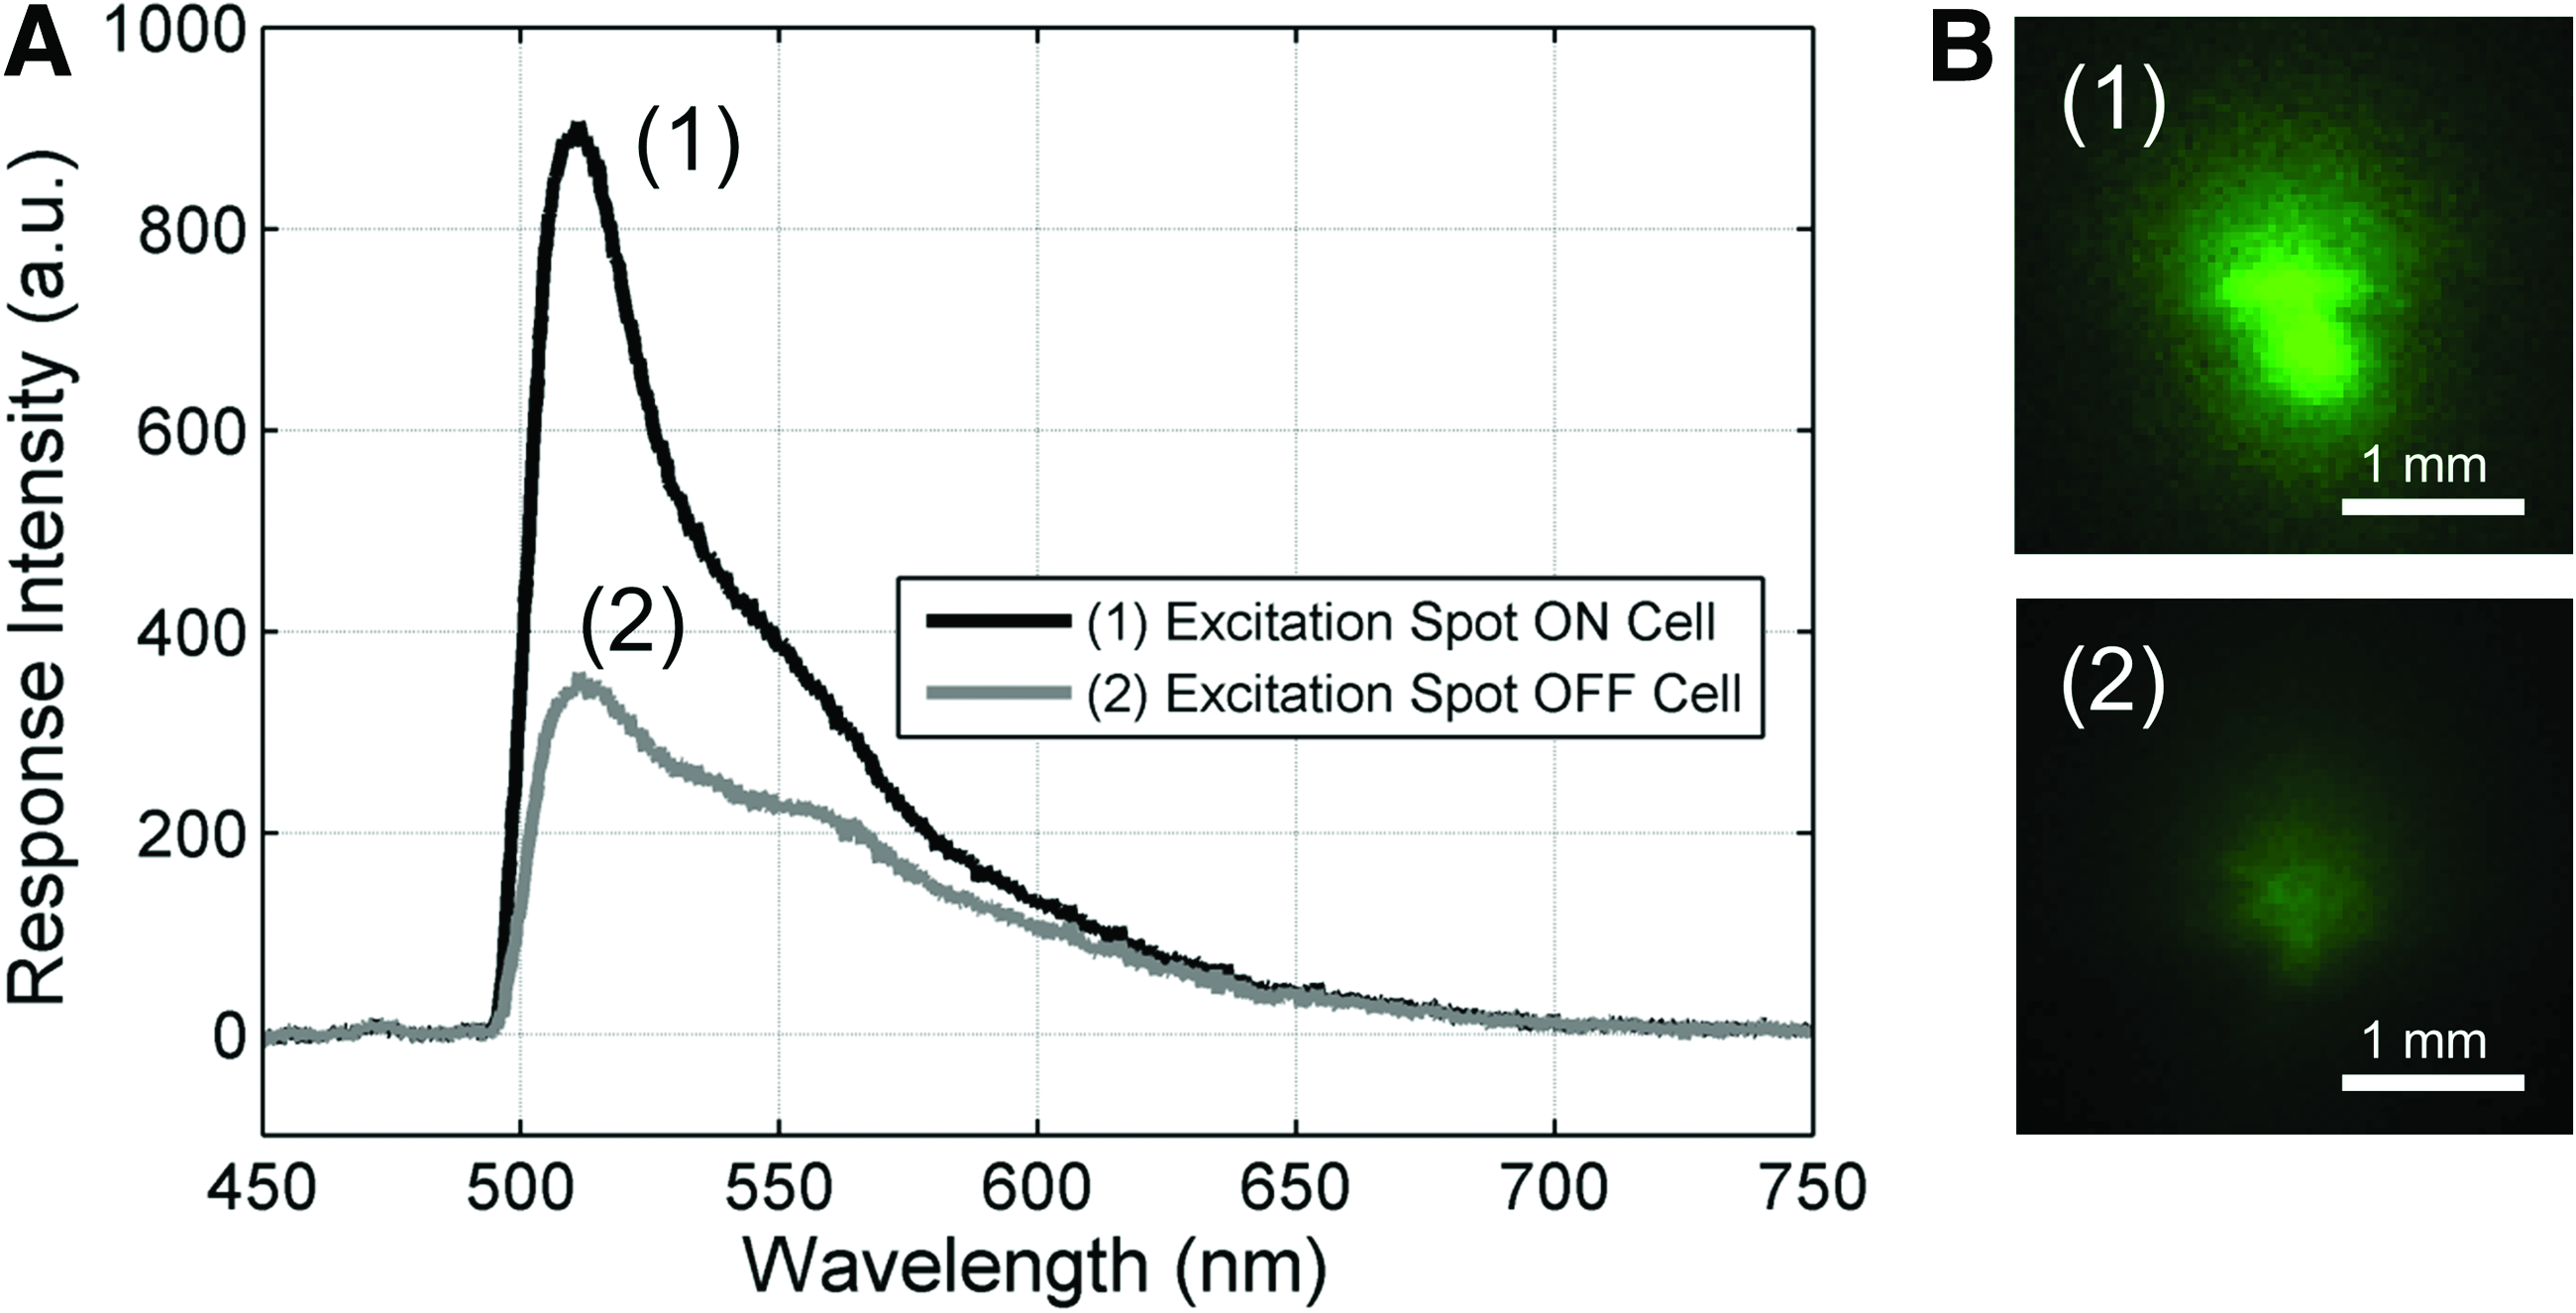
First, the optical spectrum of the fluorescent signals generated by the ECs, and the autofluorescence (noise) produced by the scaffold was measured (Fig. 8A). To ensure that the measured fluorescence can be accurately attributed to either GFP-labeled ECs or scaffold autofluorescence, the control camera was used to identify the fluorescent source on the luminal surface. Figure 8B shows the exterior surface image captured by the EM-CCD camera when (1) an EC was illuminated by the excitation spot on the luminal surface, and (2) the excitation spot did not encounter a GFP-labeled cell. The two images are clearly distinct in both spatial distribution as well as fluorescence intensity, which further corroborates the difference in spectral responses identified in Figure 8A.
Signal-to-noise ratio (SNR) characterization.
Dynamic assessment of cell growth and distribution
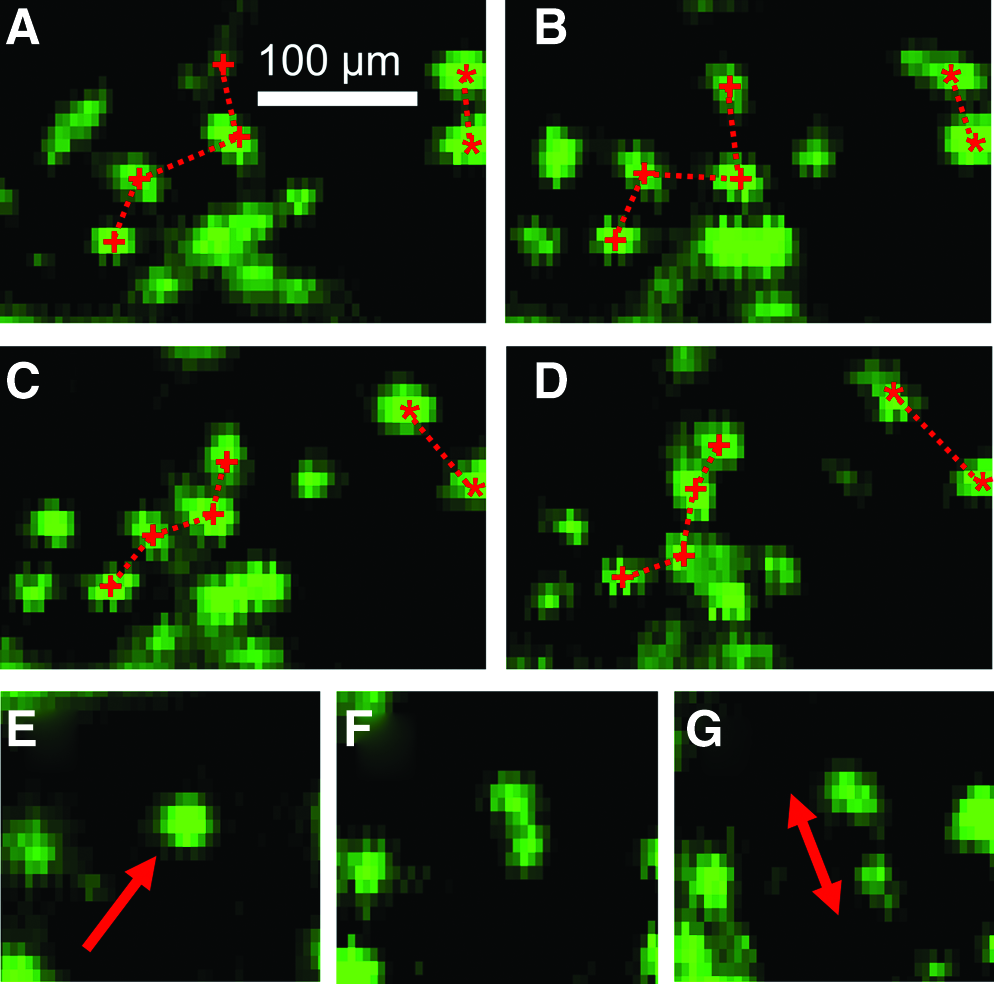
After sealing the scaffolds in a bioreactor, the cells were provided with the appropriate environment for cell migration and growth. To illustrate the dynamic capability of the FOB imaging method, the same ROI was scanned on the cell-seeded scaffold at an interval of 30 min over 1.5 h, producing a collection of time-lapsed, fluorescence-mapped images. By comparing successive images, we were able to track the relative cell movement in the ROI. Figure 9 shows four mapped images 30 min apart. These results demonstrate the ability to continuously and nondestructively track single cells in their scaffold microenvironment. Observing a different ROI (Fig. 9E–G) at a 30 min interval, we were able to detect a single, localized fluorescent feature (red arrow) progressively separating into two spatially distinct fluorescent “spots” (double-headed red arrow). This behavior strongly suggests that the cell indicated by the red arrow had undergone cytokinesis.
Dynamic imaging.
Discussion
A major challenge in tissue engineering is the inability to accurately and nondestructively monitor and evaluate the progress of a bioengineered tissue in vitro. To address this need, we presented here a new FOB imaging method and quantitatively evaluated its performance through a comparison with standard optical microscopy. In particular, we demonstrated that the FOB imaging method could “see” through a 500 μm-thick scaffold with a single-cell-level resolution. After a quantitative image comparison, we confirmed that the fluorescence-mapped images obtained using the FOB method matched very well with the control images obtained using standard fluorescence microscopy. Furthermore, we have shown that the imaging depth of the FOB method exceeded that of confocal laser scanning microscopy by at least a factor of 2. We further discuss the performance of the imaging system in the following contexts: the need for nondestructive imaging in tissue engineering, the comparison of the FOB imaging method with other optical microscopy techniques, and the implications of this study for tissue-engineering research.
The need for nondestructive imaging in tissue engineering
It is critical for tissue engineers to assess the neo-tissue's maturation progress in response to external stimuli such as mechanical stimulation, specific growth factors, and overall culturing conditions. These parameters have a major effect on tissue maturation, viability, and function after in vivo implantation. Similarly, tuning scaffold properties such as porosity, topography, mechanical properties, and chemistry can have a significant impact on cell attachment, viability, differentiation potential, and ECM production.27–29 Therefore, the evaluation of cell-seeded tissue-engineered constructs in response to these conditions and scaffold properties in vitro can provide valuable information on the suitability of scaffold design and predict the overall regenerative capacity of the construct in vivo. Evaluating the specific parameters of engineered tissue maturation is equally important for the optimization of tissue-engineering techniques.
Current methodologies that are used to evaluate tissue development in vitro employ either destructive or nondestructive techniques. However, there are significant limitations with both approaches. Destructive techniques such as fixation, staining, and/or histological sectioning can provide valuable information on cellular interactions within the scaffold, albeit at a limited number of time points. Perhaps more importantly, destructive methods do not permit real-time monitoring of cells under physiological conditions within their intact microenvironment. As an example, it would be impossible to apply standard histological methods to continuously monitor cell proliferation and differentiation within an intact scaffold housed in a bioreactor. Nondestructive techniques, such as microscopy-based optical methods, can be used to image individual cells by labeling them with fluorescent markers, including fluorescent proteins, fluorescent dyes, or quantum dots. 14 However, optical waves in the visible or near-infrared spectrum experience significant scattering and absorption in most tissues and scaffolding materials. Consequently, most optical imaging systems have a limited penetration depth and cannot fully capture the underlying biological processes that occur deep within the tissue scaffold. 15
Comparison with other optical imaging modalities
Current optical imaging modalities that are used to assess tissue-engineered constructs include confocal and nonlinear microscopy.12–17 These techniques have become ubiquitous in the field due to their ability to nondestructively image cells and their surrounding matrices through biologically thick tissues. While these techniques are typically applied to cells or scaffolds under standard culturing conditions, several research groups are currently using these methods to perform nondestructive in situ imaging of scaffolds undergoing preconditioning in bioreactors. Kluge et al. recently introduced a bioreactor system capable of applying mechanical stretch to a porous silk fibroin sponge while allowing access to nondestructively image GFP-tagged fibroblasts with a penetration depth of approximately 162 μm in the scaffold using confocal microscopy and collagen deposition at a penetration depth of approximately 200 μm using nonlinear microscopy. 18 In a similar manner, Niklason et al. used a nonlinear optical microscope that assesses collagen deposition at penetration depths of approximately 135 μm within smooth muscle cell-seeded poly (glycolic acid) vessel scaffolds housed within a specialized pulsatile bioreactor undergoing preconditioning. 19 These studies demonstrate that while various advanced microscopy methods can be used for nondestructive scaffold assessment, such imaging modalities cannot maintain single-cell-level resolution beyond the limit of 100-200μm in turbid biological tissues and scaffolds. Fundamentally, this constraint is due to the fact that engineered tissue scaffolds typically require very high porosities (i.e., electrospun scaffolds27,30–32) for cell migration and overall colonization of the scaffold. As a result, scaffolds tend to induce very strong optical scattering and are consequently highly opaque. With a limited imaging depth, the methods reported in Refs. 18 and 19 may not be suitable for the evaluation of a clinically relevant vascular graft, where the graft should possess sufficient thickness to maintain structural integrity in the presence of pulsatile blood flow.
The FOB imaging method presented in the current study demonstrates the potential of using fiber-guided light to locally excite fluorescent cells to produce mapped images in highly scattering scaffolds. Our study using GFP-tagged ECs on electrospun PDLLA scaffolds showed that the penetration depth and the imaging resolution of the FOB method compared favorably with confocal microscopy. More specifically, the confocal microscopy results in Figure 6B displayed a greatly diminished resolution at a scaffold thickness of 100 μm. Furthermore, at imaging depths of 230 and 460 μm, the confocal microscope was unable to identify fluorescent cells through the scaffold and failed to generate the spatial distribution of GFP-labeled ECs on scaffold lumen (Fig. 6C, D). Therefore, in terms of imaging depth, the FOB imaging method is superior to confocal laser scanning microscopy, which is one of the state-of-the-art imaging methods for tissue-engineering research.
Current optical imaging methodologies are limited not only by penetration depth, but also by the short working distances of their optical objectives, which typically range from hundreds of microns to a few millimeters. Such short working distances require a specialized bioreactor design in order to place a tissue scaffold close enough to the objective to perform imaging.18,19 The FOB imaging method has a very large working distance that can reach up to 8 cm. This distance can be easily extended using commercially available long distance objectives, as the method is based on collecting diffused fluorescence light emitted from the scaffold. This practical advantage can be particularly useful for preconditioning studies that require a larger distance between the objective and the tissue scaffold. In contrast, advanced imaging methods such as confocal and nonlinear microscopy critically depend on using high numerical aperture objectives with very short working distances. For example, the 10× objective we used for confocal imaging in this study has a short working distance of 2 mm and could not be used to image the PDLLA scaffold sealed within the parallel plate bioreactor. Consequently, the results of imaging studies in Figure 6 had to be carried out in a Petri dish with a 170 μm glass slide. Only in this configuration could the sample be placed close enough to the objective for imaging.
The data presented here show that currently, the imaging method can monitor fluorescent-labeled cells only in a 2D configuration. This technique is appropriate for endothelium and epithelium monolayers, seen in a large number of tissues and organs, and critical for their proper functions. Consequently, our method is uniquely suited for the study of hollow cavity organs and structures such as blood vessels, intestine, urogenital tract, and so on. However, this limitation is not a fundamental constraint and can potentially be circumvented by using more sophisticated signal processing and tomographical reconstruction techniques. For example, we have developed several fluorescence tomography techniques that are capable of reconstructing three-dimensional (3D) distributions of fluorophores in various scaffolds and animal models. Such methods can potentially be combined with signal processing reported in Ref. 33 to achieve 3D tomographical reconstruction. For tissues and scaffolds that possess significant heterogeneity, we may account for complex scaffold geometry and nonuniform optical parameters by using the tomographical technique discussed in Ref. 34.
Study results and implications
With an “unwrapped” configuration in Figure 1B, the planar scaffold enabled us to directly compare the FOB imaging method with standard fluorescence microscopy. In order to validate the imaging method, we performed a statistical comparison between the fluorescence-mapped images and control images using the ∼500 μm thick PDLLA scaffolds. In particular, the MAE and RMSE were calculated using 75 pairs of fluorescence-mapped images and their corresponding control images (25 pairs per scaffold). The MAE indicates that the mapped images are within 6% error compared with the control images, and the RMSE shows that deviations are roughly around 10%. It should be noted that the RMSE comparison method is more sensitive to statistical outliers than the MAE and, thus, the preferred indicator of mapping accuracy. 23 Overall, both methods show that the error is consistent between scaffold groups and that the standard error within scaffold groups is small, thereby validating that the fluorescence-mapped images are a reliable estimation of the actual cell distribution.
Characterization of the excitation spot on the scaffold surface allowed an estimation of the spatial resolution of the FOB imaging method. Once excitation light was delivered into the scaffold through the MIC, it experienced optical scattering as it traveled to the surface. Since the MIC-to-surface distance varied with regard to the launching angle, the FWHM of the excitation spot at the scaffold surface varied accordingly. As a result, the system resolution decreased as the launching angle increased. According to the results in Figure 7, the FOB imaging method has a spatial resolution in the range of 20–30 μm. Furthermore, the results in Figure 4 showed that the imaging system can spatially resolve single GFP-labeled ECs on the scaffold's surface, which is consistent with 20–30 μm imaging resolution. Although the increasing FWHM presents a limitation along the field of view that is perpendicular to the MIC, the range is at least 300 μm according to Figure 4. If a higher resolution is desired in a larger field of view, then we can always incorporate more MICs within the scaffold. Furthermore, we also note that the field of view along the MIC direction is essentially unlimited.
Similar to other imaging methods, the results of the fiber-based imaging method are only accurate if the cell fluorescence signal is stronger than the scaffold autofluorescence noise. Given the spectral response in Figure 8A, the SNR of the imaging system is found by dividing the signal curve (1) by the noise curve (2), which is equal to or greater than 2 at the peak GFP emission (510–530 nm). As observed in Figure 4, an SNR of 2 is sufficient to separate the signal from the noise to obtain cell-level resolution images. In future, we can further improve the SNR by ensuring the fluorescently labeled ECs have a minimal spectral overlap with scaffold autofluorescence.
We emphasize that the imaging method is dynamic and nondestructive, which means that we can scan the same ROI multiple times over any desired time period. In fact, in Figure 9, we have demonstrated that we can continuously monitor the movement of single GFP-labeled ECs through the ∼500-μm-thick scaffold. The substantial increase in imaging penetration depth and flexibility in the placement of camera and objective lens enables us to address the pressing need for the nondestructive, dynamic imaging of engineered tissue constructs in geometrically constrained configurations. The example we used in the current study was intended to visualize fluorescent ECs through a relatively thick and optically opaque scaffold contained in a bioreactor. However, due to the constraint imposed by the enclosed tubular geometry of a blood vessel, and the design of fluid flow bioreactors, it is exceedingly difficult to monitor the cells in a nondestructive and dynamic manner with conventional microscope-based methods. 10 A major motivation of the current work was to design an imaging method that can circumvent these geometrical constraints. Given the advantages offered by a significantly enhanced imaging depth and working distance, this imaging method is perfectly suited to evaluate the endothelialization of tissue-engineered vascular grafts (i.e., EC proliferation, coverage, and response to flow) and may find numerous in vitro or in vivo applications in other tissue-engineered constructs that contain epithelial tissues.
Conclusion
In this study, we developed a novel imaging method that is capable of nondestructive and dynamic imaging of fluorescent cells through an optically opaque scaffold housed within a bioreactor. The FOB imaging modality is based on the targeted excitation of individual cells, capturing the emitted fluorescence through the scaffold and producing a mapped image based on the position of the excitation light. A comparison of the fluorescence-mapped images to the control images confirmed that the system can accurately provide a cellular distribution through the optically opaque scaffold. Furthermore, the method demonstrated an imaging penetration depth of greater than 500 μm through the electrospun PDLLA scaffold, which significantly exceeded what can be achieved using confocal microscopy. We envision that this imaging modality will advance our understanding of the complex process of neo-tissue development and remodeling in vitro in a nondestructive manner. Building on the dynamic imaging capabilities, we intend to further develop this technology to assess bioengineered vascular grafts in vitro and potentially for in vivo tissue engineering studies.
Footnotes
Acknowledgments
The authors thank Dr. Aaron Goldstein in the Department of Chemical Engineering at Virginia Tech for his insight in the bioreactor design and Dr. Joseph Freeman in the Department of Biomedical Engineering at Virginia Tech for his advice in scaffold sintering. This research was funded by a grant from the National Institutes of Health (NIBIB, HL098912), the National Science Foundation (CBET 0955072), and the Institute for Critical Technology and Applied Science (Holey Scaffolds, Virginia Tech).
Disclosure Statement
No competing financial interests exist.