
Abstract
Increased sensitivity in the characterization of cartilage matrix status by magnetic resonance (MR) imaging, through the identification of surrogate markers for tissue quality, would be of great use in the noninvasive evaluation of engineered cartilage. Recent advances in MR evaluation of cartilage include multiexponential and multiparametric analysis, which we now extend to engineered cartilage. We studied constructs which developed from chondrocytes seeded in collagen hydrogels. MR measurements of transverse relaxation times were performed on samples after 1, 2, 3, and 4 weeks of development. Corresponding biochemical measurements of sulfated glycosaminoglycan (sGAG) were also performed. sGAG per wet weight increased from 7.74±1.34 μg/mg in week 1 to 21.06±4.14 μg/mg in week 4. Using multiexponential T2 analysis, we detected at least three distinct water compartments, with T2 values and weight fractions of (45 ms, 3%), (200 ms, 4%), and (500 ms, 97%), respectively. These values are consistent with known properties of engineered cartilage and previous studies of native cartilage. Correlations between sGAG and MR measurements were examined using conventional univariate analysis with T2 data from monoexponential fits with individual multiexponential compartment fractions and sums of these fractions, through multiple linear regression based on linear combinations of fractions, and, finally, with multivariate analysis using the support vector regression (SVR) formalism. The phenomenological relationship between T2 from monoexponential fitting and sGAG exhibited a correlation coefficient of r2=0.56, comparable to the more physically motivated correlations between individual fractions or sums of fractions and sGAG; the correlation based on the sum of the two proteoglycan-associated fractions was r2=0.58. Correlations between measured sGAG and those calculated using standard linear regression were more modest, with r2 in the range 0.43–0.54. However, correlations using SVR exhibited r2 values in the range 0.68–0.93. These results indicate that the SVR-based multivariate approach was able to determine tissue sGAG with substantially higher accuracy than conventional monoexponential T2 measurements or conventional regression modeling based on water fractions. This combined technique, in which the results of multiexponential analysis are examined with multivariate statistical techniques, holds the potential to greatly improve the accuracy of cartilage matrix characterization in engineered constructs using noninvasive MR data.
Introduction
Previous studies have established correlations between MRI parameters, such as T1, T2, magnetization transfer rate (km), and apparent diffusion coefficient, and biochemical properties of engineered cartilage.1,3–5 T1 and T2 increase with tissue hydration and decrease with synthesis of macromolecules and are also sensitive to other molecular characteristics of tissue. 6 Nevertheless, these measurements provide only a general assessment of matrix without exhibiting specificity for particular macromolecular components. However, water molecules are separately associated with macromolecular components exhibiting differing mobilities, and so are expected to exhibit distinct transverse relaxation times. 7 The relative concentration of water associated with these components can be estimated using multiexponential transverse relaxation analysis, as previously applied to gels and tissues.7–12 The relaxation times and concentrations of T2 components have been shown to change in response to enzymatic degradation in cartilage, demonstrating the sensitivity of multiexponential analysis to matrix degeneration. 13 Multiexponential T2 analysis is a particularly promising approach to characterizing developing engineered tissue, which exhibits pronounced changes in matrix composition during growth.
Support vector regression (SVR) is a statistical modeling technique based upon the support vector machine (SVM) algorithm, initially developed for classification 14 and recently applied to cartilage analysis. 15 SVM is an increasingly widely used machine-learning approach for classification of data into separate groups. One application, as in our case, is to determine to which of two groups a given experimental sample belongs based on experimental measurements of properties of that sample. The SVM seeks to divide these separate experimental groups by a gap in parameter space that is as wide as possible, with the surface defining the middle of this gap designated as the decision surface. Imposition of a penalty function for misclassified samples renders this a well-posed problem. 16 The classification is nonlinear, resulting in great flexibility in defining the decision surface. As with the SVM, SVR analysis is based on a subset of data points, called support vectors, which consists of samples that are properly classified but are least characteristic of their group. In other words, the support vectors are the data points that are closest to the decision surface, but are still correctly classified. SVR does not require a priori specification of the relationship between the independent and dependent variables; in particular, there is no restriction to a linear model.
We therefore applied multiexponential T2 analysis to engineered cartilage and used the component weight fractions in developing SVR models. Chondrocyte-seeded collagen gels represent a clinically relevant system for which the ability to noninvasively assess construct biochemistry is of potentially substantial importance.17,18 Results were compared with biochemical measurements, allowing us to evaluate the ability of noninvasive MR analysis to predict sulfated glycosaminoglycan (sGAG) content.
Methods
Fabrication of constructs
Chondrocytes were isolated from articular cartilage harvested from stifle joints of 2- to 4-week-old calves and were mixed with 0.32% collagen type I gel (BD Biosciences) prepared according to the manufacturer's protocol, resulting in a final collagen concentration of 0.27% with 4.4×10⁶ cells/mL. The seeded constructs underwent gelation at 37°C, with polymerization completed within 35 min. Constructs were cultured in six-well plates in Dulbecco's modified Eagle's medium (Invitrogen) supplemented with 10% fetal bovine serum (Hyclone), 2 mM glutamine, 0.2% penicillin/streptomycin (Invitrogen), 0.25 μg/mL fungizone (Invitrogen), 50 μg/mL gentamicin (Invitrogen), 0.1 mM nonessential amino acids (Invitrogen), 0.4 mM L-proline (Sigma), and 50 μg/mL L-ascorbic acid-2-phosphate (Sigma). Each construct had a total volume of 350 μL and was cultured in 5 mL of medium in a separate well at 37°C under a gas mixture of 95% air/5% CO2. The culture media were changed three times per week. Both MR and biochemical measurements were made on each construct after 1, 2, 3, and 4 weeks of culture (n=6 per group).
Biochemical analysis
Constructs were blotted to remove excess fluid, weighed and then lyophilized and digested in 0.5 mg/mL proteinase K (Sigma) in digestion buffer (50 mM tris hydrochloride and 5 mM calcium chloride). sGAG content was quantified in the digests using the dimethylmethylene blue assay with a shark cartilage chondroitin sulfate (CS) standard. 19 All 24 samples were subjected to biochemical sGAG analysis.
MR measurements
MR data were acquired at 4°C using a 9.4 T (400 MHz for 1 H) Bruker DMX spectrometer (Bruker Biospin GmbH). T2 relaxation data were obtained using a 10-mm birdcage coil and a Carr-Purcell-Meiboom-Gill pulse sequence with echo time TE=0.6 ms, interpulse delay TR=10 s, 4096 echoes, and 64 signal averages. Even-numbered echoes were used for analysis, 9 yielding an effective TE of 1.2 ms, precluding detection of rapidly relaxing collagen-bound water.20,21 Intensities were fit to a three-parameter monoexponential function to obtain conventional T2 relaxation times; the same data were used for multiexponential analysis as described in the section “Fitting of multiexponential T2 relaxation data.”
Fitting of multiexponential T 2 relaxation data
The nonnegative least squares (NNLS) method was used for the multiexponential T2 analysis, 7 with 80 T2 bins logarithmically spaced over the interval (0.1, 3000) ms. T2 distributions were regularized using a minimum energy constraint, with optimal regularization defined as resulting in a chi-squared of 101% of the nonregularized fit. Component relaxation times were assigned values equal to the first moment of the corresponding peak in the T2 distribution, while associated weight fractions were derived from peak areas. The sum of these weights was constrained to unity by the NNLS procedure. Based on our simulation results, we then excluded components with weights <1% or T2<2 ms, which could not be reliably quantified, so that the sum of the reported weights was less than unity. Analysis was implemented using MATLAB (MathWorks).
Simulation of multiexponential T 2 relaxation data
Simulations of a three-compartment system were performed based on average experimental values for component T2 values and weights and with TE=1.2 ms and 2048 echoes to ensure admissibility of our results.
7
The form of the decay was given by:
Where y(n*TE) represents the amplitude of the nth echo, B represents a baseline offset, y0 is overall signal amplitude, wm is the weight of the mth T2 component, and N(0,σ) represents additive Gaussian noise with mean 0 and standard deviation σ. Signal-to-noise ratio (SNR) was defined as y0/σ, with values based on average experimental results. SNR values used in the simulations were 10,900, 21,400, 21,400, and 29,600 for samples cultured for 1, 2, 3, and 4 weeks, respectively. The reliability, accuracy, and precision of the results were evaluated over 100 trials with different noise realizations. Reliability was defined as the percentage of simulations yielding the correct number of T2 components; accuracy was defined by the average percent difference between the T2 values and weight fractions used as inputs for simulating an echo train and the T2 values and fractions derived from that echo train through NNLS; and precision was defined as the average coefficient of variation (CV) of the T2 values and weight fractions obtained from NNLS analysis of the simulated echo trains. Admissibility was then defined as (i) reliability of ≥90%, that is, the analyses of at least 90% of the simulations with independent noise realizations identified three T2 components; (ii) errors of <15%, that is, average weights and relaxation times were accurate to within 15% of the input values; and (iii) CV <15%, meaning that the CV of weight fractions and T2 values was <15%.
Univariate regression correlating MR parameters with sGAG concentration
Linear regression analysis was performed with MR-derived component weight fractions as the independent variables and biochemically determined sGAG concentration as the dependent variable to determine the ability of single MR parameters to predict sGAG content.
Univariate regression models relating measured and calculated sGAG concentrations
Of the total of 24 samples, 20 samples demonstrated three multiexponential components and were used for the univariate and multivariate analyses. The remaining four samples (two each from the 2- and 4-week time points) showed only two components, with intermediate and slow relaxation times. Regression relations between measured and calculated sGAG were formed in the following way. The 20-sample dataset was randomly divided into five groups. Four groups were used as a training set, with a linear regression relationship established between these samples' MR parameters and their biochemically measured sGAG concentrations. This procedure was performed a total of five times, with a different one of the original five groups excluded from the analysis in each trial; this is similar to cross-validation. 16 The slopes and offsets obtained from each of these five regression analyses were recorded. This procedure was repeated 100 times, resulting in a total of 500 slope values and 500 offset values. The final regression model, used to calculate sGAG content from MR parameters for the entire set of 20 samples, was defined by the mean of the 500 slope values and the mean of the 500 offset values.
Multiple linear regression models relating MR parameters and measured sGAG concentrations
The 20-sample dataset used for the univariate regression models was also used for multiple linear regression (MLR) analysis. Two analyses were performed. First, standard MLR was performed with all of the four possible linear combinations of MR-derived component weight fractions. Thus, regressions with {α w1+β w2+δ}, {α w1+γ w3+δ}, {β w2+γ w3+δ}, and {α w1+β w2+γ w3+δ} as independent variables and biochemically determined sGAG concentration as the dependent variable were performed. Here α, β, and γ are regression coefficients, and δ is the constant offset term, determined by the MLR analysis. This establishes the ability of MR parameters jointly to predict sGAG content through a linear model. Second, in a manner analogous to that described for univariate regression previously, for each of the four established regression relationships, the regression coefficients and offsets were used to calculate the sGAG content for the group of 20 samples. Correlations were then established between these calculated sGAG concentrations, obtained from the MLR analysis, and the biochemically measured sGAG concentrations.
Support vector regression
SVR describes a form of nonlinear analysis in which a regression relationship is established between a dataset defined as a set of points within d-dimensional Euclidian space,
In SVR, the form of the regression is f(
Unlike conventional linear regression analysis that minimizes prediction error, SVR minimizes a more general error that is determined by both prediction error and the complexity of the higher-dimensional feature space in which regression is performed.
22
This results in a less-overconstrained model that maintains good performance on validation sets. A regularization term defines the tradeoff between the deviations |yi−f(
The SVR model is the solution of a convex optimization problem for determining the support vectors.
14
The method of Lagrange multipliers is used, with a Lagrange dual function determined by inner products within the transformed feature space. These define a kernel function K(
Our SVR model used weight fractions as independent variables with biochemically measured sGAG concentration as the dependent variable. The model was determined from the full dataset of component fractions and corresponding sGAG concentrations from all samples using fivefold cross-validation. The model was then applied to define the relationship between measured and calculated sGAG for the entire dataset. Analyses were performed using MATLAB scripts developed in-house and the e1071 package. 26
Statistical analyses
Values are reported as mean±standard deviation. One-way ANOVA was used to test for significant changes (p<0.05) in MR parameters and biochemically measured sGAG concentration as a function of time in culture. Univariate linear and multivariate MLR and SVR analyses were performed correlating sGAG concentration and the MR parameters as described previously.
Results
Biochemical results
sGAG content per wet weight (ww) increased from 7.74±1.34 μg/mg ww in week 1 to 21.06±4.14 μg/mg ww in week 4 (172%; p<0.001), consistent with previous results showing increasing macromolecular concentration with culture time 2 (Table 1).
sGAG concentration increased significantly from week 1 to 4 with week 4 constructs having the highest sGAG content.
Indicates significant difference from week 1; p<0.05.
Indicates significant difference from week 2; p<0.05.
Indicates significance difference from week 3; p<0.05.
sGAG, sulfated glycosaminoglycan.
Multiexponential T 2 simulation results
The accuracy and precision of component relaxation times and weights were calculated as described previously (Table 2). Reliability was greater than 90% in all cases (91%, 94%, 99%, and 97% for weeks 1, 2, 3, and 4, respectively), indicating robustness in resolving the three components. Admissibility criteria were met by all component fractions and T2 values except w2 and T22 of week 1 constructs, which were accurate to within 37% and 28%, respectively. In general, accuracy and precision were lowest in the week 1 constructs, likely due at least in part to the greater difference between the smallest and largest weight fractions and relaxation times at that time point. 13 For weeks 1, 2, 3, and 4, w2 and T22 were consistently underestimated; this compartment also exhibited the least accuracy in both relaxation time and fraction size as compared with other compartments. All underlying trends with maturation were clearly evident in the MR data.
Accuracy describes the percent difference between fitted and simulated T2 values and weights while precision describes the coefficient of variation of the fitted T2 values and weights over 100 runs with different noise realizations. The largest errors were found in week 1 constructs in the (w2, T22) components.
Multiexponential T 2 experimental results
A representative T2 distribution from a 3-week-old construct is shown in Figure 1, indicating the presence of three water compartments, with approximate T2 values of 45, 200, and 500 ms, and weight fractions of 3%, 4%, and 93%. Averaged T2 values and weights for all time points are shown in Table 3.
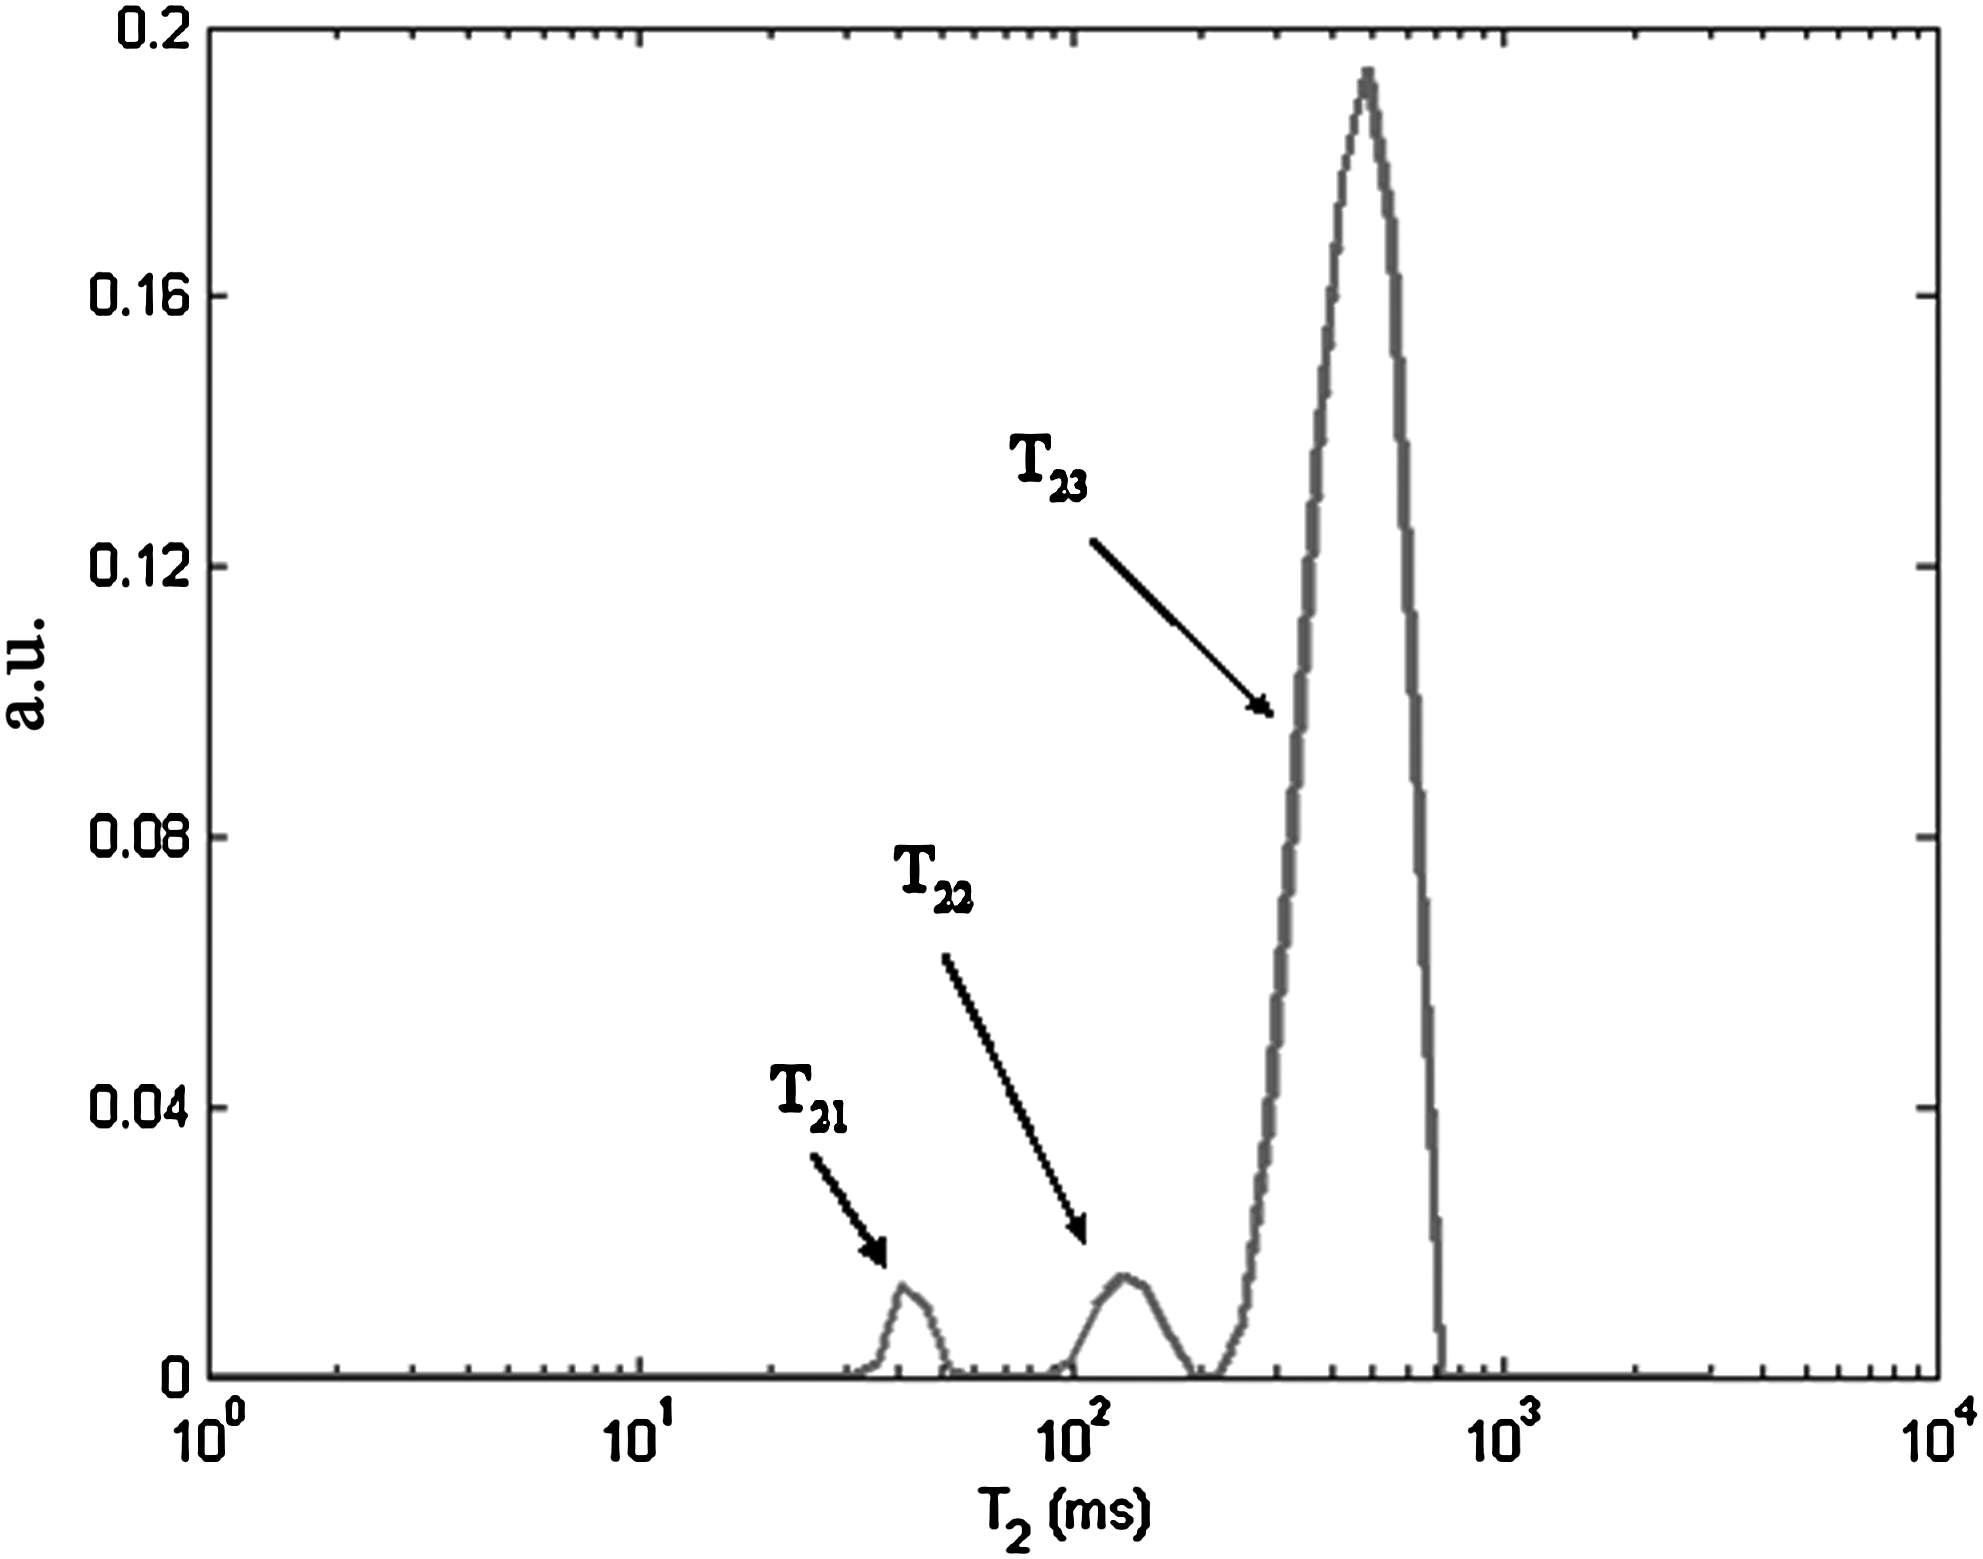
Representative T2 distribution from an engineered construct after 3 weeks of development. Three dominant water compartments are evident, with their corresponding T2 values indicated on the horizontal axis. The vertical axis is in arbitrary units (a.u.), defined by the integrated areas summing to unity.
The most slowly relaxing compartment, T23, and its associated fraction, w3, were assigned to the bulk water compartment. T22 (with component fraction w2) and T21 (with component fraction w1) were assigned to proteoglycan-bound water. In general, w3 decreased while w2 and w1 increased with maturation, particularly at the end of the culture period.
Indicates significant difference from week 1; p<0.05.
Indicates significant difference from week 2; p<0.05.
Indicates significant difference from week 3; p<0.05.
The components with T2 values of ∼40–55 and ∼160–230 ms were assigned to proteoglycan (PG)-bound water, based on their T2 values and weights. These provisional assignments are consistent with our previous findings in native cartilage, 7 in which T2 components with values ∼2 and ∼25 ms were provisionally assigned to PG and a component with T2 of ∼96 ms was provisionally assigned to bulk water. As expected, given the lower macromolecular content of engineered constructs as compared with explants, the corresponding components in the current study exhibited substantially longer T2 values.
Although T21 remained fairly constant, w1 was significantly greater (p<0.001) at later stages of development, ranging from 0.022±0.005 in week 1 to 0.037±0.003 in week 4. Most of this increase occurred between weeks 3 and 4. These results indicate that the PG moiety associated with this compartment may undergo relatively slow initial synthesis, but may be a marker for eventual maturation.
T22 decreased from 230.6±11.9 ms in week 1 to 180.6±19.8 ms in week 4 (p<0.001), suggesting decreasing molecular mobility with development time. The corresponding weight fraction, w2, increased substantially and significantly over the development time, from 0.032±0.008 to 0.073±0.01 (p<0.05), with most of the increase again occurring between weeks 3 and 4. This compartment may therefore also be associated with construct maturation.
The tissue compartment with the longest T2, indicating greatest molecular mobility, also had the dominant weight fraction and was assigned to bulk water. Its relaxation time, T23, was decreased by 22.6%, from 580.2±63.9 ms after 1 week of growth to 448.7±22.4 ms after 4 weeks (p<0.05). This observation suggests increased motional restriction associated with ongoing macromolecular synthesis, consistent with our biochemical results. In addition, the corresponding weight fraction, w3, decreased by 5.4% from 0.92±0.01 after 1 week of growth to 0.87±0.02 after 4 weeks (p=0.002), consistent with decreasing construct hydration during development. 27
Linear and SVR analyses
Univariate correlations between sGAG and component fractions (Fig. 2) demonstrate that both components provisionally assigned to PG-bound water, w1 and w2, show positive correlations with sGAG concentration (r2=0.43 and 0.51, respectively). The bulk water component fraction, w3, was negatively correlated with construct sGAG concentration (r2=0.46), consistent with decreasing hydration with increasing macromolecular synthesis. 27 The sum of the PG-associated component fractions, w1+w2, showed a somewhat better correlation with sGAG content, r2=0.58, than did either w1 or w2 alone. Moreover, w1 and w2 were only moderately correlated with each other (r2=0.58, not shown), suggesting that these components represent different moieties. Linear correlations of the sums (w2+w3), (w1+w3), and (w1+w2+w3) with sGAG resulted in r2 values of 0.50, 0.33, and 0.02, respectively (not shown).

Linear regression analysis using component fraction sizes as dependent variables and sGAG concentration as an independent variable.
We established univariate regression models directly correlating weight fractions with measured sGAG concentration as described previously. In addition, regression models were constructed, as described in the Methods section relating biochemically measured and MR-calculated sGAG concentrations based on each of the three component fractions, w1, w2, and w3, individually, resulting in r2 values of 0.43, 0.51, and 0.46, respectively, as well as the sum w1+w2, which gave an r2=0.54 (Fig. 3). For this analysis, success of the model is indicated by a high r2 value, a slope close to unity, and an intercept close to zero. The relatively large non-zero intercepts and the deviation of these slopes from unity indicate the limited ability of the univariate analysis to predict tissue sGAG concentration.

Correlations between predicted sGAG concentrations obtained from univariate linear regression analysis incorporating the indicated component fractions as described in the text, and biochemically determined sGAG content of the corresponding tissue-engineered constructs. Correlations between biochemically determined sGAG concentration and sGAG content calculated from magnetic resonance–measured weight fractions
T2 values obtained from monoexponential fitting exhibited a negative correlation with sGAG concentration as expected, 1 with r2=0.56 (Fig. 4). Neither T21 nor T22 correlated with sGAG content (r2=0.007 and 0.25, respectively) while, consistent with the result for T2,mono, T23 and sGAG concentration were modestly negatively correlated (r2=0.51, data not shown). The lack of correlation between T21 or T22 and sGAG content indicates the relatively indirect nature of the relationships between relaxation times and macromolecular content. Although T21 is assigned to a macromolecular compartment, motion within that compartment is evidently not sensitive to the degree of matrix development within the observed range of concentration. In contrast, the decrease in T22 with culture time indicates that this compartment may develop within a more spatially restricted environment, so that additional macromolecular development decreases motion and results in shorter T2. Further analysis with component relaxation times was not undertaken; instead, component weight fractions were used for MLR and SVR analyses since they are more direct measures of macromolecular concentration.

Correlation between biochemically measured sGAG concentration and transverse relaxation time calculated from monoexponential fitting. As expected, T2,mono decreased with increasing sGAG concentration (r2=0.56, p<0.05).
Results of the multilinear regression performed to correlate sGAG concentration with linear combinations of the weight fractions are shown in Table 4. As expected, in all cases, w1 and w2 are positively correlated, while w3 is negatively correlated, with sGAG content. It is of interest that the r2 values for the MLR are not substantially better than for the best univariate correlation (w2 vs. sGAG; r2 of 0.51). This clearly indicates the potential for a more sophisticated, nonlinear analysis, such as that provided by SVR, to improve the ability to predict sGAG concentration from weight fractions.
Results of regression modeling based on the seven unique linear combinations of component weights. The univariate models were established with w1, w2, and w3 as independent variables. Multiple linear regression was performed with linear combinations of two, or all three, of the available component weights, as indicated. In all cases, measured sGAG was the dependent variable. For all models, regression coefficients are shown below the variables used in that model, along with the offsets and r2 as indicated.
Correlations between measured sGAG concentrations and those calculated from the MLR analysis as described previously were established and found to be similar, with all correlation coefficients approximately equal to 0.55 and offsets of ∼6.5 (data not shown). The results for the linear combination of w1, w2, and w3 are shown in Figure 5. As expected, inclusion of additional variables resulted in somewhat improved prediction of sGAG content (r2=0.57, slope 0.566, intercept 6.3; Fig. 5) as compared with any of the univariate regressions shown in Figure 3. However, overall, no MLR analyses gave a substantially better correlation than the best univariate predictor, w2, which exhibited an r2 of 0.51 (Fig. 3). Finally, similar to the univariate analysis, the relatively large non-zero intercept and deviation of the slope from unity in Figure 5 indicate the limited ability of the MLR analysis to predict tissue sGAG concentration.

Correlation between predicted sGAG concentration derived from MLR analysis using the component weight combination [w1, w2, w3] and the biochemically determined sGAG content of the tissue-engineered constructs (r2=0.57). [w1, w2, w3] was the best predictor of sGAG content among all possible parameter sets in MLR. MLR, multiple linear regression.
Correlations between the sGAG content calculated from the SVR analysis and biochemically measured sGAG concentrations were established as described previously. We used fivefold cross-validation to establish regressions, and then the entire dataset (20 samples) was used to determine the accuracy of each parameter combination for estimating sGAG content (Fig. 6). Here, the slopes are substantially closer to unity, and the intercepts are closer to zero, than for the univariate and the MLR relationships (Figs. 3 and 5). In the SVR analysis, the parameter combination [w1, w2], consistent with the provisional assignment of w1 and w2 to sGAG, resulted in a substantially better prediction of sGAG content (r2=0.68 and slope 0.79; Fig. 6a) than did any of the univariate regressions shown in Figure 3 and the MLR shown in Figure 5. However, SVR analysis showed that parameter combinations incorporating w3, namely [w2, w3] (Fig. 6b; r2=0.93, slope 0.90) and [w1, w2, w3] (Fig. 6c; r2=0.82, slope 0.85) outperformed [w1, w2], indicating that the relatively unbound water fraction exhibits a relationship with sGAG concentration that is not fully redundant with those of the PG fractions. We interpret this as indicating that the w1 and w2 fractions depend not only upon the quantity of sGAG, but also upon, for example, molecular conformation, while the relationship between free water fraction, w3, and sGAG content is likely less dependent upon the specifics of sGAG configuration.
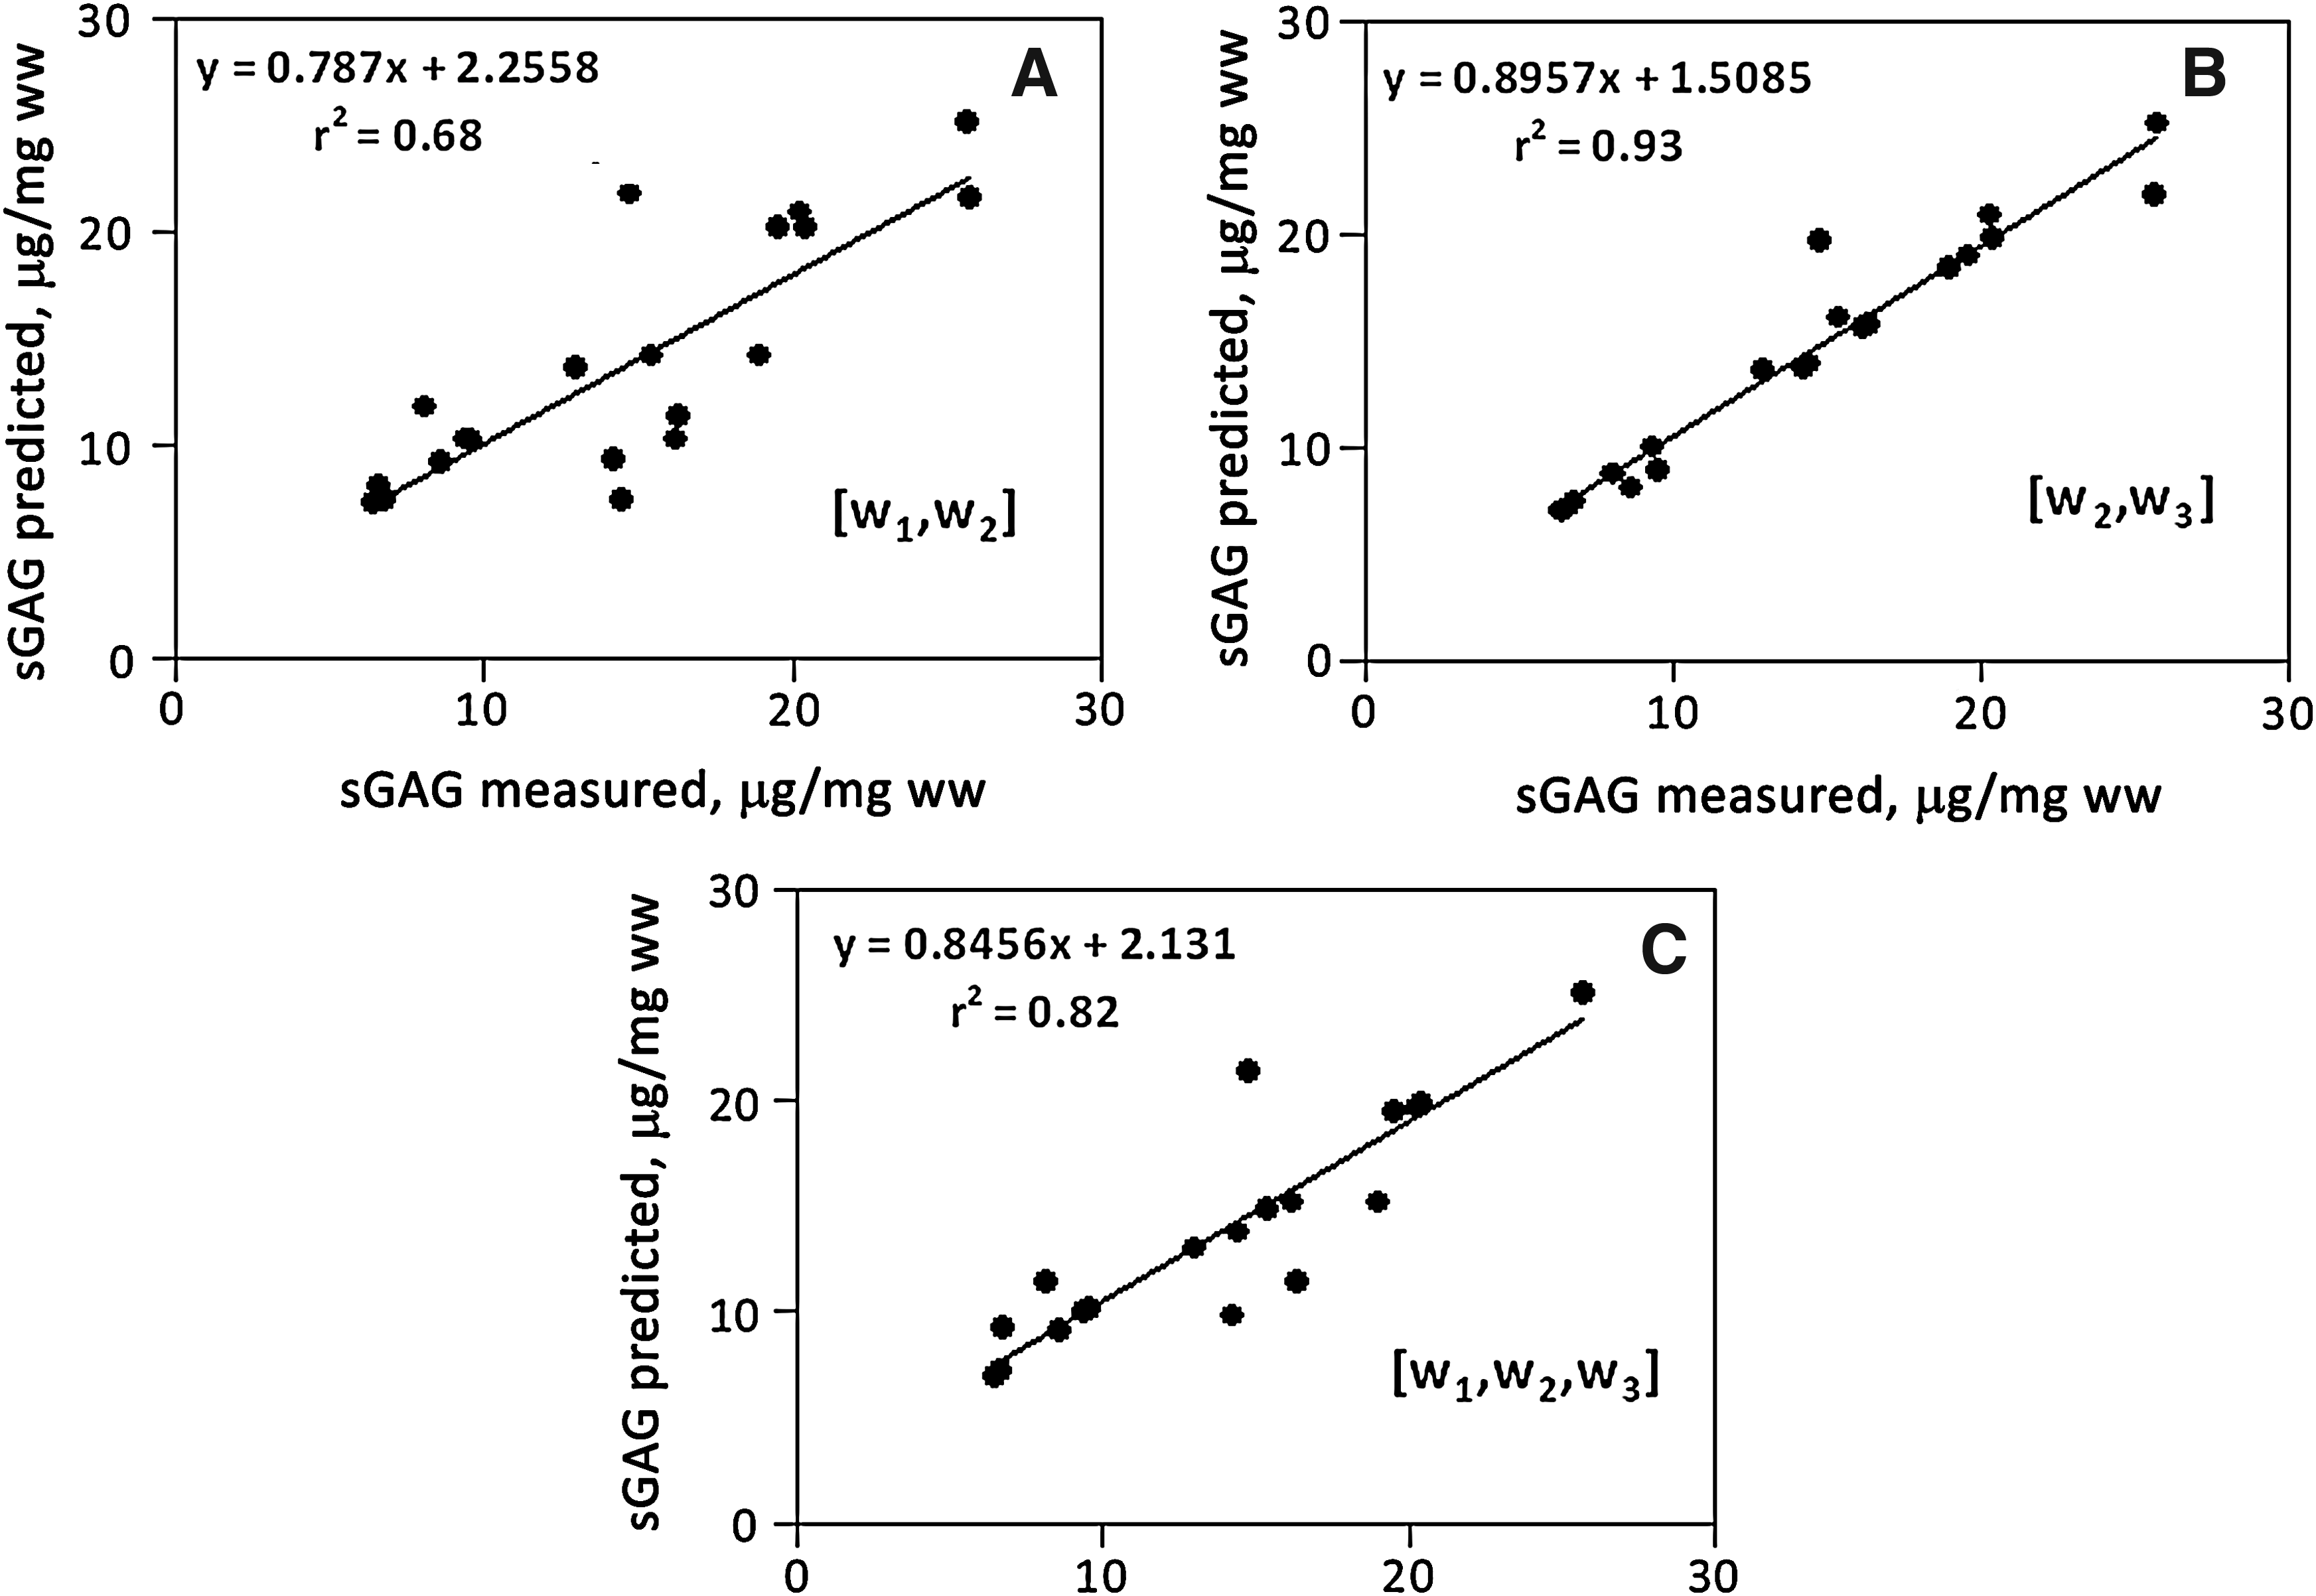
Correlations between predicted sGAG concentration derived from support vector regression analysis using the indicated component weight fraction combinations and the biochemically determined sGAG content of the tissue-engineered constructs. Combinations illustrated are
Discussion
Numerous studies have reported relationships between MR parameters and cartilage matrix composition.1,28–30 Recent work has explored tissue compartments within cartilage using multiexponential transverse relaxation analysis7,13,31 and has applied multivariate statistical techniques to characterize and grade cartilage.15,32 The current study combined these two approaches by developing SVR models from tissue compartment characteristics. This resulted in a substantial improvement in the ability of MR parameters to determine biochemical composition in constructs, as compared with conventional univariate analyses.
Two of the three water compartments detected were provisionally assigned to PG-bound water. Cartilage PGs exhibit a range of molecular weights, largely due to variations in the size of the attached GAG side chains.33–35 Sulfated GAGs in cartilage are primarily CS or keratan sulfate (KS) with molecular weights of 15–20 kDa 36 and 5–8 kDa, 34 respectively. In addition, PGs can either be associated with hyaluronic acid (HA) and therefore highly aggregated, 37 or nonaggregating. 34 Previously, gel electrophoresis and immunoblotting have been used to resolve cartilage PGs into distinct bands,38,39 representing CS-rich PGs, KS-rich PGs, and small monomeric PGs.40–42 These observations are consistent with our detection of two water compartments with intermediate relaxation times. We provisionally assign the more rapidly relaxing of these, (T21, w1), to the shorter-length and therefore more motionally restricted KS side chains and (T22, w2) to the longer and more flexible CS-rich PGs. 43 Since w2 remained larger than w1 throughout our experiments, this assignment is also consistent with the slower synthesis rate of KS-rich PGs, 34 as well as the fact that CS has greater water retentive capacity than KS.44,45 Further, the decrease in T22 after the first week of culture is consistent with increased attachment of PG monomers to the HA backbone, resulting in decreased mobility. Similarly, increased GAG chain attachment to the core protein would be expected to decrease PG mobility.
In contrast to the shorter values of T22 observed in more mature constructs, T21 remained essentially constant throughout the culture period, again suggesting that the macromolecules associated with these two relaxation times may be distinct PG moieties. The potential to resolve distinct pools of PG may be of substantial value in assessment of cartilage maturation.
Our results indicate that the relationship between mobility and fraction size is complex. T21 remained constant while w1 was greater at later maturation times, but T22 was smaller after one week, while w2 remained fairly constant until the fourth week. Therefore, mobility restriction with increasing macromolecular concentration depends upon the details of macromolecular structure and environment, and may not occur until macromolecular concentration in a given compartment exceeds a threshold.
The large increases in w1 and w2 over the final week of growth may reflect increased surface area for water binding due to an increase in nonaggregating PG species or longer GAG chains, consistent with previous observations 46 that the length of synthesized KS chains increased significantly after 3 weeks of culture. In addition, an increasing proportion of PG monomers 47 not bound to hyaluronan may increase the overall PG water-binding capacity.
In contrast to relaxation times, which are indirect measures of macromolecular content and structure, component fractions are direct physical indicators of water pool sizes. However, this correspondence is complex due in part to inter-compartmental chemical exchange and diffusion effects as well as instability in the inverse Laplace transform used to obtain the T2 distribution. Nevertheless, observed pool sizes can be interpreted in terms of tissue characteristics.7,13,31,48
Because the weight fraction w1+w2 correlated with sGAG concentration better than any other individual or sum of weights, we expected that the SVR model based upon [w1, w2] would outperform other models. However, both [w2, w3] and [w1, w2, w3] outperformed [w1, w2]. A possible interpretation of this is that while w1 and w2 depend on quantity and structure of sGAG, sGAG configuration may not significantly influence the relationship between free water fraction and sGAG concentration. Thus, it is possible for the sGAG concentration of the w1- and w2-associated compartments to increase without an equivalent increase in the fractional weights. Similar considerations apply to the fact that T23 displayed a higher correlation coefficient with sGAG content than did either T22 or T21.
Studies of control and degraded bovine nasal cartilage (BNC) 7 reported three relaxation components for control native cartilage, with T2 values of ∼2, 25, and 96 ms and corresponding fractional weights of 6.2%, 14.5%, and 79.3%. The longer relaxation times observed in the present work can be attributed to the lower macromolecular content and greater hydration of engineered tissue. Indeed, the bulk water fraction is much higher in the engineered constructs than in the native tissue and the sGAG/ww content of BNC has been stated to be ∼111 μg/mg, 31 more than four times the maximum sGAG concentration of the engineered constructs in this work. Additionally, the PG-bound water fraction in BNC correlated with Fourier transform infrared imaging-derived PG content (r2=0.51), 31 similar to the correlation between w2 and sGAG concentration reported in the current study. These findings show that as engineered constructs mature, the relaxation time of each component shortens and the corresponding weight fraction increases with increasing macromolecular content.
The shortest TE achievable with the radio frequency coil used in our experiments was 0.6 ms, precluding detection of a rapidly relaxing collagen-associated water compartment. Our provisional assignment of the three observed components to PG macromolecules and water is based on the considerations described previously, with more definitive assignments underway.
In summary, we have combined multiexponential T2 and multivariate SVR analyses to characterize engineered cartilage. The water compartments detected by multiexponential analysis can be attributed to the major PG subpopulations in cartilage. While component fractions by themselves were good predictors of sGAG concentration, substantial improvement was achieved through SVR analysis. Thus, this approach can potentially be used to increase the specificity of noninvasive MR measurements of matrix composition for monitoring the development of tissue-engineered constructs in culture and, potentially, for the in vivo assessment of implanted or endogenous repair tissue in diseased joints.
Footnotes
Acknowledgment
This work was supported by the Intramural Research Program of the NIH National Institute on Aging.
Disclosure Statement
No competing financial interests exist.