
Abstract
Due to its biological significance, cell adhesion to biomaterial surfaces or scaffolds is the key step in biomedical applications. Here, we describe two sensitive and facile methods that quantify the kinetic and mechanic properties of the entire cell attachment process characterized by two parameters: Adhesion Time TAd and Adhesion Force FAd. We demonstrate that both methods can be applied to any adherent cell type (e.g., stem or cancer cells), tissue-engineered substrate, and culture condition in a fast, effective, and reproducible manner. Additional investigations about the role of the extracellular matrix and the formation of focal contacts help in acquiring further interpretations of these parameters from biological and mechanical points of view.
Introduction
Cell adhesion is mediated via a structural link between adhesion ligands of the ECM and integrin receptors followed by the formation of focal adhesion complexes. 2 Due to the diversity and complexity of molecular events and the factors involved (e.g., selection of adhesion ligands of the ECM, 24 described integrin receptors, and focal adhesion complexes consisting of about 50 molecules), intensified by the missing knowledge concerning cell specificity, biophysical descriptions of cell attachment are the most promising. Theoretical approaches focus on protein adsorption, cell migration, the role of matrix elasticity, and conformational changes.6–10 Since the complexity of cellular systems is difficult to simulate, the predicted results are hardly in accordance with the biological reality. 11 Therefore, further experimental investigations of cell attachment dynamics are necessary.
Most research was concentrated on mechanical events and adhesive forces using magnetic or optical tweezers, micropipette aspiration, single-cell rheometry, fluid flow chambers, shear-mode sensor technique, surface force apparatus, shear fields, and atomic force microscopy (AFM).12–14 The forces exerted on the cells or generated by the cells can be measured with high precision with regard to the binding probability and interaction area in a time-dependent manner. However, various parameters have to be controlled in order to provide reproducible and quantitative results. 15 Single-cell analysis and a restricted sensitivity further complicate significant measurements.8,12 With regard to biomedical applications, functionalized biomaterials with surface topographies or three-dimensional (3D) scaffolds are also critical to be handled with an AFM. Moreover, the evaluated forces have to be differentiated between initial adhesion, including unspecific reactions such as Van der Waal forces or electrostatic interactions, and focal adhesion—which is responsible for outside-in signaling and cell behavior.2,10,16 Such focal adhesion complexes are mainly formed within cell extensions after a cultivation time of several hours.7,9,17 The question is whether the methods just described (e.g., AFM) can provide quantification of the specific binding, as rounded cells in suspension and principally short interaction times are used.12,14
Alternatively, force techniques handling cells under standard culture conditions would be a huge benefit. This demand is realized by the centrifugal detachment assay. After cultivating the cells in any desired manner (cultivation time, substrate or scaffold, and temperature), variable centrifugal forces can be applied on the inverted samples to detach the cells. However, the experimental setups and quantifications described so far show several limitations: (a) the sample position induces lateral forces on the cells during centrifugation, which thereby falsifies the results; (b) the parameter Force Detachment (FD), calculated via the difference of cell and medium density multiplied by relative centrifugal force (RCF) and cell volume, uses generalized values for the densities and volume, which do not display cell specificity; (c) other studies standardize the detached cell number of different treatments—in return, the adherent cell number before the centrifugation started is not considered, so no valid results can be achieved.18–20
The force analysis based on the centrifugation demonstrated in this study provides several essential improvements. First, we build a rotor construction that excludes lateral forces exerted on the cells during centrifugation. Second, we introduce a novel analysis of the experimental results. After creating a treatment-specific detachment profile, presenting the relative number of adherent cells, the parameter Adhesion Force [FAd] can be evaluated. FAd quantifies the force needed to detach half of the adherent cells during a certain time interval.
Besides a mechanical analysis of cell attachment, up to now, a kinetic documentation of the entire process is poorly understood. To gain more insights on this topic, our second presented method enables the description of the rate of cell adhesion via specifying the decrease of cell density of nonadherent cells within a defined time scale. With the help of a treatment-specific adhesion profile, the parameter Adhesion Time [TAd] can be determined, which characterizes the time needed until half of the nonadherent cells attach to the material surface.
To demonstrate the broad application of both introduced methodologies, different experimental conditions were compared. Focussing on the effects of material wettability, additional investigations about ECM adsorption and focal adhesion complexes help interpret FAd and TAd from biological and mechanical points of view.
Materials and Methods
Material production: tissue-engineered substrates and ECM coating
With regard to biomedical applications, hydrophobic silicone elastomer and hydrophilic acrylated poly (ethylene) glycol (PEG) were used. A two-component silicone MED-4234 (NuSil Silicone Technology) was mixed in a proportion of 10:1 and spin coated. The polymerization of PEG (SR610; Sartomer) was achieved by the addition of 2 wt% photoinitiator Irgacure 2959 (Ciba Speciality Chemicals). Before use, both materials were sterilized under UV light for 30 min.
Furthermore, the ECM components laminin and fibronectin (first from Engelbreth-Holm-Swarm murine sarcoma basement membrane; second from bovine plasma; both purchased from Sigma-Aldrich) were compared. Using a sterile stocking solution of 0.01% in phosphate buffer salt (PBS), glass slides were coated with a concentration of 5 μg/cm2 for 30 min at room temperature. Afterward, the slides were washed with PBS.
Cell culture
TAd and FAd were studied using human fibroblasts, GM-7373 endothelial cells, HeLa cells, SH-SY5Y neuroblastoma cells, undifferentiated porcine mesenchymal stem cells (MSCs), and human adipose-derived stem cells (ASCs). Stem cell isolation followed the description in.21,22 The cells were cultivated in a cell incubator at 37°C and under a 5% CO2 atmosphere (Thermo Electron Corporation) in Dulbecco's modified Eagles medium (DMEM/F-12; Lonza) supplemented with 10% fetal calf serum and antibiotics. The analysis of ECM effects was performed in serum-free media. These specific culture conditions can be carried out during TAd and FAd measurements. Control treatments refer to the cells cultivated on glass slides. In all cases, the cell density of suspensions was determined by the use of the cell-counter Casy TT (Roche) after trypsinization. The antibodies were purchased from Sigma-Aldrich.
Measurement of adhesion time
First, the adhesion time scale of interest has to be defined. A limitation is necessary, as possible side effects such as detachment, cell growth, or death, which could occur after longer cultivation times, would not provide valid results. In this study, for the control and tissue-engineered materials 1 h time intervals and a total cultivation time of 5 h were used. On ECM-coated substrates, intervals and cultivation times were reduced to 10 min and 1 h, respectively.
For each time interval, either one Petri dish or well has to be prepared, including the substrate and the culture medium of interest. Then, the initial cell suspension of 1.2 to 2×10⁶ [cells/mL] for the different treatments is seeded out into all the prepared dishes or wells. At each defined time point, the medium including the nonadherent cells is collected and counted. With regard to the final time point, the adherent cells are additionally trypsinized, collected, and counted. By adding the final nonadherent and adherent cell number, it can be checked whether the total final cell density is in accordance with the initial cell seeding. For a better comparison between the experiments, the estimated cell densities are normalized on the initial cell number and given in percent. Every result has to be averaged over at least four independent measurements, which creates the so-called adhesion profile representing the relative number of nonadherent cells versus time.
Measurement of adhesion force
To exclude lateral forces exerted on the cells during centrifugation, a novel rotor construction with a circle diameter of 84 mm corresponding to the rotor size of the centrifuge (Universal 320; Hettich) was fabricated (Fig. 1). The entire construction is built out of aluminum to provide stability, and its symmetry along the rotation avoids uncontrolled unbalances. For fixation, the circle is screwed on three bolts, which are placed within every fourth of the total 12-tube carrier of the original centrifuge rotor. Since the used centrifuge consists of an angle rotor, the position of the inserted bolts with a length of 30 mm and a diameter of 10.8 mm is automatically inclined, so that the protruding part of the bolt has to be bevelled with an angle of 45°—to achieve a horizontal position of the fixed circle on top. Circle fixation with the bolts is performed via three vertical pilot holes with a diameter of 4.5 mm. The circle itself has a height of 20 mm and a depth of 12 mm; it includes 12 holes with a diameter of 10.8 mm and of 12 mm length alongside the vertical side. Standard 1.5 mL microcentrifuge tubes are supposed to be plugged into these holes in a manner in which the top cover of the tubes cannot pass through the holes. This enables a stable fixation of the tube into the circle during centrifugation.
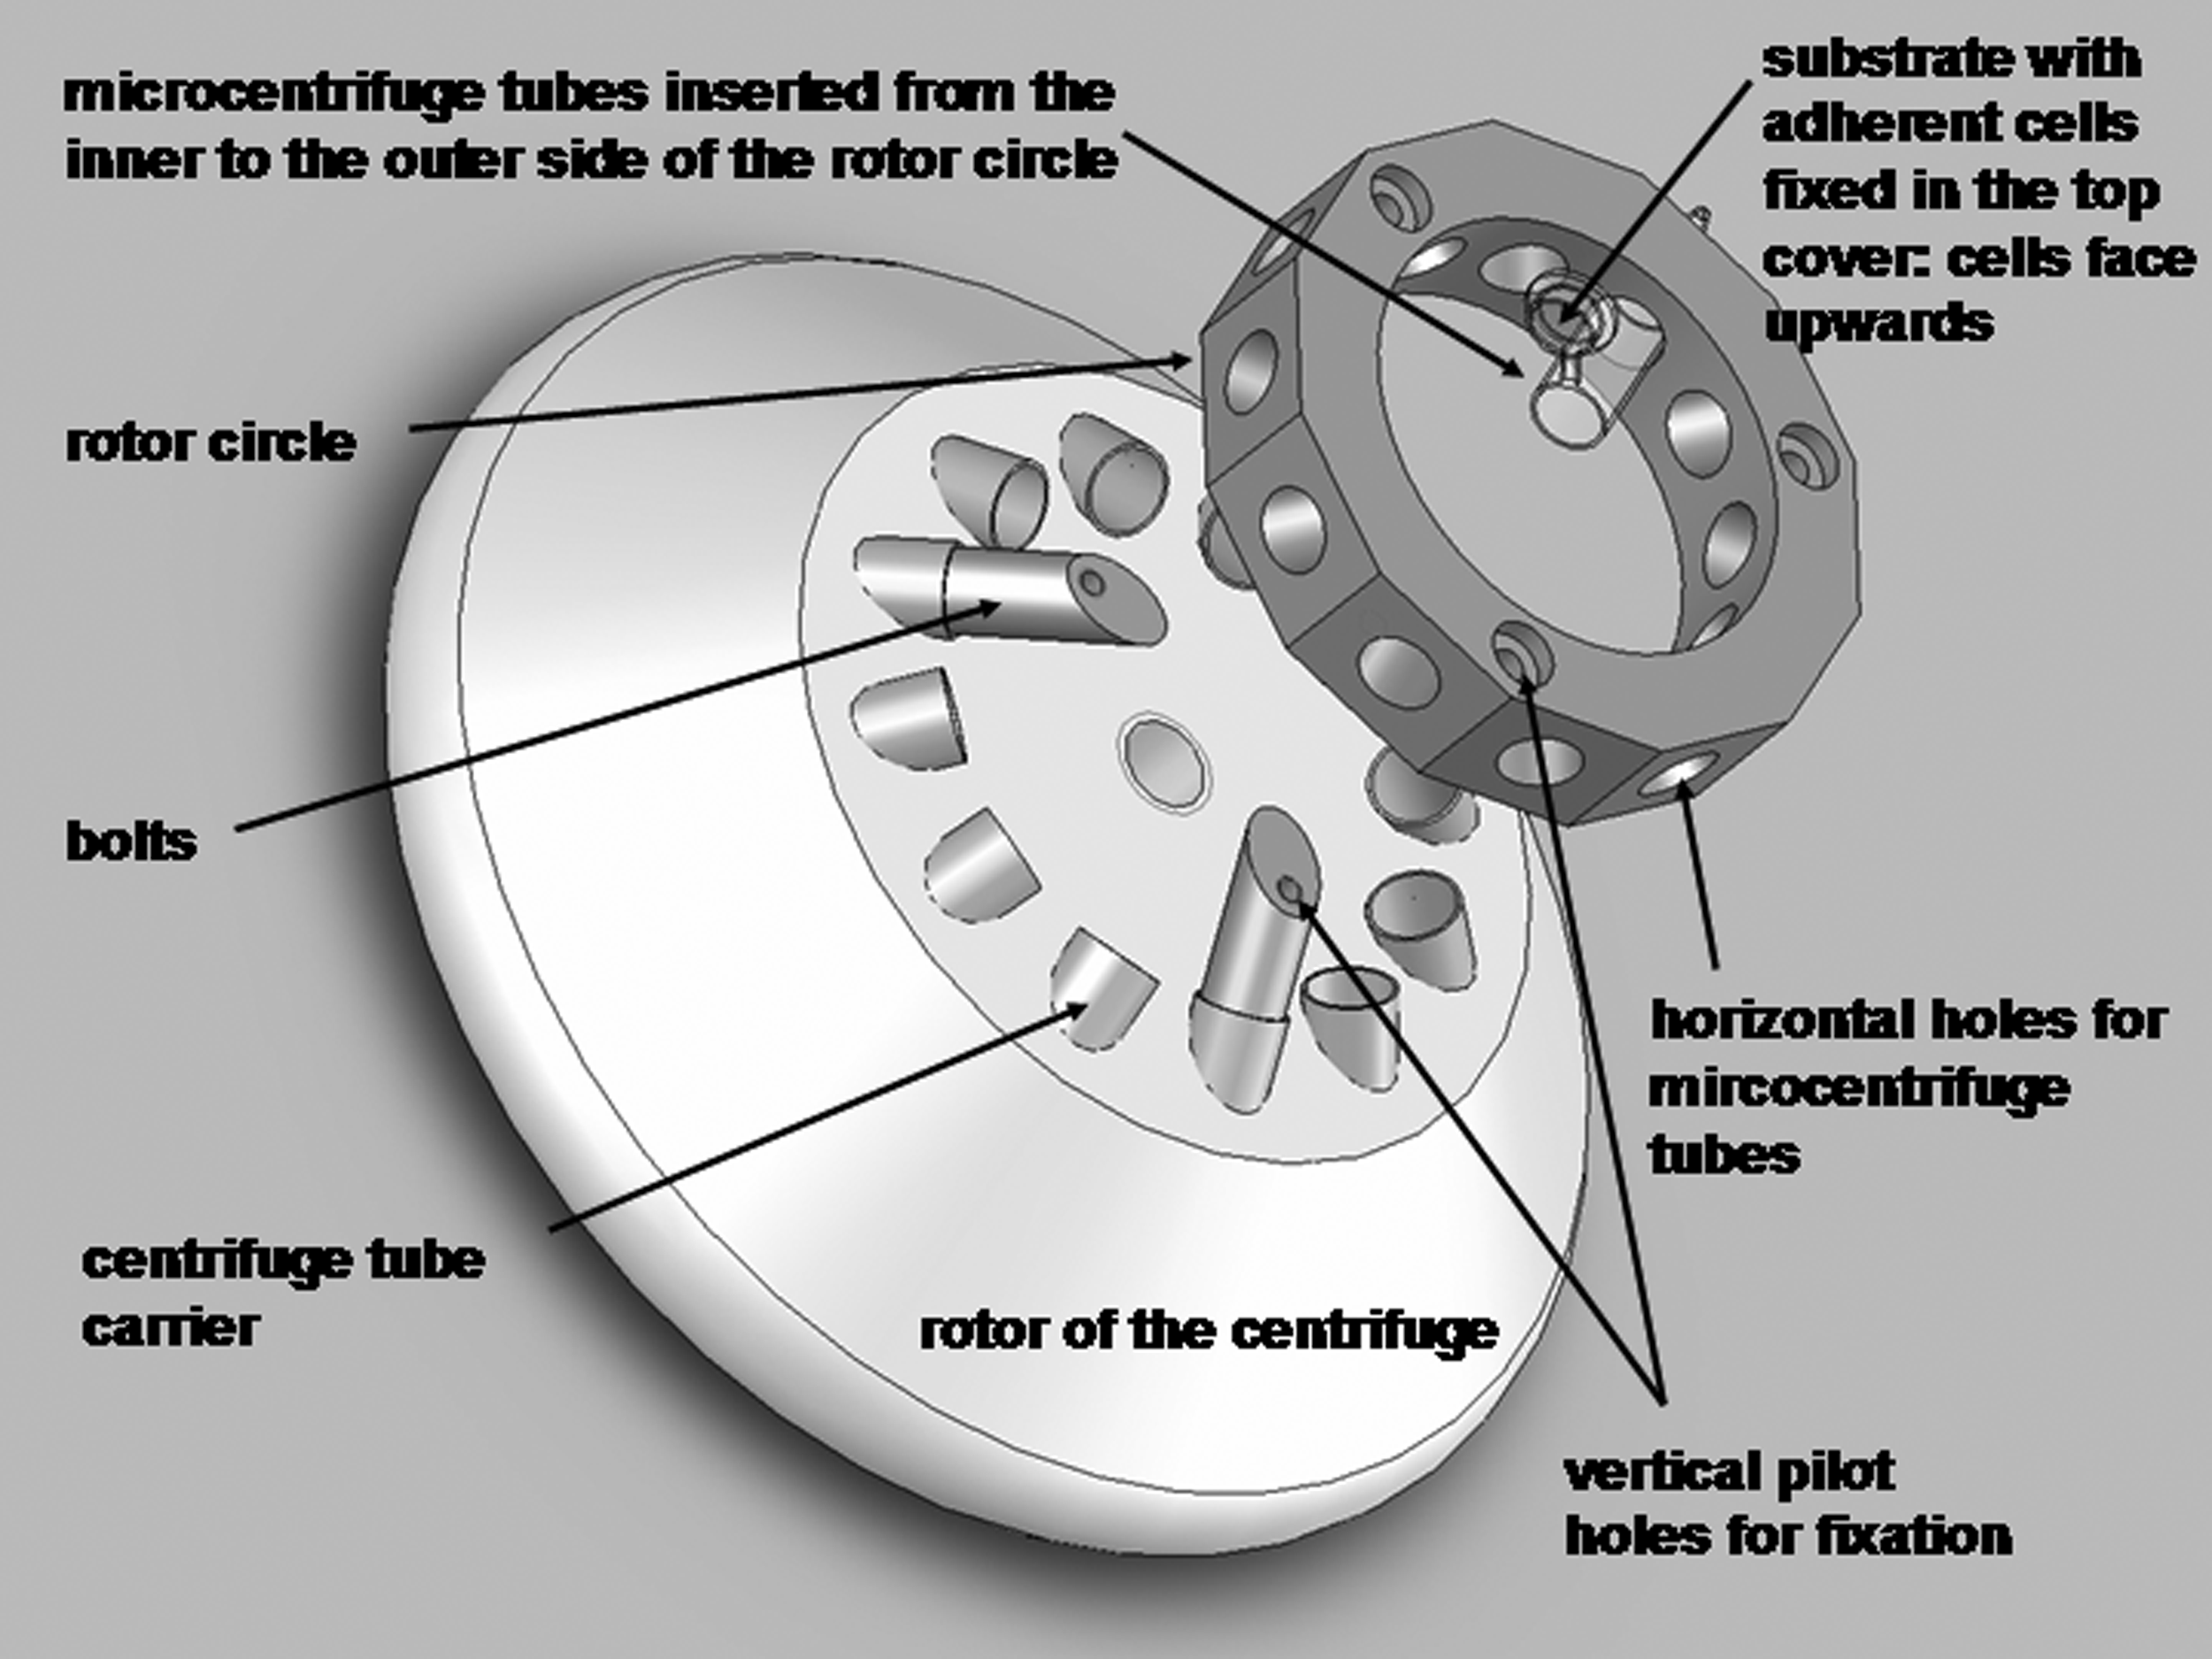
Rotor construction. Schematic illustration of the rotor construction used for a centrifugation assay that quantifies Adhesion Force FAd.
Before centrifugation, the microcentrifuge tubes (Roth) are filled with 1.5 mL PBS, and the substrate with the cells is fixed in the internal side of the still-opened top cover—placing the substrate surface with the adherent cells up. By closing the top cover of the tube, the cells are automatically inverted. Immediately, the tube has to be plugged within the rotor circle from the inner to the outer side. By this means, the substrates with the adherent cells are vertically placed, and the cells face the outside of the rotor construction.
For the centrifugation assay, four independent wells out of a 24-well plate, including the substrate with a diameter of 8 mm and a culture medium, are required. The initial cell suspension is generated via trypsinization and collection from cells cultivated under any desired conditions, and seeded out into each prepared well with a density of about 2–6×10⁶ cells/mL. After a cultivation time of, for example, 5 h, similar to that performed in this study, one out of the four wells serves as the control for the determination of the adherent cell number before centrifugation. For that purpose, the adherent cells are trypsinized, collected, and counted. In case the substrate does not cover the entire well floor, it is recommended to transfer the substrate into a new well beforehand. This step has the advantage that no adherent cells apart from the substrate are counted, which would falsify the control cell density. About half of the initial seeded cell density attached to the substrate before centrifugation. The last three substrates are prepared for centrifugation in a similar manner to what has been just described. In this study, the samples are centrifuged for 5 min at room temperature, and each left substrate is centrifuged at different RCFs of 50, 250, and 500 g to determine a force dependency. After centrifugation, the microcentrifuge tubes are carefully opened, and the substrate is transferred into a new well. Here, the adherent cells are trypsinized, collected, and counted. To create the so-called detachment profile, the evaluated cell densities after centrifugation are normalized on the control cell number and given as average in percent. For statistical reasons, at least six independent measurements of all treatments have to be performed.
Quantification of adhesion time TAd and force FAd
Taking its origin from chemical kinetics, quantification of the adhesion and detachment profiles is classified by the first-order reaction. The key step of this kinetic process refers to a reaction rate called Adhesion Rate RAd, which can be integrated to determine the decrease of concentration of one reactant over a defined scale described by x (1).
For both methods, the concentration of the reactant is given by the cell number [cells/mL] (N). With regard to the adhesion profiles and quantification of TAd, N refers to the nonadherent cell density, and N0 refers to the cell density of the initial seeded cell suspension. With regard to the detachment profile and quantification of FAd, N characterizes the adherent cell density, and N0 characterizes the control density before centrifugation started. The factor x refers to either the time scale of TAd or the RCF of FAd. Afterward, the derivation of this formula enables the calculation of RAd (2).
With regard to the definition, TAd and FAd correlate with the half life and half force described by x of N0, respectively. Independent from the initial cell density, the beforehand determined Adhesion Rate
For statistical reasons, both parameters have to be presented as an average emerging from several repeated profiles for each treatment. Depending on the chosen cultivation time, the unit of TAd can be expressed in either minutes or hours. FAd is described by the unit g.
Confirmative analysis: proliferation, focal adhesion complexes, and ECM adsorption
With regard to the outside-in signaling of cell behavior, possible material influences on TAd and FAd have to correlate with similar changes in cell growth. For this purpose, the cell proliferation of fibroblasts and endothelial cells was examined in dependence of material wettability. After a cultivation time of 8, 24, 32, and 48 h, the adherent cells were trypsinized, collected, and centrifuged at 800 g for 5 min. The cell suspension was counted using the cell counter Casy TT (Roche). For a better comparison between the experiments, the cell density was normalized in percent on the seeding density at time 0 h (1.21×10⁶ to 4.68×10⁶cells/mL, respectively). The results are given as average±SEM for four independent experiments.
The formation of focal adhesion complexes were classified separately by the immunofluorescence of their components vinculin and focal adhesion kinase (FAK). After a cultivation time of 24 h on laminin- and fibronectin-coated slides, fibroblasts and endothelial cells were rinsed with PBS and fixed with 4% paraformaldehyde solved in PBS at 4°C for 20 min. After the 30 min incubation in the blocking buffer at 37°C, the slides were washed twice with PBS for 5 min each. Then, the corresponding primary antibody solution was added at 4°C over night. After two washing steps with PBS for 5 min each, the cells were incubated in the secondary antibody solution at 37°C for 1 h. Finally, the cells were washed again and kept in PBS. The images were recorded using a fluorescence microscope (Nikon TE 2000-E; Nikon) at an excitation light of 488 nm under standardized conditions. For quantification, ImageJ software (
To analyze the influences of material wettability on laminin and fibronectin adsorption, the enzyme-linked immunosorbent assay (ELISA) was performed. With regard to the control, a coating-concentration dependency (2, 5, 10, 15, 20, and 25 μg/cm2) was evaluated. For each sample, the relative fluorescence intensity, which is proportional to the amount of antibody binding, was determined as a function of ligand adsorption. Control glass slides, PEG, and silicone were coated with the ligands for 30 min at room temperature. After washing with PBS, the primary antibody solutions were added at 37°C for 1 h. After three washing steps with PBS for 5 min each, the secondary antibody solution was incubated at 37°C for 1 h. Before adding the substrate 4-methylumbelliferyl phosphate for 20 min at room temperature, the samples were washed twice with PBS for 5 min each. Finally, reaction supernatants were transferred to a black 96-well plate, and fluorescence (365 nm excitation/450 nm emission) was read using a multimode microplate reader Mithras LB 940 (Berthold Technologies). The background signal referred to treatment-specific progression without ligand coating and was subtracted from the corresponding intensities. For statistical reasons, the measurement was repeated six times±SEM.
Results
To demonstrate a large variety of possible applications of TAd and FAd measurements, different experimental setups were performed with regard to the cell type, cultivation time (1 or 5 h), culture medium (serum-including or serum-free), and substrate (glass, ECM-coated slides, and tissue-engineered materials with different wettabilities). Additional investigations such as proliferation, formation of focal adhesion complexes, and ECM adsorption confirm the effectiveness of TAd and FAd analysis and enable a more detailed understanding of cell adhesion mechanisms.
The kinetics of cell attachment: analysis of adhesion time TAd
Exemplarily, the adhesion profiles for fibroblasts and endothelial cells are shown in Figure 2. The demonstrated relative number of nonadherent cells of the cell suspension used decreases gradually—correlating with an increase of cell attachment. In this case, the cell adhesion of the suspension is an exponential process. The curve progression depends on the cell type and culture condition. Side effects such as cell death could be excluded due to the comparable cell number at the seeding time point and the control number of nonadherent and adherent cells at the final counting point (data not shown).
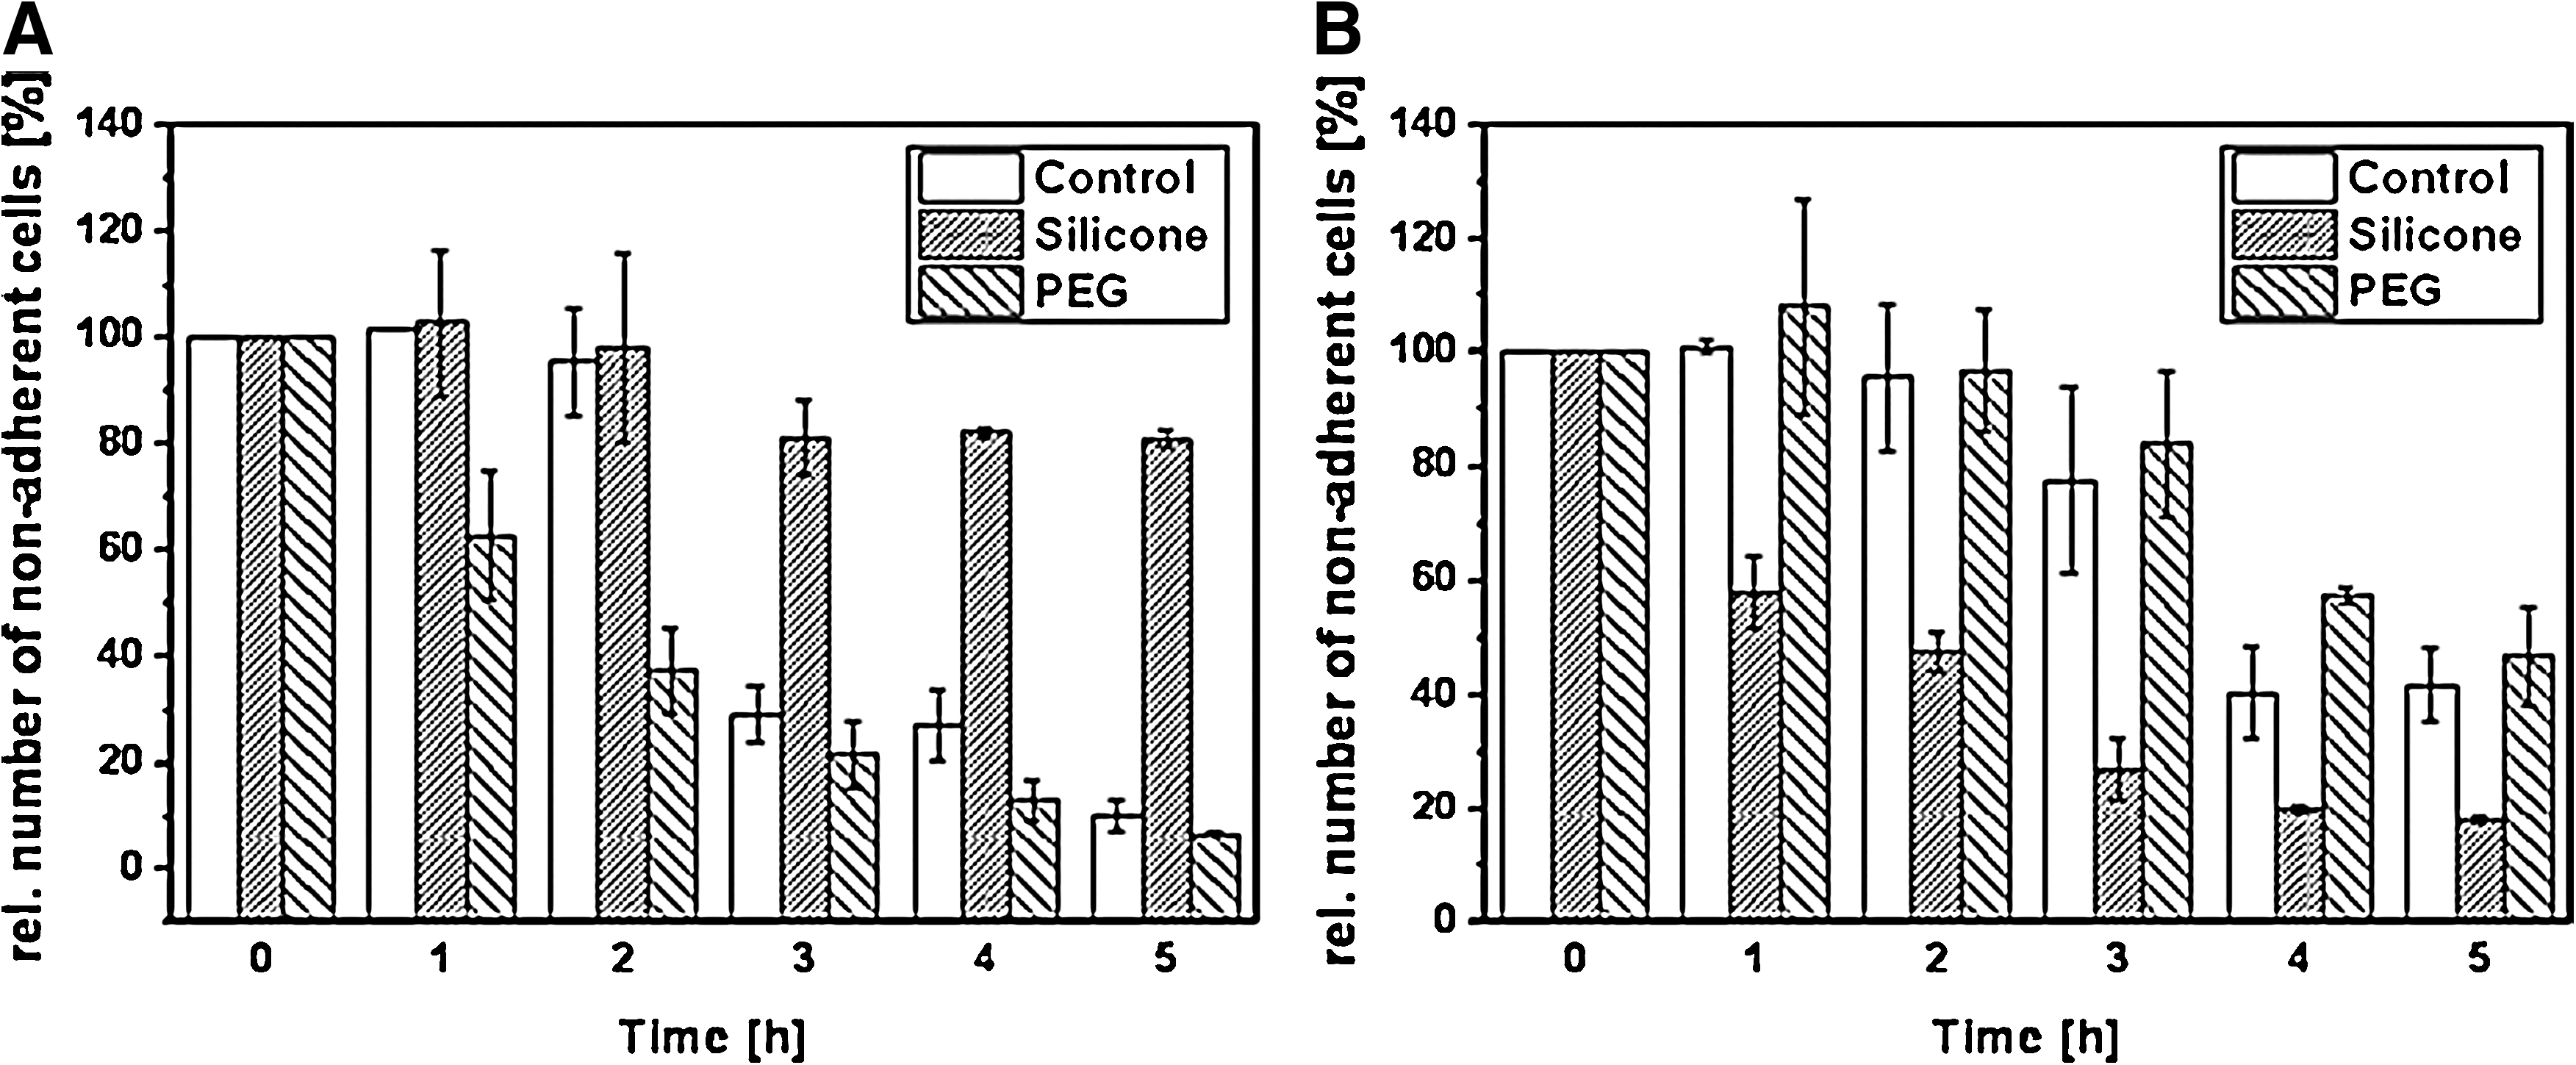
Adhesion profile. Adhesion profile exemplarily shown for
The TAd calculation is based on the adhesion profile characterized by the Adhesion Rate RAd, which refers to changes in the nonadherent cell numbers over the given time intervals. In the control treatment, differences between the cell types used can be found (Table 1A). Cancer cells such as neuroblastoma and HeLa cells adhered the fastest (TAd=1.44 and 2.01 h) followed by the cell lines fibroblasts and endothelial cells (TAd=2.52 and 4.11 h) and the stem cells ASC and MSC (TAd=4.73 and 13.75 h). Additionally, TAd was determined in dependence of ECM-coated substrates under serum-free conditions (Table 1B). In comparison to serum-containing medium (Table 1A), TAd was increased for fibroblasts and endothelial cells on the control to TAd=5.28 and 5.32 h. On fibronectin and laminin, both cell types significantly accelerated their adhesion kinetics to less than 1 h. Fibroblasts adhered faster on fibronectin than on laminin (TAd=0.32 and 0.43 h), whereas the effect was the opposite for endothelial cells (TAd=0.33 and 0.2 h). To demonstrate the application of TAd analysis for biomedical topics, the influence of material wettability was documented (Table 1B). Fibroblasts adhered faster on hydrophilic PEG than on hydrophobic silicone (TAd=1.34 and 16.34 h). This observation was the opposite for endothelial cells with TAd=5.01 h on PEG and TAd=2.02 h on silicone. These results are in agreement with the adhesion profiles presented in Figure 2.
The results are given as average [h]±SEM of four independent measurements.
ASC, adipose-derived stem cell; MSC, mesenchymal stem cell.
The results are given as average [h]±SEM of four independent measurements.
ECM, extracellular matrix.
The mechanics of cell attachment: analysis of adhesion force FAd
Exemplarily, the detachment profiles of fibroblasts and endothelial cells are shown in Figure 3. Already the profiles reveal differences in the detachment with regard to the applied force, cell type, and substrate.
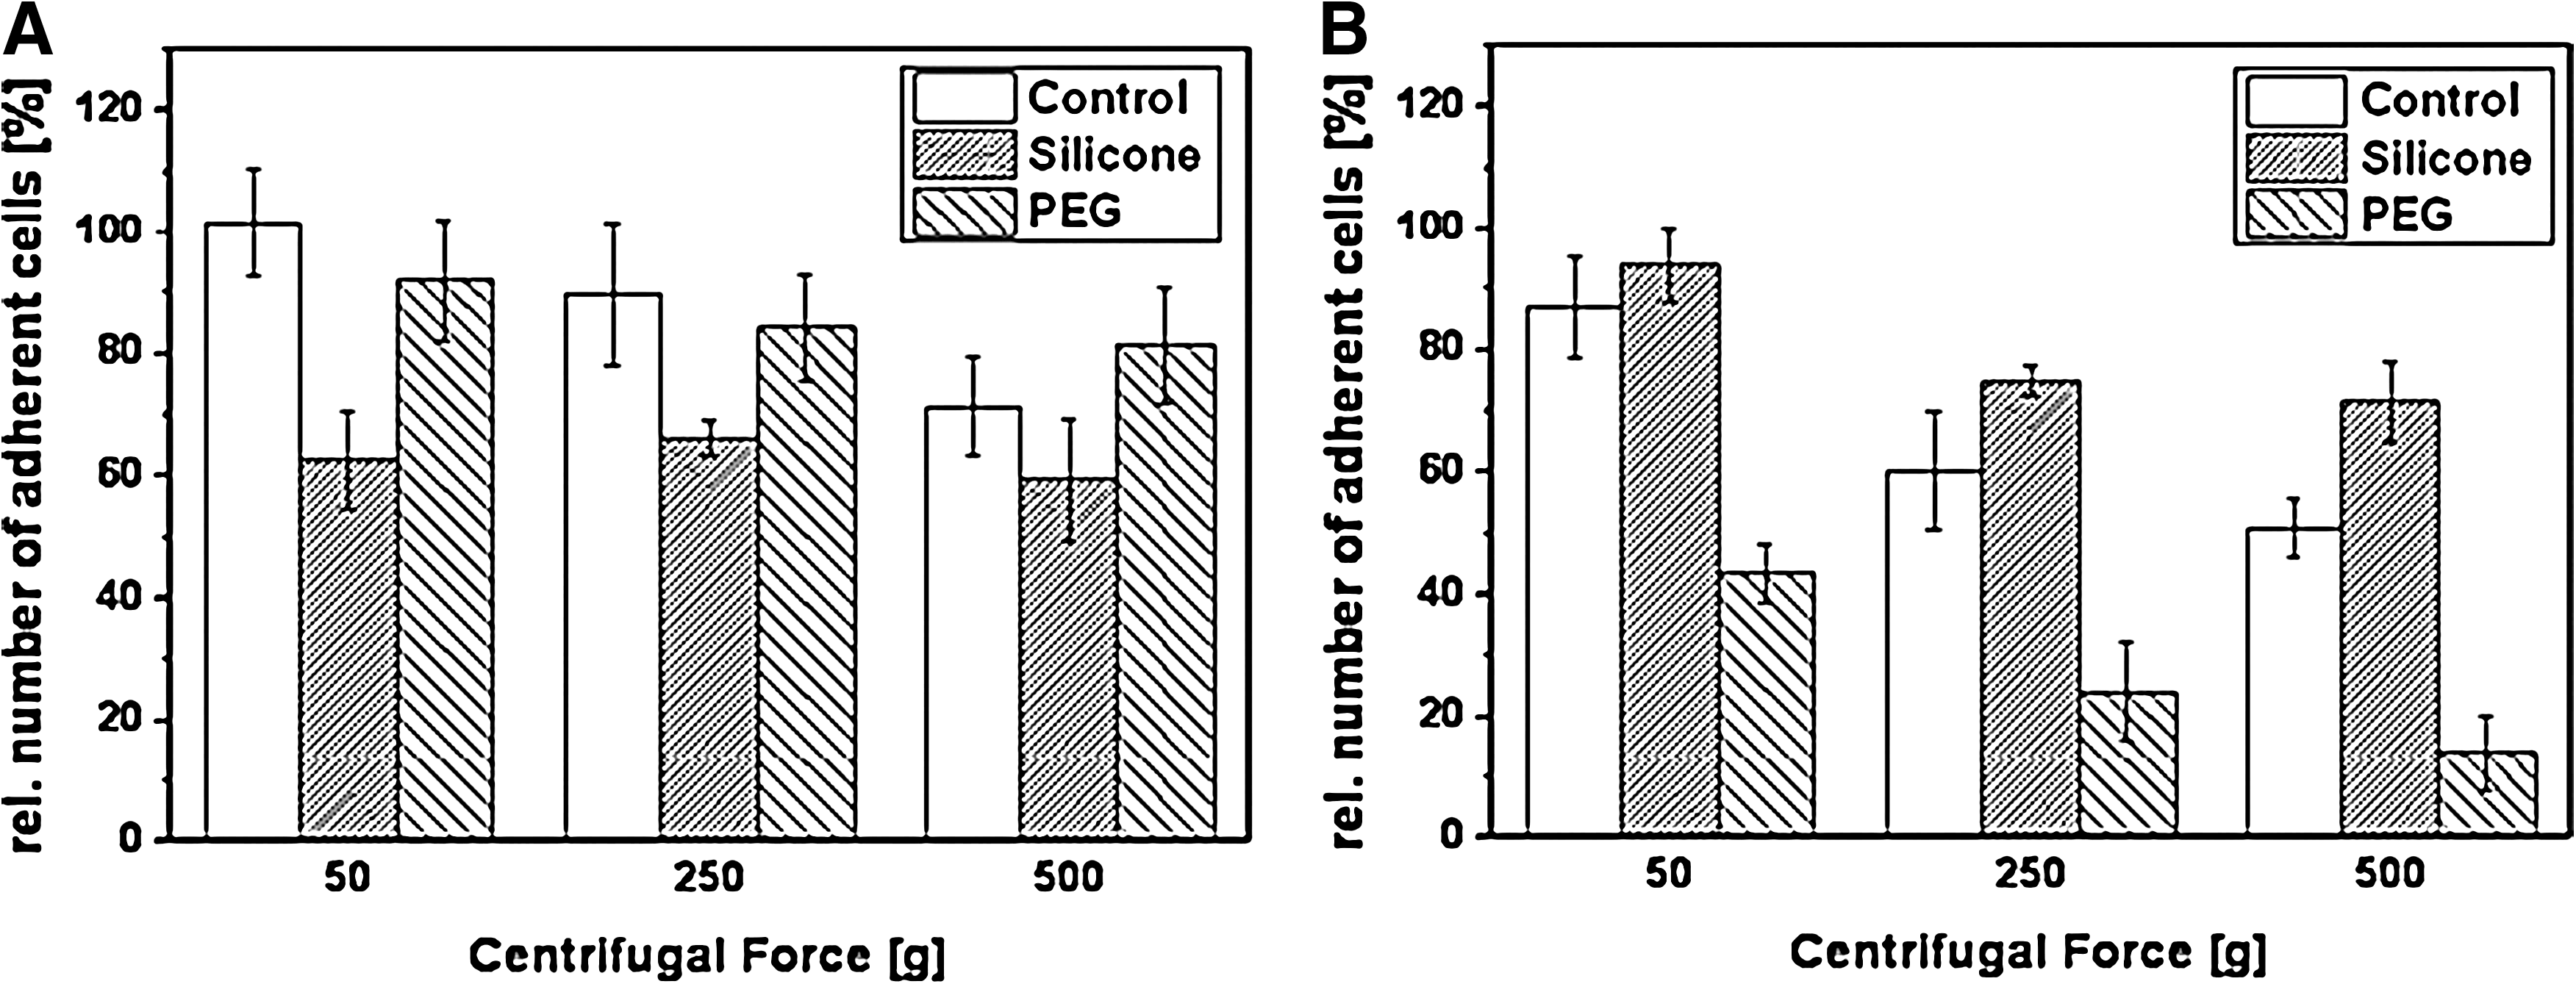
Detachment profile. Detachment profile exemplarily shown for
More insights into the results can be achieved by the exponential fit of the curve progression for each profile characterized by the Adhesion Rate RAd. The values for FAd that are presented in Table 2A are cell specific. In the control treatment, fibroblasts adhered the strongest (FAd=747.38 g) followed by endothelial cells and the cancer cells neuroblastoma and HeLa cells (FAd=448.51, 525.91, and 407.69 g). The stem cells MSC and ASC already detached at low forces of FAd=385.07 and 291.24 g. Under serum-free conditions, FAd for fibroblasts and endothelial cells is changed to 555.12 and 510.25 g, when cultivated on the control (Table 2B). Simultaneously, fibronectin and laminin affected FAd cell specifically. Fibroblasts adhered stronger on fibronectin than on laminin (FAd=698.13 and 273.27 g), whereas this was the opposite for endothelial cells (FAd=322.12 and 657.28 g). To demonstrate the biomedical application of this method, the influence of material wettability on FAd was analyzed (Table 2B). In accordance with the detachment profile (Fig. 3), fibroblasts adhered stronger on hydrophilic PEG than on hydrophobic silicone (FAd=832.35 and 484.15 g). On the contrary, endothelial cells adhered stronger on silicone than on PEG (FAd=766.73 and 136.66 g).
The results are presented as average [g]±SEM of six independent measurements.
The results are presented as average [g]±SEM of six independent measurements.
Changes in TAd and FAd are transferable in cell growth behavior
Due to the outside-in signaling cascades, material effects in dependence of their wettability on TAd and FAd can be controlled by the analysis of cell proliferation. Fibroblasts accelerated their growth rate from 251% on the control to 400% on PEG after 48 h. Simultaneously, proliferation was reduced to 175% in silicone (Fig. 4A). With regard to endothelial cells, this observation was the opposite: Silicone did not negatively affect growth and ranged between 360% and 400% after 48 h, whereas proliferation on PEG was reduced over time. After an initial increase in the cell density over 24 h, a final value of about 100% was reached (Fig. 4B).
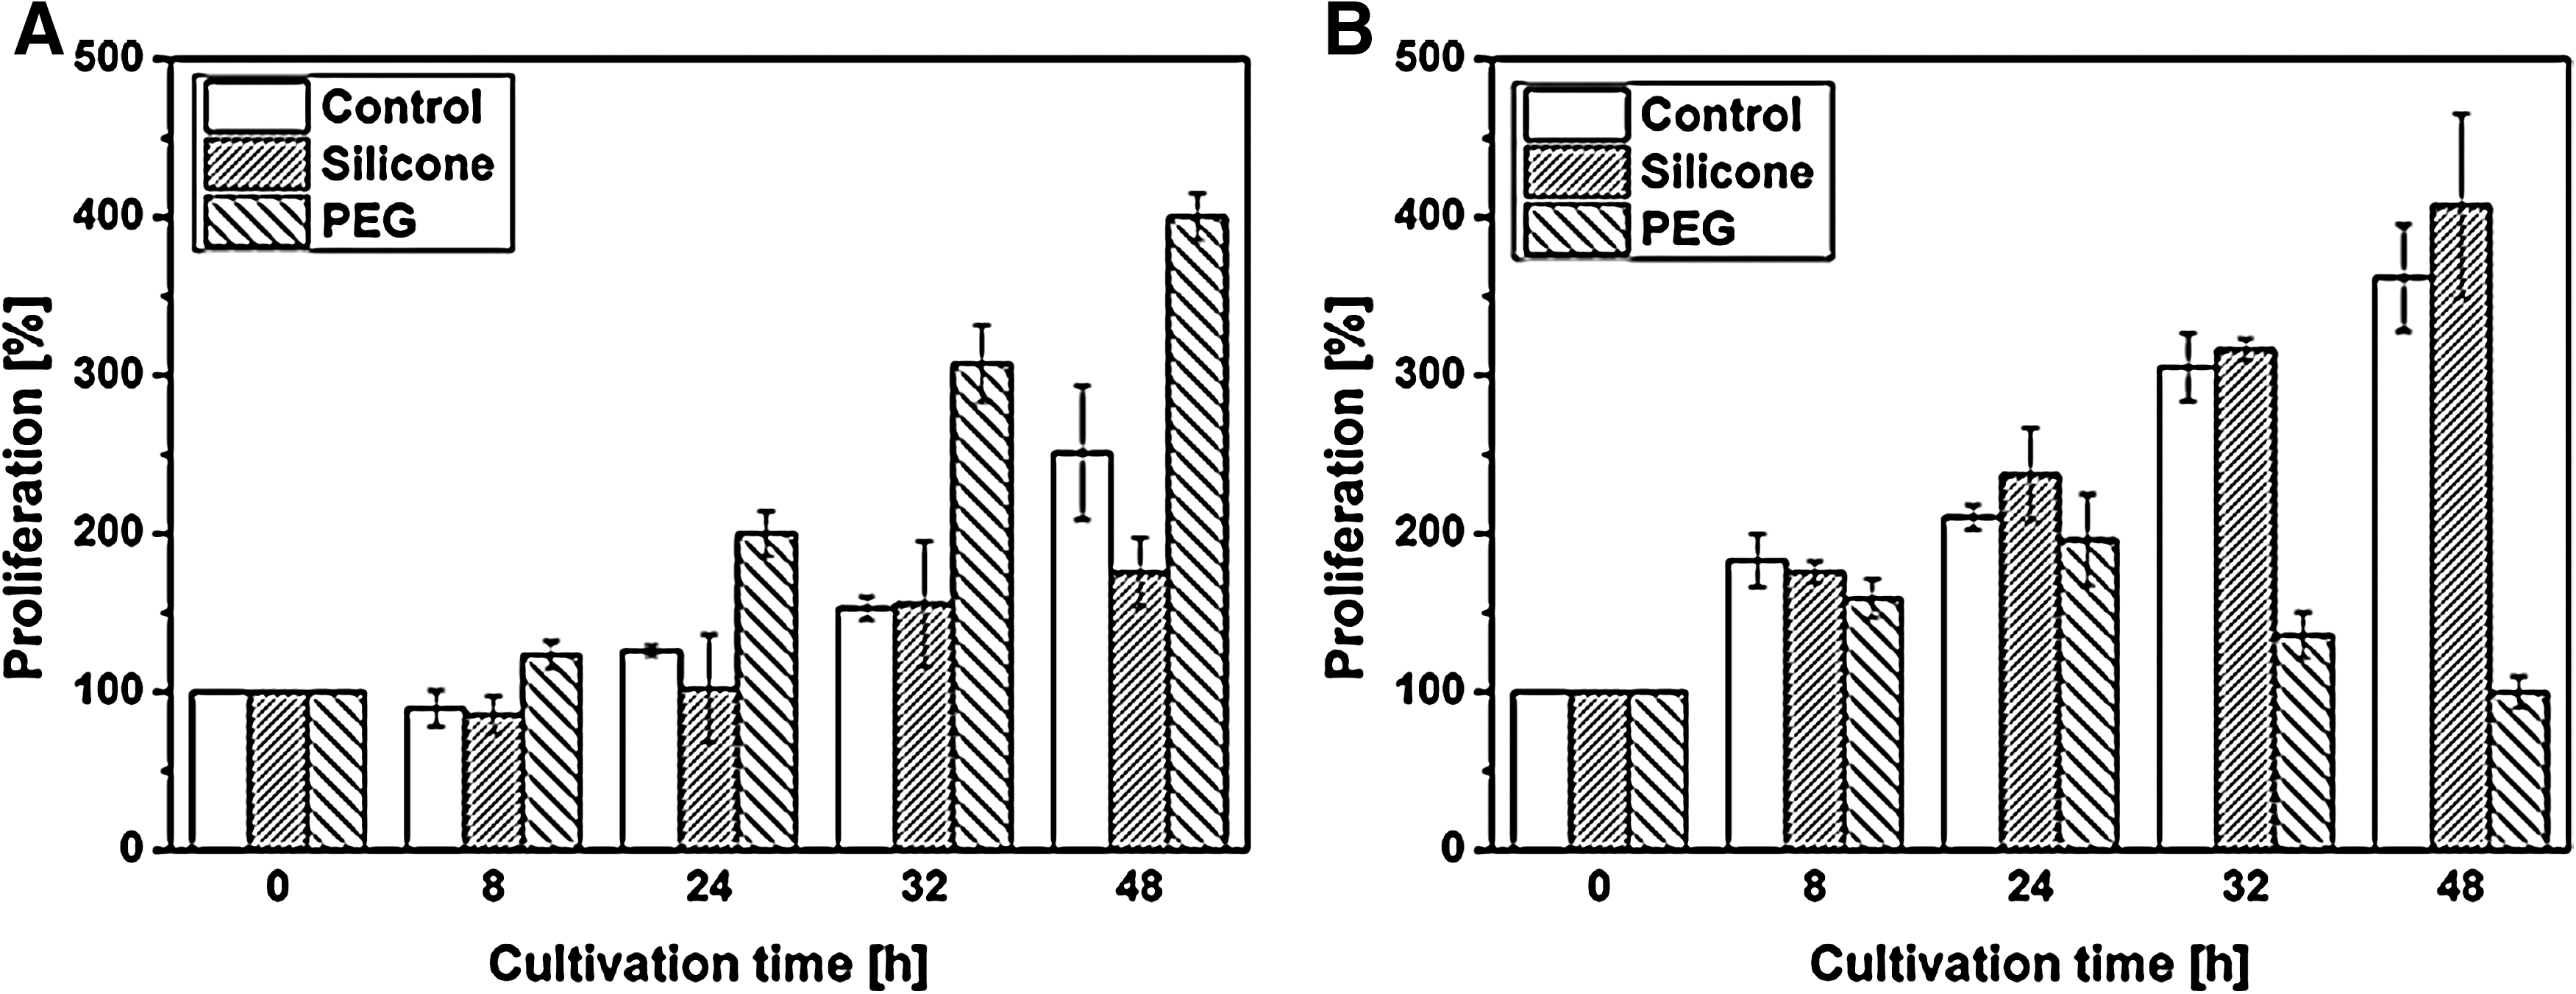
Cell proliferation in dependence of material wettability. Proliferation profiles of
The formation of focal adhesion complexes depends on the cell type and ECM component
Differences in the staining intensities of FAK p-Tyr397 and vinculin correlate with changes in the formation of focal contacts. As shown in Table 3, fibroblasts increased FAK p-Tyr397 and vinculin in both ligands when compared with the control with a relative fluorescence intensity of 13.52 and 52.44, respectively. This increase was most pronounced on fibronectin to 17.35 for FAK p-Tyr397 and 57.74 for vinculin. Reduced intensities of 11.42 for FAK p-Tyr397 and 42.61 for vinculin were measured on laminin. With regard to endothelial cells, the control intensity of 12.7 for FAK p-Tyr397 and 52.61 for vinculin was reduced to 7.38 and 21.33 on fibronectin, respectively. In the presence of laminin, a relative fluorescence intensity of 16.69 for FAK p-Tyr397 and 53.3 for vinculin was detected.
FAK p-Tyr397 and vinculin as a marker for focal adhesion complexes were stained by immunofluorescence and quantified by the mean fluorescence intensity of each cell body. The results are presented as average±SEM of about 50 cells of fibroblasts and endothelial cells in dependence of fibronectin and laminin after 24 h of cultivation time. FAK, focal adhesion kinase.
ECM adsorption correlates with material wettability
Fibronectin and laminin adsorption onto hydrophobic silicone and hydrophilic PEG were quantified by ELISA. The evaluated relative fluorescence intensity can be seen as a function of ligand concentration on the surface. In Figure 5 A, it is shown that fibronectin adsorption was reduced on silicone, but increased on PEG when compared with the control treatment. For instance, a fibronectin coating concentration of 2 μg/cm2 resulted in a relative fluorescence intensity of 670 on the control, of 117 on silicone, and of 1112 on PEG. On the contrary, laminin adsorption on silicone was improved, while on PEG, a reduced concentration was detected (Fig. 5B). Here, a 2 μg/cm2 coating concentration of laminin induced a relative fluorescence intensity of 899 in the control, of 3220 on silicone, and of 520 on PEG.
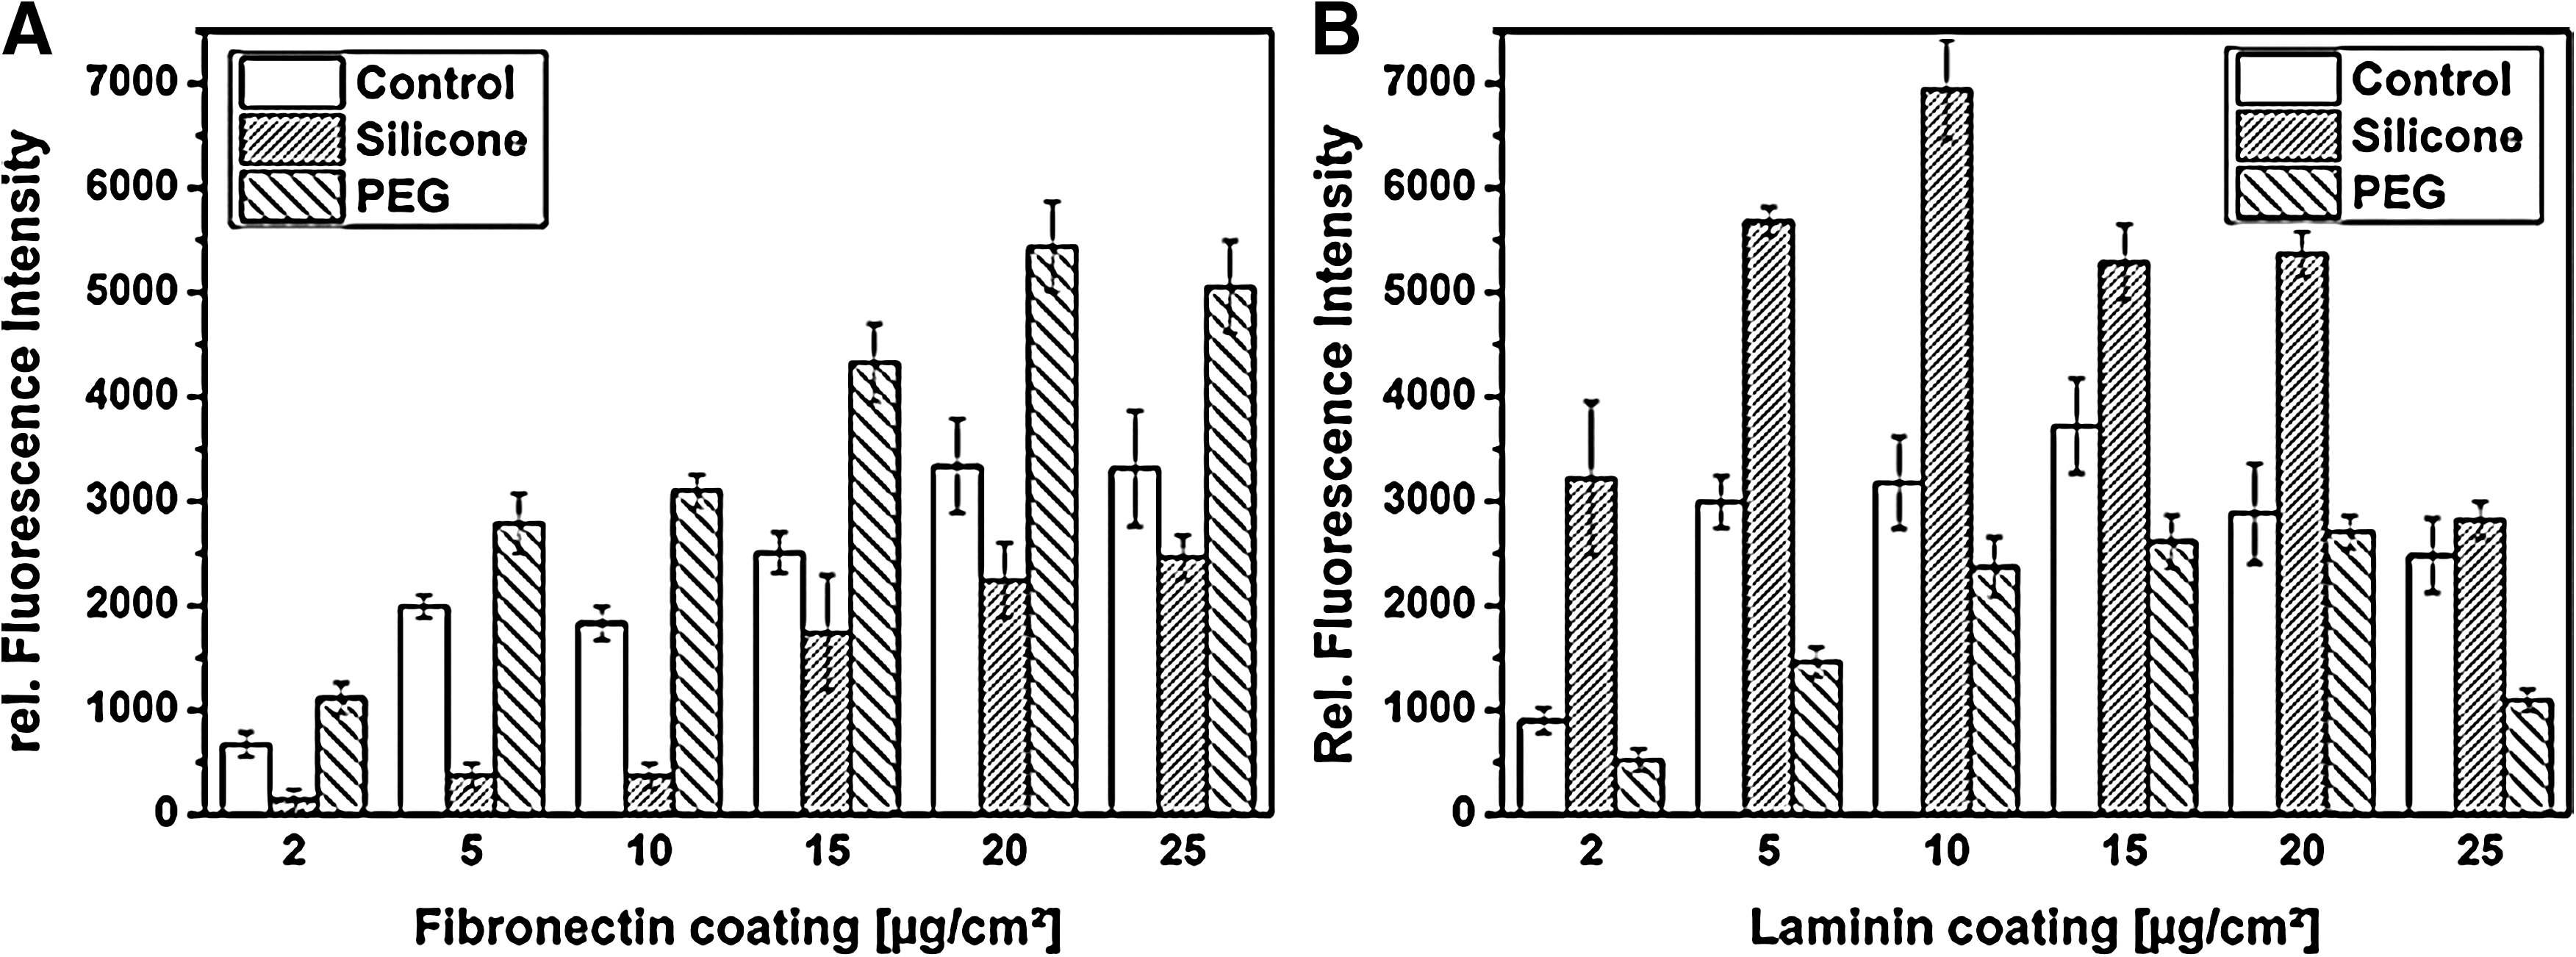
ECM adsorption in dependence of material wettability. Quantitative analysis of
Discussion
For a rational design of biomaterials or scaffolds, all parameters influencing tissue and cell functions have to be taken into account. In this connection, the analysis of cell attachment is the most pronounced, as cell behavior depends on signaling cascades initiated via adhesion. Thereby, adhesion ligands from the ECM, integrin receptors, and the formation of focal adhesion complexes have been identified as key factors promoting adhesive interaction with the surrounding environment.
However, conventional methods that study cell adhesion show several limitations due to their handling, sensitivity, reproducibility, flexible applicability with regard to the culture condition such as cell type, substrate, or medium, and complexity of adhesion processes in general. To overcome these problems, we present two novel and improved methodologies quantifying the kinetics and mechanics of the entire cell attachment process. Both procedures are simple to handle and can be established in any laboratory. The methods and added quantification given by the parameters Adhesion Time TAd and Force FAd are easy to follow, sensitive, and reproducible. We further demonstrate that the analysis of TAd and FAd can be applied to any adherent cell type such as cell lines, cancer and stem cells, culture condition (time and medium), and substrates (ECM and tissue-engineered materials). These benefits make both methods very attractive for all applications in tissue engineering, which address the analysis of biomaterial-cell interactions.
In comparison to previous studies, our experimental setups and quantifications of adhesion forces possess essential improvements: (a) in contrast to common angle or swing-out rotors, our novel rotor construction excludes lateral forces during FAd measurements, (b) by measuring TAd (Table 1)—to our knowledge, a novel method—we proved that the amount of adherent cells is not identical on different substrates and culture conditions; therefore cell detachment cannot be standardized.18–20
Due to the outside-in signaling events of cell adhesion, selective effects on TAd and FAd were also reflected in comparable influences on cell growth and documented for fibroblasts and endothelial cells (Fig. 4). Our proliferation results are in agreement with previous studies.23,24 Therefore, TAd and FAd are promising parameters needed to be considered for in vitro studies in general.
The question is in what manner the dynamics of cell adhesion can be explained. In the first place, cell attachment depends on the adsorption of adhesion ligands from the ECM to the substrate, followed by the binding with integrins and the formation of focal adhesion complexes. 2 Therefore, it can be concluded that cell-specific differences observed in TAd and FAd have to correlate with a cell-specific role of the ligands, which guides binding and functions. As shown in Tables 1B and 2B, the TAd and FAd of fibroblasts and endothelial cells depend on the presented ligand: fibroblasts prefer fibronectin, whereas endothelial cells prefer laminin. This indicates a cell-specific ligand priority ranking. Additionally, material-specific effects on ligand adsorption can be supposed, as fibroblasts prefer hydrophilic materials, whereas endothelial cells prefer hydrophobic materials (Tables 1B, 2B and Fig. 4).23,24 In the third place, before a cell can form adhesive forces, the cell has to attach. Therefore, adhesive forces can be considered a secondary step in adhesion kinetics.
With regard to this theory, TAd should be predominantly controlled by the adsorption of adhesion ligands. This is in accordance with the results shown in Table 1: Ligand-coated substrates accelerate the adhesion kinetics, as no ligand adsorption is necessary. Besides electrostatic interaction and Van der Waal forces, time dependencies and protein-surface distances are important aspects in ligand adsorption.6,25 The size and shape of the ligand further guide the interaction area, which also correlates with competitive adhesive proteins, substrate, and environment properties.9,11 Baujard–Lamotte et al. 26 reveal that the adsorption kinetics of ligands is independent of substrate chemistry. However, the achieved density, orientation, and conformation of the ligands are the key factors promoting cell binding. Focusing on the tissue-engineered materials, we documented that fibronectin reaches a higher density on hydrophilic PEG than on hydrophobic silicone, which was the opposite for laminin (Fig. 5). Other studies not only support these findings, but also emphasize the functions of ligand conformation with regard to material properties and cell binding, which were not analyzed in this study.4,23,26 Due to selective material effects on adhesion ligands and a cell-specific ligand priority ranking, it can be concluded that the adhesion kinetics of cells basically depends on ECM adsorption.
Integrin binding could be ignored in TAd analysis, which only concentrated on the nonadherent cell number, whereas explanation of FAd measurements requires a more detailed understanding of the adhesion mechanism. After ECM adsorption to the substrate, the adhesion ligands have to sustain a conformation that is capable of binding integrins. Especially the conformation of fibronectin was shown to be sensitive for its binding ability.4,23,26 Afterward, the ligand-integrin affinity is determined by its interaction rate, contact time, electrostatic and Van der Waal forces, binding formation rate, and binding life time.6,25,27 Furthermore, integrins require an activated condition, which depends on inside-out signaling cascades and cations. 28 In this connection, the expression level of integrins is less important due to a general constant density. 29 On the contrary, the ligand density and ligand-integrin distances are more pronounced.7,17,25 In Figure 5, we quantified a specific ligand adsorption in dependence of the substrate. However, the adhesive strength refers to the formation of focal adhesion complexes, including the recruitment of cytoskeletal molecules such as vinculin, which form an intracellular tension that minimizes cell-surface distances and, additionally, stabilizes and increases adhesive forces. 16 Both aspects were quantified with a focus on focal adhesion kinase p-Tyr397 (FAK) and vinculin. The degree of phosphorylation of FAK, a key component of the complex, was described with the aim of being linear to the amount of integrin binding. 4 As shown in Table 3, fibroblasts form more FAK p-Tyr397 and vinculin on fibronectin than on laminin in contrast to endothelial cells. These findings help explain the corresponding disparities in the FAd values due to the ligand priority ranking, selective material effects on ligand adsorption, and cell-specific differences caused by material wettability (Table 2 and Fig. 4). In a sum, the explanation of adhesive forces is more complex, as it depends on ECM adsorption, integrin binding, formation of focal adhesion complexes, and cytoskeletal stabilization.
Conclusions
The significance of cell adhesion in biological processes, and thereby the fundamental impact on diverse scientific fields such as tissue engineering, demands a detailed understanding of its mechanism. Therefore, innovative methodologies and quantification with regard to its entire dynamics, complexity, and diversity are required. The biophysical methods that are introduced here for determining Adhesion Time and Force are easy to handle and can be applied to any adherent cell type, substrate, and culture condition with a sensitive and reproducible quantification of TAd and FAd.
Footnotes
Acknowledgments
The authors would like to thank Prof. Dr. H. Küster, head of the Institute of Biophysics (Leibniz University of Hannover, Germany), for granting the use of a microplate reader and a fluorescence microscope. Thanks are also due to E. Fadeeva for preparing silicone elastomer and A. Koroleva for preparing PEG samples (Laser Zentrum Hannover e.V., Germany). M. Pflaum (Medical High School of Hannover, Germany) and A. Deiwick (Laser Zentrum Hannover e.V., Germany) provided human adipose-derived stem cells, and A. Deiwick, further mesenchymal stem cells. Dr. S. Schlie was partly supported by the European Graduate College “Interference and Quantum Applications.” The work was further supported by Cluster of Excellence Rebirth “From Regenerative Biology to Reconstructive Therapy” and the BMBF project REMEDIS.
Disclosure Statement
No competing financial interests exist.