
Abstract
Reconstructions of facial bone defects are one of the most challenging aspects in surgical treatment of malignant diseases, large facial traumata, or congenital anomalies. High-level reconstruction techniques are often associated with an elevated morbidity by the harvest of autologous bone grafts from the patient. Tissue engineering techniques may help to solve this problem. The aim of this study was to monitor metabolic processes during cellular colonization of matrices in vivo in an established rat model for endocultivation. After implantation of computer-designed hydroxyapatite scaffolds into the latissimus dorsi muscle of six rats, 100 μg bone morphogenetic protein-2 (BMP-2) was injected twice, in week 1 and 2, directly into the center of the matrices. The development of pH value and oxygen (O2) saturation inside the matrix was followed by fiber optic detection technique over 8 weeks and analyzed by variance analyses. Bone density measurements were performed by computed tomography as well as histological evaluations. Two weeks after implantation, oxygen supply and pH value measurements had decreased significantly. In the following weeks both parameters increased and stabilized on higher levels. This is the first study reporting a reproducible method to follow metabolic processes during heterotopic osteoinduction in vivo. It was shown that in the beginning of the study pH value and O2 saturation decreased and it took several weeks to regain physiological levels. This is an important step to further understand the physiological process of bone induction.
Introduction
Nowadays tissue engineering techniques aim to produce individually designed bone grafts in vivo or ex vivo. An important subdomain of bone engineering is the so-called endocultivation. Hereby, a matrix is implanted into a muscle followed by application of growth factors, which form new bone with an excellent blood supply. The proof of concept in patients has been successful. 6
In several studies the implanted matrices were treated with bone morphogenetic protein-2 (BMP-2) in order to enhance bone formation by differentiating resident mesenchymal stem cells into osteoblasts. New bone formation was proven and BMP-2 application remains important for the amount of new bone formed.7–11
A particular time at which cellular colonization inside the scaffold develops is unknown. Up to now there are no in vivo techniques available to monitor metabolic processes inside the matrices during bone induction. Important metabolic parameters are the pH value and oxygen supply. Bone density is an indirect parameter for progressing cellular colonization inside the matrices and can be checked using ionizing radiation (e.g., computed tomography).
The aim of this pilot study was to monitor the metabolism directly inside the matrix over the whole bone induction process in a validated rat model to gain knowledge of this complex sequence.
Materials and Methods
In the current study a total of six female Wistar rats (180–200 g, 3 months old) were used. The intervention was approved by the German Animal Welfare Act [Animal Experiment Permit: V312-72241.121-14 (12-1/11)]. The animals received food and water ad libitum and were housed in special cages with a night/day rhythm of 12 h.
Surgical procedure
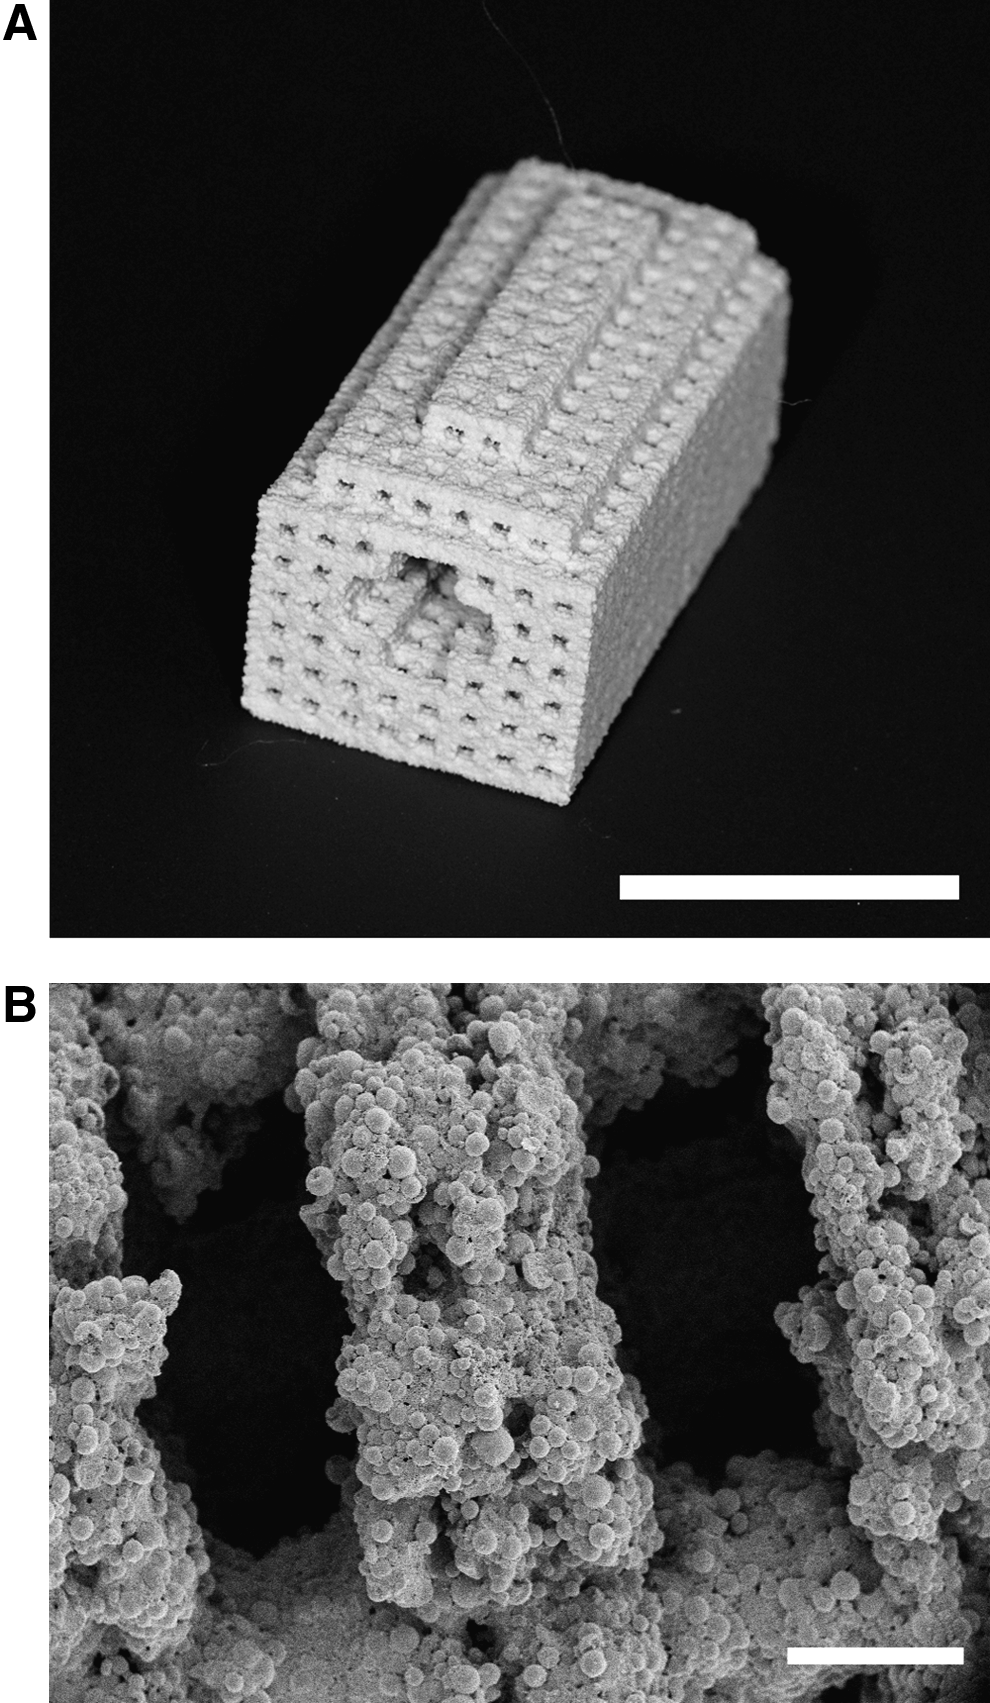
The operations of the animals as well as computed tomography or metabolic measurements were performed under general anesthesia using Ketamine (Ketavet®, 10%, Pfizer; 1 μL/g body weight, intraperitoneal) and Xylazine (Rompum®, 2%, Bayer Health Care; 0.6 μL/g body weight, intraperitoneal). After dermal incision on the back over the thoracic spine, a pouch onto the latissimus dorsi muscle was formed. A scaffold (Fig. 1) was placed into the pouch and the wound was closed with resorbable sutures (Vicryl®; Ethicon).7,12,13
Scaffold before implantation
The 3D structure of the blocks was designed computer aided and printed with a special 3D device. HA19 BioCer (Entwicklungs-GmbH) was used as raw material. An aqueous solution of dextrin (20 wt-%) and saccharose (2.5 wt-%) was used as printing binder. The 3D printed specimens were sintered for 2 h at 1250°C in a high-temperature furnace (Nabertherm) in ambient air.
Special features of the specimens are relatively large central channels and 3D networks of small pores. The external dimensions of the specimen were 12.75×12.75×24.75 mm. The bar width and a bar distance of the internal pore network was 0.75 mm each. To compensate sintering-induced shrinkage, all dimensions of the final specimens were precalculated for subsequent perfect fit. 13
One and 2 weeks after the implantation, 100 μg of recombinant human bone morphogenetic protein-2 (rhBMP-2) (InductOS®; Wyeth Pharmaceuticals) was applied into the central channel of the matrices with a syringe after measurements were performed (Fig. 2).
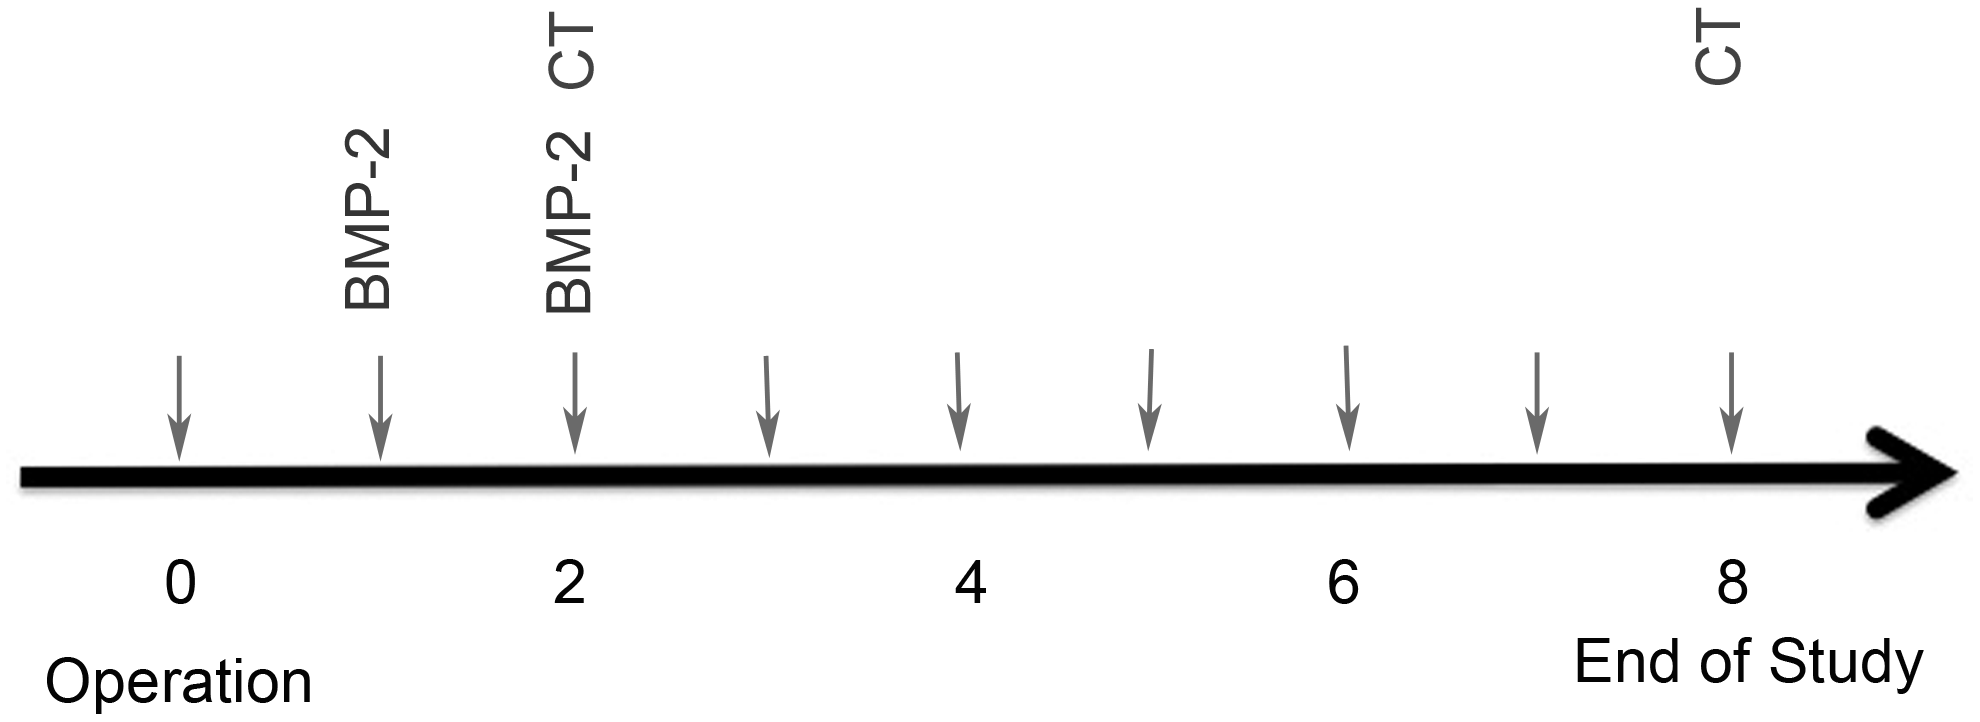
Chronological sequence of the study. Injections of bone morphogenetic protein-2 (BMP-2) were performed after measurements. CT, computed tomography.
pH value measurement
The central channel of the block was tapped weekly for metabolic measurements using a fiber optic detection device (pH-1 micro®; PreSens-Precision Sensing GmbH) (Fig. 3). The fiber optic detection device consists of needle with an inserted fiber optic sensor tip, which was linked to an illumination source. The optical fiber acts as a signal transducer with an immobilized indicator in a solid matrix. The device measures the luminescence decay time of the immobilized luminophore and uses a phase-modulation technique. The luminophore is exited with a sinusoidally intensity modulated light. So, a decay of time causes a time delay in the emitted light signal. The phase angle is shifted dependent on the analyte concentration.
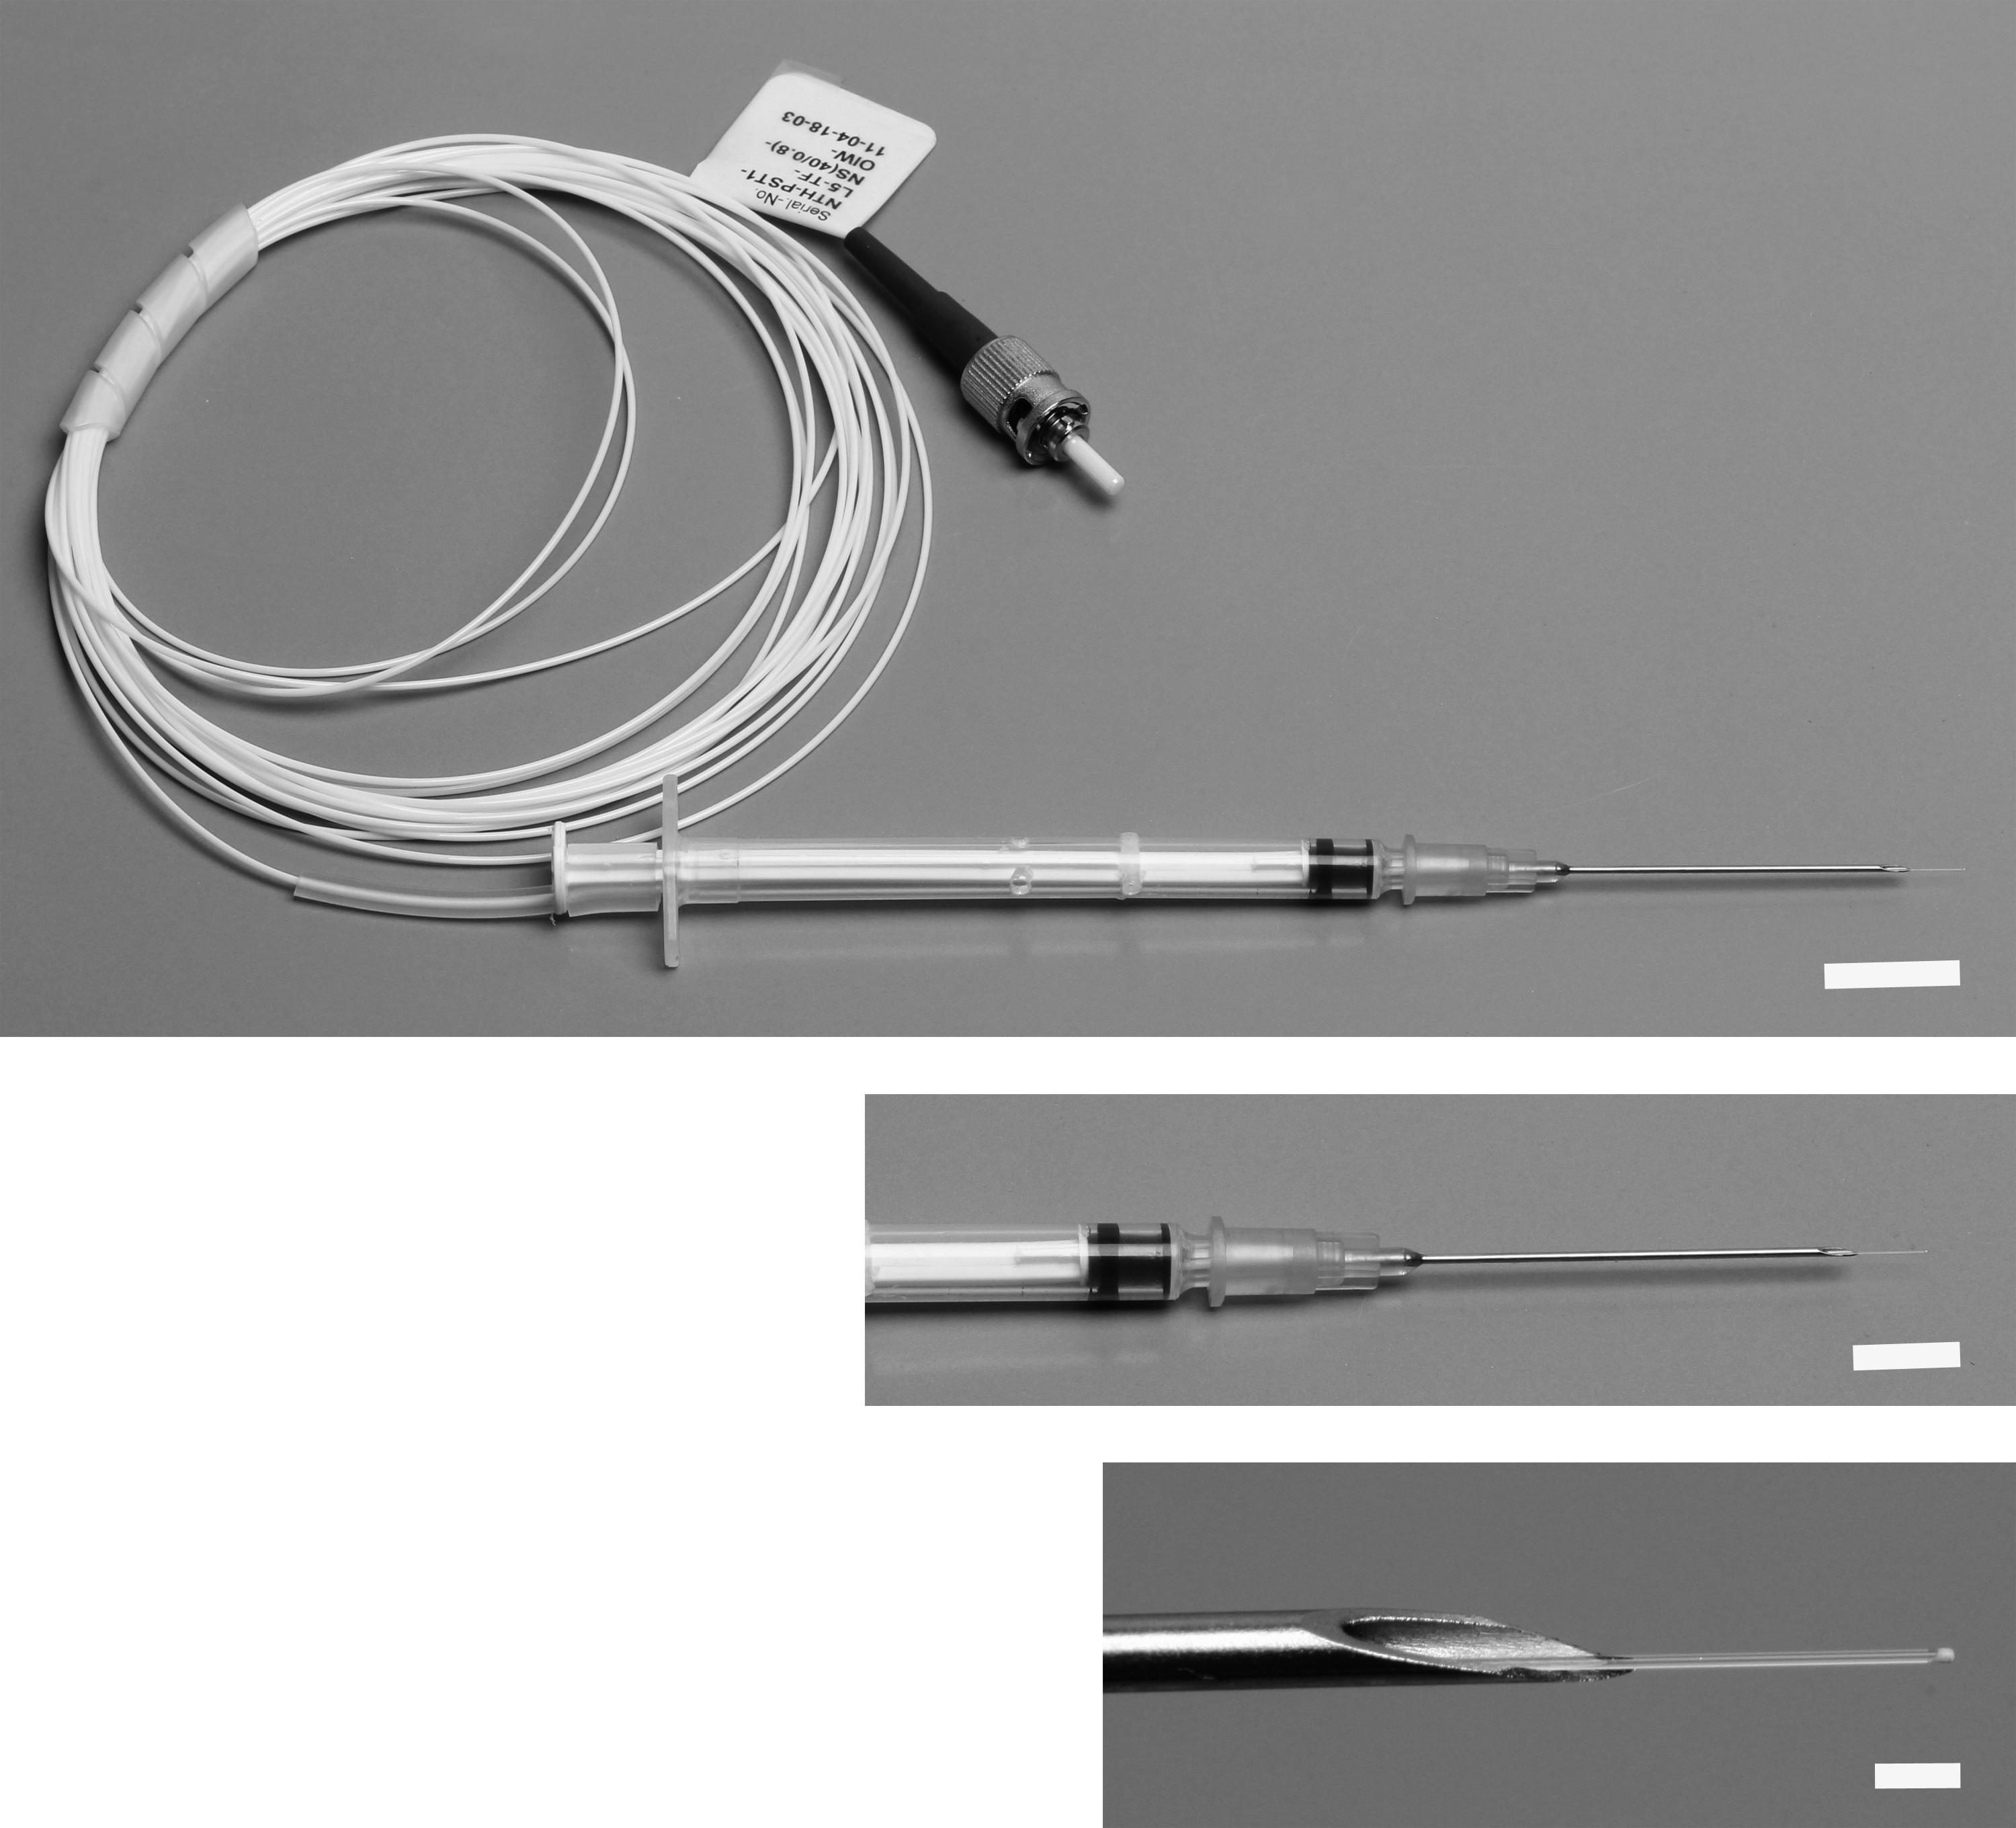
Fiber optic detection device with the indicator on the top. The scale bar corresponds to 2 cm in the upper photograph, 1 cm in the picture in the middle, and 1 mm in the lower picture.
The typical sensor has a dynamic range of pH 5.5–8, a resolution of pH 0.01, and a response time less than 30 s. Due to sensor bleaching, the senor tip has a drift of pH 0.03 per 1000 measuring points (sampling interval, 1 min). This speed of the process depends on the used light intensity and the duration of illumination. The sensors were precalibrated by the manufacturer.
Oxygen saturation measurement
The development of oxygen (O2) saturation levels was determined weekly by computer-based one-channel oxymetry (Microx TX3®; PreSens-Precision Sensing GmbH) with a 140 μm glass fiber.
A collision between analyte and immobilized luminophore leads to transmission of energy from the luminophore to the analyte, which induces an excitation state. The change of emitted light is measured as consequence of the reduction of luminescence.14–16
Unlike electrodes, optical sensors do not consume oxygen. The optimal measuring range of the oxygen-sensitive microsensors is from 0% to 50% pure oxygen (250% air saturation). The O2 sensor has an accuracy of±0.1% O2 within 30 days (sampling interval, 1 min). The limit of detection of this sensor is 0.2% air saturation. The sensor has a response time around 30 s. The manufacturer performed the calibration of the device. The oxygen-sensitive material may be subjected to photodecomposition resulting in a signal drift. To prevent this, after each measurement day, the sensor tip was changed.
Complications
One animal died under general anesthesia after implantation. No other complications like local infections could be observed during the study.
Computed tomography examinations
In the beginning and at the end of the observation period, the animals underwent computed tomography (Somatom®, Siemens AG; 120 kV, 210 mAs, 46.82 mGys) examinations under general anesthesia. A radiologist in the simple blind technique performed the bone density measurements. Bone density was measured in Hounsfield Units (HU) and describes the density in different tissues to a reference object in computed tomography.
Sample preparation
At the end of the study the animals were sacrificed by carbondioxide (CO2) insufflation and the blocks were explanted. For histological examination the blocks were divided into two pieces and prepared for embedding in wax or methyl methacrylate after dehydration in graded series of alcohol solution as previously described.7,13
Specimens were ground to 100 μm for microradiography and were further reduced to 8 μm for Toluidine staining. Masson-Goldner staining and hematoxylin and eosin (H&E) staining were performed on 4 μm sections. Protocols for histological staining and microradiography were adopted from earlier studies.7,13 Light microscopy (Carl Zeiss) and microphotography (Microphot-FXA; Nikon) were performed at a magnification of 2 and in detail at a magnification of 10.
Statistical evaluations
According to the manufacturer's instructions, the measurement data after 30 s were included and the 10 neighboring values of the median for each time point were evaluated.
O2 saturation and pH values were analyzed with analysis of variances with the factors time point (weeks after implantation) and animal as random effect. The least square means were calculated and presented in figures. For expected values, the corresponding 95% confidence interval (CI) was computed. To consolidate these results post hoc testing with Tukey HSD was done.
Results
Measurement of pH value and O2 saturation
Measurements were obtained 8 weeks after operation (Fig. 4). After scaffold implantation the least square mean of pH value and 95% CI was calculated with 6.83 (upper 95% CI: 6.88; lower 95% CI: 6.78). After a significant decrease at week 1 (least square mean: 6.43; upper 95% CI: 6.48; lower 95% CI: 6.37) a steady increase could be observed from week 2 after implantation (least square mean: 6.61; upper 95% CI: 6.66; lower 95% CI: 6.56). A decrease of the pH value could be detected 4 weeks after implantation (least square mean: 6.55; upper 95% CI: 6.61; lower 95% CI: 6.5). Five weeks after scaffold implantation pH values increased again (least square mean: 6.72; upper 95% CI: 6.77; lower 95% CI: 6.66) until 6.75 in week 7 (upper 95% CI: 6.81; lower 95% CI: 6.7) and 6.79 in week 8 (upper 95% CI: 6.85; lower 95% CI: 6.74). In post hoc testing pH levels changed significantly over time (Table 1).
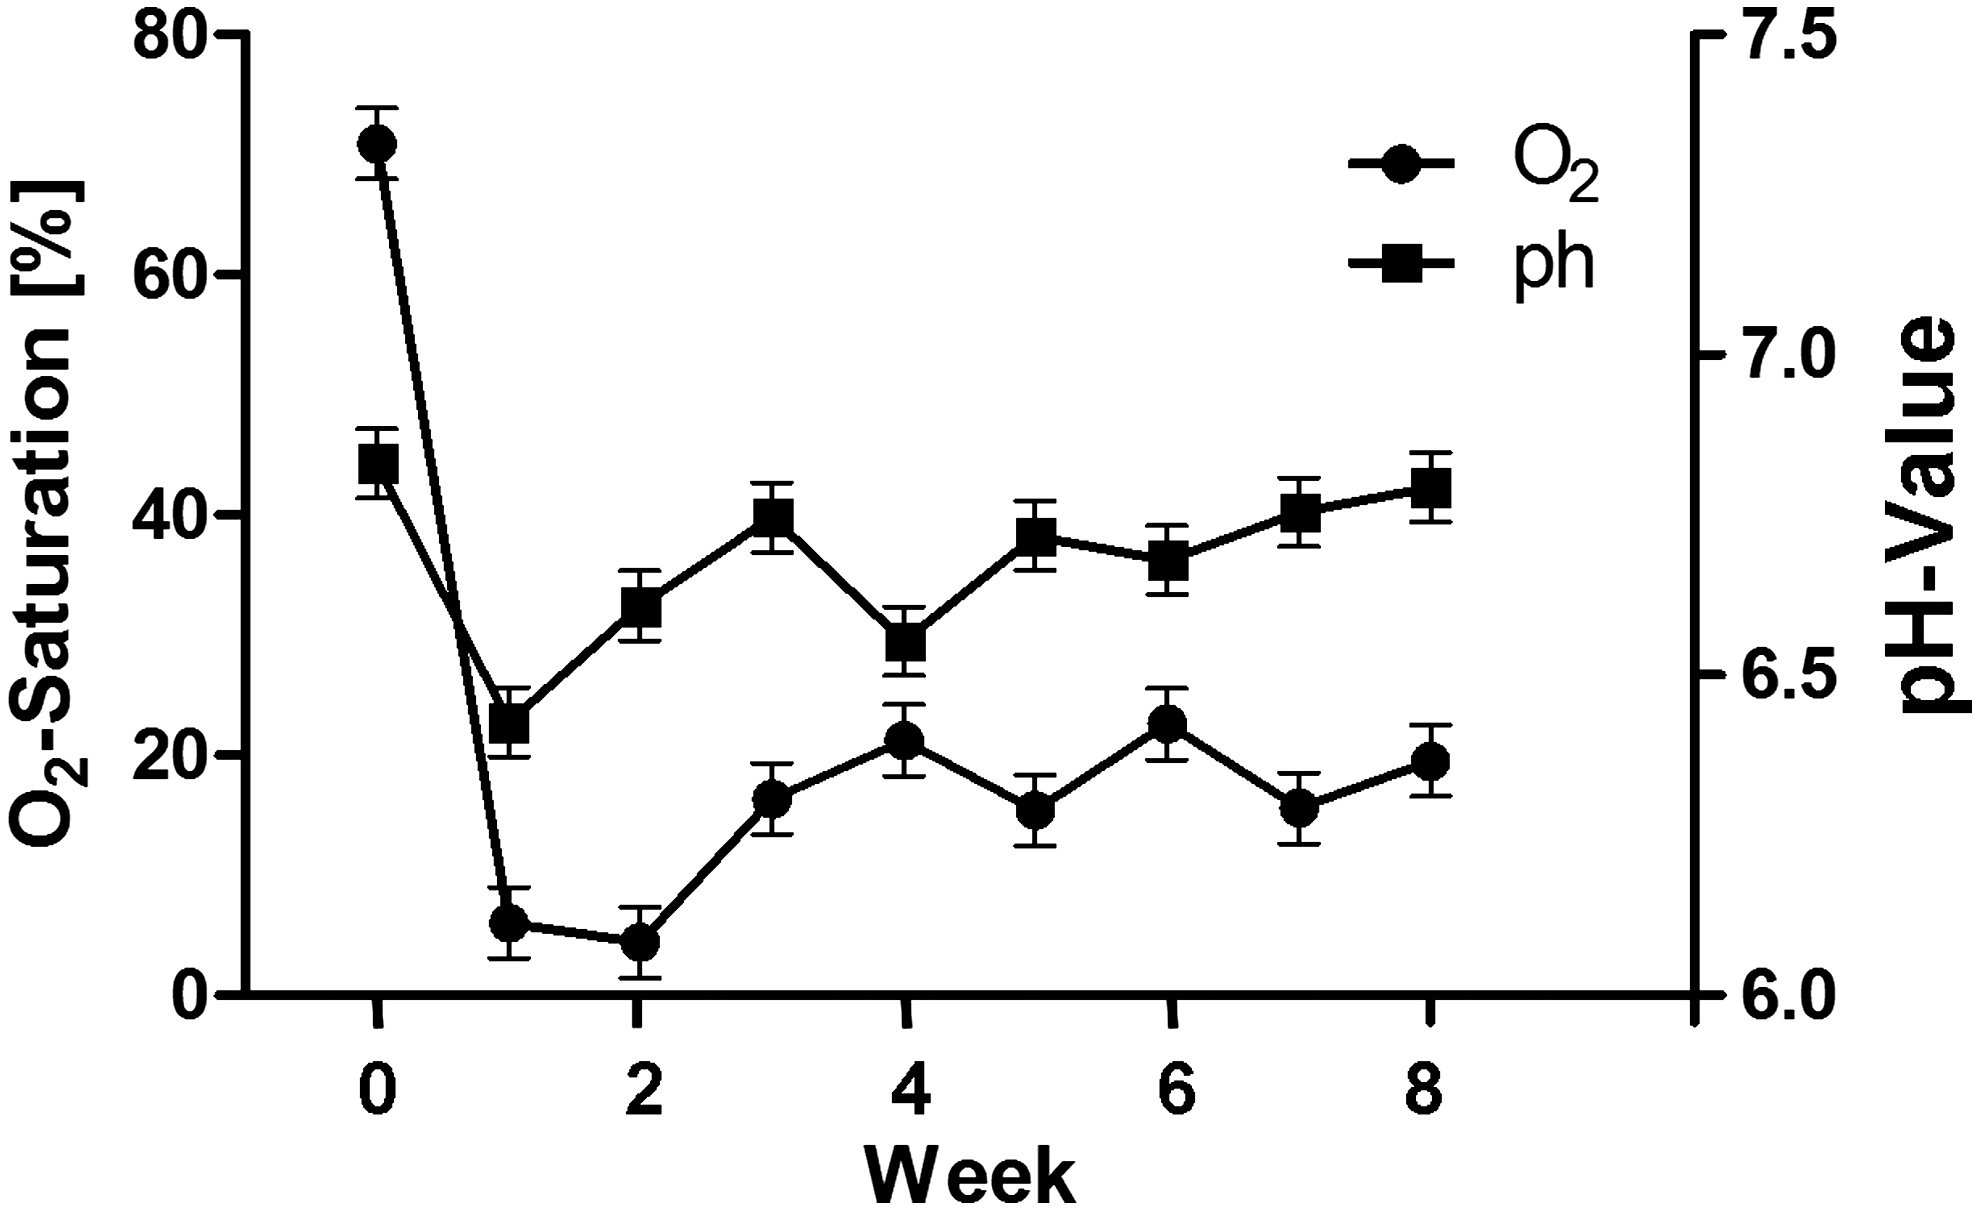
Course of pH value inside the matrices for 8 weeks shows a decrease in week 2 returning to physiological levels in week 6. Oxygen levels over the observation period had a decrease at 1 and 2 weeks after implantation and increased afterward.
Note the differences especially in the beginning of the bone induction process.
CI, confidence interval; HSD, Honestly Significant Difference.
The course of the curve for O2 saturation measurements was closely correlated to the values from pH value levels with a period of significant decrease at the beginning of the observation period (least square mean: 4.42%; upper 95% CI: 7.39%; lower 95% CI: 1.45%). Three and 4 weeks after scaffold implantation an increase could be observed (week 3: least square mean: 16.37%; upper 95% CI: 19.34%; lower 95% CI: 13.41%; week 4: least square mean: 21.25%; upper 95% CI: 24.22%; lower 95% CI: 18.28%). Measurements from the fifth to the eighth week revealed local oxygen supply between 15% and 22% (Fig. 4). Oxygen levels changed significantly over time (Table 2).
More similar ones were detected at the end of the observation period.
Bone density evaluation
Computed tomography showed new bone formation and increases of bone density in the samples. The highest amount of new mineralization was 74.4 HU. The mean increase was 40.2 HU and the median was 60.6 HU.
Microradiography and histology
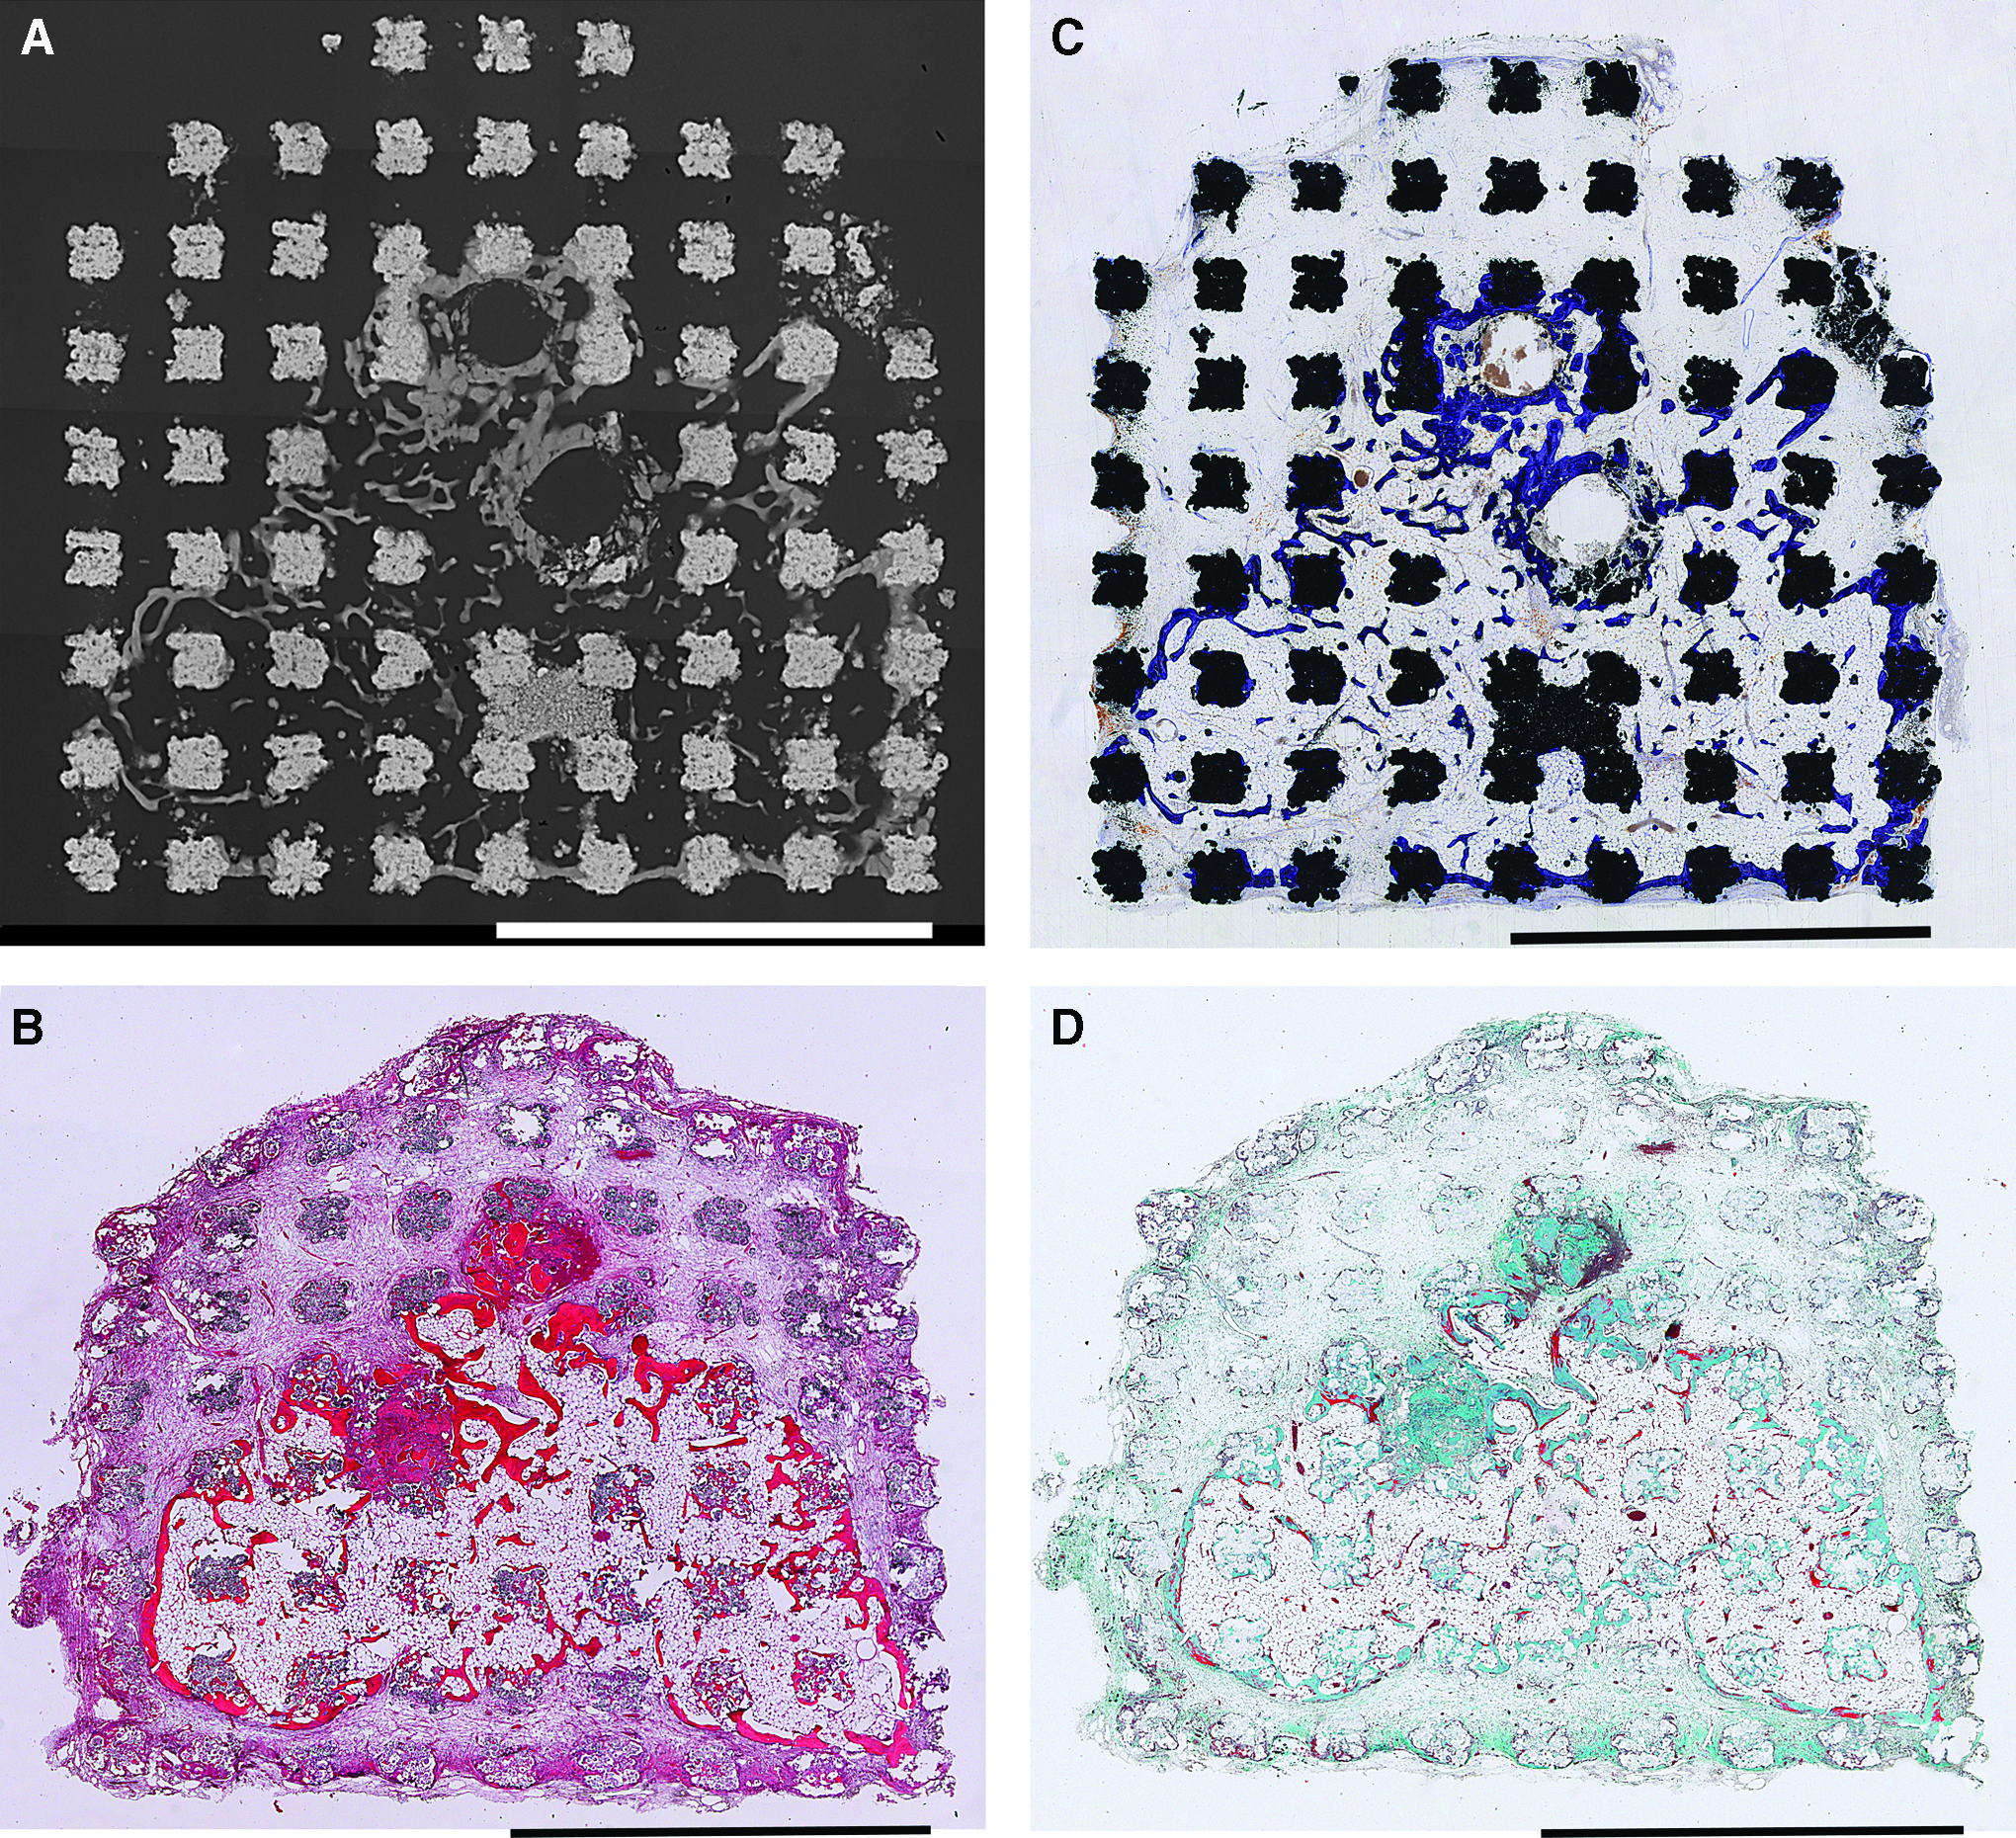
At the end of the study bone formation inside the scaffold could be observed over the whole sections starting homogenously around the central channel on the microradiographies (Fig. 5A) and in Toluidine staining (Fig. 5C). In some microradiographies the injection site seemed to be the center of cylindrical new bone formation. H&E staining did not reveal any evidence for inflammatory processes inside or around the scaffold (Fig. 5B).
Microradiography
Discussion
The basic idea of endocultivation is to use the individual as a bioreactor for creating new bone inside a muscle by implanting a 3D scaffold and growth factors.6,7 Only little knowledge is available about the development of the cellular colonization inside the scaffold or how it is integrated into the individual's metabolism during heterotopic bone induction. This is one of the most important aspects for cultivating reliably a clinically relevant amount of bone. In the current study an established rat model for endocultivation was used. Bone induction was enhanced by application of rhBMP-2 twice in the beginning of the study. Weekly measurements were performed in order to obtain information about the development of pH values and O2 saturation in the center of the scaffolds. To our knowledge this is the first study that directly analyzes metabolic parameters inside a living body during heterotopic bone induction.
After implantation of the scaffold, soft tissue attached to the scaffold's surface and cellular colonization begins peripherally 17 while a hematoma develops in the center of the blocks. At first the cells subsist on diffusion and proliferate well. With an increasing number of cell diffusing, adequate supply of oxygen or glucose becomes more difficult.
A distance between cellular layers and capillaries should not exceed more than 200–500 μm to ensure the supply of nutrients and oxygen and elimination of cellular waste.17–20
After consumption of locally available nutrients, oxygen levels and pH value decreased significantly because of anaerobic metabolism and accumulation of acidic metabolites. This seems to be reflected by the values measured after 2 weeks. Moreover, a cell colonization in the periphery induces an additional decrease of available oxygen and nutrients in central areas. 20 Further, it can be assumed that a decrease of O2 saturation and pH value maybe associated with a growing cell population, which is in accordance to findings in 3D cell culture systems using the same measurement devices in a 3D tantalum scaffold. 21 This may explain the increase of oxygen and pH values after 2 weeks till the end of the observation period. Other in vitro studies showed that hypoxia induces proliferation of osteoblasts and induces neoangiogenesis22–24 but differentiation was suppressed, 25 whereas an excess of oxygen leads to enhanced differentiation.24,26
Reduced oxygen levels might even enhance cellular colonization within the first week and induce neovascularization by capillary growth. We presume that the matrix was colonized by cells step wisely.
After the observation period, cells, soft tissue, and capillaries could be observed in all compartments of the scaffold in the histological examinations. This development was reflected by the increasing values in the current study. Computed tomography showed an increase of bone density and microradiography as well as Toluidine staining proved new bone formation inside the matrices.
Bone was found in the scaffold's center where application of BMP-2 was performed 1 and 2 weeks after scaffold implantation. It is likely that ossification started in the center where localized stem cells differentiated into osteoblasts after injection of BMP-2.
The pH and O2 measurements were carried out using fiber optic probes. The chemical optical measuring principle has the advantage that no chemical reaction is necessary. Hence, the tissue is not manipulated by the measurements. Further, the fiber optic probes are very thin and can be guided through a needle. Therefore, the probes can be applied within the tissue with minimal injury. Both probes are cleansable with ethanol. This means that they can be sterilized before usage.
The measurement accuracy of the pH sensor is±0.01 pH and the drift is smaller than 0.05 pH/day (sampling interval, 1 min). The O2 sensor has an accuracy of±0.1% O2 within 30 days (sampling interval, 1 min). The experimental setup described here ensures that errors caused by drift can be neglected. The probes are working in a temperature range from 5°C to 50°C. For the reasons just outlined, the sensors are well suited for in vivo measurements.
Fiber optic detection devices are a common measuring procedure in vitro. 21 The current study describes for the first time how to measure oxygen supply and pH value in a living body. Different from cell cultures where the device is fixed in a reproducible position, the needle had to be inserted into the center of the scaffold for each measurement procedure. In comparison to in vitro observations, an identical replacement was impossible. But in this case it seemed acceptable to reduce the area of measurements in the region of main interest.
For this experiment the low-range fiber glasses were not encapsulated. Therefore, the aditus had to be prepared with a needle containing the device inside. The tip was rather fragile. Angled ways toward the measuring point could not be realized. Every injection contained the risk of hematoma formation and inflammation, which may alter the bone induction process. Histology revealed no sign of local infection. Oxygen was measured within a radius of 250 μm around the probe tip, whereas the pH value was determined on the surface of the fiber optic detection device. Only small sections of the block could be analyzed this way. But as mentioned previously the measurements were performed in the region of main interest in the center of the scaffold. Further studies may increase the places where measurements were done.
Oxygen and pH value are indirect parameters for cellular ingrowth. Thereby histological examinations at different time points to evaluate vascularization could be avoided.
As the main focus of this article concentrates on metabolic changes from cellular colonization within the block and not on bone induction, we used a well-established model without control group (no BMP). Other studies with this model have revealed predictable bone induction within 8 weeks with the BMP concentration applied.7,13
Conclusions
In summary this is the first study reporting a reproducible method to follow metabolic processes during heterotopic osteoinduction in vivo. We could show that in the beginning of the study pH value and O2 saturation decreased thereby probably complicating cell colonization in the scaffold. Starting from week 2 both parameters steadily increased to physiological levels indicating vascularization.
This is an important base for further studies helping to better understand the process of cellular colonization in bone induction.
Footnotes
Acknowledgment
The authors would like to thank Gabriele Neßenius for her excellent work for preparing the histological examinations.
Disclosure Statement
The authors negate any conflict of interest.