
Abstract
Mesenchymal stem cells (MSCs) are an attractive cell source for tissue engineering applications due to their multipotentiality and increased expansion potential compared to mature cells. However, the full potential of MSCs for cellular therapies is not realised, due, in part, to premature proliferative senescence and impaired differentiation capacity following expansion under 20% oxygen. Bone marrow MSCs reside under reduced oxygen levels (4%–7% oxygen), thus this study investigates the effects of uninterrupted physiological oxygen tensions (2%, 5%) on MSC expansion and subsequent differentiation. Expansion potential was evaluated from colony formation efficiency, population-doubling rates, and cellular senescence. Colony formation was significantly reduced under 5% oxygen compared to 2% and 20% oxygen. Population-doubling time was initially shorter with 20% oxygen, but subsequently no significant differences in doubling time were detected between the oxygen conditions. MSCs expanded with 20% oxygen contained a greater proportion of senescent cells than those under physiological oxygen levels, indicated by a three to fourfold increase in β-galactosidase staining. This may be related to the approximately twofold enhanced mitochondrial oxygen consumption under this culture condition. Chondrogenic differentiation was achieved following expansion at each oxygen condition. However, osteogenesis was only achieved for cells expanded and differentiated at 20% oxygen, indicated by alkaline phosphatase activity and alizarin red staining. These studies demonstrate that uninterrupted hypoxia may enhance long-term MSC expansion, but results in a population with impaired osteogenic differentiation potential. Thus, novel differentiation conditions are required to enable differentiation to nonchondrogenic lineages using hypoxia-cultured MSCs.
Introduction
Recent studies have shown that the expansion of MSCs under hypoxia or normoxia (20% oxygen) influences MSC proliferation, senescence, and differentiation.3,5,6 While greater rates of proliferation have been reported under normoxic conditions during the early stages in culture, normoxic MSCs undergo fewer total population doubling compared to hypoxic MSCs due to the induction of premature senescence.7–10 These effects are potentially, related to a shift in cellular energy metabolism, from a predominantly glycolytic to oxidative metabolism, with the associated release of reactive oxygen species. However, detailed analysis of the metabolic profile of MSCs expanded under varying oxygen conditions remains lacking.
The initial colony-forming capacity of MSC may also be influenced by cultured oxygen levels. Studies have described the isolation under hypoxia of MSC subpopulations, such as marrow-isolated adult multilineage inducible cells.8,12 Furthermore, these studies have suggested that MSCs expanded under hypoxia are able to express the embryonic stem cell gene, OCT-4, and maintain their multipotency at later population doubling when differentiated under normoxia.8,9,12,13 Lennon et al. (2001) showed that MSC differentiation toward chondrogenic and osteogenic lineages was enhanced under hypoxia, although recent studies have suggested that osteogenic differentiation is inhibited under hypoxia.13–16,17 Hypoxia enables and in some cases, enhances chondrogenic differentiation,6,11,18 although Malladi et al. (2006) showed that hypoxic culture inhibited chondrogenesis in micromass cultures due to the development of anoxic conditions within the micromass.
Overall, the data from previous studies in relation to the effects of hypoxia on the expansion and differentiation of MSCs are inconsistent. This may be due to marked differences in the oxygen conditions used, with most studies using a single hypoxic condition, the species of the cells, and their initial isolation conditions. A further limitation of previous studies is that the cells were not cultured under continuous and uninterrupted hypoxic conditions, providing a compounding variable, whereby cells under hypoxic conditions are regularly subjected to fluctuating oxygen levels that may rise to 20% oxygen during cell manipulation, associated with passage.5,6,9 Thus, the current study reports the effect of expansion of MSCs from initial bone marrow isolation under continuous and uninterrupted cultured oxygen conditions of 20%, 5%, and 2% oxygen. The effects of the cultured oxygen conditions on initial colony formation, cell phenotype at first passage, subsequent population doubling, energy metabolism, and differentiation potential were assessed. Based upon the previous literature findings, it was hypothesized that human MSCs can undergo greater population doubling without an increase in cellular senescence when cultured under hypoxia. Additionally, hypoxia is hypothesized to enhance chondrogenic differentiation, while inhibiting osteogenic differentiation.
Materials and Methods
Bone marrow culture and MSC expansion
Bone marrow aspirates from four donors (three male, one female) aged 21–28 were procured from a commercial source (Lonza™). The samples were opened inside an Xvivo™ controlled oxygen culture system (Biospherix™) set at 5% oxygen. The workstation contains a microscope and incubators to enable visualization and culture of MSCs and enables cell manipulation under appropriate oxygen conditions to ensure that the cells are maintained under continuous and uninterrupted oxygen conditions. The environment is controlled using software that monitors oxygen and carbon dioxide levels through sensors inside the workspaces and incubators. The sensitivity of the oxygen levels within the incubators and workstation is±0.1%. The 37°C/5% CO2 incubators were set at gas-phase oxygen levels, 20%, 5%, and 2% oxygen. An MSC expansion medium, α-MEM (Invitrogen)+8.5% FBS (Sigma-Aldrich), 1 ng/mL basic fibroblast growth factor (Serotec), 100 U/mL penicillin, 100 μg/mL streptomycin, 2 mM L-glutamine, 25 mM HEPES buffer and 0.2 mM L-ascorbic acid-2-phosphate (all Sigma-Aldrich), was equilibrated at each of the oxygen tensions before supplementation. Marrow samples were suspended in a medium equilibrated at 5% oxygen and the number of mononuclear cells was counted. The cell suspensions were seeded into 25-cm2 flasks at a density of 5×10⁵ mononuclear cells/cm2 and randomly allocated into equal sets of flasks to be incubated at each of the stated oxygen tensions. Each was fed an equilibrated medium at their respective oxygen tension and cultured in the appropriate incubator. At the first medium exchange, 6 days after initial plating, culture flasks were washed with phosphate-buffered saline (PBS; Sigma-Aldrich) before addition of a medium.
Throughout the initial culture period, a systematic analysis of colony formation was performed. A colony was defined as a group of 16 or more cells. Colony diameter and cell morphometric analysis were determined from representative photomicrographs using SigmaScan Pro Version 5 (SYSTAT Software, Inc.). The medium was refreshed every 2–3 days until cells within the colonies began to develop multilayers at which point the cells were passaged by trypsinization and the number of cells recovered at each oxygen condition was recorded (days 21 and 14 for donors A and B, respectively). The recovered cells were seeded into culture flasks at 2×10³ cells/cm2. MSCs were allowed to proliferate under their designated oxygen conditions for a further four passages. Growth curves were derived from the data and used to calculate cell-doubling time.
Phenotypic characterization of MSCs and cell cycle analysis
The expression of positive and negative surface markers for MSCs was assessed using flow cytometry once colonies had begun to overlap, 18 days after initial plating. 19 Cells from two separate donors at each oxygen tension were detached from flasks using oxygen-equilibrated Accutase (Sigma-Aldrich) and fixed with oxygen-equilibrated 0.5% PFA for 10 min. Cells were washed in PBS and incubated with antibodies indicated in Table 1 for 30 min at room temperature. Following surface staining, cells were resuspended in 0.25% triton-X100 (Sigma-Aldrich) with 2 μg/mL DAPI (Invitrogen) for cell cycle analysis. Cells were analyzed using 5-colour flow cytometry with an LSRII flow cytometer (BD Biosciences). Cells were gated on forward scatter and side scatter to exclude cell debris, and DAPI exclusion was used to remove nonspecific fluorescence by dying/dead cells.
All antibodies are anti-human produced in mouse from BD Biosciences, Oxford, United Kingdom.
FITC, fluorescein isothiocyanate; APC, allophycocyanin; PE, phycoerythrin.
Furthermore, cells were taken after detachment and seeded on coverslips at 5×10³ cells/cm2. Following 24 h incubation, coverslips were fixed with 4% PFA for 10 min at room temperature, washed in PBS, permeabilized with 0.5% Triton-X100, blocked in goat serum, and incubated overnight at 4°C with the primary antibody, mouse monoclonal IgM anti-STRO-1 (1:50, 200 μg/mL, Santa Cruz Biotechnology, Heidelberg, Germany). Coverslips were washed using PBS and were incubated for 1 h at room temperature using the secondary antibody, goat anti-mouse IgG (H+L) conjugated to Alexa Fluor 488 (1:200, 2 mg/mL; Invitrogen). Coverslips were counterstained with 8 μM Hoechst 33342 (Invitrogen) and mounted with a ProLong Gold antifade reagent (Invitrogen). Samples were imaged using a Leica DMI4000B inverted epifluorescent microscope fitted with a Leica DFC300 FX camera.
β-galactosidase staining
β-galactosidase staining was used as a marker of cell senescence. Cells were assessed after five passages in culture using a commercially available histochemical kit for β-galactosidase activity (Sigma-Aldrich). Cells were seeded at 2×10³ cells/cm2 into six-well plates and cultured until reaching 50%–70% confluence. The cells were fixed and stained according to manufacturers' instructions. The number of β-galactosidase-positive cells (blue stained cells) was counted in the whole area of the six-well plate alongside the total cell number and both were recorded.
Measurements of metabolite consumption and production of MSCs
Measurement of oxygen consumption
Passage 3 and 4 MSCs expanded under each oxygen condition were trypsinized at 80%–90% confluence and resuspended in α-MEM without phenol red (Invitrogen)+8.5% fetal bovine serum (FBS), pre-equilibrated at 20%O2/5%CO2. Cell suspensions were aliquoted into the wells of a 384-well oxygen biosensor plate (BD Bioscience) and separate 384-well plates (BD Biosciences) at a volume of 130 μL with each well containing 1.5×10⁵ cells. MSCs were additionally assessed in the presence of 10 mM sodium azide. A zero oxygen control (0.1M sodium sulfite; Sigma-Aldrich) and cell-free oxygen and temperature- equilibrated medium samples were also included.
The plates were sealed using a plate sealer and the biosensor plate was placed in a fluorometer (Fluostar Galaxy; BMG technologies) that was setup to measure fluorescence under incubator conditions at an excitation wavelength, 485 nm, and emission wavelength, 590 nm. The remaining plates were stored in a 37°C/5% CO2 incubator. Oxygen consumption was measured every 10 min for a 2 h period and the rate of consumption was calculated using previously described protocols.20,21 A correction factor for oxygen ingress was applied due to oxygen leakage into the well. The calculation of the consumption and per cell consumption rate has been detailed previously. The permeability constant used in the present investigation was 0.23+0.04 (mean±SD).
Measurement of glucose consumption and lactate production
The medium was removed from 384-well plates at 1, 2, 4, and 6 h time points for measurement of glucose consumption and lactate production within the medium using previously described assays. 21 The rate of glucose consumption and lactate production was derived from the linear portion of the glucose-time and lactate-time curves. These rates were normalized to cell number to obtain glucose consumption and lactate production rates.
Differentiation studies: osteogenic culture
Passage 2 MSCs expanded under each oxygen condition were seeded at a density of 2×10³ cells/cm2 into 6 well plates (Corning) and incubated under their expansion oxygen conditions. Following 24 h after seeding, the medium was replaced with oxygen-equilibrated osteogenic medium [(α-MEM (Invitrogen)+10% FBS+0.05 mM L-ascorbic acid-2-phosphate+10 mM β-glycerophosphate+0.1 mM dexamethasone (all Sigma-Aldrich)], while controls for the experiments were 20% oxygen MSCs fed with α-MEM+10% FBS. The oxygen-equilibrated medium was refreshed every 2–3 days and cells were grown for 21 days.
Calcium deposition was assessed after 21 days using alizarin red staining. Alkaline phosphatase activity was measured using a commercial kit (Randox Laboratories), according to manufacturers' instructions. Before analysis, cells were lyzed using 0.2% Triton X-100 (Sigma-Aldrich) in PBS. The ALP concentration was normalized to the DNA concentration that was measured using the Quant-it Picogreen assay kit (Invitrogen) according to manufacturers' instructions.
A further experiment repeated the experimental setup only for cells pre-expanded at 20% and 2% oxygen. However, MSCs from each expansion oxygen condition were then differentiated at both 2% and 20% oxygen. Controls for these studies were cells differentiated at their expansion oxygen tension and cells in the proliferation medium.
Chondrogenic culture
Cell pellets containing 2.5×10⁵ cells were prepared from Passage 2 MSCs from each oxygen tension. Pellets were cultured in the oxygen-equilibrated chondrogenic medium (Dulbecco's modified Eagle's medium–High glucose (DMEM-HG)+1 mM sodium pyruvate+0.35 mM L-Proline+0.17 mM L-ascorbic acid-2-phosphate+0.1 μM dexamethasone (all Sigma-Aldrich)+10 nM TGF-β3 (Peprotech)+ITS+premix (BD Biosciences) and were incubated at their expansion oxygen tension for 21 days. The oxygen-equilibrated chondrogenic medium was fed every 2–3 days. The control for the study was pellets pre-expanded at 20% oxygen that were fed a medium without TGF-β3.
Representative pellets for each oxygen tension were removed on days 1, 7, 14, and 21 for glycosaminoglycan (GAG) and DNA analysis. Pellets were digested in the presence of papain and then DNA and total GAG content was measured using Hoechst 33258 and the 1,2-dimethylmethylene blue assay, respectively.22,23 Representative pellets for each oxygen condition were fixed and then embedded into paraffin blocks. Sections were created using a microtome saw (5-μm thick) and floated on coated slides before staining with 1% toluidine blue solution for visualization of GAGs within the pellet.
Statistical analysis
Colony number and cells per colony were assessed within their respective donor. Comparisons were made using single-factor analysis of variance (ANOVA) (α=0.05). If there was significance within the data (p<0.05), then the post hoc student t-test with Bonferroni correction was applied. Population-doubling times were assessed within their respective donors, although statistical comparisons between doubling time and oxygen tension were assessed using two-factor ANOVA (α=0.05) and then the same post hoc test was used. Data were pooled for the remaining studies and comparisons were made using single-factor ANOVA. Surface marker expression was compared using a two-factor ANOVA (donor and oxygen tension); The Tukey's post hoc test was used for intergroup comparisons.
The colony diameter and cell area were assessed using nonparametric methods after testing the data for normality. Comparisons between groups were tested using the Kruskal–Wallis test (α=0.05) and if found significant (p<0.05), then a Mann–Whitney U-test was applied.
Results
Low-oxygen culture modulates colony frequency and size
MSC colonies were first observed at each oxygen tension after 6 days in culture (Fig. 1a–c). The development of colonies was monitored until first trypsinization, with data presented for the day before first trypsinization (days 20 and 13 for donors A and B; Fig. 1d). No significant difference in the number of colonies was observed at 20% and 2% oxygen, whereas a significant decrease in colony number was observed for 5% oxygen cultures (Fig. 1d, Student t-test; p<0.05). At first trypsinization (days 21 and 14 for donors A and B), the greatest number of cells were recovered for the 20% oxygen conditions (Fig. 1e), with significantly fewer cells recovered under either the 5% or 2% oxygen conditions for both donors (Student t-test; p<0.05).
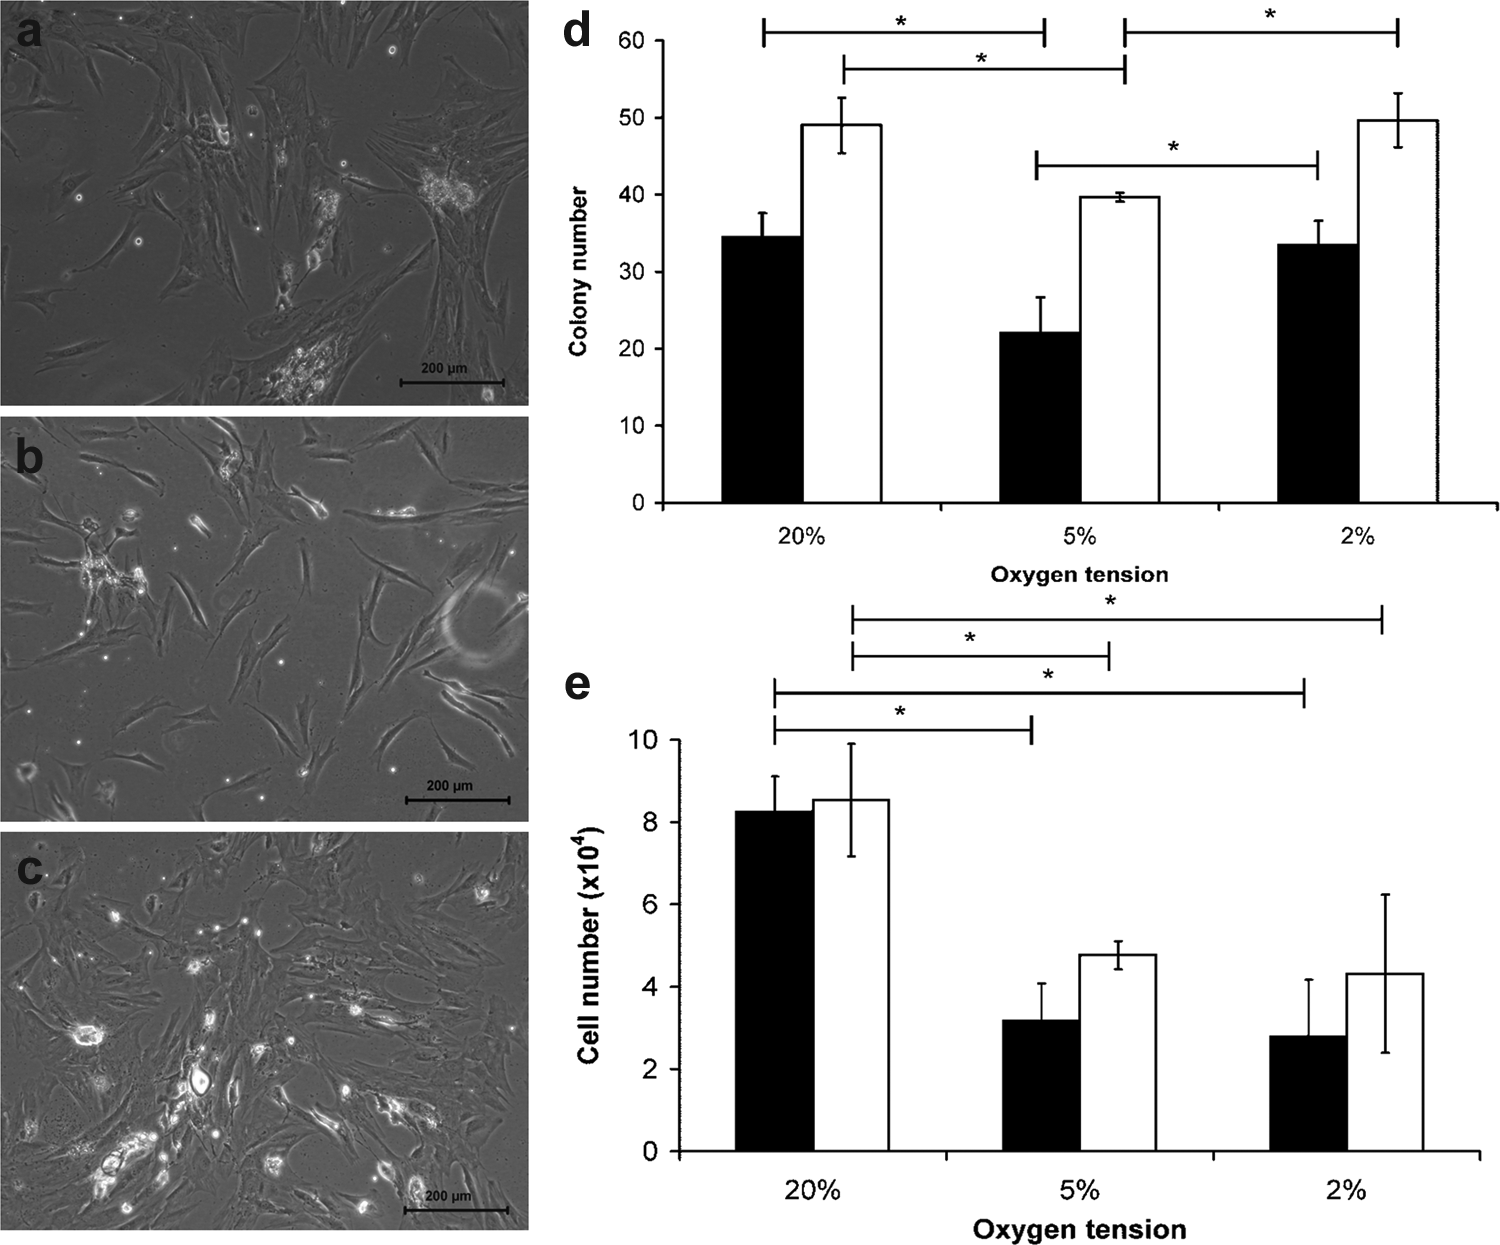
Representative photomicrographs of colonies formed under
Moreover, morphometric analysis of the colony diameter and individual cell area revealed differences for colonies formed at differing oxygen tension (Fig. 2). The diameters of colonies formed at 2% oxygen were significantly smaller than at either 20% or 5% oxygen (Fig. 2a, Mann–Whitney U-test; p<0.05). Moreover, there were significant differences in individual cell area for MSCs cultured under 2% oxygen compared with either 20% or 5% oxygen (Fig. 2b, Mann–Whitney U-test; p<0.05).
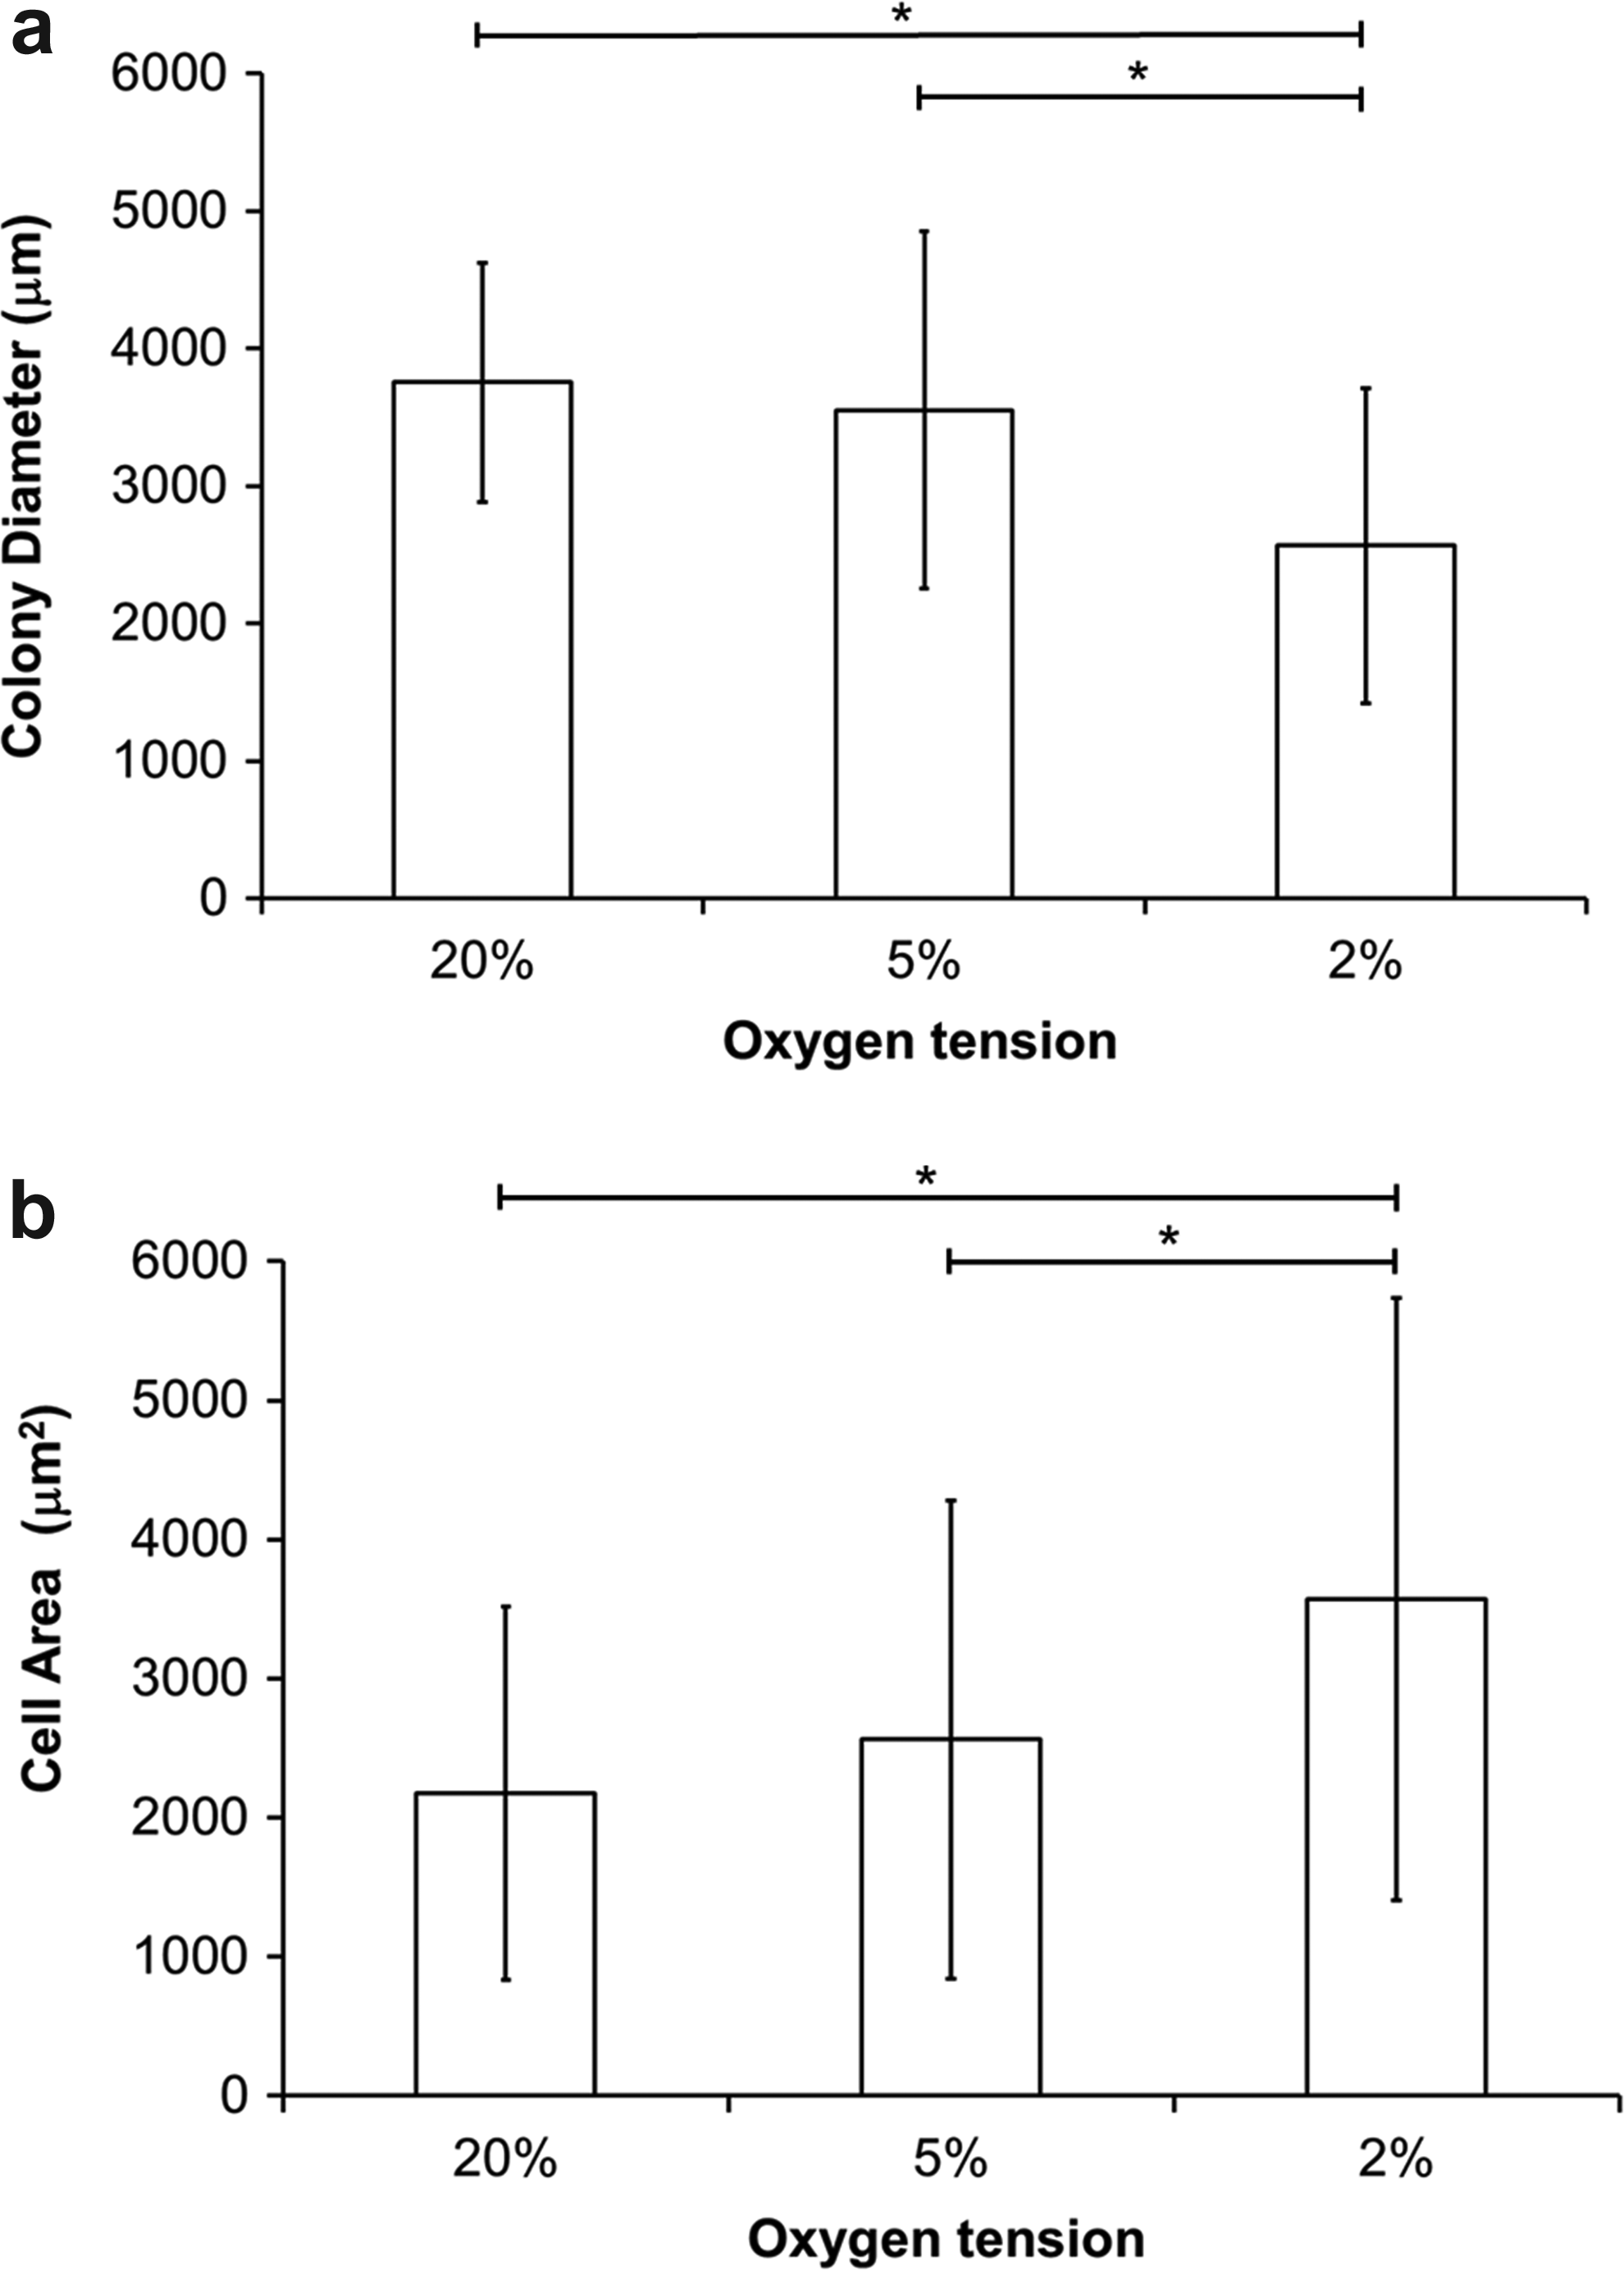
The
Hypoxic isolation and culture enhances expression of MSC-specific surface markers
Once colonies began to overlap after initial plating, adherent cells were seeded on coverslips and immunostained, or analyzed using flow cytometry. MSCs were negative for CD34, CD11b, CD19, CD45, and HLA-DR and positive to differing extents for CD90, CD44, CD105, and CD73 (Fig. 3). Isotype control plots are shown in Supplementary Figure S1(Supplementary Data are available online at
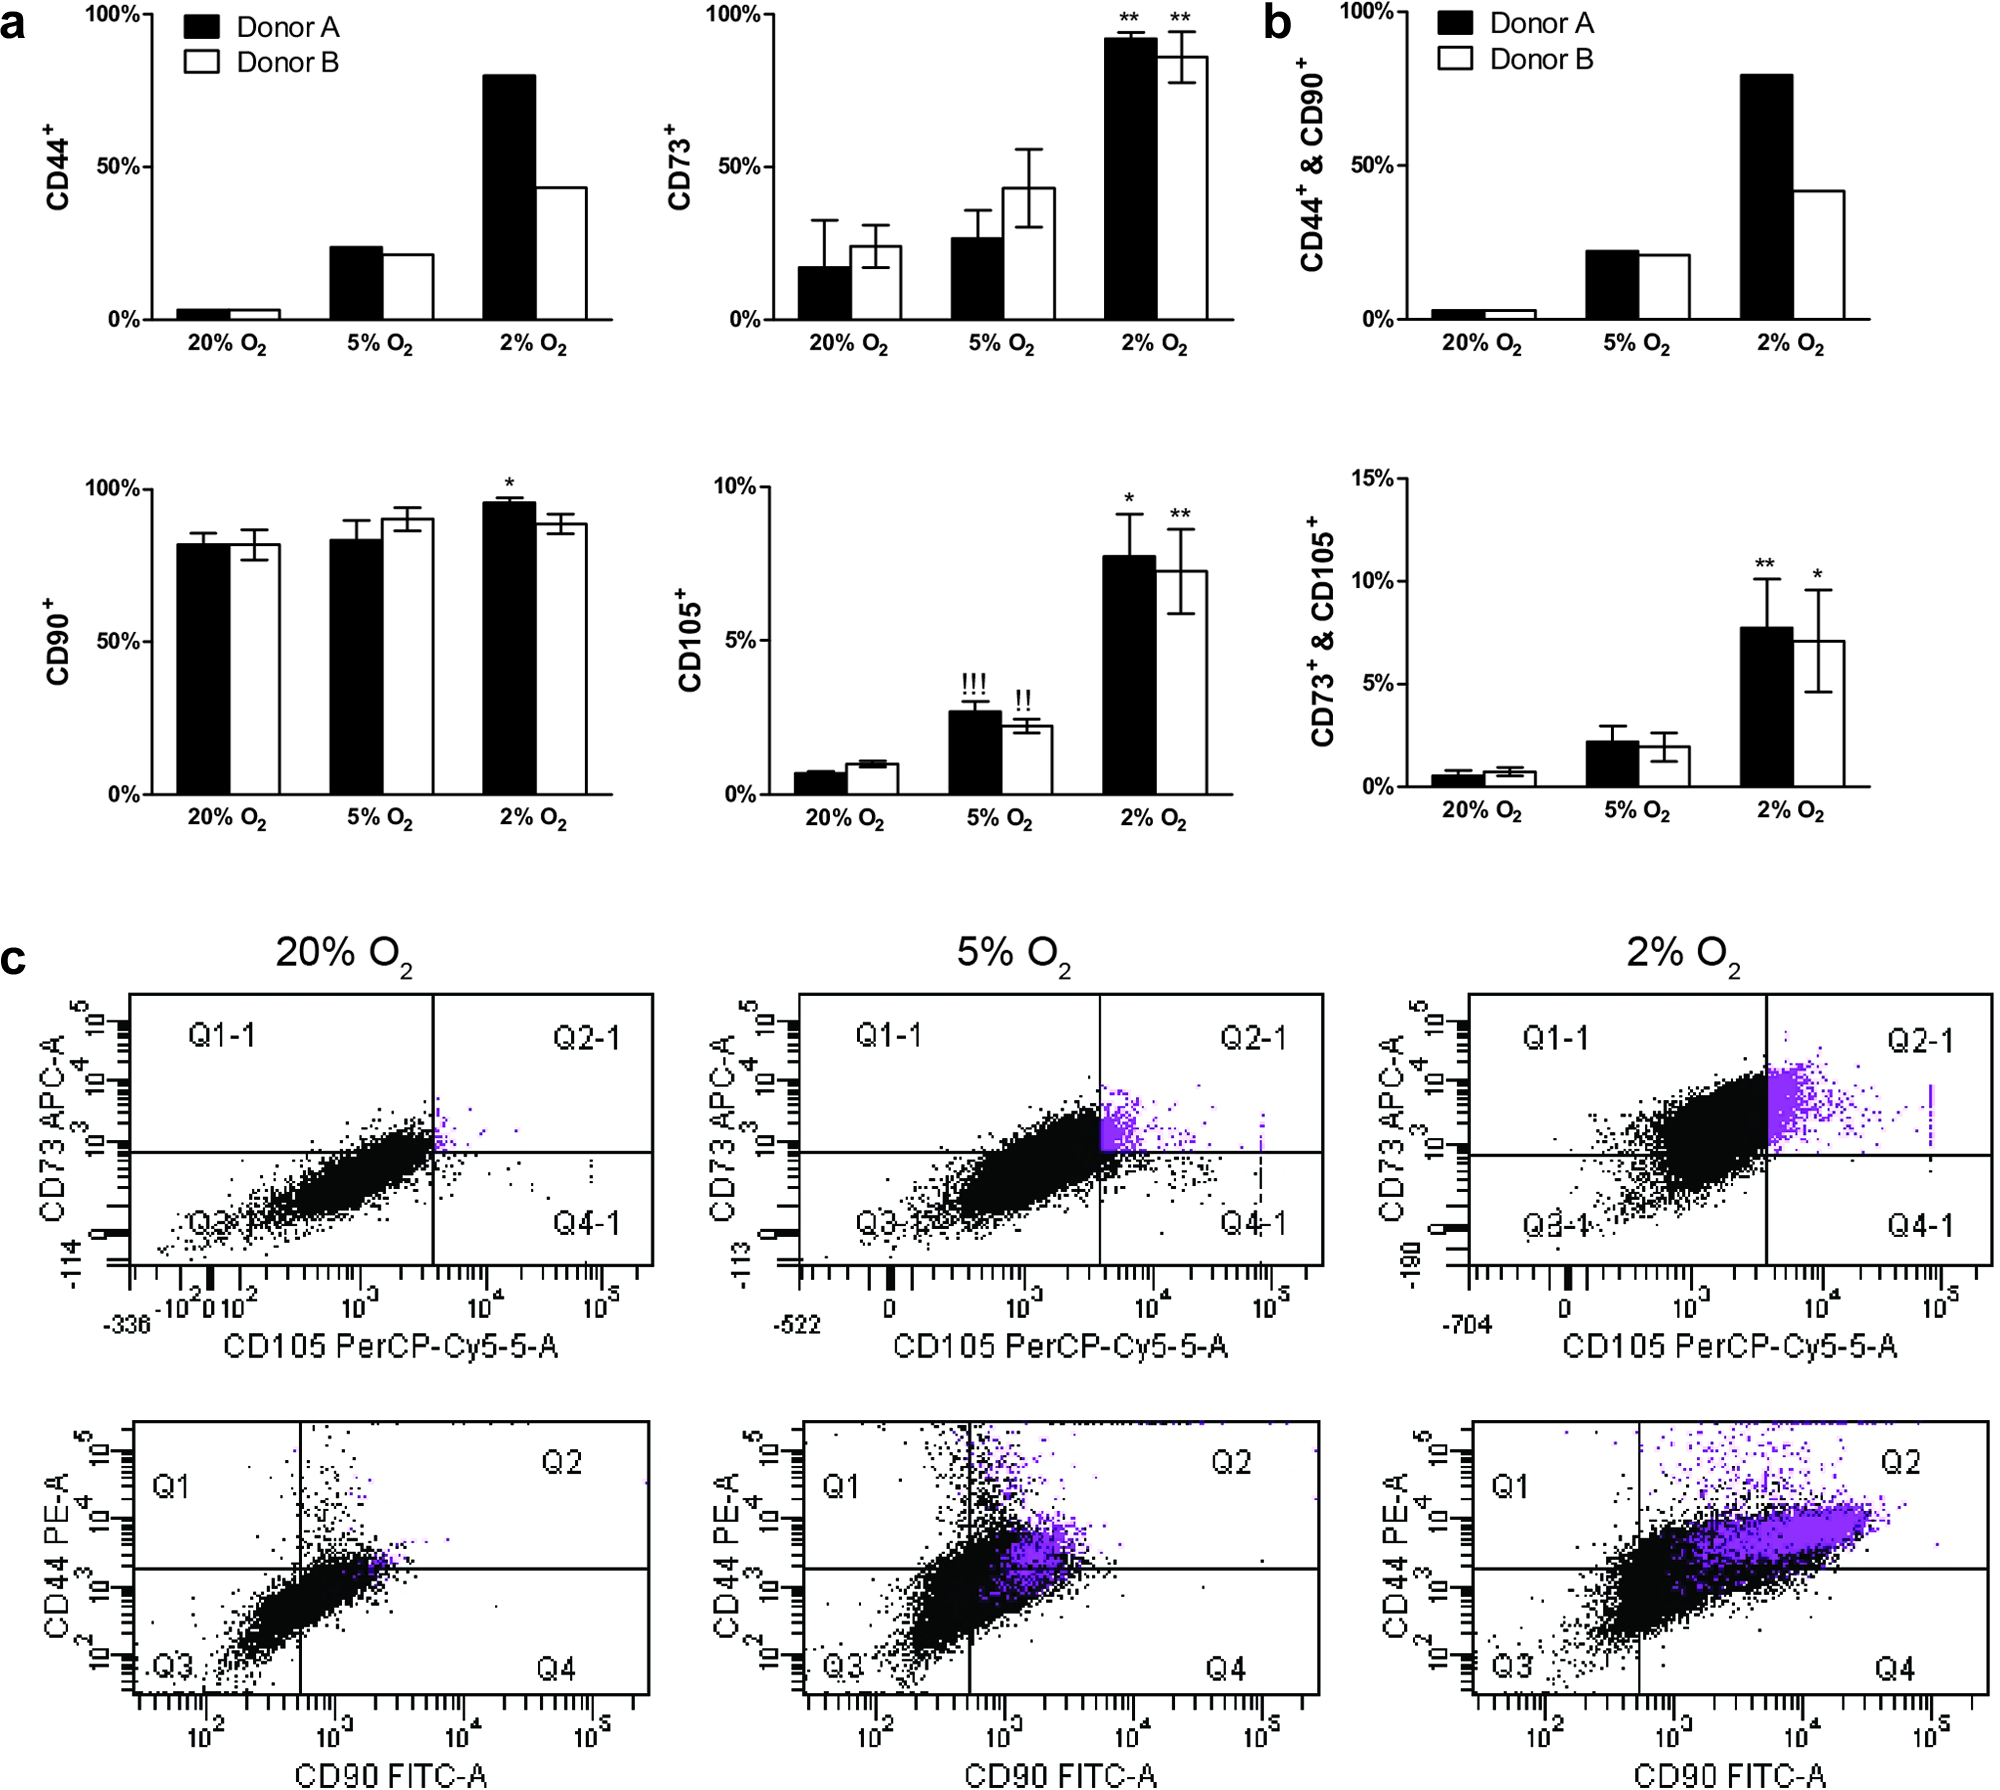
Phenotypic characterization of mesenchymal stem cells (MSCs) after initial plating.
Hypoxia-cultured MSCs show no differences in population growth rate after initial phase, but have reduced cellular senescence
Assessment of MSC expansion under each oxygen condition following first trypsinization revealed a more rapid fold increase in cell number at 20% oxygen compared with 5% or 2% oxygen, assessed over four passages (Fig. 4d, e). In terms of cell-doubling time (Table 2), there was a significantly shorter MSC-doubling time at P1 cultured under normoxia compared with 5% or 2% oxygen for both donors (Student t-test; p<0.05). However, cells expanded at 20% oxygen, significantly increased their doubling time with each subsequent passage (Student t-test; p<0.05), resulting in no significant differences in doubling time between oxygen conditions from passage 3 onward for donor B and passage 2 onward for donor A (ANOVA; p>0.05).

Representative photomicrographs of MSCs cultured at P1 for 5 days for cells cultured at ), 5% ( ), 2% (
 )], and
  ), 5% (
 ), and 2%(
 )].
)].
After five passages, cells expanded under normoxia contained a subpopulation of cells that had a larger and more flattened morphology, which was not evident for cells cultured at 5% and 2% oxygen, which maintained their fibroblastic morphology throughout the culture period (Fig. 5a, b). Morphometric analysis also demonstrated that the median cell area for cells cultured at 20% oxygen was significantly greater than at 5% and 2% (data not shown). A significantly greater proportion of cells cultured at 20% oxygen stained for β-galactosidase compared with either 5% or 2% oxygen, indicating greater cellular senescence (Fig. 5c, Student t-test, p<0.05).

Representative photomicrographs of unstained 2% oxygen
Normoxia-cultured MSCs have increased oxidative phosphorylation utilization
The MSC oxygen consumption rate for cells expanded at 20% oxygen was significantly higher than cells expanded at either 5% or 2% oxygen (Table 3, Student t-test; p<0.05). Data were similar for both donors and were thus pooled. Furthermore, MSCs expanded at 20% oxygen had a significant reduction in lactate production, compared with cells expanded at 5% or 2% oxygen (Student t-test; p<0.05). There was no significant difference in consumption and production rates for MSCs expanded at either 5% or 2% oxygen (Student t-test; p>0.05).
Data represent mean±SD of n=6.
Sodium azide sensitive oxygen consumption enabled calculation of mitochondrial oxygen consumption for each expansion oxygen condition (20% oxygen: 82.9 fmol/h/cell, 5% oxygen: 30.2 fmol/h/cell, 2% oxygen: 40.2 fmol/h/cell). ATP production derived from oxidative phosphorylation was approximately 35% for MSCs expanded under 20% oxygen, while for MSCs expanded under either 5% or 2% oxygen, a significantly reduced ATP generation occurred via this pathway (∼15%).
Hypoxia-cultured MSCs have reduced capacity for osteogenesis under normoxia or hypoxia
Figure 6e demonstrates an increase in GAG content with time in culture for each oxygen tension. There were no significant differences in the GAG/DNA ratio under chondrogenic stimulation between oxygen tensions and time points (ANOVA; p>0.05). However, the GAG/DNA ratio for the chondrogenic pellets was significantly greater than unstimulated pellets (Student t-test; p<0.05). This was further demonstrated through toluidine blue staining (Fig. 6a–d).

Representative photomicrographs of chondrogenic pellets stained for GAG deposition using toluidine blue for cells cultured under ), 20% ( ), 5% (
 ), and 2% (
 ) oxygen conditions. Data represent mean±SD of n=6; Bonferroni corrected student t-test: *p<0.05. GAG, glycosaminoglycan. Color images available online at
MSCs expanded and differentiated at 20% oxygen exhibited enhanced alkaline phosphatase activity compared to 5% and 2% oxygen cultures (Fig. 7a). There were no significant differences in alkaline phosphatase activity between samples expanded and differentiated under hypoxia and control cultures (ANOVA; p>0.05). This was further demonstrated via alizarin red staining for calcium deposition (Fig. 7b–e).
), 20% osteogenesis (), 5% osteogenesis (), and 2% osteogenesis (). Representative photomicrographs of osteogenic cultures stained for calcium deposition using alizarin red for cells cultured under
MSCs expanded at 20% and differentiated at 2% oxygen demonstrated limited alkaline phosphatase activity and no alizarin red staining compared to cells differentiated at 20% oxygen (Fig. 8a–c, Student t-test, p<0.05). None of the cells expanded at 2% oxygen expressed appreciable alkaline phosphatase activity (Fig. 8a) or alizarin red staining (Fig. 8d, e) under any of the differentiation conditions assessed.
), 20%–20% osteogenic (), 20%–2% osteogenic (), 2%–2% control (), 2%–2% osteogenic (), and 2%–20% osteogenic (). Representative photomicrographs of osteogenic cultures stained for calcium deposition for cells precultured under 20%
Discussion
The present study investigated the effect of hypoxia (5% oxygen and 2% oxygen) on the isolation, proliferation, and differentiation of human bone marrow-derived MSCs. Regenerative medicine applications require high cell numbers for therapeutic uses. However, MSCs have demonstrated premature senescence and impaired multipotency at later population doubling upon expansion under normoxia.3,7 The multipotentiality of MSCs and other stem cells, enables them to be utilized for many therapeutic applications. Thus, methods that enable maintenance of multipotency at later population doubling are required. In this instance, recent investigations have used hypoxic culture to help enhance MSC population doubling.8–10 They demonstrated that with higher population doubling, there was a preservation of multipotency when differentiated under normoxia. However, in the present study, continuous and uninterrupted oxygen control was used from initial plating. The current data demonstrated marked differences between the three oxygen conditions from the initial colony-forming stage onward that may affect subsequent proliferation kinetics, metabolic phenotype, and ability to undergo osteogenesis and chondrogenesis. Bone marrow aspirates from two donors were used, and although there were quantitative differences, for example, in colony formation and proliferation rates, the broad effect of hypoxia was similar between donors.
The present study showed that fewer colonies were formed from the initial adherent cell fraction within the bone marrow at 5% oxygen compared with the 20% and 2% oxygen conditions (Fig. 1d, e). These findings differ from previous studies that have demonstrated similar colony formation or enhanced colony formation under hypoxia.5,7,8,24 However, methodologies adopted in some of these studies differ from the current investigation, with colony-forming efficiency assessed following an initial culture period of one to four passages.5,9 Fehrer et al., 2007 did not demonstrate differences in colony formation from primary isolation between 20% and 3% oxygen, similar to the current data for 2% and 20% oxygen. D'Ippolito et al., (2004) demonstrated robust colony formation at 3% oxygen, with colony numbers per 106 plated mononuclear cells comparable with the current study, although they did not provide comparative data with isolation at 20% oxygen.
Analysis of the size of the MSC colonies and individual cells therein, revealed further differences, most notably the smaller size of the colonies containing larger cells for MSCs cultured at 2% oxygen compared to the other conditions. The combined effects of colony number, colony size, and cell size are consistent with the markedly reduced numbers of cells recovered at first trypsinization for the hypoxic conditions compared to normoxia (Fig. 1e). These data are consistent with very early differences in the isolation of adherent MSCs from bone marrow at each of the oxygen conditions tested, which may reflect the selection of subpopulations of cells with differing morphologies and phenotypic characteristics.
The presence of subpopulations was reflected in the flow cytometry analysis of MSCs from these colonies (Fig. 3). There was greater expression of typical MSC markers at 5% and 2% oxygen compared to normoxia. These data concur with previous literature studies, suggesting the MSC phenotype may be enhanced under low oxygen.7,25–27 Furthermore, analysis of a specific MSC subpopulation (CD73 and CD105 positive cells) isolated under 2% oxygen, revealed a highly proliferative cell population under these conditions (Supplementary Fig. S2). It has been suggested that CD105 positive MSCs are a highly chondrogenic MSC subpopulation.28,29 Thus, these data indicate that typical MSC markers are highly expressed under low oxygen and that there may be specific MSC subpopulations isolated under hypoxia.
Growth kinetics was assessed from first passage. Initially, there was a clear relationship between the proliferation rate and oxygen levels; with cells under hypoxia exhibiting increased population-doubling times (Fig. 4d, e). However, while doubling times remained relatively constant under hypoxia, there was a trend toward increasing doubling times at later passage for cells maintained at 20% oxygen (Table 2). These findings are consistent with previous studies that have demonstrated reduced proliferation rates under hypoxia at early passages, 5 although other studies have reported enhanced proliferation under hypoxia.7,9 The increased doubling time with passage at 20% oxygen suggests that the cells may have approached their population-doubling limit after five passages (approximately 9 population doubling from first trypsinization). Indeed, Moussavi-Harami et al. (2004) showed that human MSCs transfected with human telomerase reverse transcriptase, had a population-doubling limit of 11 population doubling. However, previous investigations have shown that MSCs cultured under hypoxia, proliferate for a longer period compared with normoxia. 5 The growth curves generated from the present investigation are in agreement with these previous studies. Furthermore, a greater proportion of cells expanded under 20% oxygen stained positive for the senescence marker β-galactosidase compared with hypoxic cultures (Fig. 5c), further supporting the suggestion that the cells may be reaching their population-doubling limit by passage 5 and exhibiting replicative senescence. However, to substantiate this point, a longer culture period would be required to investigate their actual population-doubling limit under each oxygen condition.
The data from the initial colony-forming stage and subsequent expansion phase suggest that culture at 20% oxygen will produce greater cell numbers over a shorter period of time compared with hypoxia. Indeed, the current data suggest that over a 50-day period from initial isolation, culture at 20% oxygen could generate a fivefold increase in cumulative cells numbers compared to 2% hypoxic culture, which would therefore require approximately a further 20 days culture to generate similar numbers of cells. This has clear implications for the incorporation of hypoxic expansion for cell therapies. However, the more rapid initial proliferation must be balanced against the reduced levels of senescence observed after five passages or approximately nine population doubling of hypoxic culture. Premature senescence under normoxia may be associated with the underlying cellular metabolism. The present investigation showed that cells expanded at 20% oxygen, had a significantly greater per-cell oxygen consumption rate and utilization of oxidative phosphorylation compared with hypoxic cultures (Table 3). These factors may contribute to the increased cellular senescence through the production of reactive oxygen species, with associated oxidative damage.3,30 The greater proportion of ATP production derived from glycolysis for MSCs expanded under hypoxia correlates with previous studies.5,6,31,32 Accordingly, cells expanded under hypoxia may retain a more physiological glycolytic phenotype.
MSCs are particularly attractive for tissue engineering applications due to their ability to differentiate toward various mature phenotypes. The present study showed no significant difference in the amount of GAG produced by MSCs expanded and differentiated under each of the tested oxygen conditions (Fig. 6e), which is in agreement with a recent study that showed no enhancement in chondrogenic gene expression under hypoxia. 33 However, a number of other studies have suggested that hypoxia enhances MSC chondrogenesis and the re-expression of chondrocytic phenotype by dedifferentiated chondrocytes, assessed through the expression of the early chondrogenic marker, SOX-9, and the accumulation of GAG and collagen.6,11,18 However, it should be noted that these studies used hypoxia during the differentiation phase only. Furthermore, recent studies have described the use of hypoxia to prevent chondrogenic hypertrophy, as hypoxic cultures had reduced collagen type X expression (a known marker of hypertrophy) compared to normoxic cultures.27,34
In contrast, MSC osteogenesis was only displayed for MSCs expanded and differentiated under normoxia, as hypoxic cultures did not show either calcium deposition or elevated alkaline phosphatase activity (Fig. 7a, d, e). Previous investigations have demonstrated that MSCs expanded under hypoxia, were able to differentiate toward the osteogenic lineage upon culture at 20% oxygen.8,9,11,12,34 However, the present investigation showed that cells expanded at 2% oxygen, did not express indicators of osteogenesis upon differentiation at 20% oxygen (Fig. 8). A reason for the contrasting MSC differentiation findings during culture under hypoxia may be associated with MSC oxidative capacity and regulation of hypoxia inducible factor-1α (HIF-1α). The present investigation has demonstrated that MSC oxidative capacity or oxygen consumption is significantly reduced for hypoxia-expanded MSCs (Table 3). MSC osteogenesis is associated with a higher level of oxygen consumption compared with chondrogenesis, and therefore reduced oxygen consumption during the differentiation process may inhibit osteogenesis. 35 Chen et al. (2008) demonstrated that mitochondrial content and activity increases during osteogenesis, with an associated increase in oxygen consumption. 36 However, inhibition of oxygen consumption using a mitochondrial inhibitor resulted in inhibited osteogenesis. Therefore, the diminished osteogenic differentiation from hypoxia-expanded MSCs may be related to the reduced oxygen consumption. Furthermore, the nondegradation of HIF-1α expression that controls cell metabolism, in particular, stimulating glycolysis and its associated enzymes,37–39 has been shown to inhibit osteogenic-specific genes related to MSC metabolism during osteogenesis.15,16,40,41 In the present investigation, we assessed the presence of HIF-1α under each oxygen condition during the proliferation stages using immunofluorescence. However, we did not observe marked changes in staining intensities between each oxygen condition (data not shown).
To generate an osteogenic phenotype, an alternative differentiation route may need to be used for the process. Jukes et al. (2008) and Farrell et al. (2009) have demonstrated that MSCs and embryonic stem cells conditioned toward the chondrogenic lineage are able to undergo osteogenic differentiation following culture using osteogenic supplements.42,43 The process replicates endochondral ossification during bone tissue development and may be utilized for the MSCs derived from hypoxic culture within the present investigation.
The differentiation results indicate that continuous and uninterrupted hypoxia may have facilitated the selection of an MSC subpopulation during earliest colony-forming stages. This was supported by increased MSC surface marker expression with reduced oxygen tension, and morphometric analysis of cells within colonies indicating the prevalence of different cellular morphologies at each oxygen tension, which may impact on the differentiation capacity of the cells.44–47 The present investigation suggests that chondroprogenitors were selected, correlating with results using adipose-derived MSCs under similar conditions, although further analysis for this particular hypothesis is required. 48 Future investigations may wish to use clonal expansion techniques to investigate differentiation potential of MSCs from different colonies under each oxygen condition and if specific early chondrogenic and osteogenic marker genes (SOX9 and Runx2) have variable expression by cells isolated under these conditions that predispose them toward a specific phenotype. 4 However, the results from the present investigation indicate that expansion under hypoxia may act to inhibit osteogenesis through reduced utilization of oxidative phosphorylation, via hypoxia-induced modulation of their oxidative phosphorylation, or mitochondrial capacity. For clinical application, hypoxic culture of MSCs during colony formation and expansion is beneficial as it delivers a greater expansion potential, but new techniques may be required to enable differentiation toward multiple lineages.
Footnotes
Disclosure Statement
No competing financial interests exist.
References
Supplementary Material
Please find the following supplemental material available below.
For Open Access articles published under a Creative Commons License, all supplemental material carries the same license as the article it is associated with.
For non-Open Access articles published, all supplemental material carries a non-exclusive license, and permission requests for re-use of supplemental material or any part of supplemental material shall be sent directly to the copyright owner as specified in the copyright notice associated with the article.