
Abstract
In tissue-engineered (TE) heart valves, cell-mediated processes cause tissue compaction during culture and leaflet retraction at time of implantation. We have quantified and correlated stress generation, compaction, retraction, and tissue quality during a prolonged culture period of 8 weeks. Polyglycolic acid/poly-4-hydroxybutyrate strips were seeded with vascular-derived cells and cultured for 4–8 weeks. Compaction in width, generated force, and stress was measured during culture. Retraction in length, generated force, and stress was measured after release of constraints at weeks 4, 6, and 8. Further, the amount of DNA, glycosaminoglycans (GAGs), collagen, and collagen cross-links was assessed. During culture, compaction and force generation increased to, respectively, 63.9%±0.8% and 43.7±4.3 mN at week 4, after which they remained stable. Stress generation reached 27.7±3.2 kPa at week 4, after which it decreased to ∼8.5 kPa. At release of constraints, tissue retraction was 44.0%±3.7% at week 4 and decreased to 29.2%±2.8% and 26.1%±2.2% at, respectively, 6 and 8 weeks. Generated force (8–16 mN) was lower at week 6 than at weeks 4 and 8. Generated stress decreased from 11.8±0.9 kPa at week 4 to 1.4±0.3 and 2.4±0.4 kPa at, respectively, weeks 6 and 8. The amount of GAGs increased at weeks 6 and 8 compared to week 4 and correlated to the reduced stress and retraction. In summary, prolonged culture resulted in decreased stress generation and retraction, likely as a result of the increased amount of GAGs. These results demonstrate the potential of prolonged tissue culture in developing functional, nonretracting, TE heart valves.
Introduction
Our group focuses on tissue engineering of heart valves as an alternative for current available heart valve replacements. These valves are manufactured by seeding vascular-derived cells onto a rapidly degrading scaffold.11–14 Tissue compaction and retraction are limiting functionalities of such valves. In our heart valve tissue-engineering approach, the leaflets fuse during culture. Compaction, occurring during culture, causes leaflet flattening, which reduces the coaptation area of the leaflets. At the time of implantation, the leaflets are separated, and due to generated stress in the cultured tissue, retraction occurs. This retraction results in shortening of the leaflets, and as a consequence, the heart valves are not able to close during diastole and lose their functionality. In vivo, decreasing leaflet length due to tissue retraction has been observed to cause valvular regurgitation in sheep.3,11,15
We have developed an in vitro model system of rectangular tissue-engineered (TE) constructs to investigate the development of compaction, stress generation, and retraction. 10 It was observed that compaction and stress generation develop as soon as the scaffold loses its mechanical integrity. After 4 weeks of culture, compaction was 50%; the internal stress was 8 kPa; and retraction was 36%. 10 In case of a TE heart valve, this degree of retraction would make it impossible to ensure full closing of the valve leaflets.
Studies investigating traction forces, compaction, and retraction predominantly focus on short-time changes studied in gel systems that do not change composition during the time frame of the study.1–9,16 However, for TE heart valves, scaffolds are used that degrade over time, while cells develop their own extracellular matrix (ECM), constantly changing the composition of the TE heart valve. Total stress within such a tissue results from traction forces exerted by the cells on the ECM, coupled with the tissue's material properties and ability to resist deformation. At start, the scaffold material is stiff and able to withstand the traction forces of the cells. However, after week 2, the scaffold rapidly degrades 17 while the newly formed tissue is yet unable to resist the traction forces of the cells. This results in compaction during culture and retraction at release of constraints. 10 We believe that a well-developed tissue is able to resist the traction forces of the cells, resulting in less compaction and retraction. Prolonged tissue culture is hypothesized to improve the ECM properties and therefore improves resistance to the traction forces of the cells. In our previous study, we cultured for 4 weeks, after which compaction had reached a constant level, but stress did not reach equilibrium yet. 10 The goal of the present study was to quantify force and stress generation, compaction, and retraction during a prolonged culture period of 8 weeks and correlate this to the tissue properties, in search for this balance between tissue properties and traction forces of the cells. A representative model system of TE strips has been used to investigate these parameters during culture and after release of constraints at weeks 4, 6, and 8.
Materials and Methods
Tissue culture
Vascular-derived cells were harvested from the human vena saphena magna obtained according to the Dutch guidelines for secondary-used materials. These cells have previously been characterized as myofibroblasts
14
; all cells show the expression of vimentin; a part of the cells express α-smooth muscle actin (α-SMA), and none express desmin. Cells were expanded using regular cell culture methods in a humidified atmosphere containing 5% CO2 at 37°C.
18
The culture medium consisted of an advanced Dulbecco's modified Eagle's medium (Invitrogen), supplemented with 10% fetal bovine serum (Greiner Bio one), 1% GlutaMax (Invitrogen), and 1% penicillin/streptomycin (Lonza). The cells were seeded onto rectangular-shaped scaffolds (18×5×1 mm) of rapid degrading nonwoven polyglycolic acid (PGA) (Concordia Manufacturing, Inc.) coated with poly-4-hydroxybutyrate (received through collaboration with the University Hospital Zurich) as described previously.
19
In summary, the scaffolds were attached to two sliding blocks with polyurethane-tetrahydrofuran glue (15% wt/vol). Sterilization was achieved by 70% ethanol incubation for 30 min. Cells were seeded at passage 7 with a seeding density of 15 million cells per cm3 using fibrin as a cell carrier.
20
The TE constructs were cultured for 4, 6, and 8 weeks in a constrained (n=5 per culture period) and for 8 weeks in semiconstrained configuration (n=5) as described below. During tissue culture, the medium was supplemented with
The model system
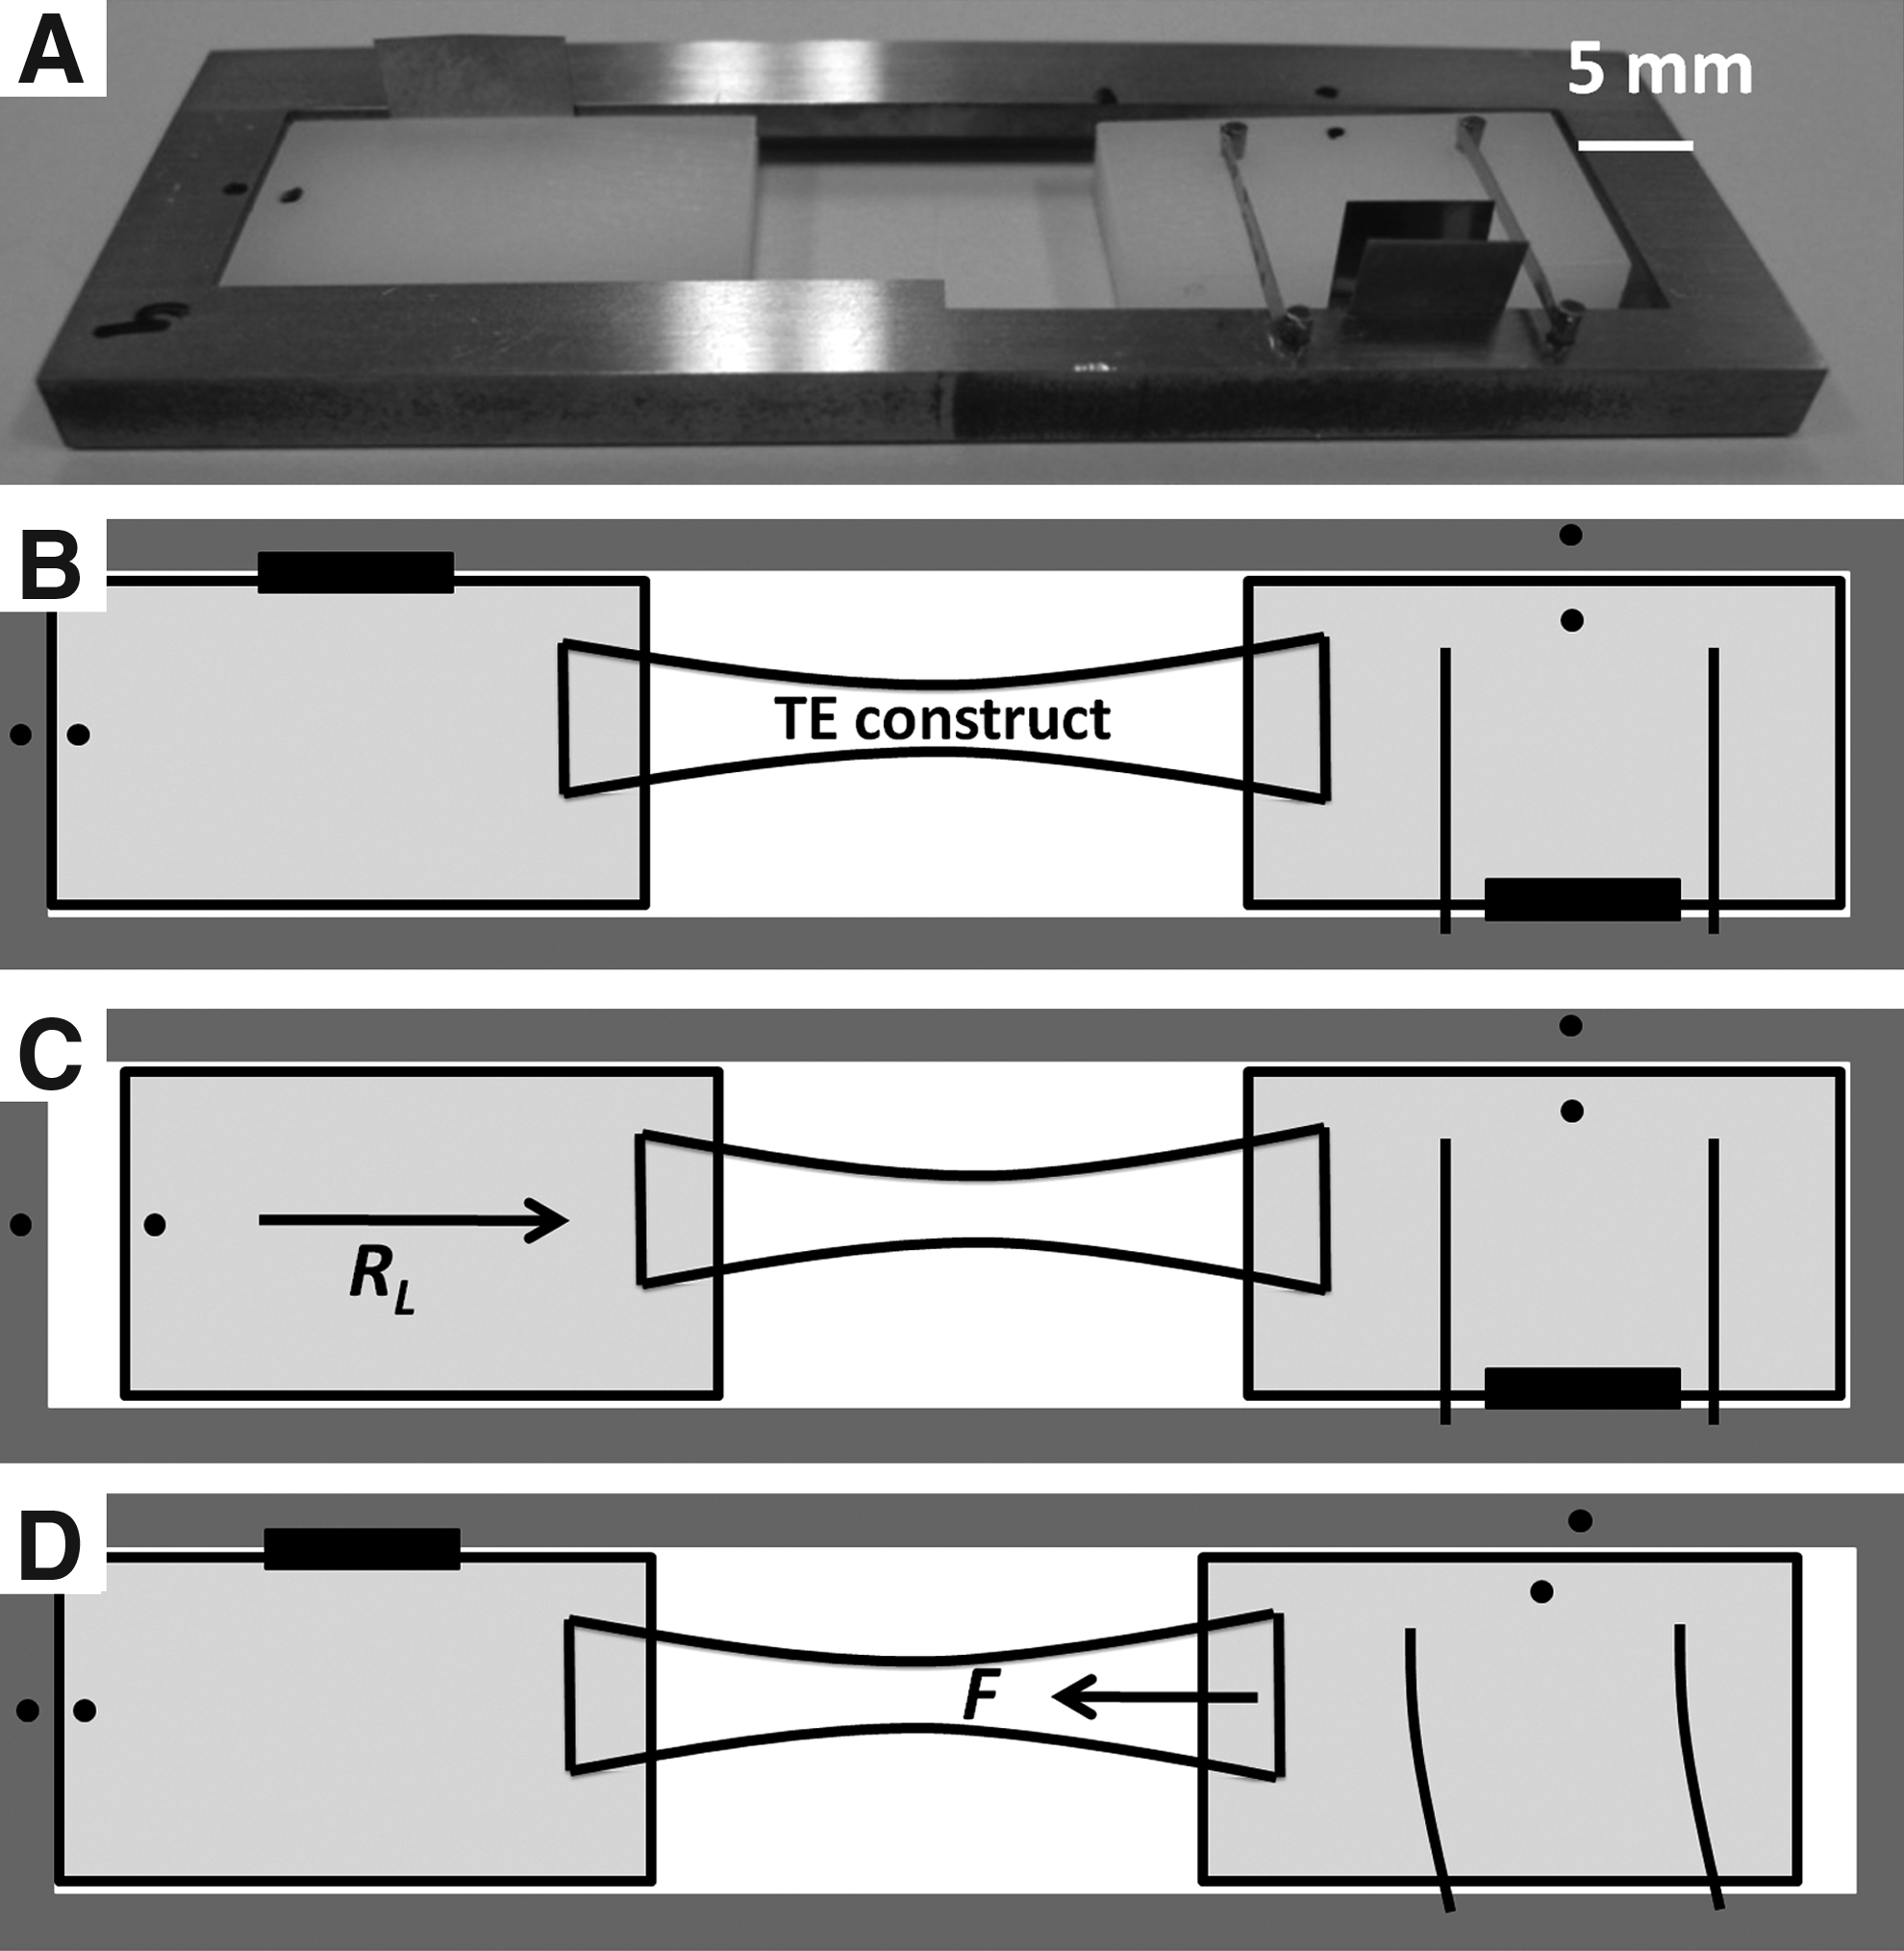
A previously described model system 10 (Fig. 1), in which TE constructs were cultured in between two sliding blocks, was used to quantify stress generation and retraction from one single TE construct. One sliding block can be either fixed (during culture) or moved freely (to measure retraction after culture) (Fig. 1C). The other is connected to two leaf springs, and the displacement of this sliding block is related to the generated force within the tissue (Fig. 1D). To measure force generation during culture, the sliding block of the leaf springs is not fixed. Because the force that is generated by the cells will deform the leaf springs, this configuration is referred to as semiconstrained. To measure generated force after release of constraints, both sides are fixed, and this configuration is referred to as constrained. Each setup was calibrated with an individual force–displacement curve.
Photograph
Quantification of surface compaction, generated stress, and retraction
The compacted width (Wcomp) of the TE constructs was assessed from photographs, and compaction (CW) was defined as the percentage of shrinkage compared to the original width (W0):
Thickness was measured with a caliper when samples were sacrificed. Time points in between the sacrificing time points were interpolated. From the measured tissue width and interpolated thickness, the change in the cross-sectional surface area (A) over time was assessed.
Force generation (F) and the retracted length of the TE constructs (Lretract) were quantified in MatLab (The MathWorks) based on the displacement of the sliding blocks.
10
The compacted cross-sectional surface area was used to determine the generated stress (σ) within the tissue via
Retraction in length RL (%) was defined as the percentage of shrinkage compared to the original length L0 (μm):
Experimental design
TE constructs were cultured for 8 weeks in constrained (n=15) and semiconstrained (n=5) configuration. During culture, the compacted width of both constrained and semiconstrained TE constructs and generated stress in the semiconstrained TE constructs were measured twice a week. After 4, 6, and 8 weeks of culturing, generated stress and retraction were measured in the constrained samples after release of the constraints (n=5 per time point). Generated stress was measured during 30 min with time intervals of 3 min. Retraction in length was measured during 24 h. Time intervals between retraction measurements were 6 min in the first half hour, followed by measurements after 1, 2, 4, 6, 16, and 24 h. An overview of the experimental design is given in Figure 2. The experiment was performed twice, according to the same protocol with similar cells, cell passage, cell-seeding density, and scaffold batch. In the Results section, the first run has been graphed, and the second run is expressed in a table. To investigate changes over time and differences between groups, both runs have been combined by normalization.

Schematic overview of the experimental design. Compaction during culture was measured in both constrained and semiconstrained samples. Retraction and generated stress were measured at weeks 4, 6, and 8 after release of constraints in the constrained samples. Generated stress during culture was measured in the semiconstrained samples. Retraction after release of constraints was measured in the semiconstrained samples at week 8. Finally, of every group, one TE construct was used for histological staining, while the other four were used for biochemical assays and Western blot.
Qualitative tissue analyses
Tissue formation was evaluated qualitatively by histological staining (n=1 per time point). The TE constructs were fixated with 3.7% formaldehyde (Merck) and embedded in paraffin. Tissue sections of 10 μm were cut and studied by hematoxylin and eosin (HE) staining for general tissue morphology, and Masson-Trichrome (MT) staining for deposition of collagen, and Alcian blue staining for deposition of glycosaminoglycans (GAGs). The stained sections were visualized using light microscopy (Axio Observer; Zeiss).
Western blot analysis
Lyophilized TE constructs (n=4 per group) were dissolved in an RIPA buffer (Sigma) and homogenized by sonification to a normalized concentration of 10 mg dry weight/mL. Proteins (10 μg) were separated by sodium dodecyl sulfate–polyacrylamide gel electrophoresis (Mini-PROTEAN 3 System; BioRad) conditions on a 10% polyacrylamide gel and transferred to a polyvinylidene fluoride membrane (Millipore Corporate). The membrane was blocked by incubation in phosphate-buffered saline (PBS)/0.1% Tween-20/5% milk solution for 1 h and probed overnight at 4°C with either mouse anti-human α-SMA, (Sigma) or mouse anti-human β-actin (Abcam) in PBS/0.1% Tween-20/1% milk. After washing and incubating with the conjugate rabbit anti-mouse peroxidase (Pierce) in PBS/0.1% Tween-20 for 1 h, the blots were developed using Supersignal West Dura chemiluminescent Substrate (Pierce) and visualized by Versadoc (Bio-Rad).
Quantitative tissue analyses
To quantify tissue formation, the amount of DNA, sulfated GAGs, collagen, and hydroxylysylpyridinoline (HP) cross-links was measured (n=4 per group). Lyophilized tissue samples were digested in papain solution (100 mM phosphate buffer, 5 mM
Statistical analyses
All data are presented as mean and their standard error of mean. Measurements over time have only been graphed for one run. Both runs have been combined by normalization to the constraint culture group at week 4. One-way analysis of variance, followed by a Tukey's multiple comparison post-hoc test, was carried out to compare weeks 4, 6, and 8 in the constrained and semiconstrained configurations for both runs separately and the combined normalized data. Correlations between tissue properties, stress generation, and retraction were evaluated by correlation analysis. GraphPad Prism Software (GraphPad Software, Inc. A) was used for statistical analyses and considered significant for p values<0.05.
Results
Tissue formation in prolonged tissue culture
Macroscopic photographs of the TE constructs within the model system are shown in Figure 3A–D. Figure 3D demonstrates the movement of the leaf springs during culture in the semiconstrained configuration. At week 4, thin and homogeneous tissues were formed (Fig. 3E). At weeks 6 and 8, a thin fibrous layer was formed around the denser inner tissue, which made the outline somewhat vague (white arrows in Fig. 3F–H). The HE staining (Fig. 3I–L) shows dense and thin tissue at week 4, which becomes thicker at week 6 and less dense at week 8. The MT (Fig. 3M–P) and Alcian blue (Fig. 3Q–T) stainings indicate abundant collagen and GAG formation at all time points. Both stainings show the surface layer that was formed at weeks 6 and 8, which is indicated by white arrows. No differences between the constrained and semiconstrained configurations were observed at week 8. Cells expressed similar amounts of α-SMA in both configurations and all time points (Fig. 4).

Macroscopic pictures of the model system
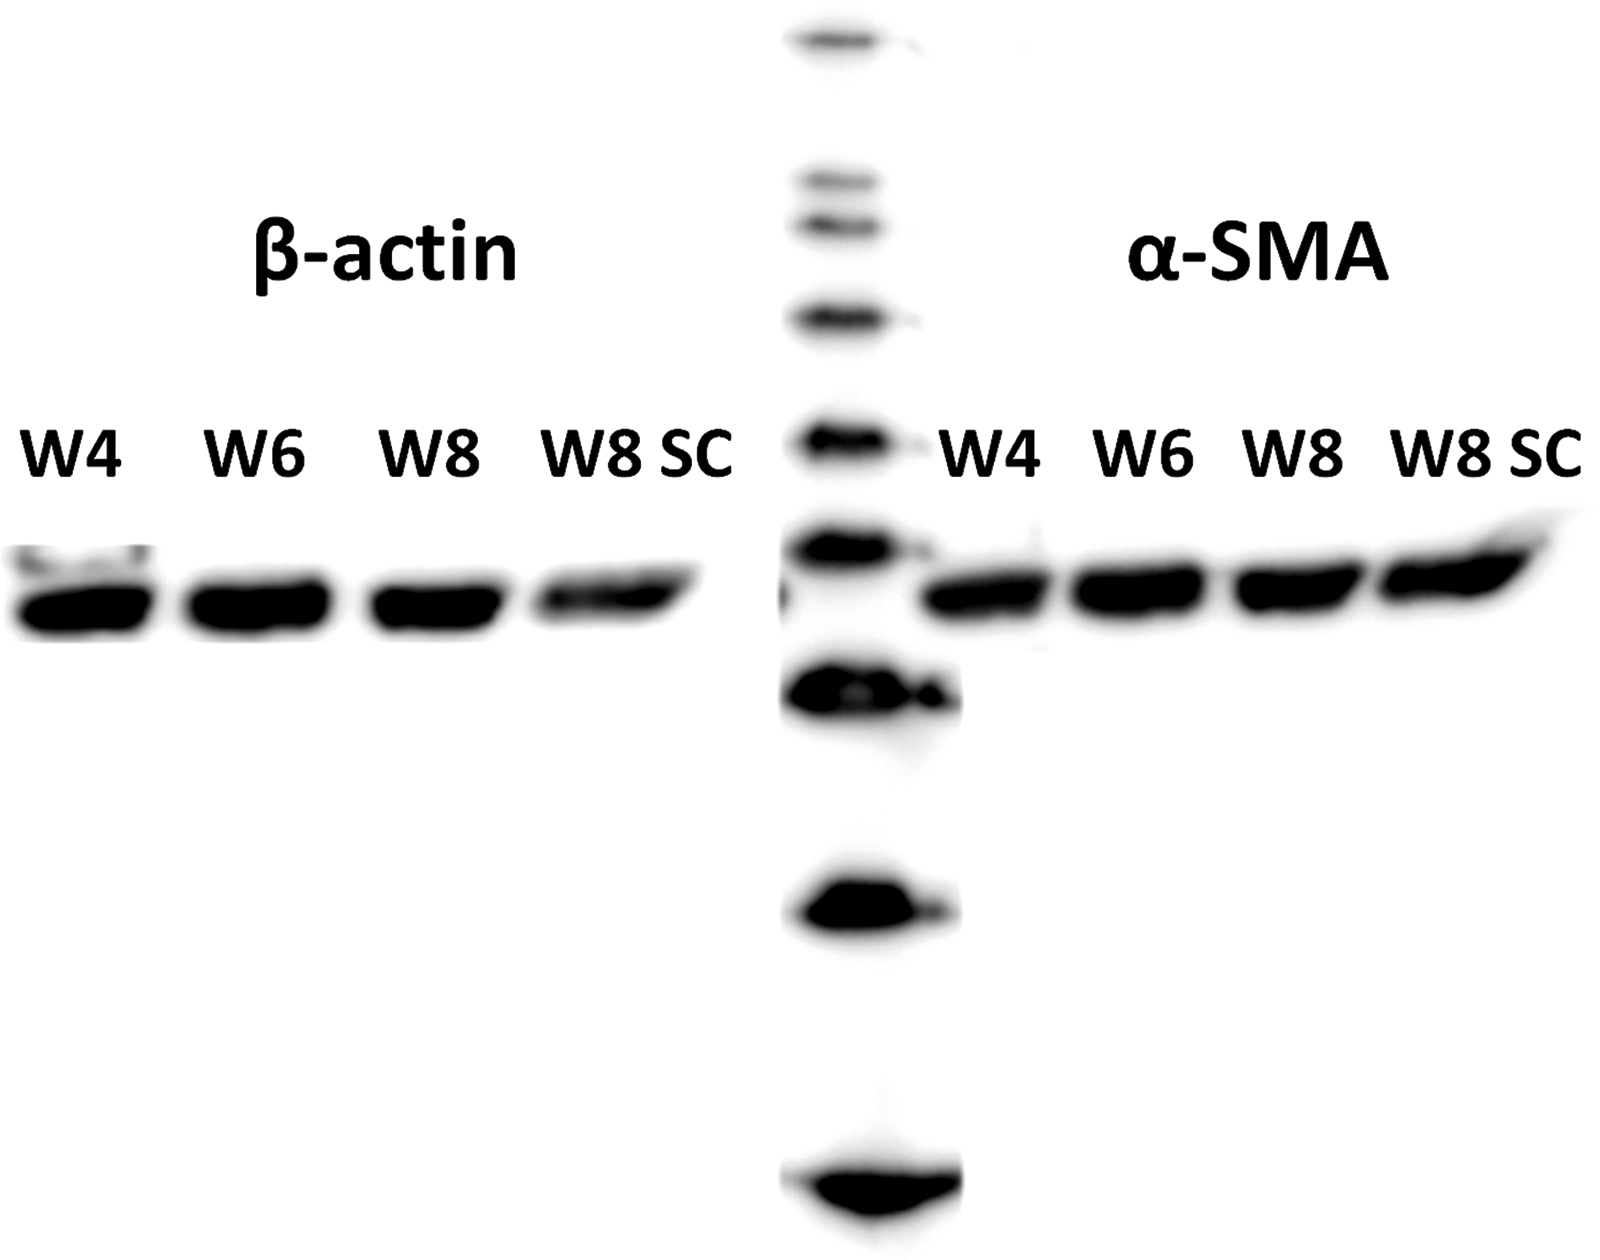
The amount of α-smooth muscle actin expressed by the cells remained constant over time and was similar between constrained and semiconstrained configuration.
The amounts of DNA, GAG, collagen, and collagen cross-links of both runs are presented in Table 1. Normalized quantitative biochemical content of the TE construct is shown in Figure 5. The amount of DNA, collagen, and collagen cross-links in the constrained samples was constant over time. The amount of GAGs increased at weeks 6 (p<0.05) and 8 (p<0.001) compared to week 4. No differences in tissue properties were observed between the constrained and semiconstrained configurations at week 8.

DNA
Denotes a significant difference compared to week 4 (within one run).
Denotes a significant difference of semiconstrained culture compared to constrained culture at week 8 (within one run).
Denotes a significant difference of run 2 compared to run 1.
Single or double symbols indicate p<0.05 or p<0.001, respectively.
GAG, glycosaminoglycan; HP, hydroxylysylpyridinoline; HYP, hydroxyproline; TH, triplehelix.
Tissue compaction and generated stress during culture (semiconstrained configuration)
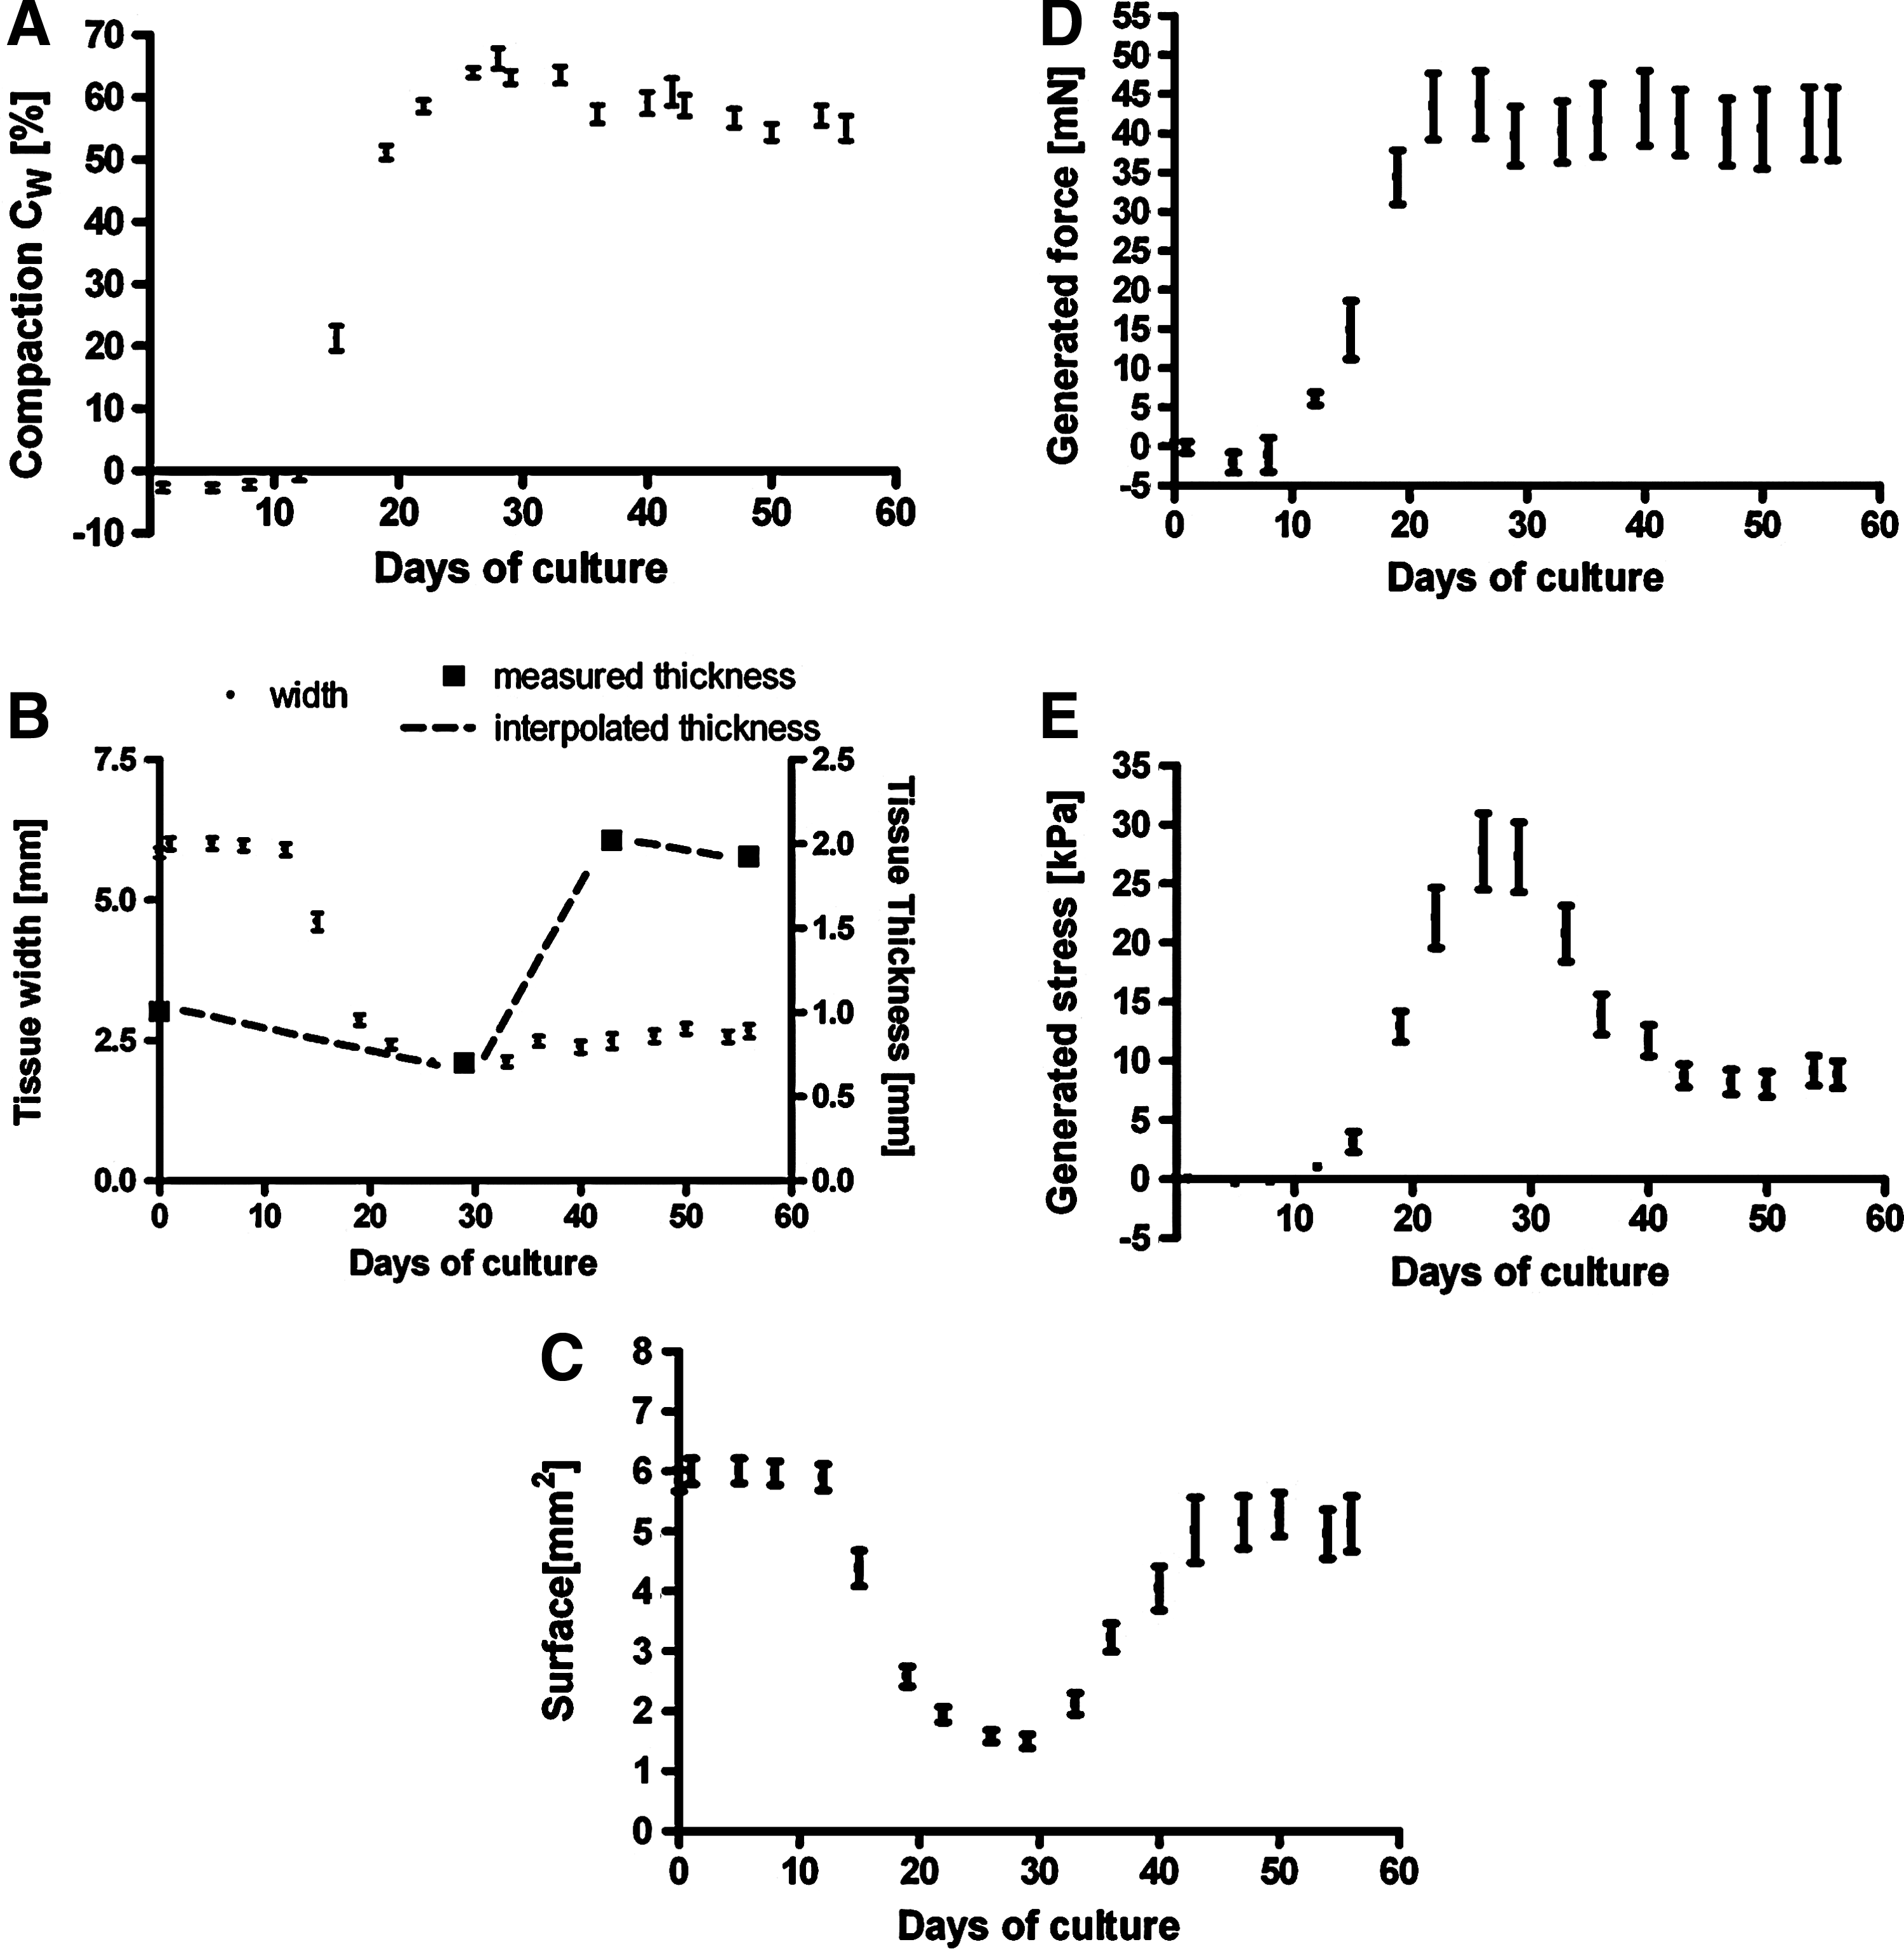
There were no differences between constrained and semiconstrained tissue samples regarding compaction, and therefore these data were combined. Tissue compaction started at week 2 and continued up to week 4, at which it reached 63.9%±0.8% (Fig. 6A). From week 4 on, compaction reduced to 59.1%±1.8% and 55.0%±2.0% at week 6 (p<0.05) and 8 (p<0.05), respectively. Width could be measured easily by the use of a camera system. Measuring the thickness, however, was more difficult and was only done at week 4, 6, and 8 resulting in averaged thicknesses of 700±40, 2000±20, and 1900±100 μm, respectively. To be able to see a trend in the surface change, we interpolated the time points in between, resulting in the time course of Figure 6B. This Figure shows that tissue thickness decreased during the first 4 weeks, then rapidly increased up to week 6, and remained stable after that. Combining thickness with the measured changes in width over time (Fig. 6B), a time course of the cross-sectional area was made (Fig. 6C). The cross-sectional area drastically decreased from 5.85±0.18 mm2 to 1.58±0.10 mm2 in the first 4 weeks, dominated by changes in width, after which it increased to 4.05±0.38 mm2 at week 6, dominated by changes in thickness. Finally, at week 8, the cross-sectional surface was 5.13±0.46 mm2.
Tissue compaction
The force generated by the cells in the semiconstrained samples builds up reaching 44±4 mN at week 4, after which it remained constant with averaged values of 43±5 and 41±5 mN at, respectively, weeks 6 and 8 (Fig. 6D). The generated stress, however, was found to increase up to 27.8±3.2 kPa at week 4, after which it rapidly decreased to 11.7±1.3 kPa at week 6 (p<0.001) and to 8.9±1.1 kPa at week 8 (p<0.001; Fig. 6E).
Tissue retraction and generated stress after release of constraints (constrained configuration)
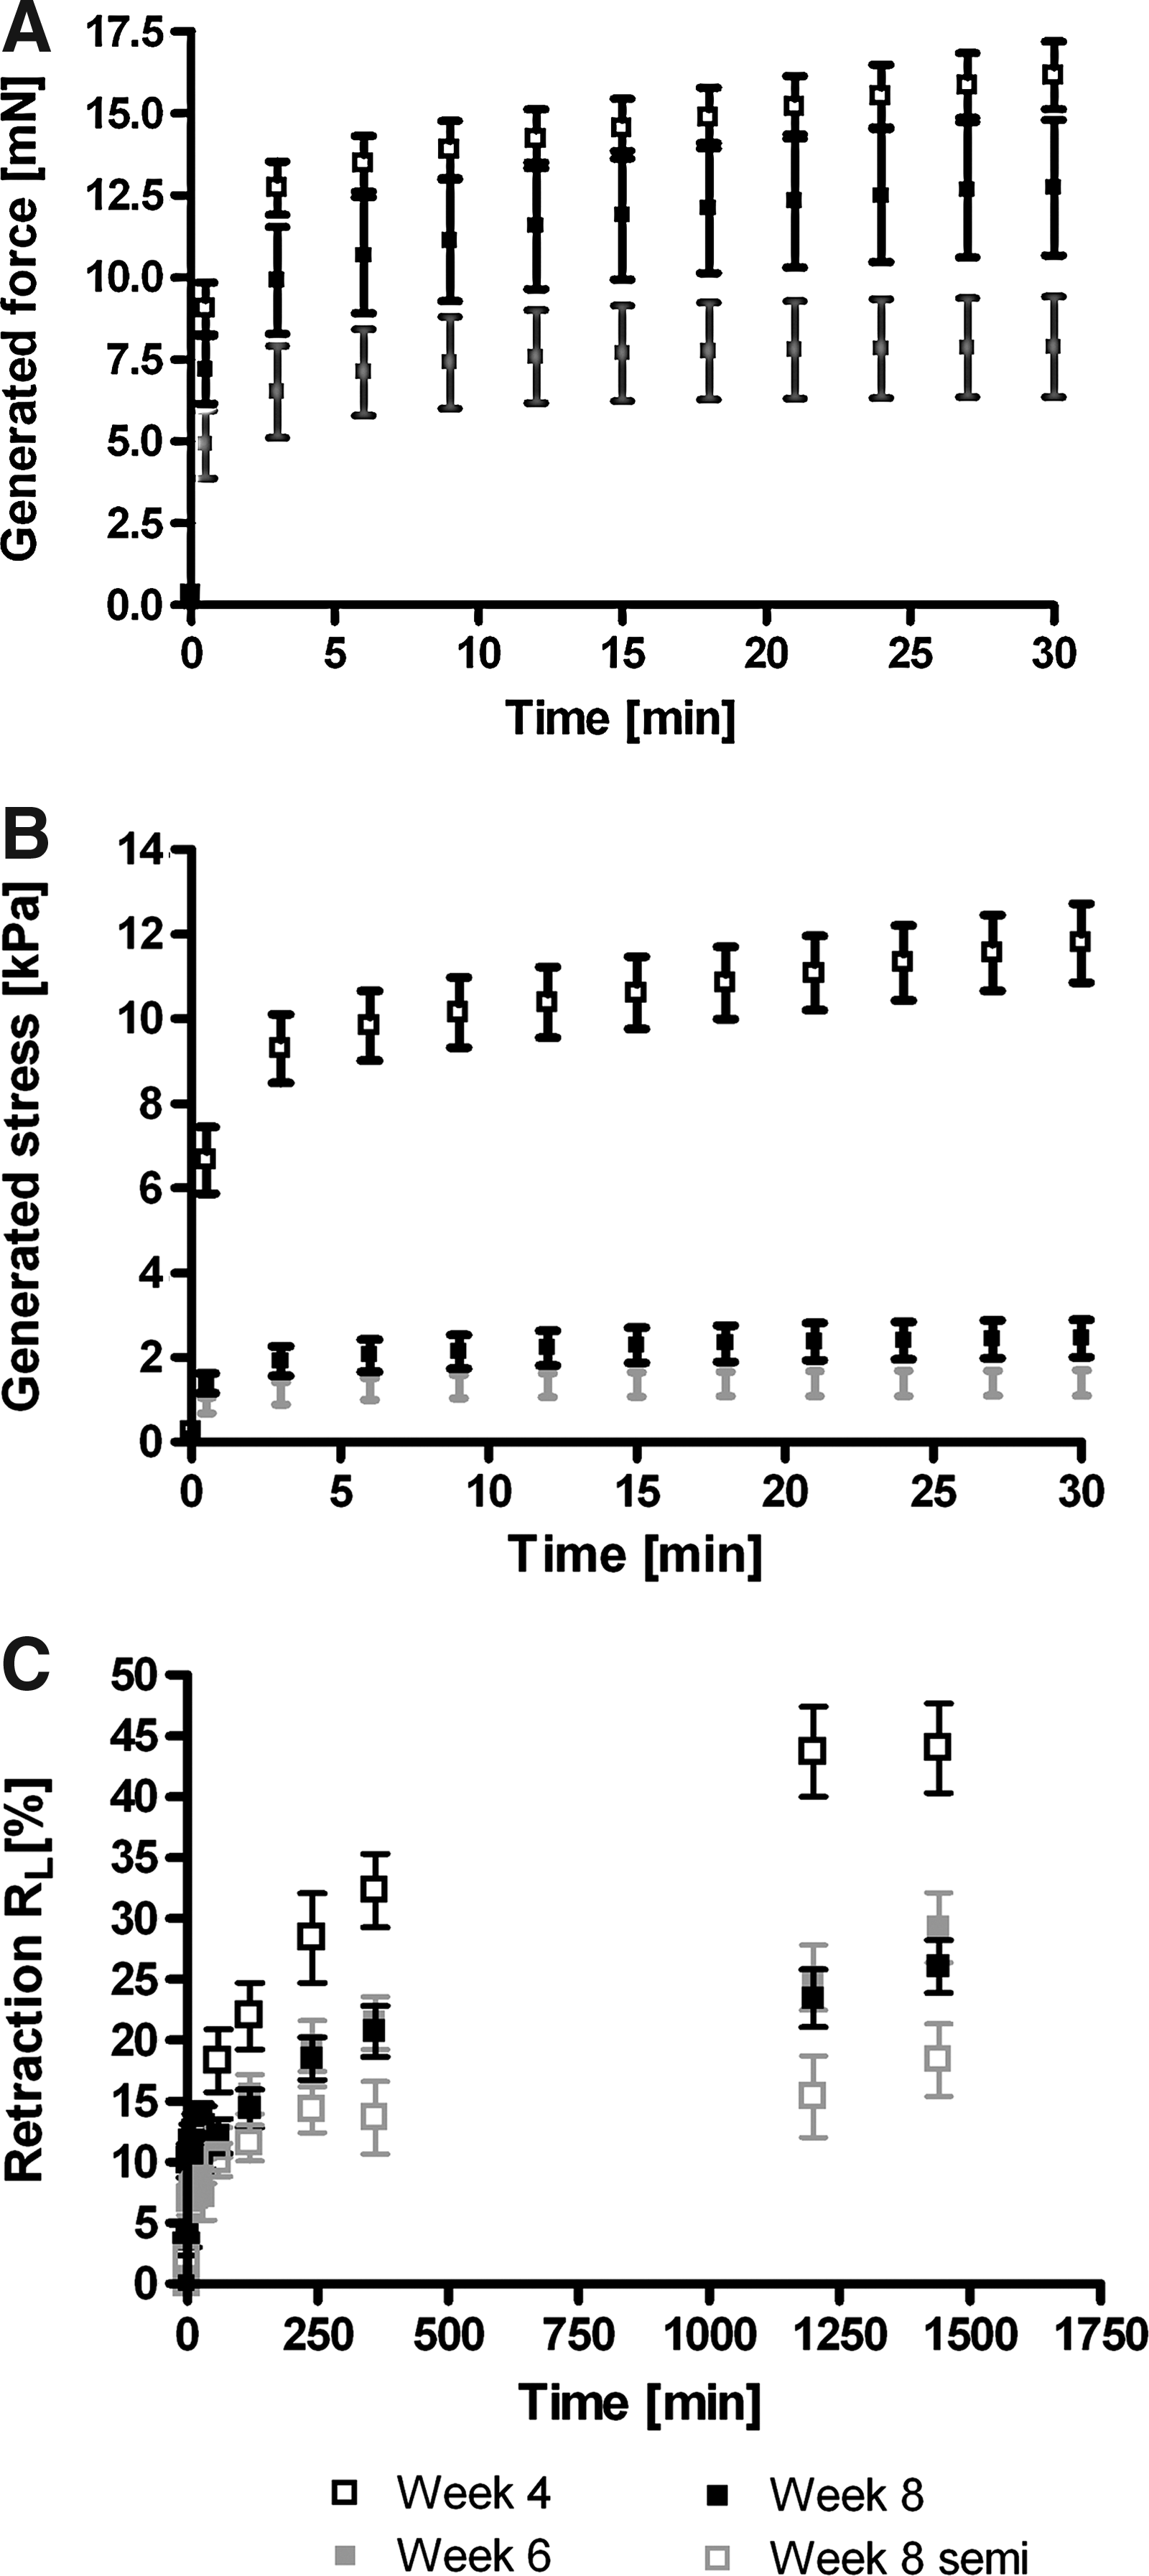
At release of constraints, the generated force (Fig. 7A) gradually increased and reached an averaged value of 16.2±1.0 mN after 30 min at week 4. At week 6, the generated force decreased to 7.9±1.5 mN (p<0.05), while at week 8, it increased again to 12.7±2.1 mN. The generated stress after 30 min became 11.8±0.9 kPa at week 4 and decreased to 1.4±0.3 and 2.4±0.4 kPa at weeks 6 (p<0.001) and 8 (p<0.001), respectively (Fig. 7B). During the first 30 min, retraction (Fig. 7C) occurred fast, reaching 30–40% of the total retraction after 24 h. After 30 min, no differences were observed between retraction at weeks 4, 6 and, 8 (12.8%±1.8%, 9.3%±1.0% and 10.6%±1.2%, respectively). However, after 24 h, retraction was more pronounced at week 4 (44.0%±3.7%) compared to weeks 6 and 8 (29.2%±2.8% and 26.1%±2.2%, respectively, p<0.05). In the semiconstrained TE constructs, retraction at week 8 also occurred very fast in the first 30 min, reaching a retraction of 8.7%±1.3%. After that, it gradually continued and finally reached a retraction of 18.4%±3.0% after 24 h (Fig. 7C).
Generated force
Variations and correlations within the experiment and configurations
An overview of both runs has been provided in Table 1. Overall, the observations over time are similar for both runs with some parameters being lower for the second run. Both runs have been normalized to statistically investigate differences between weeks 4, 6, and 8, and between the constrained and semiconstrained configuration. Compaction slightly decreased after week 4, which became significant at week 8 (p<0.05; Fig. 8A). The generated force was higher in the semiconstrained samples (p<0.05), but in both configurations, it was constant between weeks 4, 6, and 8 (Fig. 8B). Total stress (Fig. 8C) was higher in the semiconstrained than in the constrained configurations (p<0.001 at 4 weeks and p<0.05 at 6 weeks), while retraction at week 8 was similar in both configurations (Fig. 8D). Both retraction and stress (constrained) decreased at weeks 6 and 8 compared to week 4 (all p<0.001).
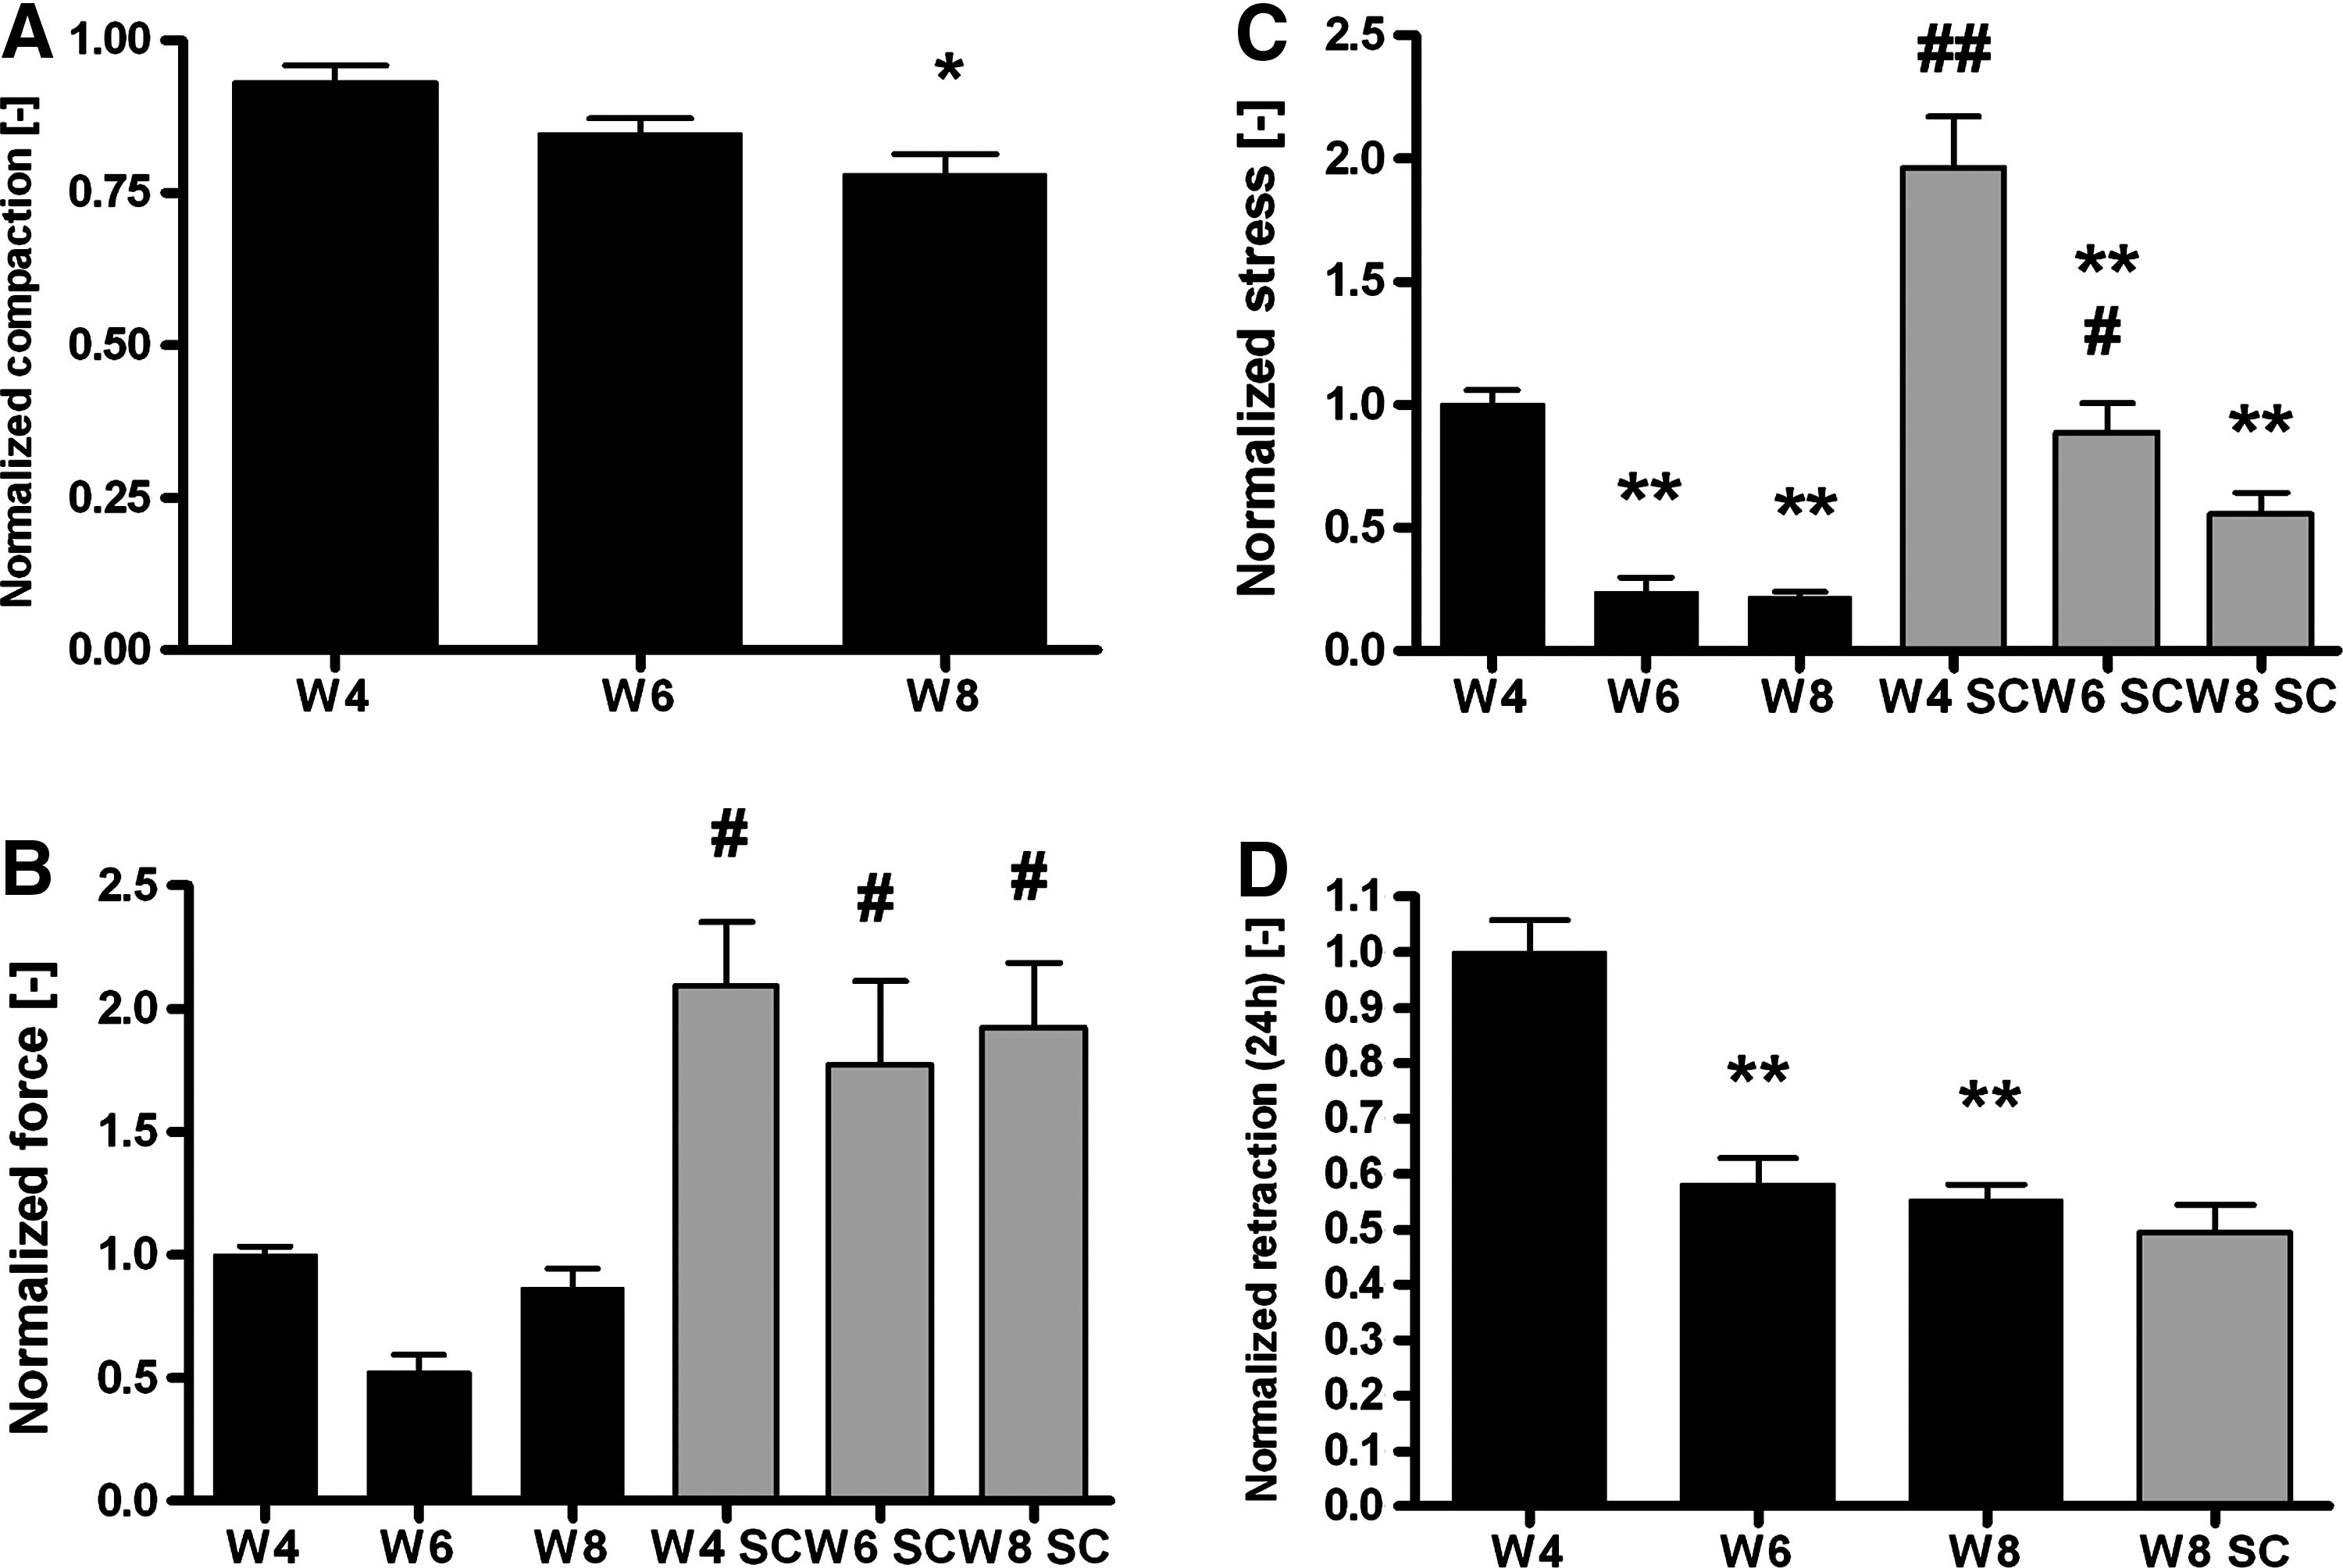
Normalized compaction
To examine the correlations between force and stress generation, retraction, and tissue properties, the absolute values of both runs have been combined. Force was positively correlated to the amount of collagen (R 2 =0.27, p<0.01) and collagen cross-links (R 2 =0.13, p<0.05). Stress was found to be positively correlated to retraction (R 2 =0.17, p<0.01) and the amount of cross-links (R 2 =0.13, p<0.05). Retraction was negatively correlated to the amount of GAGs (R 2 =0.15, p<0.05).
Discussion
Severe tissue retraction in TE heart valves at the time of implantation results in loss of functionality, as it prevents closing of the valve during diastole.3,15 Therefore, it is important that the cell-mediated processes of stress development and retraction are investigated and controlled. This study has focused on the evolution of both tissue properties and traction forces of the cells. The novelty of the current study is that it measures both stress and retraction from one single construct during a prolonged culture period of 8 weeks. The development was monitored continuously in semiconstrained configurations during culture and at defined time points (weeks 4, 6, and 8) in constrained configurations after release of constraints.
Diminished stress and retraction in prolonged tissue culture
In general, cell traction-related studies focus on force generation and compaction6–9,27 instead of stress generation and retraction. Furthermore, comparisons are commonly made among different conditions instead of time points. In this study, tissue stress and retraction were found to change over time. Tissue stress developed after 2 weeks of culture and increased up to week 4. In both constrained and semiconstrained configuration, tissue stress decreased at weeks 6 and 8 compared to week 4. Retraction after release of constraints also decreased at weeks 6 and 8 compared to week 4. These decreases in stress and retraction are positively correlated. Hence, increasing culture time up to a certain time point has the potential to reduce tissue retraction at the time of implantation. However, no differences were observed between weeks 6 and 8 in tissue stress and retraction, indicating that a balance was reached at week 6, and prolongation of the culture period had no added value. This means that for this system, the optimal culture period is 6 weeks.
The contribution of GAGs in decreased stress and retraction
The amount of GAGs within the TE constructs increased at weeks 6 and 8 compared to week 4. Macroscopic tissue observations revealed a fibrous surface layer around the tissue at week 6 and 8, which was confirmed by histology. Most likely, this surface layer predominantly consists of GAGs, as this is the only tissue component increasing over time. Due to this GAG formation around the denser inner tissue, tissue thickness increased drastically between weeks 4 and 6. The effect on tissue width was less, although compaction also significantly decreased at week 8. The resulting increase in the cross-sectional surface area caused a decrease in stress. Therefore, the increase in GAGs indirectly affected the measured stress.
The amount of GAGs was negatively correlated to the amount of retraction. We hypothesize that GAGs either cause decreased traction forces of the cells, due to decreased stiffness of their surroundings, or exert a resistance to compression, which counteracts with the traction forces of the cells. Two-dimensional cell studies showed that α-SMA organization and focal adhesions size, both related to the contractile state of myofibroblasts, are regulated and increased by substrate stiffness.28–30 However, both generated force and α-SMA content remained constant after week 4 in this study. GAGs form proteoglycans, which are negatively charged and attract water. This combination of proteoglycans and water protects the tissue against compression and confers a degree of shock absorbance. 31 Therefore, the resistance to compression by GAGs might counteract the traction forces of the cells. The absorption of water depends on the number of GAG chains and the type of GAG. We measured the amount of sulfated GAGs, while the nonsulfated GAG hyaluronan also plays a key role in this entrapment of water. 31 Striving to the production of the right type and amount of GAGs seems a promising approach to reduce tissue retraction.
Force generation in tissue
Force was generated after 2 weeks and increased up to week 4 after which it reached its final level. Four weeks to reach a constant force level is long compared to the 8–72 h6,8,32 it takes fibroblast seeded in collagen lattices to reach an internal stress balance. This difference is likely caused by the stiff scaffold material used in these experiments, which abolishes the traction forces of the cells during the first 2 weeks. When the scaffold degrades and the cells have generated their own ECM, the interaction among scaffold, tissue, and cells changes. This process starts at week 2 and reaches equilibrium at week 4. In collagen lattices, the ECM is already provided and does not change over time. Therefore, this interaction between cells and ECM reaches equilibrium more rapidly in these gel systems compared to our TE constructs.
To compare the generated force measured in this study, to values found in literature, we have normalized the total force to the amount of cells present in the TE constructs at the time of sacrifice. In the present study, the generated force per cell ranged from 4 to 25 nN. The generated force is known to depend on cell source,6,8 isolation method, 6 and cell density,8,27 explaining the wide range found in literature. The values found in the present study are within the wide range of values and closest to the estimated individual forces reported by John et al. (fibroblasts: 17–100 nN), 8 Freyman et al. (fibroblast: 3nN). 33 and Legant et al. (NIH 3T3 cells: 14–24 nN), 9 which were all performed in semiconstrained setups with bending beams of varying stiffness.
The generated force positively correlated to the amount of collagen. Furthermore, generated force and stress both positively correlated to the amount of collagen cross-links. Legant et al. showed that increasing collagen density leads to increased force generation, but decreased compaction, whereby stress decreased. 9 In TE blood vessels made of the PGA scaffold seeded with porcine smooth muscle cells, it was shown that the force required to maintain the original length of the vessel was less after 7.5 weeks of culture compared to weeks 5 and 6. 34 These findings were contributed to decreased contributions of axial collagen. The present study confirms these correlations between force and collagen content, but they are opposite from our hypothesis. As collagen and collagen cross-links provide the ECM with strength, 35 it was expected that increased collagen and collagen cross-link content would make the ECM less susceptible to traction forces, which would result in lower force and stress levels. However, traction forces exerted by the cells are known to depend on the stiffness of their surroundings.36,37 Such changing traction forces were not taken into account in our hypothesis, emphasizing the complex interplay between matrix properties and cellular behavior.
Variations in data and experimental set-up
Force and stress generation were larger in the semiconstrained than in the constrained configuration. Both Legant et al. 9 and John et al. 8 observed that generated force per cell increases with increasing stiffness of the boundary conditions, while Freyman et al. 33 published that the contractile forces of fibroblast are independent of the stiffness, which resists the contraction. As the constrained configuration is infinitely stiff, our results are inconsistent with these studies. It is hypothesized that this difference with literature is due to the possibility of some matrix remodeling in the constrained direction in the semiconstrained samples. If the constrained samples would be set to semiconstrained configuration after 4 weeks of culture, reorganization to a new equilibrium might result in force levels equal to those measured in the semiconstrained samples at week 4, if only one would wait long enough.
The runs showed similar trends over time, but different absolute values. This difference could be caused by the final amount of cells, as increasing cell density has shown to increase compaction1,27,38 and force generation. 38 In the first run, the final amount of cells was higher, although initial seeding density was similar, the tissues compacted more, and the generated stress and force were higher. In retrospect, the leaf springs in the model system, in which the engineered tissues were cultured to quantify stress generation and compaction, could have been stiffer to reduce remodeling-induced shortening of the tissues that may have influenced force and stress generation. 10
Translation to heart valve tissue engineering and conclusion
As a high-throughput model system was required to examine tissue retraction, TE rectangular strips were used as a representative for a TE heart valve. The geometry of a TE heart valve is complex, and the translation from a rectangular strip to a heart valve leaflet is not straightforward. The model system has shown to be a valuable tool to investigate tissue retraction, but eventually, retraction has to be investigated in heart valve leaflets. During culture, the heart valve leaflets are constrained in all directions, and tissue retraction after separation of the leaflets is restricted, as the leaflets remain constraint in the circumferential direction. Computational modeling could provide insight into tissue stress, compaction, and retraction in heart valve leaflets and should be performed next to the experimental work.
In the current experiments, GAGs formed a fibrous surface layer with prolonged tissue culture that increased tissue thickness over time. Thickening of the TE leaflets is undesired, as it would reduce flexibility. In native heart valve leaflets, GAGs are predominantly found in the middle, spongiosa layer of the leaflet, 39 rather than at the surface as in the engineered tissues in this study. Although GAGs decreased retraction, excessive GAG formation is undesired, and a balance of the right type and amount of GAGs at the proper location is required. To avoid thick leaflets and still be able to have the positive effect of GAG increase, the use of a thinner scaffold material is being explored to decrease the initial thickness of the tissue. In addition to GAGs, the presence of an elastic matrix, an important component of native heart valves, may well influence traction forces and retraction, but is currently lacking in vascular and valvular-engineered tissues based on human adult cells.39–41
This study emphasizes the complex interplay among cells, ECM, and scaffold within engineered heart valve tissues during a prolonged culture period of 8 weeks. Overall, this interplay reached equilibrium for the generated force and the amount of DNA, collagen, and collagen cross-links after 4 weeks of culture, while tissue total stress and retraction decreased after week 4. This decrease in stress and retraction is most likely caused by the increased amount of GAGs within the TE constructs, showing that changes in tissue composition can affect the resulting retraction. These results indicate the potential of prolonged tissue culture and GAG formation to reduce tissue stress and retraction to fabricate functional nonretracting leaflets.
Footnotes
Acknowledgments
The authors gratefully acknowledge the support of the Smart Mix Program of the Netherlands Ministry of Economic Affairs and the Netherlands Ministry of Education, Culture and Science. The authors like to thank Marloes van den Broek and Jessica Snabel for performing the biochemical assays.
Disclosure Statement
No competing financial interests exist.