
Abstract
Aim:
Biomaterials that mimic the nanofibrous architecture of the natural extracellular matrix (ECM) are in the focus for stem cell hosting or delivery in tissue engineering of multilayered soft tissues such as skin, mucosa, or retina. Synthetic nanofibers for such ECM are usually produced by single-syringe electrospinning with only one needle-jet at very low production rates of 0.005–0.008 g·min−1. The aim of this study was to utilize a novel industrial needle-free multijet electrospinning device with the potential for mass production of nanofibrous ECM (NF-ECM) exhibiting a controlled three-dimensional (3D) morphology for large-scale applications such as large area skin regeneration in patients with burns.
Methods:
The novel NanoSpider™ NS200, an industrial apparatus originally designed for electrospinning of nanofibrous textile meshes, was used to fabricate 3D NF-ECMs of the following synthetic and natural biopolymers: collagen, gelatin, poly(caprolactone) (PCL), and poly(
Results:
Large-scale mass production of NF-ECM membranes with a highly homogenous nanofiber morphology and 3D architecture could be produced with an extremely high production rate of 0.394±0.013 g·min−1·m−1 when compared to standard procedures. This was achieved by electrospinning a 20% wt/v gelatin solution, in an electric field intensity of 0.381 kV·mm−1. The nanofibers possessed diameters of around 180±40 nm with 28% deviation. HSMCs proliferation was significantly improved on NF-ECMs derived from collagen, gelatin, and PLGA when compared to PCL or flat coverglass controls (p<0.01). PLGA NF-ECM in 3D nanofibrous architecture possessed significantly superior biocompatibility when compared to flat 2D PLGA film (p<0.05). Furthermore, on 3D PLGA NF-ECMs, HSMCs expressed a higher amount of α-tubulin and paxillin compared to the HMSCs cultured on a 2D PLGA film (p<0.05). HMSCs exhibited a complex multifaceted morphology on all NF-ECMs, where cells appeared to be integrated into the 3D NF-ECMs niches with complex cell filopodia extending into to all directions. In contrast, HMSCs on flat 2D films of the same materials or on coverglass displayed a simple flattened, monolayered structure.
Conclusion:
Needle-free multijet electrospinning can be used to mass produce artificial ECMs with intrinsic biocompatibility and desirable integration of stem cells for large-scale applications.
Introduction
The natural ECM consists of a complex morphology for cell integration and tissue function. Microscopic observation of the natural ECM of soft connective tissue usually reveals a three-dimensional (3D) nanofibrous meshwork architecture, comprising of collagen, reticular, and elastin fibers. This type of architecture is characteristic for the dermal layers of human skin. Collagen is the major constituent of natural ECM while forming collagen bundles of 1–20-μm thickness that are itself composed of densely packed collagen fibrils of 30–100-nm thickness. 5 Artificial production of such small collagen fibers will require nanotechnology, as the subcellular levels are addressed on the nanoscale.
Emerging new technologies in electrospinning that are derived from industrial nanofiber production have gained attention of tissue engineers, as these methods can also be used to process naturally degradable biopolymers such as collagen or gelatin, besides others.6,7 Electrospinning is a process by which a high voltage is applied to a polymer solution to create an electrically charged jet of polymer solution as a means to fabricate nanoscaled fibers or nanofibers. 8 Usually a polymer solution is delivered through a single syringe/needle setup and driven by an electrical field. When the applied voltage (v) reaches a critical value, the polymer fluid jet propels from the needle. The polymer solution is stretched in the electric field, leading to the formation of polymer nanofibers, which are collected on a grounded collector. 8
Such needle-depending electrospinning has gained much attention over the past decade as a valuable method for producing nanofibrous membranes.9–12 However, this technique is limited to its low production rate (0.0017–0.017 g.min−1 from a single syringe), which is greatly influenced by the solution properties and processing parameters.13,14 Conventionally, using this technique, the production rate can only be slightly increased by raising feed-rate and polymer solution concentration. This in turn increases the fiber diameter, 15 which may hinder the crucial nanometer diameter as found in the native ECM. There have been a vast number of studies, attempting to increase the production rate of needle electrospinning, which focus on using an array of needles. 16 However, these techniques, as well as being labor intensive, lead to nonuniform electric fields, resulting in discontinuous operation and nanofibers with undesirable morphology such as high deviation in their diameter.14,17
In contrast, a modified, probably clinically advantageous, electrospinning technique developed by Yarin and Zussman 18 initiates electrospinning not from a single needle, but from a free surface of a liquid, which allows for formation of multiple nanofiber jets at the same time, resulting in a high production rate of nanofibers in a simple and controlled manner.9,14,18–21 This technology led to the development of the NanoSpider™ device that applies needle-free multijet electrospinning with potential for large-scale production of industrial nanofibrous textile membranes in the fields of air and liquid filtration, noise absorption, and energy conversion. 22
Therefore, it is of interest if such a large-scale industrial production system could probably be operated for mass production of an artificial biological ECM. Even though the principal method appears to be feasible, there is a need for investigation to the defined processing parameters and their application for operation in designing and mass production of an artificial biocompatible nanofibrous ECM (NF-ECM).
Our overarching goal is to mass produce a 3D NF-ECM for clinical applications and regenerative medicine with the novel NanoSpider™ device. First, we aimed to identify the effect of processing parameters on NF-ECM production, such as speed of spinning electrode rotation (u), electric field intensity (E), a function of the applied voltage (v) or the distance between the electrodes (h), and solution concentration on the production rate and the morphology of the fabricated NF-ECM. Secondly, we aimed to mass produce NF-ECMs, made from natural (collagen and gelatin) and synthetic (poly(caprolactone) [PCL] and poly(L-lactic-co-glycolide) [PLGA]) biopolymers. Lastly, we aimed to demonstrate the biocompatibility of the 3D NF-ECMs fabricated by needle-free electrospinning, and to assess their effect on integration of human mesenchymal stem cells (HMSC) by measuring the expression of surface adhesion proteins and the morphology of HMSC.
Materials and Methods
Mass production of 3D NF-ECMs through needle-free electrospinning
To investigate the processing parameters and their effect on the production rate, type A bovine gelatin (Sigma Aldrich) solutions with a final concentration of 15.0%, 17.5%, and 20.0% wt/v in 70% v/v acetic acid (Sigma Aldrich) in distilled water were prepared.
To assess the biological performance of NF-ECM, PLGA with a molar ratio of 85:15
A novel industrial apparatus designed for electrospinning nonwoven textile filters, the NanoSpider™ NS200 (Elmarco), was utilized to fabricate 3D NF-ECMs from biopolymers. The device was operated in a clinical-grade clean room facility with controlled environment. Figure 1 displays the apparatus of this needle-free electrospinning that allows for a multijet spinning. The pike electrode was used to test the ability of the polymer solution to be electrospun in a random 3D architecture. The pike electrode consists of a conical tip where 40 μL of the polymer solution was placed. Different processing parameters such as applied voltage and distance between the electrodes as well as the polymer solution concentration were changed and optimized to obtain the parameters that allow for fabrication of nanofibers with a similar fiber diameter and uniformity.

Needle-free-electrospinning of nanofibers.
The drop-on-wire system was used to fabricate gelatin, PCL, and PLGA NF-ECMs (due to the high cost of collagen, the pike spinning electrode [SE] was used to fabricate the collagen NF-ECM). Drop-on wire utilizes a wire-SE that is partially immersed in a bath containing 300 mL of the polymer solution (Fig. 1b). The wire-SE consisted of six wires with diameter of 200 μm that were fixed 19 mm apart on the SE that itself had a diameter of 38 mm and length of 200 mm. Upon rotation of SE, the wires rotate out of the polymer solution, where they carried a thin deposition of the polymer solution. Taylor cones were formed in response to the potential difference created by the charges applied in the polymer solution. A grounded metallic cylinder was used as the collecting electrode, and a polypropylene substrate fabric in direct contact with the collecting electrode was used to collect the fabricated NF-ECMs (Fig. 1a). The process was carried at u of 4.8 rpm, h of 210 mm, and v of 25–40 kV at 18°C.
Polymer solution concentration
Gelatin solution with concentrations of 15.0%, 17.5%, and 20.0% wt/v in 70% v/v in acetic acid were electrospun for 10 min at the E of 0.333 kV.mm−1 (v of 70 kV and h of 210 mm) and u of 4.8 rpm. The gelatin solution was changed after collecting a repeat of each polymer solution concentration, and the process was repeated until a total of three repeats of each polymer solution were collected. The samples were placed in a vacuum oven at room temperature for 24 h before they were weighed and fixed for scanning electron microscopy (SEM) imaging.
Electric field intensity (E)
The E is a function of v divided by h and is expressed at kV·mm−1. The E was increased from 0.190 kV·mm−1 to 0.820 kV·mm−1, by either increasing the v in the following steps 40, 50, 60, 70, 80, and 82 kV or by decreasing the h from 210 mm to 180 mm to 140 mm and finally to 100 mm. The 20.0% wt/v gelatin solution at u of 4.8 rpm was electrospun at different E. The process was carried out for 10 min for each repeats, and a total of three repeats were collected at each E. The samples were allowed to vacuum-dry at room temperature and analyzed for their weight and their morphology.
Speed of spinning electrode rotation (u)
The 15.0%, 17.5% and 20.0% wt/v gelatin solutions were electrospun at E of 0.333 kV·mm−1 (70 kV at 210 mm), at a various u. The u was increased by 1.6-rpm steps from 1.6 rpm to 16.0 rpm.
Applied voltage (v)
The 20.0% wt/v gelatin at u of 4.8 rpm at h of 210 mm was electrospun at different v. The v was increased by 10 kV steps from 40 kV to 80 kV and finally to the maximum permissible v of 82 kV.
The distance between the electrodes (h)
The 20.0% wt/v gelatin at u of 4.8 rpm and v of 70 kV was fabricated at various h. The h was increased from 100 mm to 140 mm to 180 mm and finally to 210 mm, the maximum distance allowed by the NanoSpider™.
Characterization of NF-ECMs
A total of three repeats of each electrospun membrane were gold coated using a sputter gold coater (Jeol) and examined using a Neoscope JCM-5000 Jeol scanning electron microscope (Jeol). The SEM images were analyzed using ImageJ (the U.S. National Institute of Mental Health, Bethesda) for their morphology, nanofiber diameter, and uniformity. The diameter of 100 nanofibers in random was measured, and the average fiber diameter was calculated along with the deviation in fiber diameter.
PLGA film
PLGA solution in HFIP with a final concentration 10% wt/v was prepared and casted into a flat 2D film without nanofibrous architecture. The PLGA film was prepared by directly pouring the polymer solution on a glass surface and then placed on a shaker to ensure an even spreading of the solution. The PLGA film was allowed to air-dry for 24 h before storage in a desiccator at room temperature. The 2D films served as the control.
Isolation, cultivation and, characterization of HMSCs from bone marrow
HMSCs were used to assess the biological properties of NF-ECMs, film, and coverglass. The HMSCs were harvested from human bone marrow of a 21-year-old man. The study was approved by the ethics committee of the Bond University (Queensland, Australia, ethic approval number RO1333) and of the Medical Faculty of Christian-Albrechts-University of Kiel (Kiel, Germany, ethics approval number AZ402/07). HMSCs were isolated and cultivated according to Bartmann et al. 25 Multiparameter flow cytometry and in vitro differentiation assays were used to characterize these cells as per Dominici et al. 26
Biocompatibility (WST-1 assay)
NF-ECMs and film were cut into appropriate sizes and mounted on CellCrown24 or CellCrown6 (Scaffdex Oy). The cell crowns along with coverglass (ThermoFisher) were placed into 24-well plates or 6-well plates. Collagen and gelatin NF-ECMs were cross-linked immediately after fabrication. 1-ethyl-3-(3-dimethylaminopropyl)-carbodiimide (ThermoFisher, Victoria, Australia) and N-hydroxysulfosuccinimide (ThermoFisher) cross-linking reagents were used as previosly described by Alamein et al. 20 The mounted membranes were sterilized by 25-kGy gamma irradiation.
Briefly, NF-ECMs, film, and coverglass were rinsed with 1 mL phosphate-buffered saline (PBS) and then immersed with alpha-minimum essential medium (α-MEM) overnight at 37°C. A total of 1×10⁴ (passage 3) HMSCs in 50 μL complete medium (αMEM; 10% fetal calf serum, 1% P/S, and 2.2 g/L sodium bicarbonate) were pipetted into each well. The cells were left to adhere for 30 min and then supplemented with 1 mL fresh complete medium and incubated (humidified incubator at 5% CO2, 37°C).
The rate of proliferation of HMSCs seeded on NF-ECMs, films, and coverglass was used to evaluate their biocompatibility and was assessed by the WST-1 reagent (Roche Diagnostics). WST-1 is colorimetric technique for quantifying cell proliferation and viability. Cleavage of tetrazolium salt by mitochondrial dehydrogenases in viable cells yields formazan, the absorbance of which can be detected at 460 nm.27,28
Six repeats of each NF-ECM were tested on each of days 2, 5, and 8 postseeding. On the day of test, the old medium was replaced with 1 mL of fresh HMSC medium containing 10% WST-1 and returned to the incubator for 90 min. The medium was then transferred to a 96-well plate, and absorbance at 460 nm was measured by a spectrophotometer (Turner Biosystems). Respective films and coverglass were used as controls.
SEM examination
A total of four repeats of each NF-ECM, film, and coverglass for day 2 and day 8 of the experiment were seeded as per biocompatibility assays. The samples were fixed with 3% glutaraldehyde in PBS solution for 30 min, sequentially dehydrated in 30%, 50%, 70%, 90%, and 100% ethanol in PBS for 10 min, and then rinsed twice with hexamethyldisilazane to complete dehydration. All samples were coated using a sputter gold coater and examined using a Neoscope JCM-5000 Jeol scanning electron microscope.
Confocal microscope
Cells were seeded as per biocompatibility assays. A total of two repeats on day 2 postseeding, the HMSCs seeded on NF-ECMs, films, and coverglass were fixed with 3.7% paraformaldehyde in PBS solution for 10 min. The samples were permeabilized with 0.1% Triton X-100 (Sigma Aldrich) in PBS solution, blocked using 3% bovine serum albumin in PBS solution, and incubated for 60 min with 1/1000 Hoechst (Invitrogen), 1/400 rhodamine phalloidin (Invitrogen), and 1/1000 mouse anti-paxillin (Sigma Aldrich). The primary antibody was washed, and the secondary antibody Alexa-Fluor-488 goat anti-mouse (Invitrogen) was reacted for 60 min to detect paxillin. The images were obtained with a Nikon C1 confocal microscope (Nikon).
Protein expression
Cells were lysed using RIPA buffer, and the soluble protein lysate was collected by dicing the membrane in lysate solution and quantified using the BCA Protein Assay Reagent (Thermofisher Scientific). About 15 μL of total protein lysate was loaded per minigel well. Monoclonal mouse antibodies were used to analyze relative protein quantities by chemiluminescent assay (ThermoFisher Scientific), and the results were visualized by a Universal Hood II (Bio-Rad). Antibodies and dilutions were paxillin 1/500 (Sigma Aldrich), vinculin 1/500 (Abcam), phosphorylated focal adhesion kinase (FAK) 1/250 (BD Biosciences), FAK 1/250 (BD Biosciences), GAPDH 1/2000 (Abcam), and α tubulin 1/500 (Invitrogen). Quantity One 1-D analysis software (Bio-Rad Laboratory, Inc., version 4.6.7) was used to quantify the band. Three repeats for each sample was quantified, and the Student's t-test was used to calculate the significant differences in the expression of the selected proteins on HMSCs cultured on PLGA film and PLGA NF-ECM.
Statistics
The data collected from analyzing SEM images and WST-1 tests were assessed for significant differences by Student's t-test and confirmed by LSD post hoc analysis (SPSS statistics version 19; IBM). The statistical significance was presented as *p<0.05, **p<0.01, and ***p<0.001. Error bars show the standard error of the mean.
Results
Mass production of 3D NF-ECMs through needle-free electrospinning
We were able to produce NF-EDM on a large scale in a short time. The maximum production rate of 0.3937±0.050 g·min−1·m−1, without compromising the NF-ECM morphology, was obtained, at an E of 0.381 kV·mm−1 (d of 210 mm, v of 80 kV) at u of 4.8 rpm. At this electric field intensity, the fabricated membranes possessed thin nanofibers 179±50 nm, with total deviation of 27.8%±4.0%. A 60-min, uninterrupted production process of 20% w/v gelatin using these parameters resulted in 0.88 m2 of NF-ECM, 100±40-μm thick (Fig. 2a, b, and c).

Mass production of gelatin nanofibrous extracellular matrix (NF-ECM). Artificial gelatin NF-ECM mass produced from a 20% wt/v gelatin solution at an electric field intensity of 0.381 kV·mm−1.
Polymer solution concentration
The production rate was increased significantly as the concentration of gelatin in the solution was increased. The production rate at different solution concentration was investigated at h of 210 mm, v of 70 kV, and u of 4.8 rpm. The production rate increased 120% when the polymer solution was increased from 15% w/v gelatin to 17.5% w/v gelatin (0.070±0.112 g·min−1·m−1 and 0.162±0.002 g·min−1·m−1, respectively). The production rate was increased by 300% to 0.279±0.071 when the concentration was raised to 20% w/v gelatin (Fig. 3).
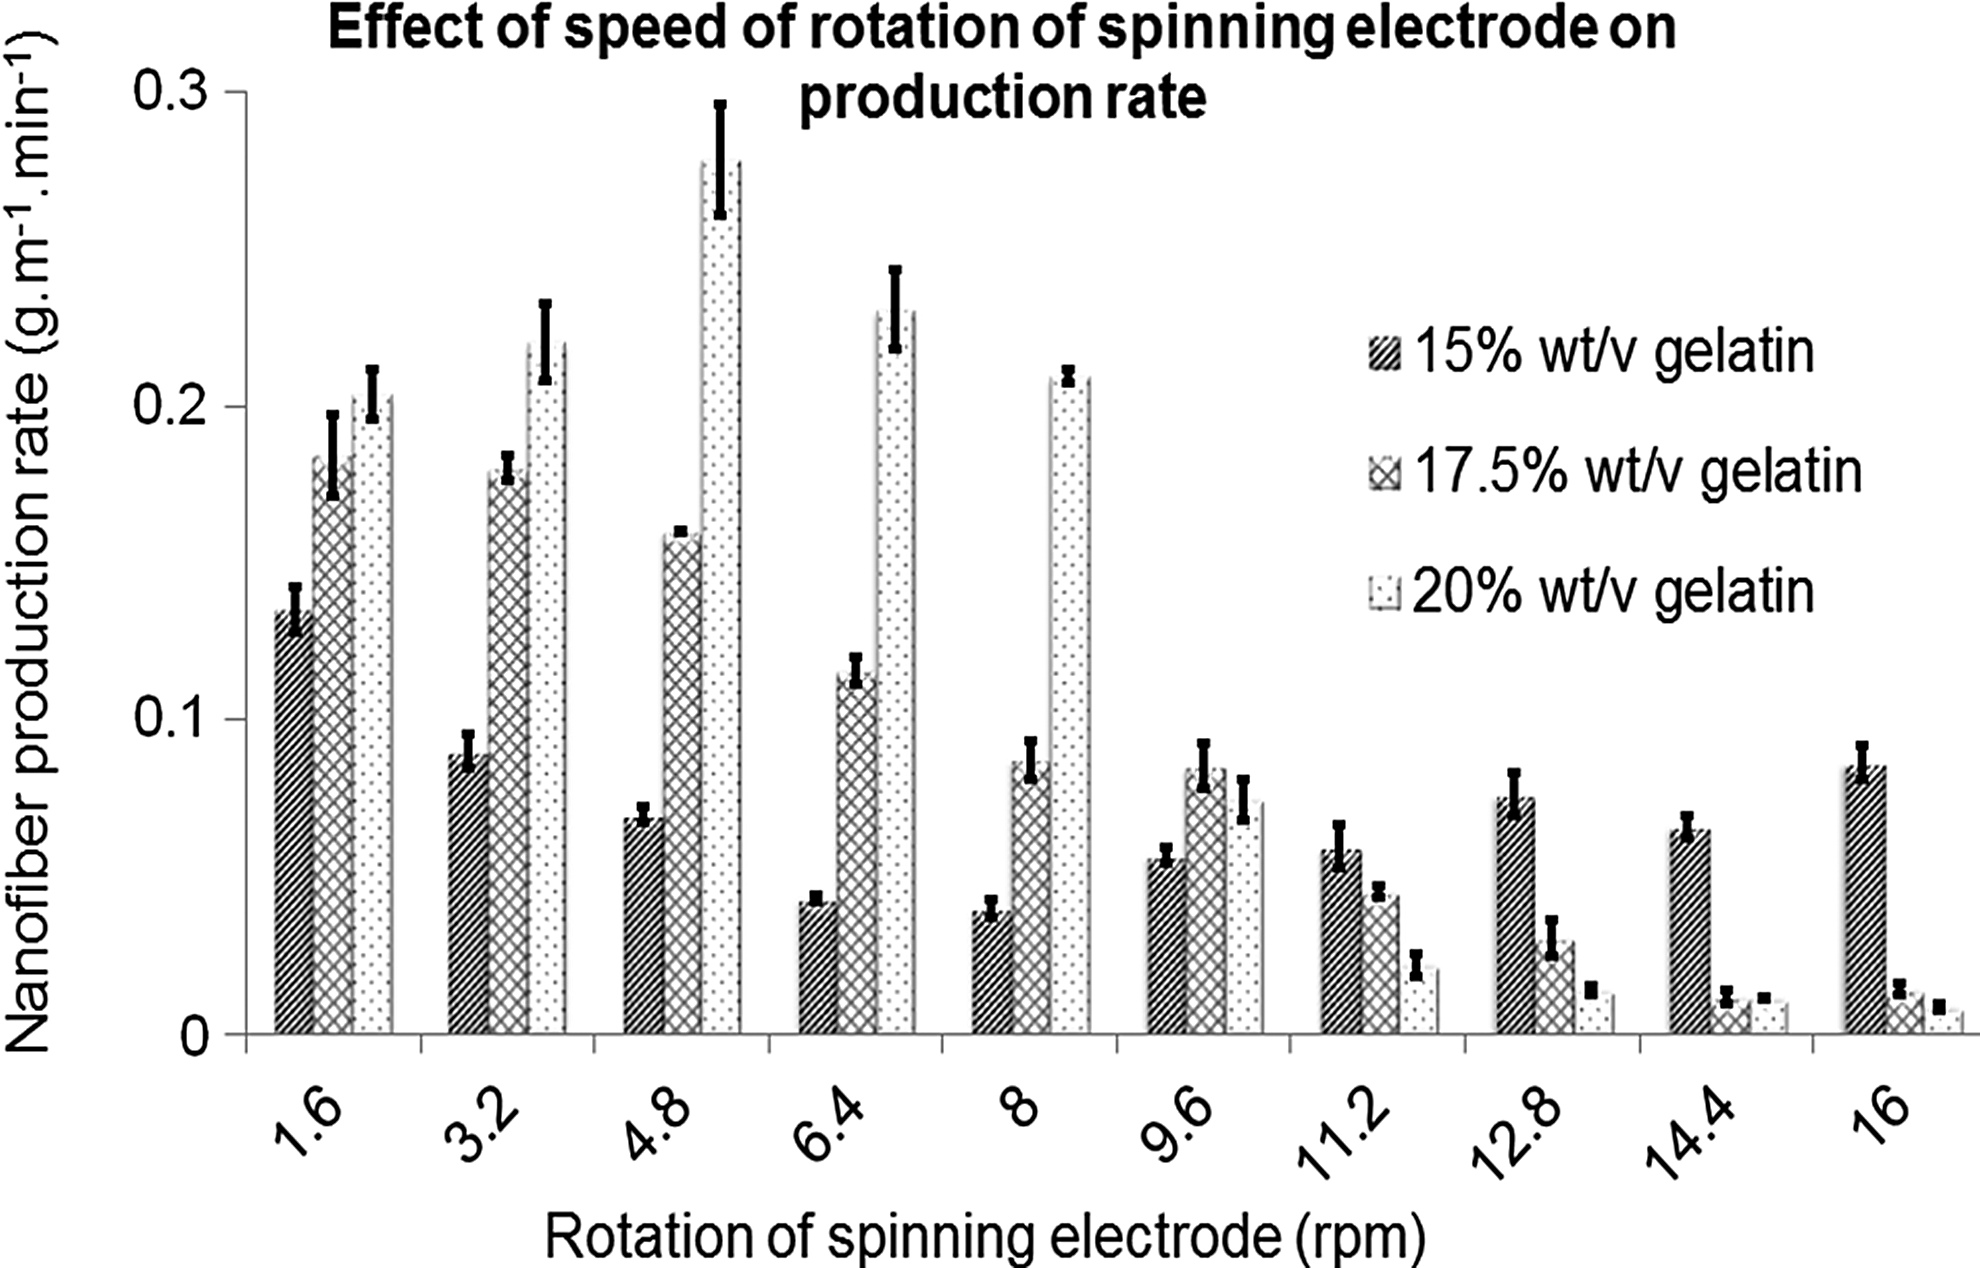
Effect of the rate of the rotation of the spinning electrode on the production rate of t nanofibers. The graph illustrates the production rate of electrospun 15.0%, 17.5%, and 20.0% wt/v gelatin in applied voltage of 70 kV. The distance between the electrodes was set to 210 mm at various-speed wire-spinning electrode rotation. For all gelatin solution, the highest production rate was obtained for at slower rotation rates. 20% wt/v gelatin fabricated at 4.8 rpm provided the maximum production rate.
The average fiber diameter was increased from 141±51 nm to 195±53 nm and 235±100 nm when the gelatin concentration in solution was increased from 15% w/v to 17.5% w/v and 20% w/v gelatin, respectively. Furthermore, the deviation in fiber diameter fluctuated from 36.0%±1.8%, 27.2%±1.5% to 45.7%±16.1% in response to increase solution concentration (Fig. 5a).
Electric field intensity (E)
The electrospinning was initiated once the E exceeded 0.190 kV·mm−1, at which point the production rate was at its minimum 0.003±0.0007 g·min−1·m−1 (Fig. 4). Slight increases in the field intensity resulted in a significant (p<0.001) increase in the production rate, approximating a third-order polynomial relationship. The maximum production rate of 1.358±0.03 g·min−1·m−1 was reached at 0.683 kV·mm−1, obtained by applying 82 kV at h of 120 mm (Fig. 4). The nanofibers obtained using these parameters had undesirable morphologies (Fig. 4c). The fibers were too thick, 530±341 nm, with deviation of 59.8%±8.7%, with most fibers merged into one another. An electric field intensity higher than 0.683 kV·mm−1 resulted in sparking discharges.
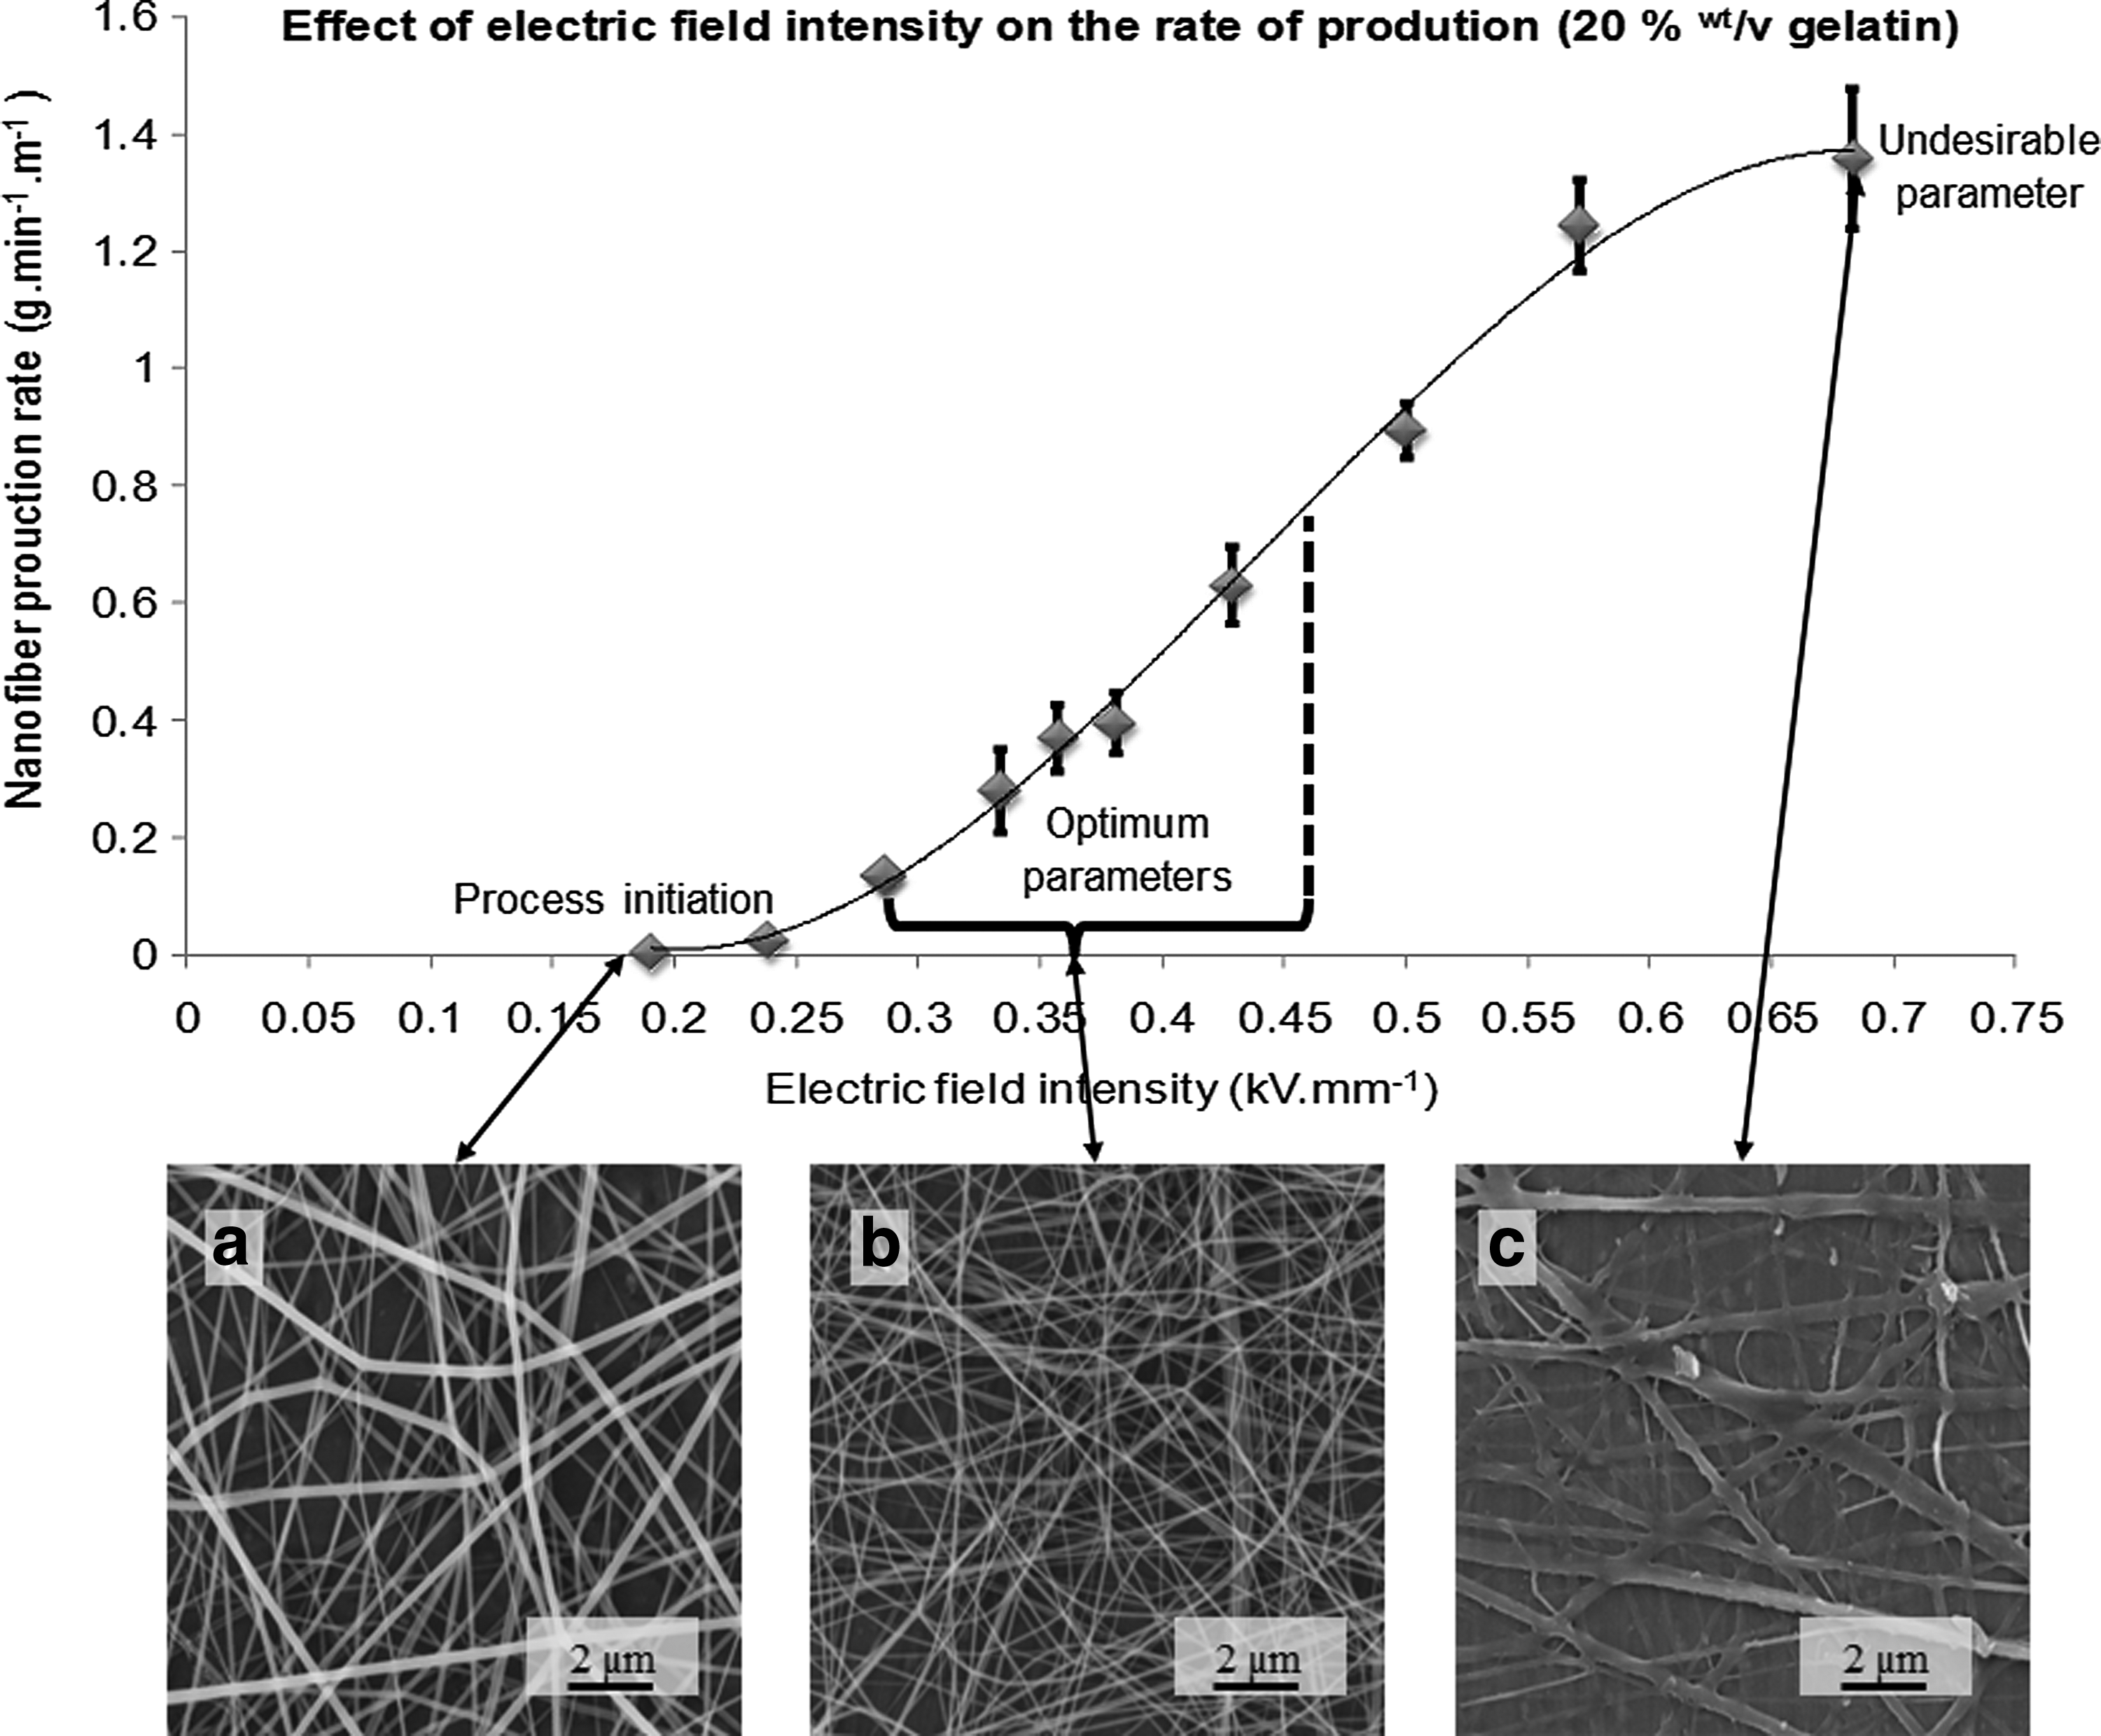
Effect of the electric field intensity on the production rate. The rate of production of 20% wt/v gelatin solution fabricated at various electric field intensities was calculated. The electric field intensity was increased by either increasing the applied voltage and/or decreasing the distance between the electrodes.
The effect of changing the h and v at a constant E was investigated. At a constant E 0.286 kV·mm−1 (v of 40 kV, 50 kV and 60 kV at 140 mm to 175 mm to 210 mm), no significant difference in fiber diameters and the deviation in fiber diameter were seen. The fiber diameter were 183±68 nm, 179±79 nm, and 176±68 nm with deviations of 37.0%±2.4%, 33.6%±6.0%, and 36.9%±1.7%, respectively (data not shown).
Speed of spinning electrode rotation (u)
The 15.0%, 17.5%, and 20% wt/v gelatin were electrospun at v of 70 kV at h of 210 mm, at variable u, to investigate the effect of u on the production rate and the morphology of the nanofibers. For the 15.0% wt/v solution, the production rate was at its highest 0.135±0.002 g·min−1·m−1 at 1.6 rpm. Increasing the u significantly decreased (p<0.001) the production rate (Fig. 3).
For the 17.5% wt/v gelatin solution, the maximum production rates of 0.184±0.013 g·min−1·m−1 and 0.180±0.004 g·min−1·m−1 were reached at the slowest u of 1.6 rpm and 3.2 rpm, respectively. The production rate significantly decreased (p<0.001) once the u exceeded to 4.8 rpm (Fig. 3).
For the 20% wt/v gelatin, the production rate significantly increased (p<0.05) from 0.204±0.008 g·min−1·m−1 to 0.220±0.012 g·min−1·m−1 when u was increased from 1.6 rpm to 3.2 rpm. The production rate was at its peak of 0.279±0.018 g·min−1·m−1 at 4.8 rpm. However, a further increase to the u resulted in a significant decrease in the production rate (p<0.001), and it reached its minimum production rate of 0.015±0.004 g·min−1·m−1 once u exceeded 12.8 rpm (Fig. 3).
There were no significant differences in fiber diameter and the deviation in fiber diameter as u was increased. The average fiber diameters were 164±67 nm, 200±80 nm, and 250±122 nm, and the deviations in fiber diameter were 49.8%±7.8%, 41.2%±3.4%, and 39.8%±2.0% nm for 15.0%, 17.5%, and 20.0% wt/v gelatin, respectively (data not shown).
Applied Voltage (v)
The effect of the v was measured via electrospinning 20% wt/v gelatin at the constant h of 210 mm at u of 4.8 rpm. The fiber diameter at v of 40 kV and 50 kV was 251±112 and 265±90 nm, respectively. As the applied voltage was increased to 60 kV, the average fiber diameter was significantly decreased (p<0.001) to 186±55 nm, and no significant differences were seen when the v was increased further to 70 kV, 80 kV, and 82 kV (Fig. 5b).
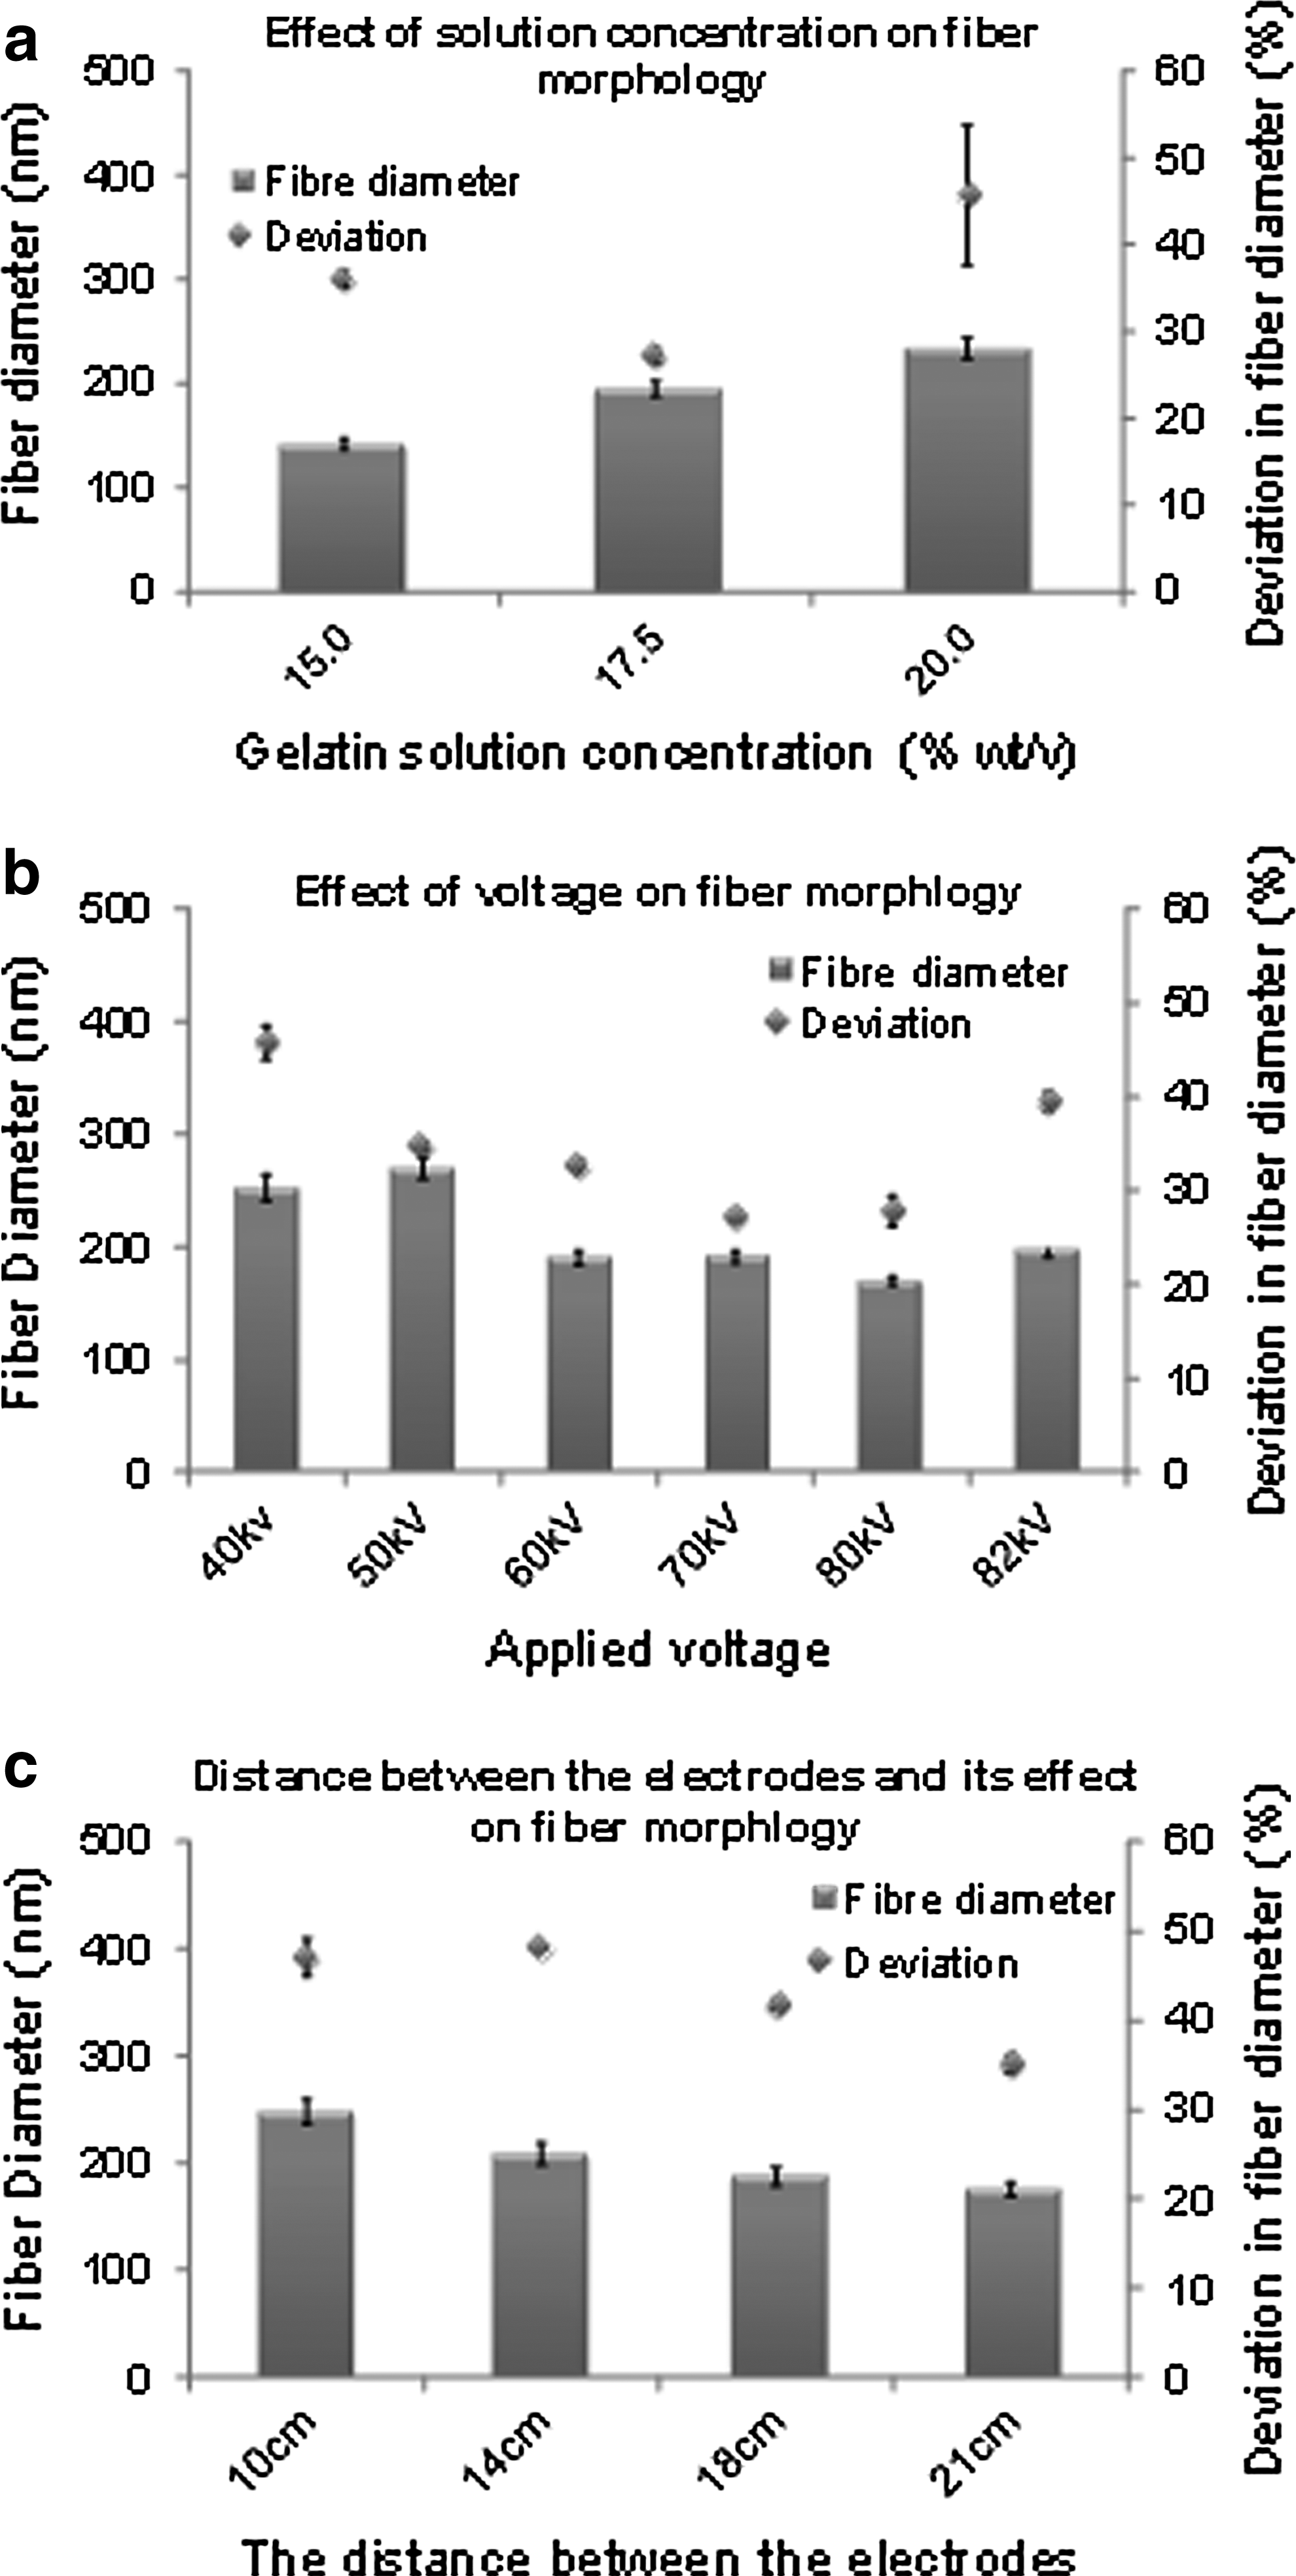
Effect of processing parameters on nanofiber morphology (diameters and deviation in diameters).
The deviation in fiber diameter was at its highest at 40 kV (45.8%±4.4%), and a sudden decrease (p<0.001) in deviation of the fiber diameter was seen as the voltage was increased to 50 kV (34.7%±1.1%). There was a further decrease in deviation of fiber diameters when the v was increased to 60, 70, and 80 kV (32.7%±1.6%, 27.2%±1.5%, and 27.8%±4.0%, respectively). However, at 82 kV, the deviation in fiber diameters had an abrupt increase up to 39.5%±2.2% (p<0.001) (Fig. 5b).
Distance between the electrodes (h)
The influence of changing h was assessed by electrospinning 20% wt/v gelatin at the constant v of 70 kV at u of 4.8 rpm. Increasing the h from 100 mm to 140 mm resulted in a significant (p<0.001) decrease in fiber diameter from 247±115 nm to 208±100 nm; however, the deviation in fiber diameter stayed steady at 47.0%±5.8% and 48.2%±5.5%. An increase in h from 140 mm to 180 mm (fiber diameter 187±79 nm) and then to 210 mm (fiber diameter 175±63 nm) did not result in significant changes in fiber diameter, however, resulted in significant (p<0.001) decrease in deviation in nanofiber diameter to 41.8%±1.5% for h of 180 mm and deviation of 35.1%±2.7% for h of 210 mm (Fig. 5c).
Characterization of NF-ECMs
Figure 8 shows the SEM micrograph of collagen, gelatin, PCL, and PLGA NF-ECMs as well as PLGA film. The needle-free multijet electrospinning method using the NanoSpider™ apparatus was capable of producing a 3D random nanofibrous network of artificial ECM. All NF-ECM had a mesh-like topography with high porosity forming open-structured accessible nanowebs with plentiful niche-like spaces.
The average fiber diameter, their uniformity, and the packing density were calculated by analyzing the SEM images of the NF-ECMs using ImageJ software. The average fiber diameter for collagen, gelatin, PCL, and PLGA NF-ECM was 436±165 nm, 762±236 nm, 455±152 nm, and 550±182 nm, respectively (Table 1). The deviation in fiber diameter for collagen, gelatin, PCL, and PLGA NF-ECM was 38.0%±14.5%, 30.9%±4.0%, 33.4%±3.0%, and 33.1%±9.7%, respectively (Table 1). The packing density for collagen, gelatin, PCL, and PLGA NF-ECMs was as follows: 21.4%±8.1%, 30.1%±15.4%, 40.1%±13.4%, and 12.9%±4.3%, respectively (Table 1).
The average diameter of nanofibers in each NF-ECM was measured, including standard deviation. The uniformity of the nanofibers is presented as percentage deviation in fiber diameter. The packing density shows the percentage concentration of the fibers across the scanning electron microscopy image of individual NF-ECMs.
NF-ECM, nanofibrous extracellular matrix.
PLGA film
The PLGA film offered a blunt surface that appeared nonporous and free of any particular nanotopography, unlike the niche that NF-ECM provides.
Isolation, cultivation, and characterization of HMSCs from bone marrow
The HMSCs were successfully isolated, cultured, and characterized. The HMSCs were positive for CD105, CD73, CD29, and CD90 and negative for CD45, CD34, CD14, CD19, HLA-DR, and 7-AAD (data not shown).
Biocompatibility (WST-1 assay)
All generated NF-ECM and film supported HMSC growth over 8 days (Fig. 6). In comparison to coverglass (0.453±0.040), collagen and PLGA NF-ECMs exhibited the highest proliferation rate with the absorbance value of 0.837±0.076 and 0.726±0.110 Au (p<0.001). Gelatin NF-ECM (0.565±0.070 Au) also showed a superior biocompatibility (p<0.01). HMSCs seeded on PLGA NF-ECM showed an improved proliferation rate compared to the 2D PLGA film that had an absorbance rate of 0.664±0.096 Au (p<0.05). PCL NF-ECM (0.478±0.046 Au) had an equivalent performance compared to coverglass (Fig. 6).
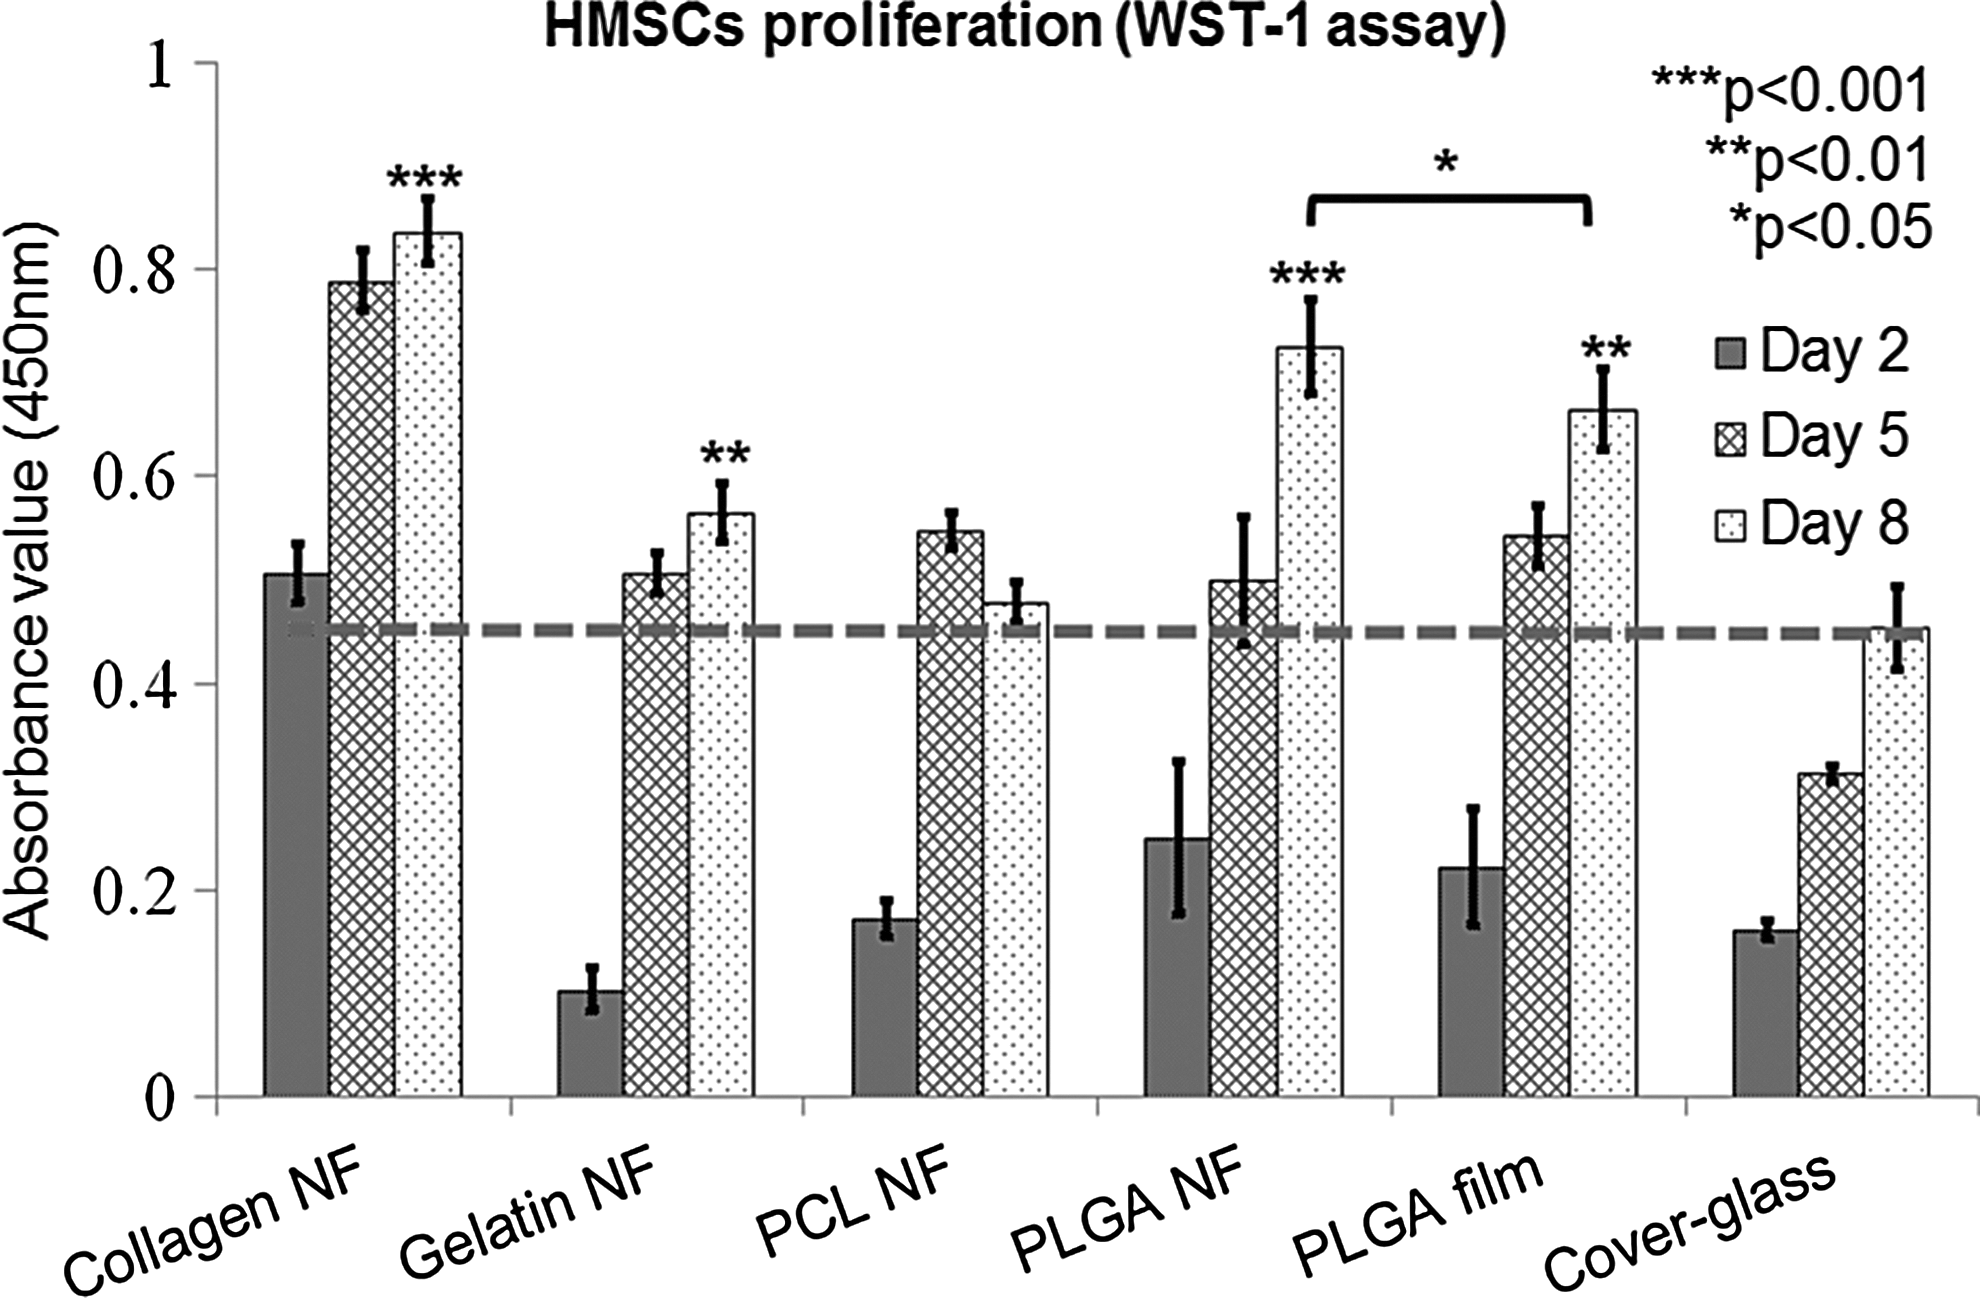
Biocompatibility of membranes. Proliferation of human mesenchymal stem cells (HMSCs) measured by WST-1 assay. Proliferation is proportional to measured absorbance at 450 nm. Various artificial NF-ECMs fabricated from gelatin, poly(caprolactone) (PCL), collagen, and poly(
SEM examination
Figure 8 shows sections of NF-ECMs, the PLGA film, and the coverglass 2 days after seeding. HMSCs on coverglass and 2D film lacked 3D depth, exhibiting a particularly flat structure. The cytoplasm was large and extended widely on the flat surface of the coverglass and film. HMSCs cultured on NF-ECMs showed a 3D structure, with firmly attached and integrated extensions within the NF-ECM mesh-network, hence losing the wide-spread flat cytoplasm seen on a 2D surface. While the densely packed gelatin NF-ECM minimized the cell integration, collagen, PCL, and PLGA NF-ECM with low packing density exhibited cell integrated within the 3D confinements of NF-ECM in a way that the nanofibrous network and the filopodial extensions were indistinguishable (Fig. 8).
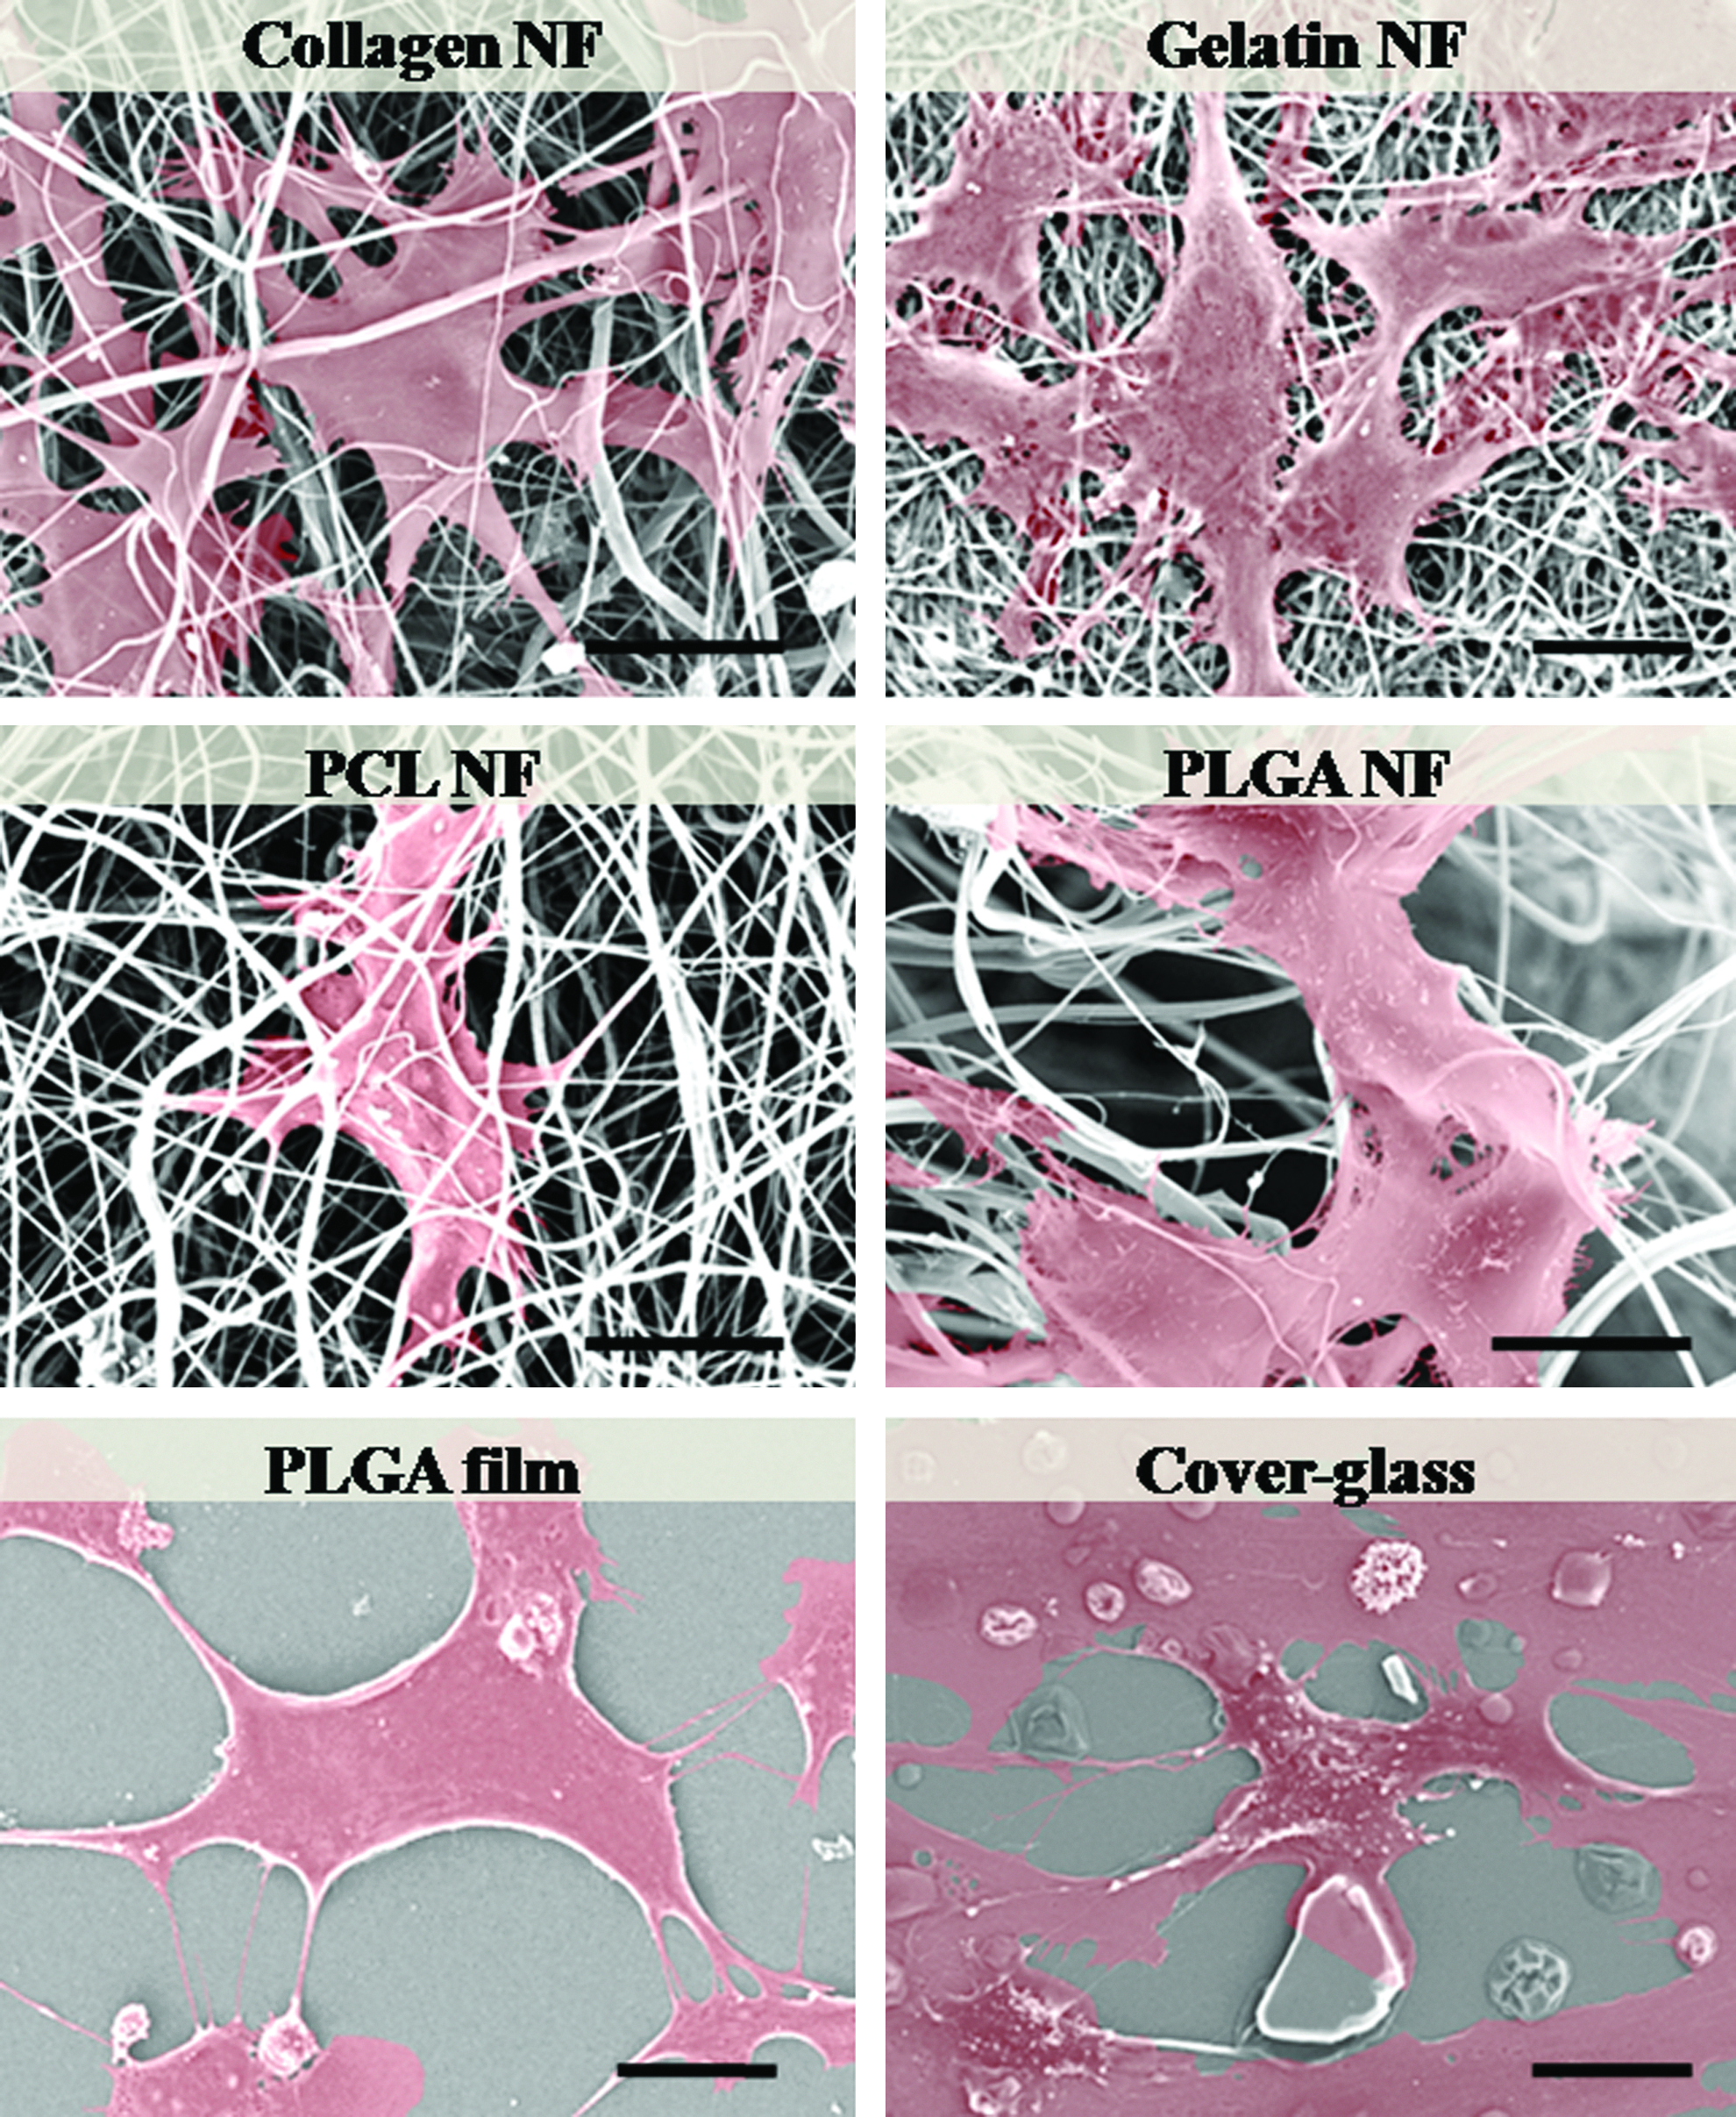
Morphology of HMSCs seeded on NF-ECMs. SEM images of HMSCs after 2 days of culture on artificial 3D NF-ECMs made of gelatin, PCL, PLGA, and collagen. HMSCs seeded on flat 2D PLGA film and coverglass served as controls. HMSCs seeded on lightly packed collagen, PCL, and PLGA NF-ECMs showed multilayered cell integration into niche-like spaces provided by the subcellular-scaled nanofiber meshed. The connection between well-integrated cells and nanofibers was impossible to differentiate at many points due to excellent 3D attachment and multiple extensions of filopodia. HMSCs seeded on 2D PLGA film and coverglass demonstrated another characteristic with an almost flat morphology. Scale bar 20 μm. [(SEM: virtual staining of HMSCs; transparent pink on nanofibers, by PHOTOSHOP SC5.1, (version 12.1×32, ADOBE)].
Confocal examination
From the second day after seeding focal, protein expression in HMSCs was influenced by the differences in surface topographies provided by PLGA NF-ECM compared to PLGA film. Changes in expression of paxillin (green) and stress fibers (red) were visible in their distribution within the cells when assessed by immunofluorescence. HMSCs cultured on PLGA NF-ECM displayed an even homogeneous distribution of paxillin (green) across the cytoplasm. In contrast, in HMSCs cultured on flat PLGA film controls, the paxillin expression was more concentrated around the nucleus and was inconsistently dispersed throughout the cell body, in particularly within the cell extensions. However, these cells expressed more stress fibers (red) than the HMSCs cultured on PLGA NF-ECM.
Protein expression
The expression of paxillin and α-tubulin on HMSCs seeded on PLGA NF-ECM was significantly higher (p<0.05) compared to HMSCs seeded on flat PLGA films (Fig. 9b). The expression level of vinculin, integrin subunits (α5, αv, and β1), and FAK and its phosphorylated counterpart was similar across all samples (data not shown). GAPDH was used as the loading control and was expressed evenly in all samples (Fig. 9b).
Discussion
Engineered electrospun nanofibers present a superb strategy for creating a true 3D ECM for stem cell delivery and tissue replacement. Furthermore, nanofibers could potentially be incorporated in advanced large-scale cell culture techniques such as roller culture and cell reactor and fermenters for long-term in vitro tissue cultures and if more complex tissue engineering is addressed. Despite the efforts put into developing a traditional method for mass producing nanofibers, electrospinning from a free surface of a solution has been shown to be superior.9,16,29 This study assessed the key needle-free electrospinning processing parameters for maximizing the production rate while optimizing the nanofiber morphology. A clinical grade-controlled setup was chosen for the manufacturing process. The key parameters were found to be the rate of the rotation of the spinning electrode (u), the electric field intensity (E), applied voltage (v), and the distance between the electrodes (h), as well as the solution properties such as polymer concentration.
To obtain the maximum production rate, we had to ensure that the process is not limited to any particular parameter. The production rate can be limited to the amount of the polymer solution carried by the wire (liquid entrainment) to the electric field. 14 This means that at each rotation of SE, there are periods, where the fabrication process is shortly interrupted due to the depletion of the polymer solution. According to the standard electrospinning model developed by Forward and Rutledge, 14 liquid entrainment is highly correlated with the capillary number (a function of viscosity, surface tension, and the velocity of the particle or u) and weakly correlated with the bond number (a function of density, gravity, radius of the particle, and the surface tension). Therefore, in a process where the condition of the electrospinning process is limited to the amount of the liquid entrained on the SE (entrainment-limited process), 14 the speed of SE rotation (u) and the polymer solution concentration could be the key factors in determining the production rate. This means that increasing the polymer solution concentration or u could lead to an increase in the production rate.
However, we found the opposite with our novel electrospinning technique. For all solution concentrations, the production rate actually significantly declined when u was increased (Fig. 3). This indicates that the process described in this study was not limited to the amount of the solution entrainment. Therefore, rather than an entrainment-limited process, it was a field-limited process instead. 14 This can be identified as a crucial step in optimizing the processing parameter for maximizing the production rate at a highly efficient system in terms of production rate and the utilities. 14
Needle-free electrospinning has been shown in this study to allow for mass production of nanofibers. The production rate was defined here as the total dry mass of NF-ECMs fabricated per minutes per meter of the SE. Utilizing a wire-SE, we were able to mass produce 1.36 g·min−1·m−1 of an artificial NF-ECM made of gelatin. This production rate in our study was significantly higher in comparison to other methods of electrospinning, such as splash electrospinning, where Tang et al 30 electrospun poly(oxyethylene) at the rate of 0.67–0.78 g·min−1·m−1, 30 and conventional needle electrospinning where the production rate is as little as 0.005–0.008 g·min−1. 30 Using the same needle-free electrospinning technique presented in this study, Dao and Jirsak 31 electrospun poly(vinyl alcohol). However a roller-SE was used in their study, and they obtained a lower production rate (1.17 g·min−1·m−1). 31 Using wire-SE, needle-free electrospinning allowed us to obtain a significantly higher production rate in comparison to conventional methods of electrospinning. By optimizing the polymer solution concentration, E and u, it was possible to further increase the production rate without compromising the morphology of the fabricated nanofibers.
A raise in the polymer solution concentration resulted in an increase in the production rate in our study. The amount of polymer per volume was enhanced, therefore amplifying the amount of polymer transferred per jet, consequently boosting the production rate. This is in contrast to other studies where the use of higher concentrated solutions provided tougher spinning conditions, as together with the concentration, the viscosity is also increased. 32 In another form of needle-free electrospinning set up, Wang and Xu 33 used a conical wire coil SE, where they demonstrated a decrease in the production rate as the solution concentration was increased. 33 However, the production rate is also greatly influenced by the geometry of the SE, for example, when using a cylinder-SE. 32 Using our wire-shape rotating SE, we may have successfully tackled the widely described negative influence on production rate with higher concentrations. We actually showed that an increase in the polymer solution concentration resulted in a significant increase in the production rate in our study.
The electric field intensity (E) was another factor that greatly influenced the production rate. Electrospinning initiates when the E of a particular liquid reaches its critical value, (Ec). The equation below, derived from dispersion law, describes the initial stage of needle-free electrospinning. When E reaches Ec, the square of the angular frequency w
2
becomes negative, consequently w becomes imaginary, and it is at this imaginary w when electrospinning is initiated.
14
The imaginary w is defined as q=Im(w), which immediately adapts the behavior of the superficial exponential relation described in the following equation.14,19
The equation above explains the exponential increase in the production rate once the applied E exceeded Ec (0.190 kV·mm−1m−1). Figure 4 shows this relation once the electrospinning was initiated, where a small shift in E resulted in an exponential raise in the production rate. However, this exponential enhancement in production rate reached a plateau at very high E, once E exceeded 0.571 kV·mm−1m−1 (Fig. 4). Although increasing E was a proficient way of elevating the production rate, reaching the plateau shows that there was a limitation in how far E could be upregulated. Furthermore, increasing the E eventually became unsafe, and resulted in sparking discharging between the electrodes in our setup.
The speed of SE rotation, u, had a great impact on the production rate of NF-ECMs. The influence of u on the production rate was investigated by using 15%, 17.5%, and 20% gelatin concentrations. The purpose of using solutions of different concentrations was to further investigate whether the optimum u would change if the solution properties are changed. As explained earlier, both solution concentration and u could affect the liquid entrainment, which probably would have great impact on the production rate. Aside from its influence on liquid entrainment, increasing the u shortens the life-span of the Taylor cone, which means less time for the jet to form, usually resulting in fall in the production rate.29,32 This was shown throughout the experiment, and it could explain the decrease in the production rate when u was increased (Fig. 3). However, for highly volatile solvent and/or concentrated polymer solution, lower u allows a greater time for the solvent to evaporate causing drying or increase in viscosity, consequently providing tougher conditions and loss of production rate. This could explain the drop in the production rate when 20% wt/v gelatin solution was electrospun at very low u.
So far, we have described the method of boosting the production rate by changing the polymer solution concentration, the E and the u. However, we found that increasing the production rate by manipulating these parameters at some degree had negative impacts on the morphology of the electrospun nanofibers, where it resulted in thicker nanofibers with unwanted higher deviation in their diameters.
Change in the morphology of the nanofibers could probably have a significant influence on the biological performance of the resultant artificial NF-ECM.10,34 The average nanofiber diameter probably has a significant impact on cellular attachment and stem cell differentiation. Decreasing the average diameter of the fibers from 800 to 400 nm has shown to greatly enhance neural differentiation of embryonic stem cells as well as enhancing the neurite outgrowth. 10 Further studies demonstrated that neuronal stem cell differentiation into oligodendrocytes was significantly enhanced when the average fiber diameter was decreased from 749 to 283 nm. 34 Therefore, having a controlled process where the fibers have desired diameter with low deviation in their diameter is crucial factor to be considered in the process. Our findings and description of optimal production parameters lead toward that goal.
As shown, needle-free multijet electrospinning allowed for fabrication of highly uniform nanofibers (low deviation in fiber diameter). The small deviation in fiber diameters was achieved due to the nature of the jet formation. When using our needle-free electrospinning, multiple jets formed naturally, and unlike standard needle electrospinning, our set up was not constricted by the position of any needle. 29 Nanofibers with less than±30% were successfully produced by our method, although the deviation in nanofiber diameters had strong connection with polymer solution concentration, u, E, h, and v.
The polymer solution concentration has been postulated as an essential parameter to ensure success in the electrospinning process and likely contributing to the production of fibers with the desired morphology. An increase in the polymer solution concentration is described to lead to an increase to the amount of the polymer chain entanglements.35,36 These entanglements would ensure the formation of a continuous jet between the electrodes and thus the formation of fibers. Furthermore, in standard needle electrospinning, increase in the amount of entanglement is described to depress the bending stability, as a result reducing the stretching of the fibers and consequently reducing the deposition area as well as resulting in fabrication of thicker fibers. 37 Niu et al 29 argued that in needle-free electrospinning, the concentration of the polymer solution does not exert a significant influence on the fabricated fiber diameter, provided the polymer solution can be electrospun into nanofibers. However as shown in Figure 5a, nanofibers demonstrated a dramatic increase in their overall fiber diameters in response to an increase to the polymer solution concentration. This can probably be explained by the increased resistance to the stretching of the jet caused by the increased polymer chain entanglement.
Besides the overall fiber diameters as described above, it is important to address the deviation in fiber diameters. The deviation was decreased when the polymer solution was increased from 15.0% wt/v to 17.5% wt/v. According to Niu et al, 29 a sufficient concentration of the polymer solution would probably be needed to form a stable jet that could move along the spinning electrode once high voltage is applied. 29 We explain the decrease in deviation by the formation of probably more-stable Taylor cones with those concentrations in our particular setup. However, further increase of the polymer solution to 20.0% wt/v led again to an increase in the deviation in fiber diameters. This shows that the polymer solution concentration can have a great influence not only on the production rate but also on the fiber morphology of the fabricated NF-ECM.
The u could also influence the electrospinning process and consequently affect the morphology of the resultant nanofibers. 14 In our study, no significant changes in fiber diameter were seen at lower and moderate u. However, at very high u (14.4 rpm and 16 rpm), the deviation in fiber diameters significantly increased (p<0.001). This could have been due to an increase in the vibration of the spinning electrode, and the inconsistency in the amount of the polymer solution carried by the SE, and the irregular electric field distribution caused by the high u.
Increasing the E was shown to greatly increase the production rate; however, at very high E, the morphology of the electrospun nanofibers was compromised. Figure 4c shows an image of undesirable nanofibers fabricated at E of 0.683 kV·mm−1 (d=120 mm and U=82 kV) where the nanofibers are thick and have merged into each other. Increasing the E subsequently amplifies the acceleration of the jet, which constricts the flight time of nanofibers between the electrodes. The jet needs sufficient time to stretch and for the solvent to evaporate.8,35,38 When flight time is inadequate, it allows insufficient time for jet to stretch and for the solvent to evaporate. This can explain the thick and merged fibers obtained at very high E. Therefore, increasing the production rate by increasing the E can be limiting.
As E is a function of v over h, the effect of changing the h and v was investigated independently of E. The v influenced the fiber diameters and their deviation. In general, increasing the applied voltage at a constant h will increase the E and the columbic forces in the jet, consequently leading to a greater stretching of the polymer solution jet and thus fibers with a lower diameter.8,37,39 This was clearly seen in our results where an increase in the v from 50 kV to 60 kV resulted in a great decrease in the average fiber diameter from 265±90 nm to 185±60 nm. However, further increase in the applied voltage did not cause a further decrease in the fiber diameter, but caused a significant decrease in fiber deviation, which was a significant improvement to the fiber morphology. Niu et al 32 showed that lower applied voltage resulted in an uneven distribution of E, where the E was more concentrated at the edge of the cylinder. Furthermore, they demonstrated that an increase in the applied voltage resulted in distribution of the voltage along the cylinder, which resulted in a decrease in the deviation in the nanofiber diameter. Even though this phenomenon was not seen in our wire-SE, where the jets were forming all along the length of the wires (Fig. 1c) even at lower applied voltages, an increase in applied voltage resulting in a better distribution of the electric field intensity could potentially explain the decrease in the deviation of the nanofiber diameters.29,32,40
Altering the h will influence the flight time of the jet and E. Increasing the h will have similar effect such as decreasing the E. However, increasing h can also have further desirable effects such as increasing the flight time, by increasing the travel distance. At a constant applied voltage, the nanofiber diameters were greatly reduced when the distance was increased from 100 mm to 140 mm. The deviation in the fiber diameters was not effected when the h was increased from 100 mm to 140 mm. However, there was a sudden decrease in deviation when h was increased from 140 mm to 180 mm and then to 210 mm.
The key aim of this study was to utilize needle-free multijet electrospinning to fabricate an 3D artificial NF-ECM and to demonstrate their biocompatibility and their ability to enhance cell integration and adhesion. Using needle-free electrospinning, we were able to fabricate NF-ECMs from a number of most commonly used natural (collagen and gelatin) and synthetic (PCL and PLGA) biopolymers.
We found that our fabricated NF-ECMs had similar 3D architecture to natural ECM. Collagen, gelatin, PCL, and PLGA NF-ECMs all comprised of highly uniform fibers with a submicron scale and a range of 400–800 nm. Fibers with such diameters provided a similar 3D architecture to the supporting mesh-like network niches provided by native tissue fibers of natural ECM. 5 Natural reticular fibers usually form a delicate mesh of fibrils roughly about 30-nm thick. Natural elastic fibers are consistent of elastin fibrils of 100- to 200-nm thickness. Natural collagen bundles are 1–20-μm-thick bundles made of densely packed collagen fibrils of 30–100 nm.
Furthermore, we found our needle-free multijet electrospinning allows us to fabricate NF-ECMs that mimic the same packing density of the fibers in the natural ECM of soft tissue. 5 As such, the packing densities of our collagen, gelatin, PCL, and PLGA NF-ECMs were calculated to be widely distributed from as little as 13%–50%. This mimics the packing density of natural reticular and elastin fibers. Analysis of the images taken by Ushiki 5 shows a packing density of 67.7%±30.0% and 32.3%±20.5% for reticular fibers of dog lingual muscle and deep cortex of rat mesenteric lymph node. Furthermore, the packing densities of 32.8%±17.1% and 38.0%±12.9% were calculated for natural elastin found in rat aortic adventitia and serosa of mouse urinary bladder. From our SEM images (Fig. 8), it is obvious that the packing density is providing a different environment for the HMSCs to grow and integrate. We can see that the cells seating on top of densely packed gelatin NF-ECMs, whereas on lower packing density provided by the PLGA and collagen NF-ECMs, the cells are integrated within the nanofibers. The packing densities of the fibers might be a key parameter that needs to be optimized in particular in wound healing to avoid scar formation, where densely packed collagen fibrils and bundle 41 have shown to influence the gene expression profile,42,43 and cause prolong excessive deposition of the ECM and therefore pathological fibrosis at the site of injury.42–44 The influence of packing density on cellular behavior is clearly illustrated in Figure 8, where HMSCs on densely packed gelatin membrane were growing on the surface of the nanofibers, whereas HMSCs seeded on lightly packed collagen and PLGA NF-ECM were integrated within the nanofibers.
HMSCs were used to assess biocompatibility of NF-ECMs and their ability to home or integrate these stem cells. HMSCs were successfully characterized as reported beforehand, 26 and after 2 days of culture on different membranes, all cells were able to proliferate, although differently on different NF-ECMs (Fig. 6 and 7). The ability of all membranes to support cell proliferation represents intrinsic membrane biocompatibility. Supporting these results is the well-spread morphology of cells on the membranes signifying healthy cells capable of adapting to their substrate (Fig. 7). By day 8, HMSCs continued to proliferate, and in general, all membranes were comparable or even superior to coverglass (Fig. 6). This illustrates the biocompatibility of the NF-ECMs fabricated by needle-free electrospinning.
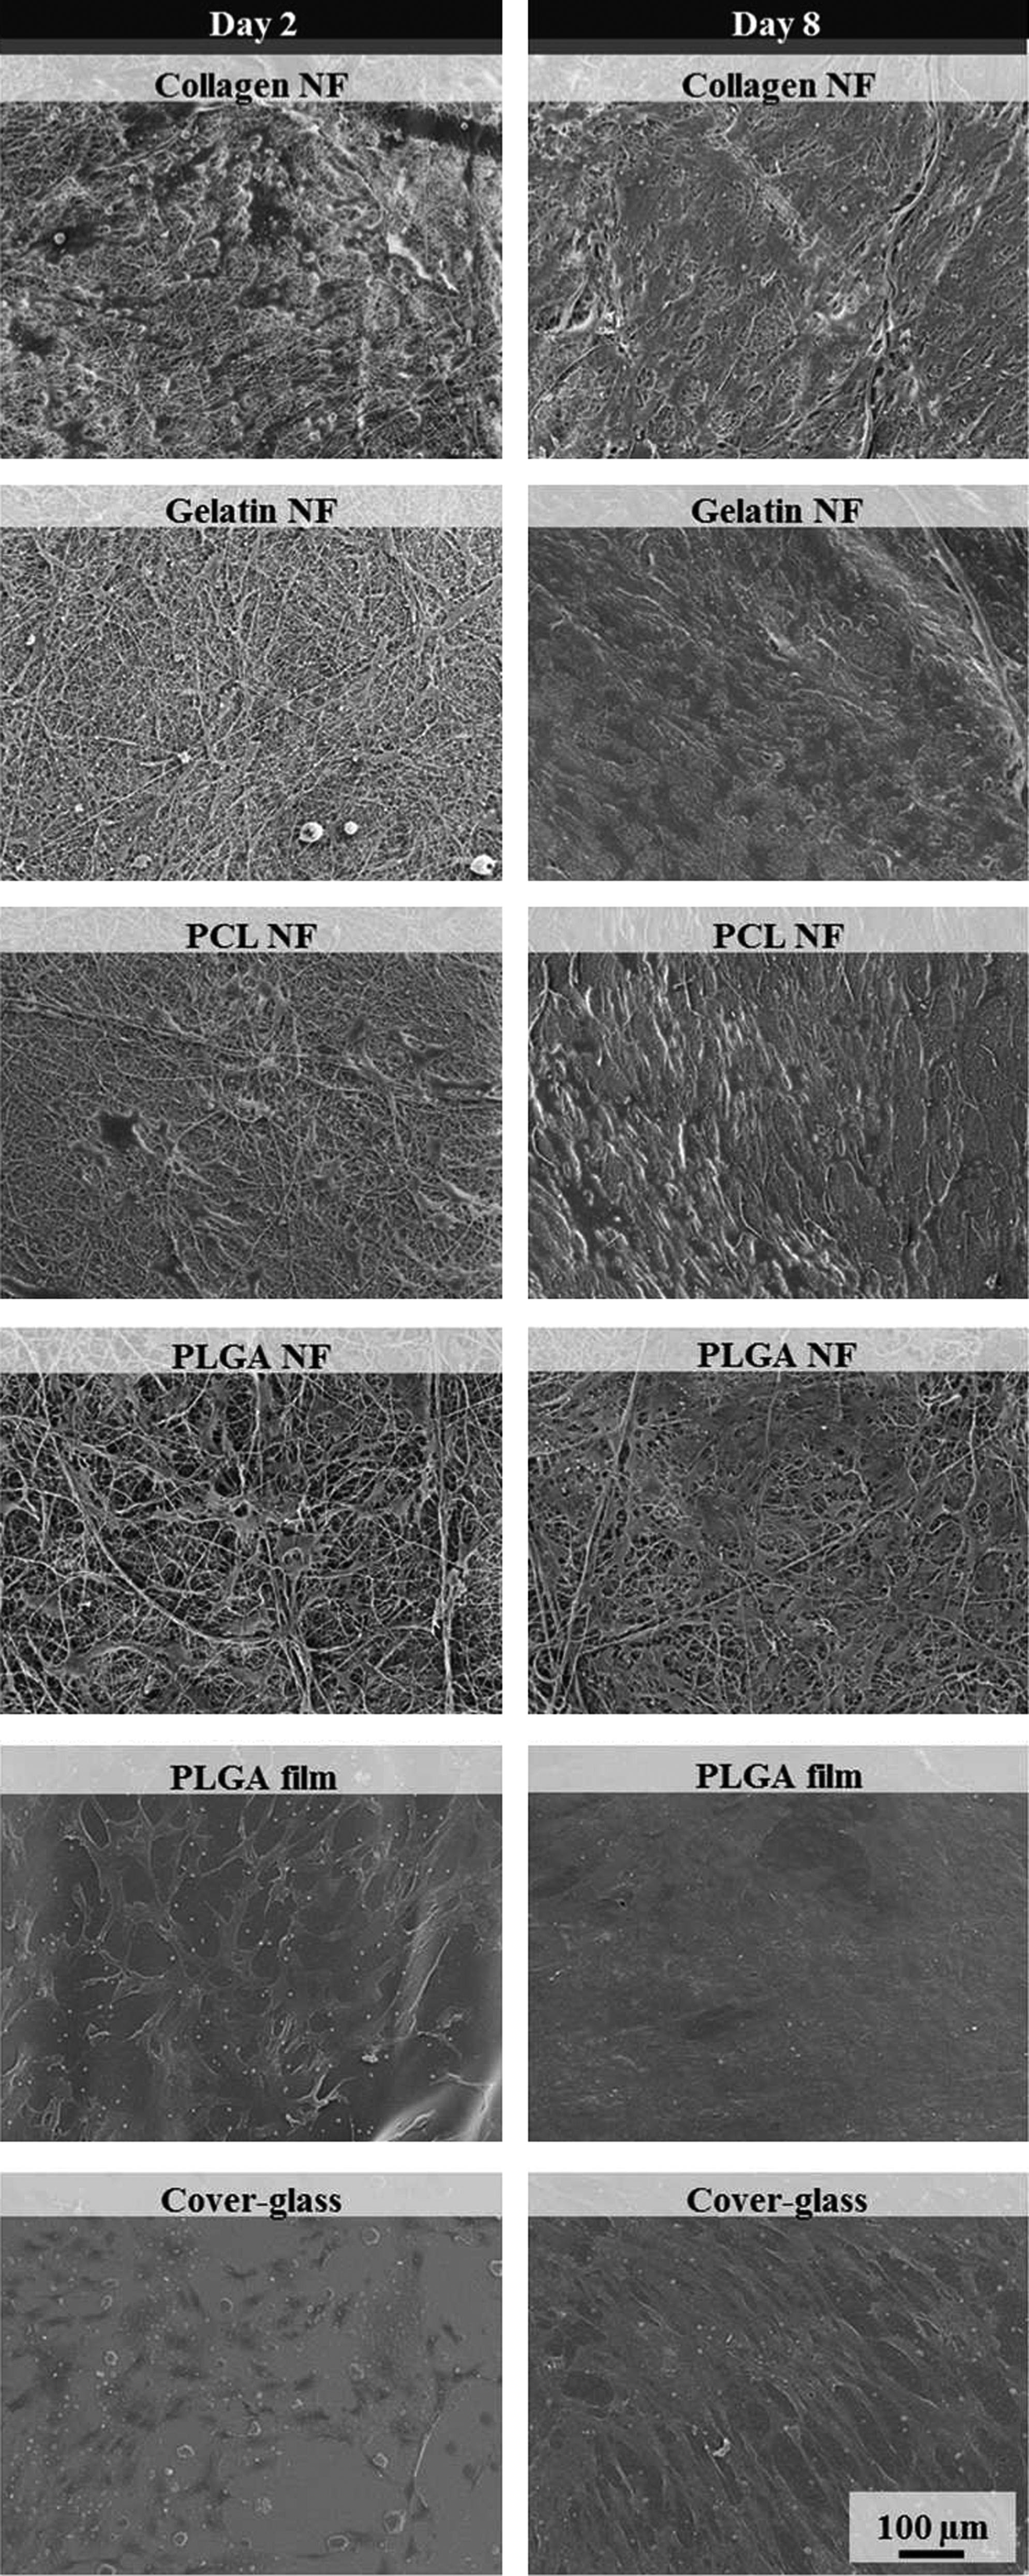
Visual representation of cellular growth. HMSCs cultured the collagen, gelatin, PCL and PLGA NF-ECMs, PLGA film, and coverglass after 2 days and 8 days of culture, at×150 magnification. The images depict around 20% confluent membrane on day 2 and near 100% confluent membrane on day 8. This demonstrates that HMSCs were able to proliferate on different NF-ECMs.
The cell microenvironment plays an important role in cell behaviour, especially spatially, where there is a discrepancy in cellular function between 2D and 3D microenvironments due to the cell's interpretation of this microenvironment. A 2D environment limits cell-to-cell interaction 45 with such cells lacking the physical interactions that are seen from cells in their natural ECM that a 3D surface more closely resembles and thus lacking the more complex morphologies of cells in the ECM niche. 46 This is exemplified by enhancement of neural differentiation of mesenchymal stem cells when a 3D aligned PCL nanofibers were used to culture these cells. 47 PLGA nanofiber membranes were superior in their ability to proliferate HMSCs compared to PLGA film (p<0.001). Since the only difference between the PLGA NF-ECMs and PLGA film were their 3D architecture, it appears that mimicking the 3D architecture of natural ECM as found within the NF-ECM can provide a favorable growth and survival condition for HMSCs.
Cells modify focal adhesions in response to changing environment. Although the focal adhesion complexes are well investigated in 2D systems, their roles for cell migration in 3D matrixes are largely unknown and may be distinct. 48 We investigated the protein level of focal adhesion proteins in HMSCs seeded for 24 h on PLGA nanofibers and film. We found that integrin subunits (α5, αv, and β1), FAK and its phosphorylated counterpart, and vinculin did not change at the protein level (data not shown). However, paxillin and α-tubulin expression increased slightly on nanofibrous membrane compared to film (p<0.05) (Fig. 9 b). Changes in paxillin in response to surface nanotopography (nano-pits) were also described by Lim et al. 49 Paxillin itself plays a major role in the integration and dissemination of signals from integrins, which in turn effect proficient cellular migration. Paxillin further mediates the activity of several p21 GTPase families that are essential for reorganization of the actin and tubulin cytoskeleton networks, which are responsible for cellular mobility. Increase in the expression of paxillin is therefore a great indicator of enhancement of cellular migration. 50 The increase of paxillin expression on our 3D NF-ECM compared to the lower expression on the 2D controls indicates that the 3D architecture of the NF-ECM promotes cellular migration. In conclusion, the 3D architecture and 3D characteristics of NF-ECM will influence cellular behavior on the material, which needs to be addressed in finding the optimal production process.
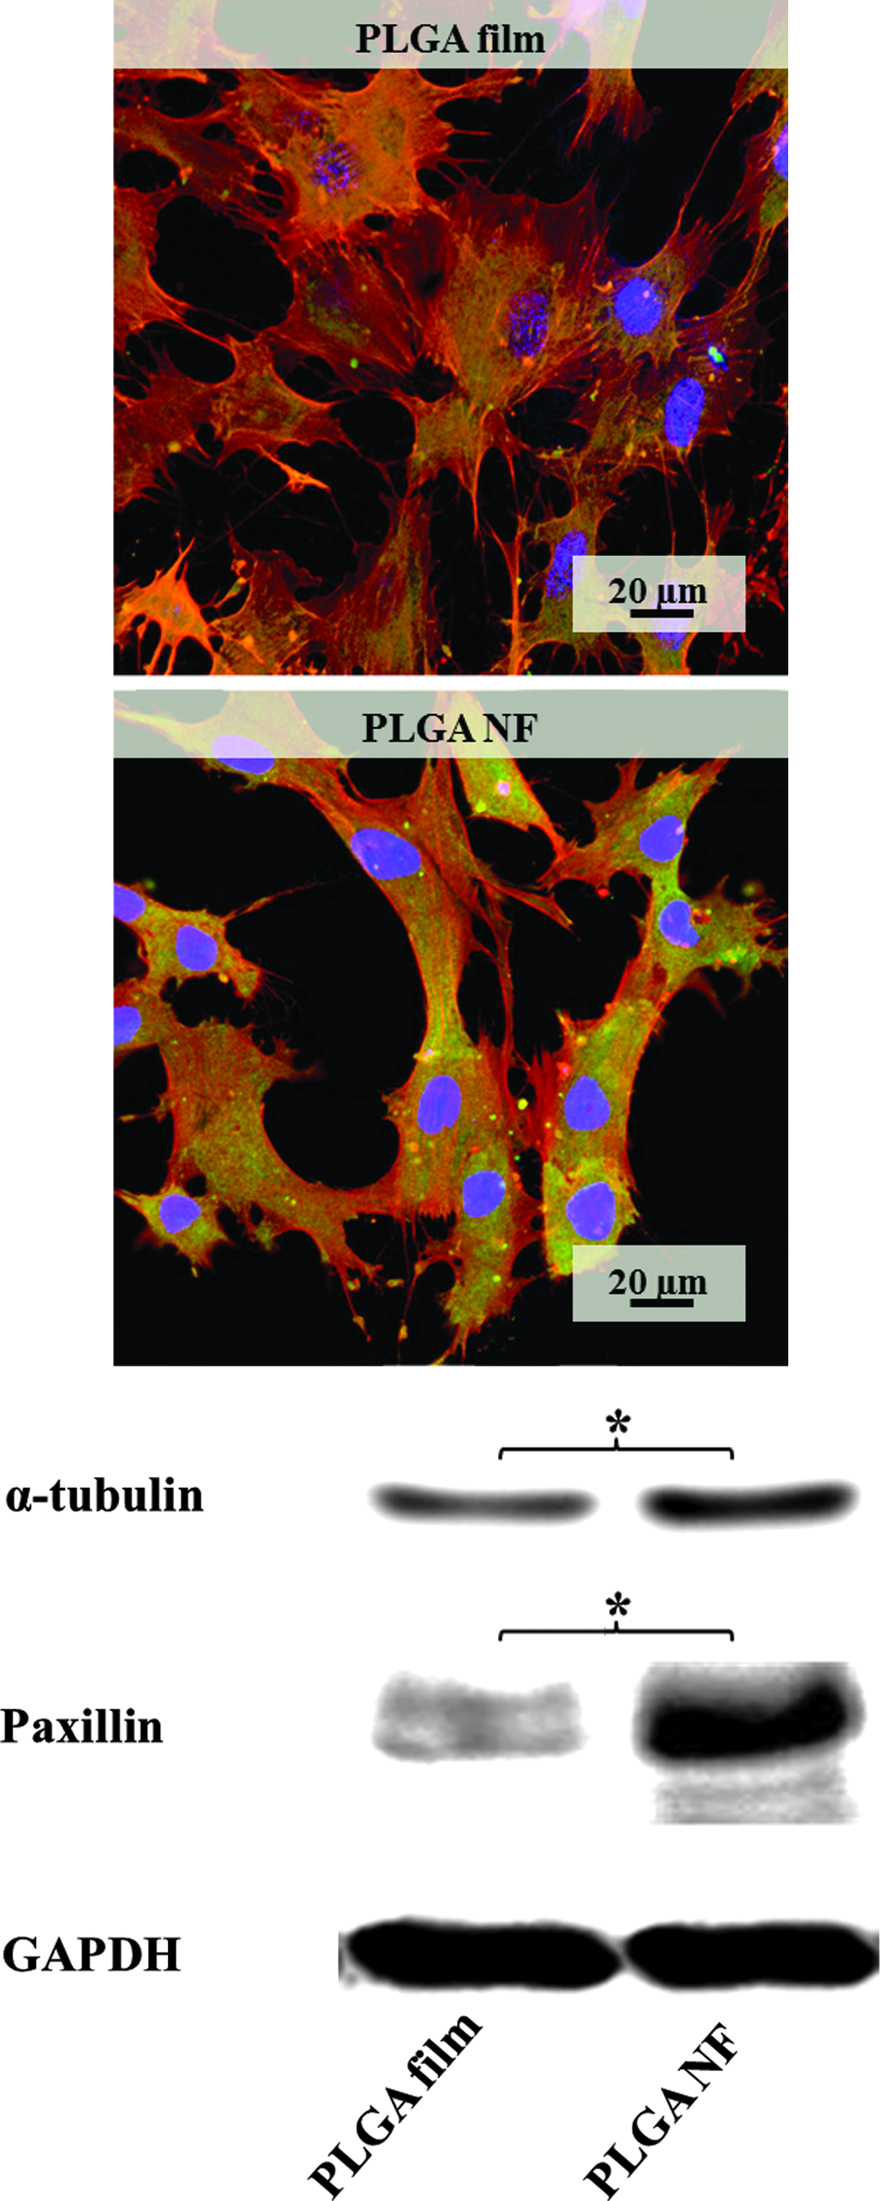
Protein expression of cell adhesion proteins. Confocal imaging and western blotting of HMSCs 24 h after seeding. Confocal image of HMSCs, tagged for F-actin (red) and paxillin (green), illustrating the extension of actin filaments and the distribution of paxillin within the cells. Paxillin is more concentrated in the center of the cells in HMSCs seeded on film (top), but are more evenly distributed within HMSCs seeded on PLGA NF-ECM membranes. Western blot analysis was conducted on paxillin and α-tubulin. A greater expression of α-tubulin and paxillin was obtained from HMSCs seeded on 3D PLGA NF-ECM compared to flat PLGA film. GAPDH was used as loading control where it was expressed equally across the PLGA film and the PLGA NF-ECM. Statistical probability was indicated as (*), denoted a significant difference of p<0.05.
Recommended parameters for mass production of NF-ECM
Choosing the right geometry of the spinning electrode has been shown to be the most effective way in controlling nanofiber diameters while producing large quantity of the NF-ECM. The speed of spinning electrode rotation is also important and needs to be addressed. In a needle-free electrospinning, when a rotating wire-SE is utilized, it is recommended to use a field-limited system, where the production rate in not limited to the availability of the polymer solution on the wire. When the process is a field-limited system, the production rate will increase with an increase in the electric field intensity; however, to further increase the production rate, it is best to carry out the process at slower speed of SE rotation, preferably using solutions with higher polymer concentration.
Nanofibers with thinner diameter are more desirable in tissue-engineering applications. To fabricate thinner fibers, it is best to maximize the distance between the electrodes while increasing the applied voltage, increase in the distance allows more time for the solution to stretch, and increasing the voltage will allow greater forces acting to stretch the fibers.
Conclusion
Although it is a young emerging technology, needle-free multijet electrospinning presents an ideal technique for mass production of high-quality nanofibrous membranes probably for large-scale tissue repair such as in skin defects. As the 3D architecture and characteristics (e.g., nanofiber packing densities) of NF-ECM will influence cellular response, there is a need for predictable production processes to achieve the preferred nanofiber features. Several parameters could be identified in this study that are crucial to develop strategies in which production of nanofibers can be made more efficient while increasing the quality control of the process that will be mandatory for future clinical-grade manufacturing for medical applications.
Footnotes
Acknowledgments
We gratefully acknowledge the funding and support received by the Clem Jones Estate, Brisbane, QLD, Australia.
Disclosure Statement
No competing financial interests exist.