
Abstract
Cell migration is one of the fundamental processes in histogenesis, and it is necessary to investigate such multicellular behavior quantitatively in cell regeneration studies. In this study, Voronoi diagram analysis was first confirmed in simulation testing, and then used to evaluate the multicellular behavior of chondrocytes on three different substrates: (1) wild-type fibroin (FIB); (2) L-RGDSx2 transgenic fibroin; (3) and collagen. The indices for the round factor average, round factor homogeneity, and area disorder (AD), calculated from Voronoi diagram analysis, were used to characterize the difference in spatiotemporal changes for the different chondrocyte populations, and a regression analysis of the AD index was used to measure the speed of cell aggregation. The results suggested that the arginine-glycine-aspartic acid-serine sequence affects aggregate formation of chondrocytes cultured on FIB. The Voronoi diagram analysis represents one of the promising quantitative analyses for cell regeneration studies.
Introduction
For accurately evaluating the spatiotemporal formation of cell populations, there are two major requirements. First, automated visual tracking of the cells is necessary for quantitative and systematic analysis. Second, techniques that accurately characterize patterns of cell behavior, such as migration, proliferation, and apoptosis, are required. While visual tracking techniques have been studied extensively, less attention has been given to cell behavior characterization techniques.
In previous work, Kawakami et al. demonstrated that initial chondrocyte aggregation led to enhanced cartilage tissue formation in fibroin (FIB) sponges. 3 Additionally, cell aggregation is considered to be a key event in a wide range of fields, from tissue engineering to embryology and involves many types of cells, such as hepatocytes and chondrocytes,3–5 as along with tumor and mesenchymal stem cells as well. This indicates that cell aggregation is one of the key events in cell-to-cell interaction, making it a vital part of tissue formation. However, in multicellular biophysics, evaluation of the cell aggregation process has been neither quantitative nor objective, but rather qualitative and highly researcher dependent. This lack of reliable and repeatable quantitative cell aggregation assays has made it difficult to investigate multicellular biophysics in the aggregate formation process.
The purpose of this study was to introduce the concept of “cellular sociology” into tissue engineering and bioenvironment design. This concept focuses on the social behavior of cell populations, which varies in response to the cells' surroundings and the physiological and phenotypical state of the cells themselves. Moreover, by understanding the relationship between cell population and extracellular environment, it is possible to gain insights into a wide range of cell biophysics (e.g., cell–cell and cell–substrate/material interactions). In the field of cellular sociology, cell arrangement analysis using a Voronoi diagram is one of the most successful methods for the evaluation of different cell populations. Voronoi analysis has been used previously to evaluate the spatiodistribution of retinal, 6 cortical, 7 and tumor cells.8–11 Nawrocki Raby et al. evaluated the process of tumor cell cohesion using graphical quantification, including Voronoi diagram analysis, and concluded that this method represented a new way to predict the aggressiveness of various tumor cells. 9 In a similar fashion, Voronoi diagram analysis may provide new insights into the multicellular biophysics involved in tissue regeneration and allow for improved computational modeling of cell behavior in scaffolds.
In this study, two types of experiments were performed. First, Marcelpoil and Usson's distribution assay, 12 which has been used in the study of tumor cell distribution,9,11 was examined with respect to its validity as a method for evaluating chondrocyte aggregation on different substrates. Specifically, to confirm the relationship between cell aggregation and various analysis metrics, unambiguous examples of different aggregation patterns were simulated and analyzed in a set of in silico experiments. After confirming these relationships, a number of in vitro experiments were then performed to examine the spatiotemporal distributions of chondrocytes on three different substrates: (1) collagen (CON); (2) FIB; and (3) RGD-transgenic fibroin, which was created by genetically interfusing arginine-glycine-aspartic acid-serine (RGDS) peptides into silk FIB molecules. 13 It was reported previously that chondrocyte aggregation is enhanced in FIB sponges, 3 but chondrocyte aggregation behavior on FIB has yet to be evaluated quantitatively. Thus, the objective of this study was to quantitatively assess whether FIB enhances cell aggregation behavior using in silico validated Voronoi diagram analysis methods.
Materials and Methods
Cell population quantification
The spatial distribution of cells was characterized and quantified using a cellular sociology algorithm based on geometrical models, as described by Marcelpoil and Usson 12 (i.e., Voronoi's partition). These methods, applied to the set of points that relate to the position of the cells (Fig. 1), provide information about the spatial distribution and neighborhood relationships of the cells. From the Voronoi diagram, three quantitative parameters can be deduced: (1) average and standard deviation of the areas (round factor average [RFav]); (2) roundness factor homogeneity (RFH); and (3) area disorder (AD). Each index was calculated using the equations derived by Marcelpoil and Usson. 12 As is customary, border zones of the Voronoi diagram were excluded from the analysis, as no information can be taken relating to the final position of cells in these zones.
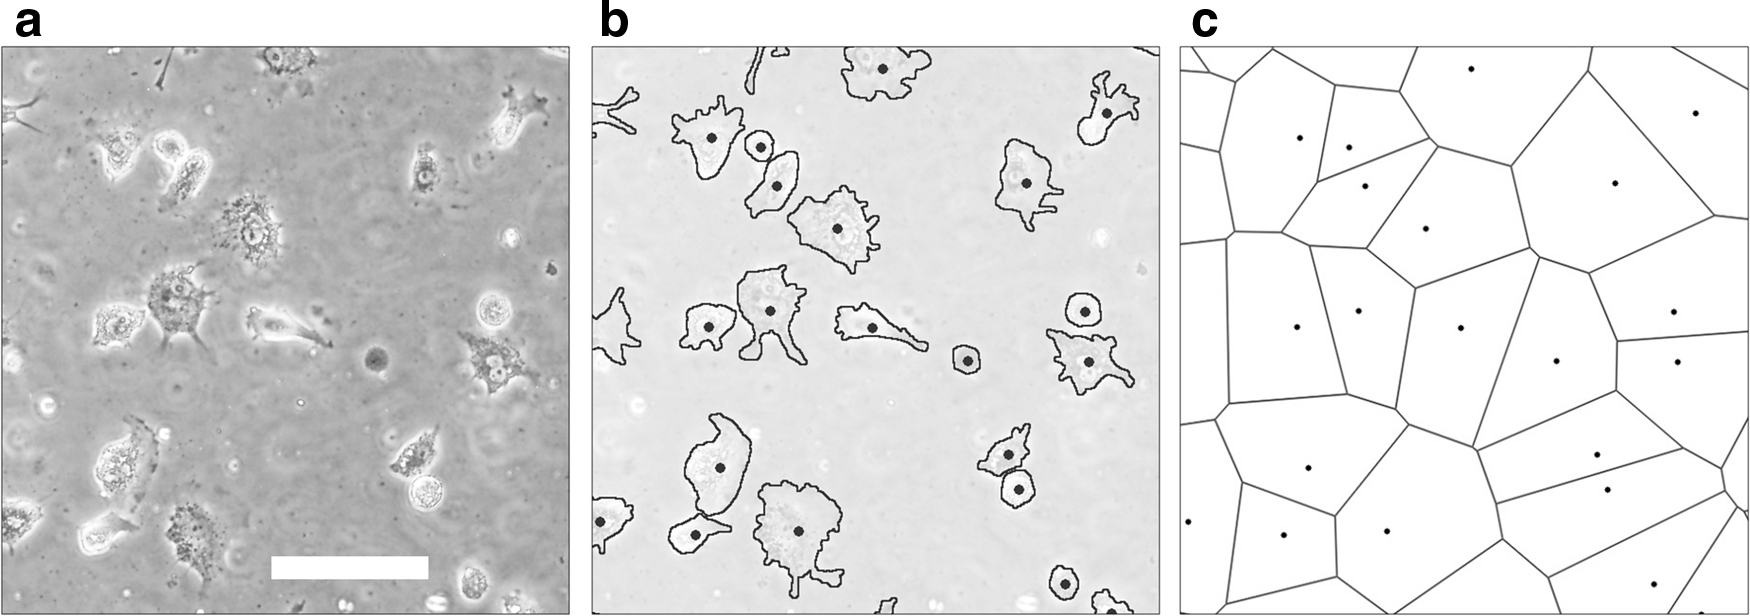
Representation of the data acquisition process.
In silico experiment: simulation of aggregate cell populations
Model formulation
Cell aggregations can vary in their size, cell density, and gathering potential. A computer simulation model was conducted to examine whether cell population affects the RFav, RFH, and AD indexes during aggregation. Three cell population models (type A, type B, and type C; described in section “Model of cell arrangement”) that were observed regularly in our time-lapse observation were simulated. Afterward, the cell distribution points were evaluated using a Voronoi diagram. Every trial was executed and evaluated six times.
Model of cell arrangement
Three types of cell distribution were created using 100 separate points set on a 2D plane using the procedures described below. (Note: Cells were not placed at the exact nodal points of the square lattice, but rather randomly scattered around each node using a Gaussian distribution with a standard deviation of 10 pixels (Fig. 2).
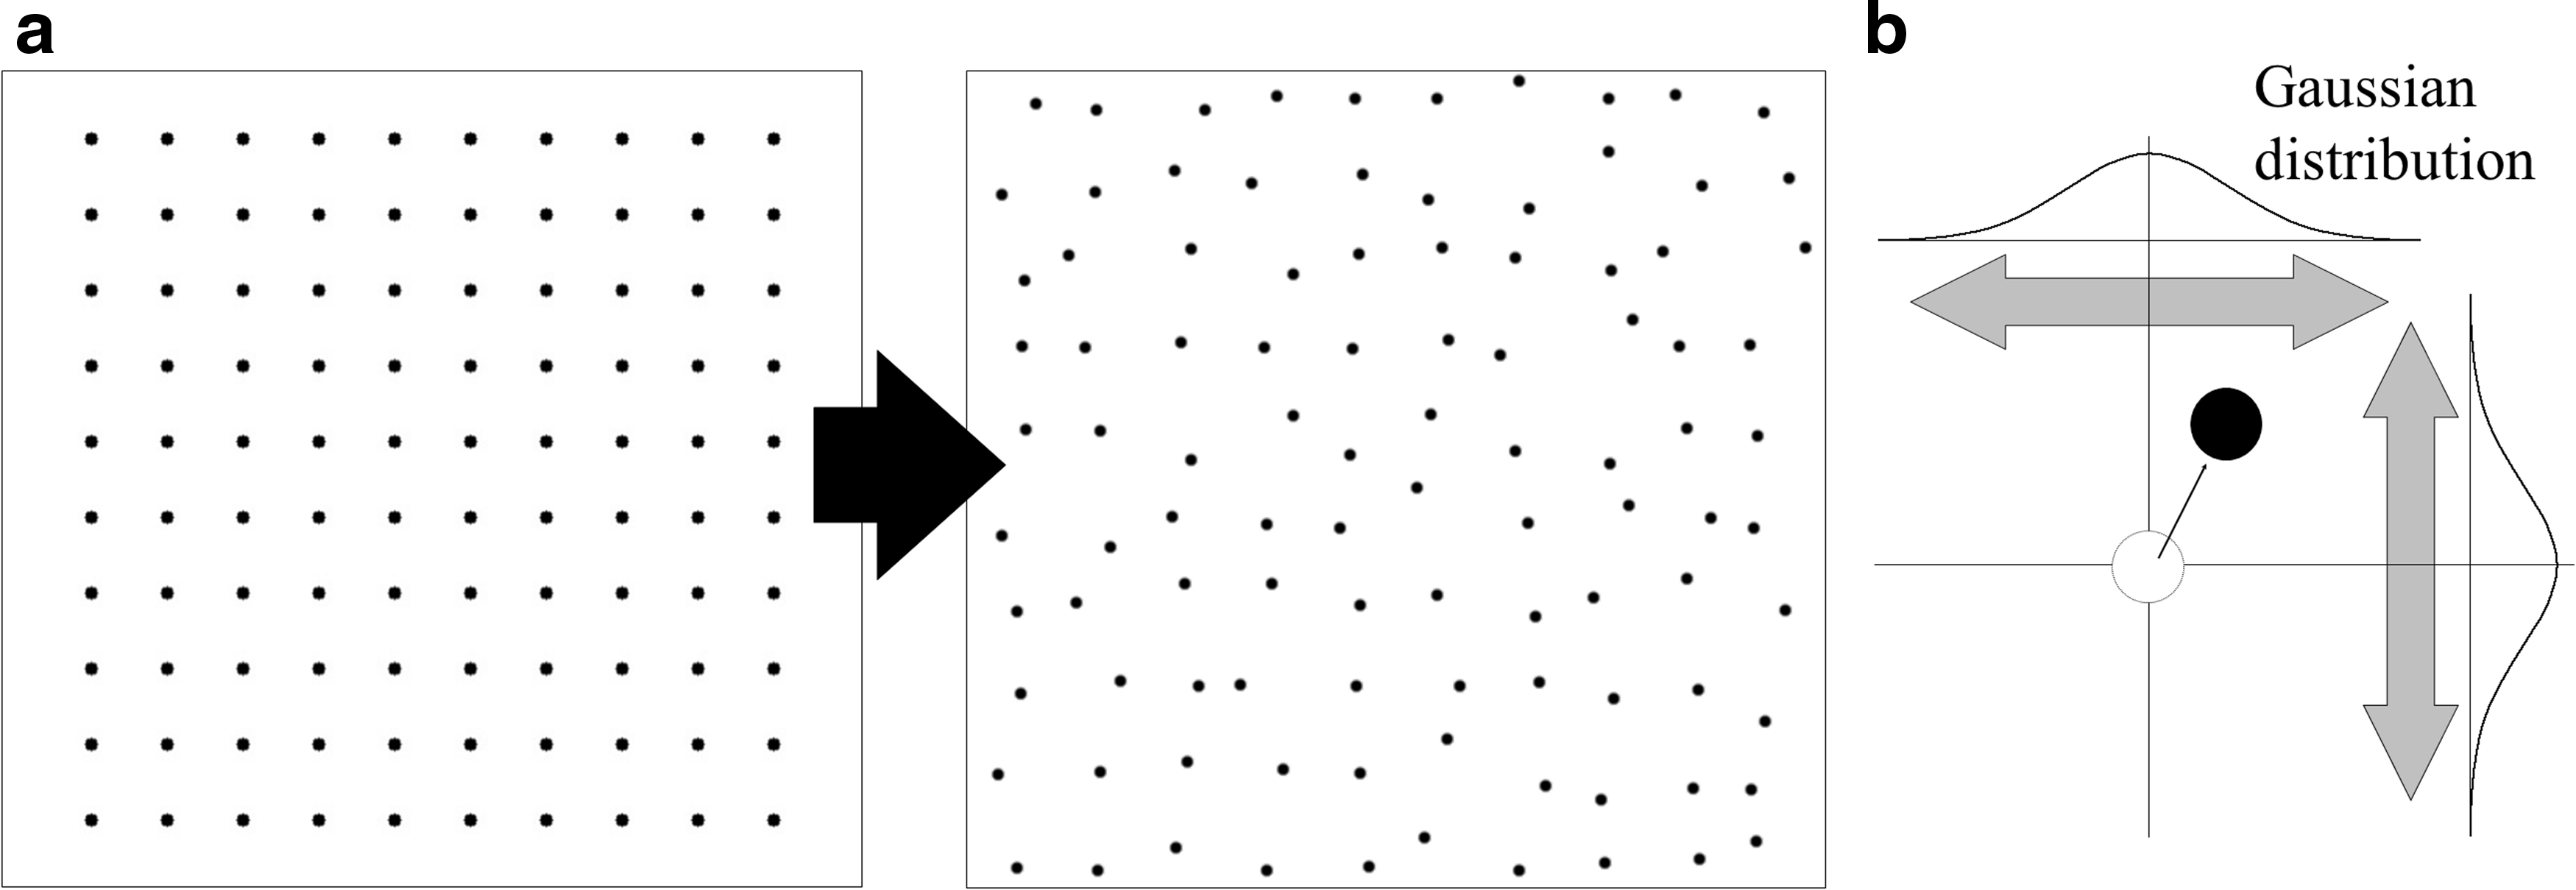
Schematic model of an aggregating cell population.
Type A: This model was used to analyze the effect of cell density. Using a 10×10 array of points located at the nodes of a perfect square lattice, groups with high, medium, and low cell density were simulated by changing the mesh size of the square lattice to 30 (high density; H), 60 (middle density; M), and 90 pixels (low density; L), respectively. A control group (C) in which the population was distributed randomly (Fig. 3, model A) was also created.

Representative image of aggregation models. Each model was varied in the degree of cell density (type A), cell aggregation participation ratio (type B), and the number of cells within each aggregrate (type C).
Type B: This model was used to evaluate the rate at which cells participated in aggregation. Using an array of N points located at the nodes of a square lattice and 100-N points distributed randomly, groups with 0%, 25%, 50%, 75%, and 100% aggregation participation ratios were simulated by changing the N value to 0, 25, 50, 75, and 100, respectively (Fig. 3, model B).
Type C: This model was used to analyze the effect of aggregate size. Using point forming groups, three types of cell populations were created in which cells formed: one large aggregate (AGG:1); two smaller aggregates (AGG:2); and four aggregates (AGG:4) that were smaller still. Each nodule had the same size and contained 100, 50, and 25 points, respectively (Fig. 3, model C).
In vitro experiment: cell seeding experiment in 2D culture
Chondrocyte preparation
Articular cartilage tissue was aseptically removed from the proximal humerus, distal femur, and proximal tibia of 4-week-old Japanese White rabbits (Oriental Bio Service Co., Ltd.). After any adherent connective tissue had been removed, the excised cartilage tissue was diced into 1-mm3 segments and chondrocytes were isolated by digesting small segments of cartilage with 0.25% trypsin-ethylenediaminetetraacetic acid (EDTA) (Nacalai Tesque, Inc.) for 30 min in a temperature-controlled bath at 37°C. After being rinsed twice with Dulbecco's phosphate-buffered saline (PBS; Nacalai Tesque, Inc.) and centrifuged at 1500 rpm for 5 min, the cartilage was enzymatically digested with 0.25% type II collagenase (CLS-2; Worthington Biochemical Co.) for 6 h at 37°C. After staining through a cell strainer (BD Falcon, Inc.) and washing twice with PBS, a single-cell suspension was obtained. Cartilage harvests from living animals were approved and accepted by the animal care committee of the Institute for Frontier Medical Sciences at the Kyoto University.
Cells were passaged once in T-flasks (Iwaki Glass Co., Ltd.) with the Dulbecco's modified Eagle's medium (DMEM; Nacalai Tesque, Inc.) containing 10% fetal bovine serum (FBS; Nacalai Tesque, Inc.) and 1% antibiotic mixture (10,000 U/mL penicillin, 10,000 mg/mL streptomycin, and 25 mg/mL amphotericin B; Nacalai Tesque, Inc.) before experimentation. Cells were cultured at 37°C in a humidified atmosphere of 95% air and 5% CO2 for 5 days, and the medium was changed every 2 days.
Substrate preparation
A polydimethylsiloxane (PDMS) liquid solution was prepared by using a SYLGARD 184 SILICONE ELASTOMER KIT (Dow Corning Toray Co., Ltd.) and curing for 48 h at room temperature in a culture dish (diameter, 150 mm; Asahi Glass Co., Ltd.). Afterward, the PDMS sheet was cut into disks that were 2 mm in thickness and 35 mm in diameter. Disks were sterilized by autoclave before experimentation.
CON, wild-type FIB, and L-RGDSx2 fibroin (LRF) were used as substrate coatings and prepared using the procedures listed below. Three substrate-coated disks were prepared for each substrate (CON, FIB, and LRF) and set in a culture dish (diameter, 35 mm; Asahi Glass Co., Ltd.). Each substrate disk was washed twice with PBS before use.
CON substrate: As a control, type I collagen-coated PDMS disks were used, with PDMS chosen due to its hydrophobic nature. The PDMS disks were soaked in 10% Cellmatrix Type I-C (Nitta gelatin, Inc.) diluted in HCl (pH 3.0, 1 mM) for 30 min at room temperature. Afterward, the plates were washed with a culture medium (DMEM) three times and with PBS twice thereafter.
FIB substrate: A FIB aqueous solution was prepared as described previously.5,14 Briefly, degummed silk FIB fibers from Bombyx mori cocoons were dissolved in a 9 M lithium bromide aqueous solution at room temperature, with the solution subsequently dialyzed against pure water. The concentration of FIB in the water solution was determined by the colorimetric method and was prepared to be 1% (wt/vol). Before coating the FIB substrate, PDMS disks were treated with O2 plasma to make the surface hydrophilic. The PDMS disks were then soaked in the FIB aqueous solution for 1 h at room temperature and dried at 50°C. The coated disks were immersed in an 80% methanol solution for 1 h and dried again at 50°C.
LRF substrate: The LRF is a protein in which (RGDS)x2 sequences have been fused with FIB L-chains at the aminoterminus. An LRF aqueous solution was prepared using the same technique as that used for the preparation of the wild-type FIB aqueous solution. PDMS disks coated with LRF were also manufactured in the same process as that used for the wild-type FIB samples.
Time-lapse microscopy
Passaged chondrocytes were removed from T-flasks by adding 0.25% trypsin-EDTA and washing twice with PBS. Shortly after detachment, cells were suspended in the Leibovitz's L-15 medium (Invitrogen Corp.) containing 10 vol% FBS, and 1 vol% antibiotic mixture and seeded on substrate dishes at a concentration of 1.5×10⁴ cells/cm2. Following that, the dish was placed on an inversion microscope (IX-71; Olympus Corp.) and enclosed in a small transparent culture chamber (MI-IBC-IF; Olympus Corp.) with in a humidified atmosphere at 37°C. A 10× magnification objective lens (CPlan N 10x/0.25 PhC; Olympus Corp.) was used in our experiment. During a 24-h culture, time-lapse phase-contrast images were captured every 10 min by a CCD camera (DP70; Olympus Corp.).
Chondrocyte distribution quantitation
To acquire positional datum related to the chondrocytes' distribution, the images, captured at 10 min, and 3, 6, 9, 12, and 24 h after seeding, were analyzed according to the following procedure. Each cell was outlined and painted over manually using Photoshop (Adobe Systems, Inc.) and cell binary images were generated. Afterward, the cell positions were sorted out using the Particles Analysis command in ImageJ (National Institutes of Health) (Fig. 1). Using this population data, Voronoi diagrams were produced and three indexes (AD, RFav, RFH) were calculated. The number of cells was also recorded, and the rate of cell growth was calculated by dividing the number of cells in each time step by the initial number of cells. Time-dependent changes in AD were fitted to a nonlinear regression model.
Statistical analysis and data presentation
Experimental values in each figure are presented as mean±standard deviation. One-way analysis of variance (ANOVA) and a Tukey's test for post hoc comparison were done to analyze the significance of time-dependent changes in RFH, RFav, AD, and the rate of cell growth in in vitro experiments. A Student's t-test was done to analyze the significance between the groups in the in vitro experiment. All statistical tests were determined using a criterion of p<0.05. An asymptotic exponential curve was used for regression analysis of the temporal AD changes on each substrate.
Results
The outcomes from in silico experiments
The RFav versus RFH versus AD shown in Figure 4 describes the results for RVav, RFH, and AD in the in silico experiments. These results were calculated from cell simulations using type A (Fig. 4a), type B (Fig. 4b), and type C (Fig. 4c) cell populations. In these conditions, RFav, RFH, and AD ranged from 0.65 to 0.80, from 0.74 to 0.90, and from 0.31 to 0.72, respectively.
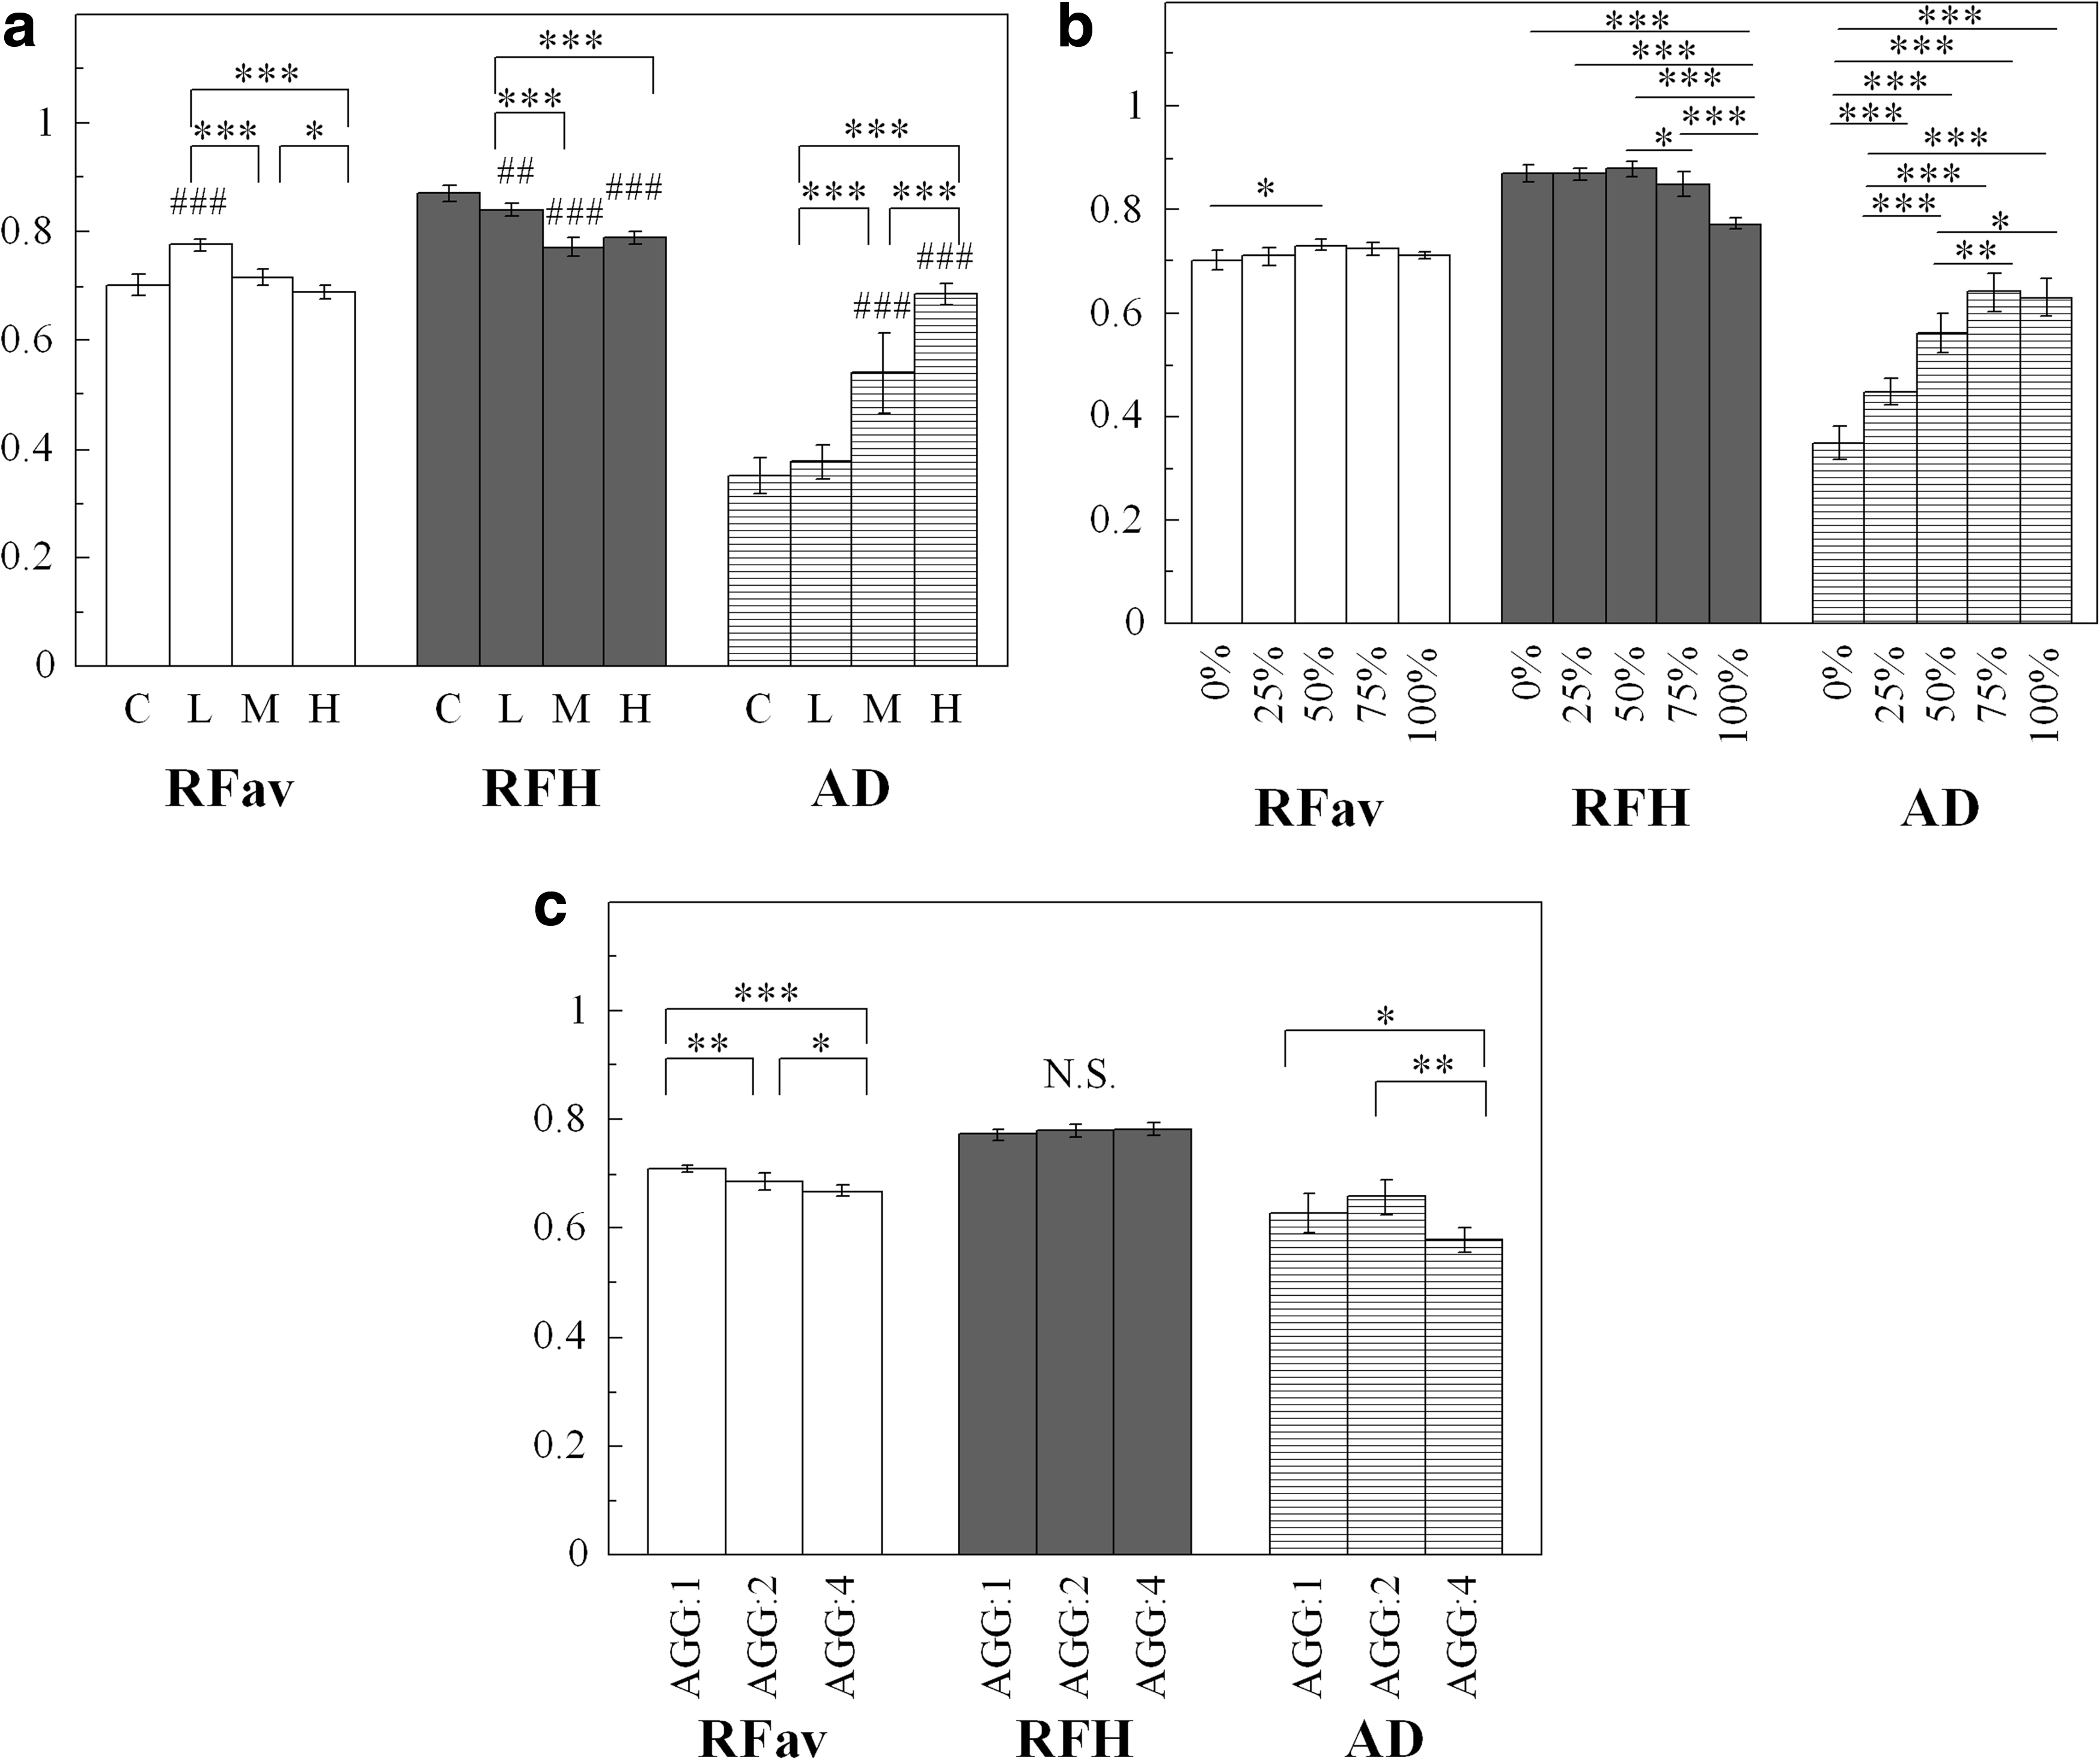
Derived round factor average (RFav), roundness factor homogeneity (RFH), and area disorder (AD) from model type A [
The statistical significance analysis indicates that RFav is insensitive to the rate at which cells participate in aggregation (Fig. 4b), and that RFH is insensitive to the number of cells involved in aggregation (Fig. 4c). On the other hand, AD results reveal a significant difference between multiple groups for all simulation types. Thus, AD appears to be more sensitive than RFav and RFH in evaluating aggregating cell populations, especially with respect to aggregate cell density and the ratio of cells involved in aggregation.
The outcomes from in vitro experiments
In Figure 5, chondrocytes on each substrate are shown after 12 and 24 h of culture time. On the CON substrate, chondrocytes elongated and few cells were found to be in contact with each other (CON). On both FIB substrates (FIB and LRF), most chondrocytes maintained a rounded shape and participated in cell aggregation. Chondrocytes on these substrates were active in migration during the early stages of cell culture, but cell speed appeared to decrease with cell aggregation. Compared with the LRF substrate, the aggregation size was larger and fewer cells remained solitary on the FIB substrate.
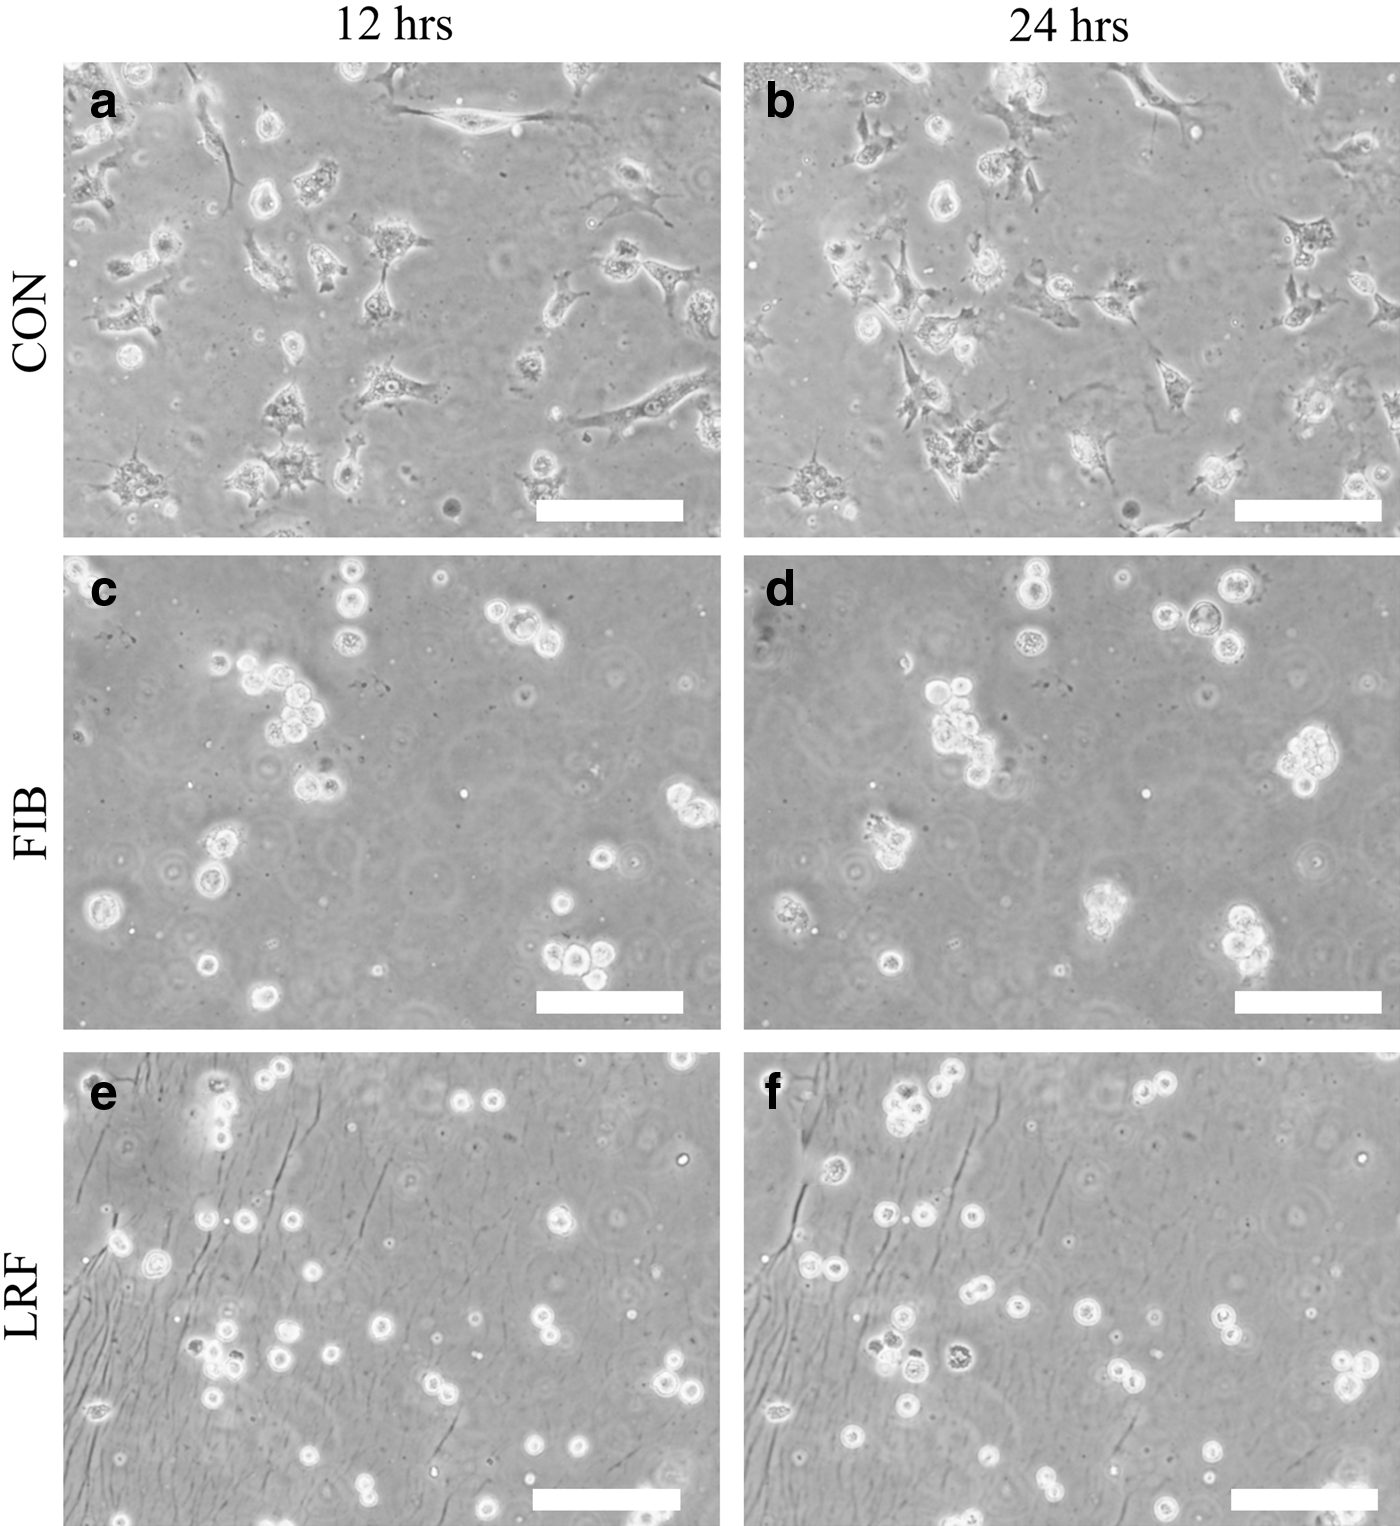
Phase-contrast images of chondrocytes cultured on collagen
Chondrocytes on the FIB and LRF substrates did not increase significantly in the 24-h culture period, as shown in Figure 6. Only on the CON substrate was significant cell growth observed (p<0.01, one-way ANOVA). Furthermore, significant differences in the temporal cell growth on the CON substrate were found only between 10 min–24 h (p<0.01), 3–24 h (p<0.01), and 12–24 h (p<0.05, Tukey test) of culture time. Thus, there were no significant changes in cell proliferation during the first 12 h after seeding on each surface.
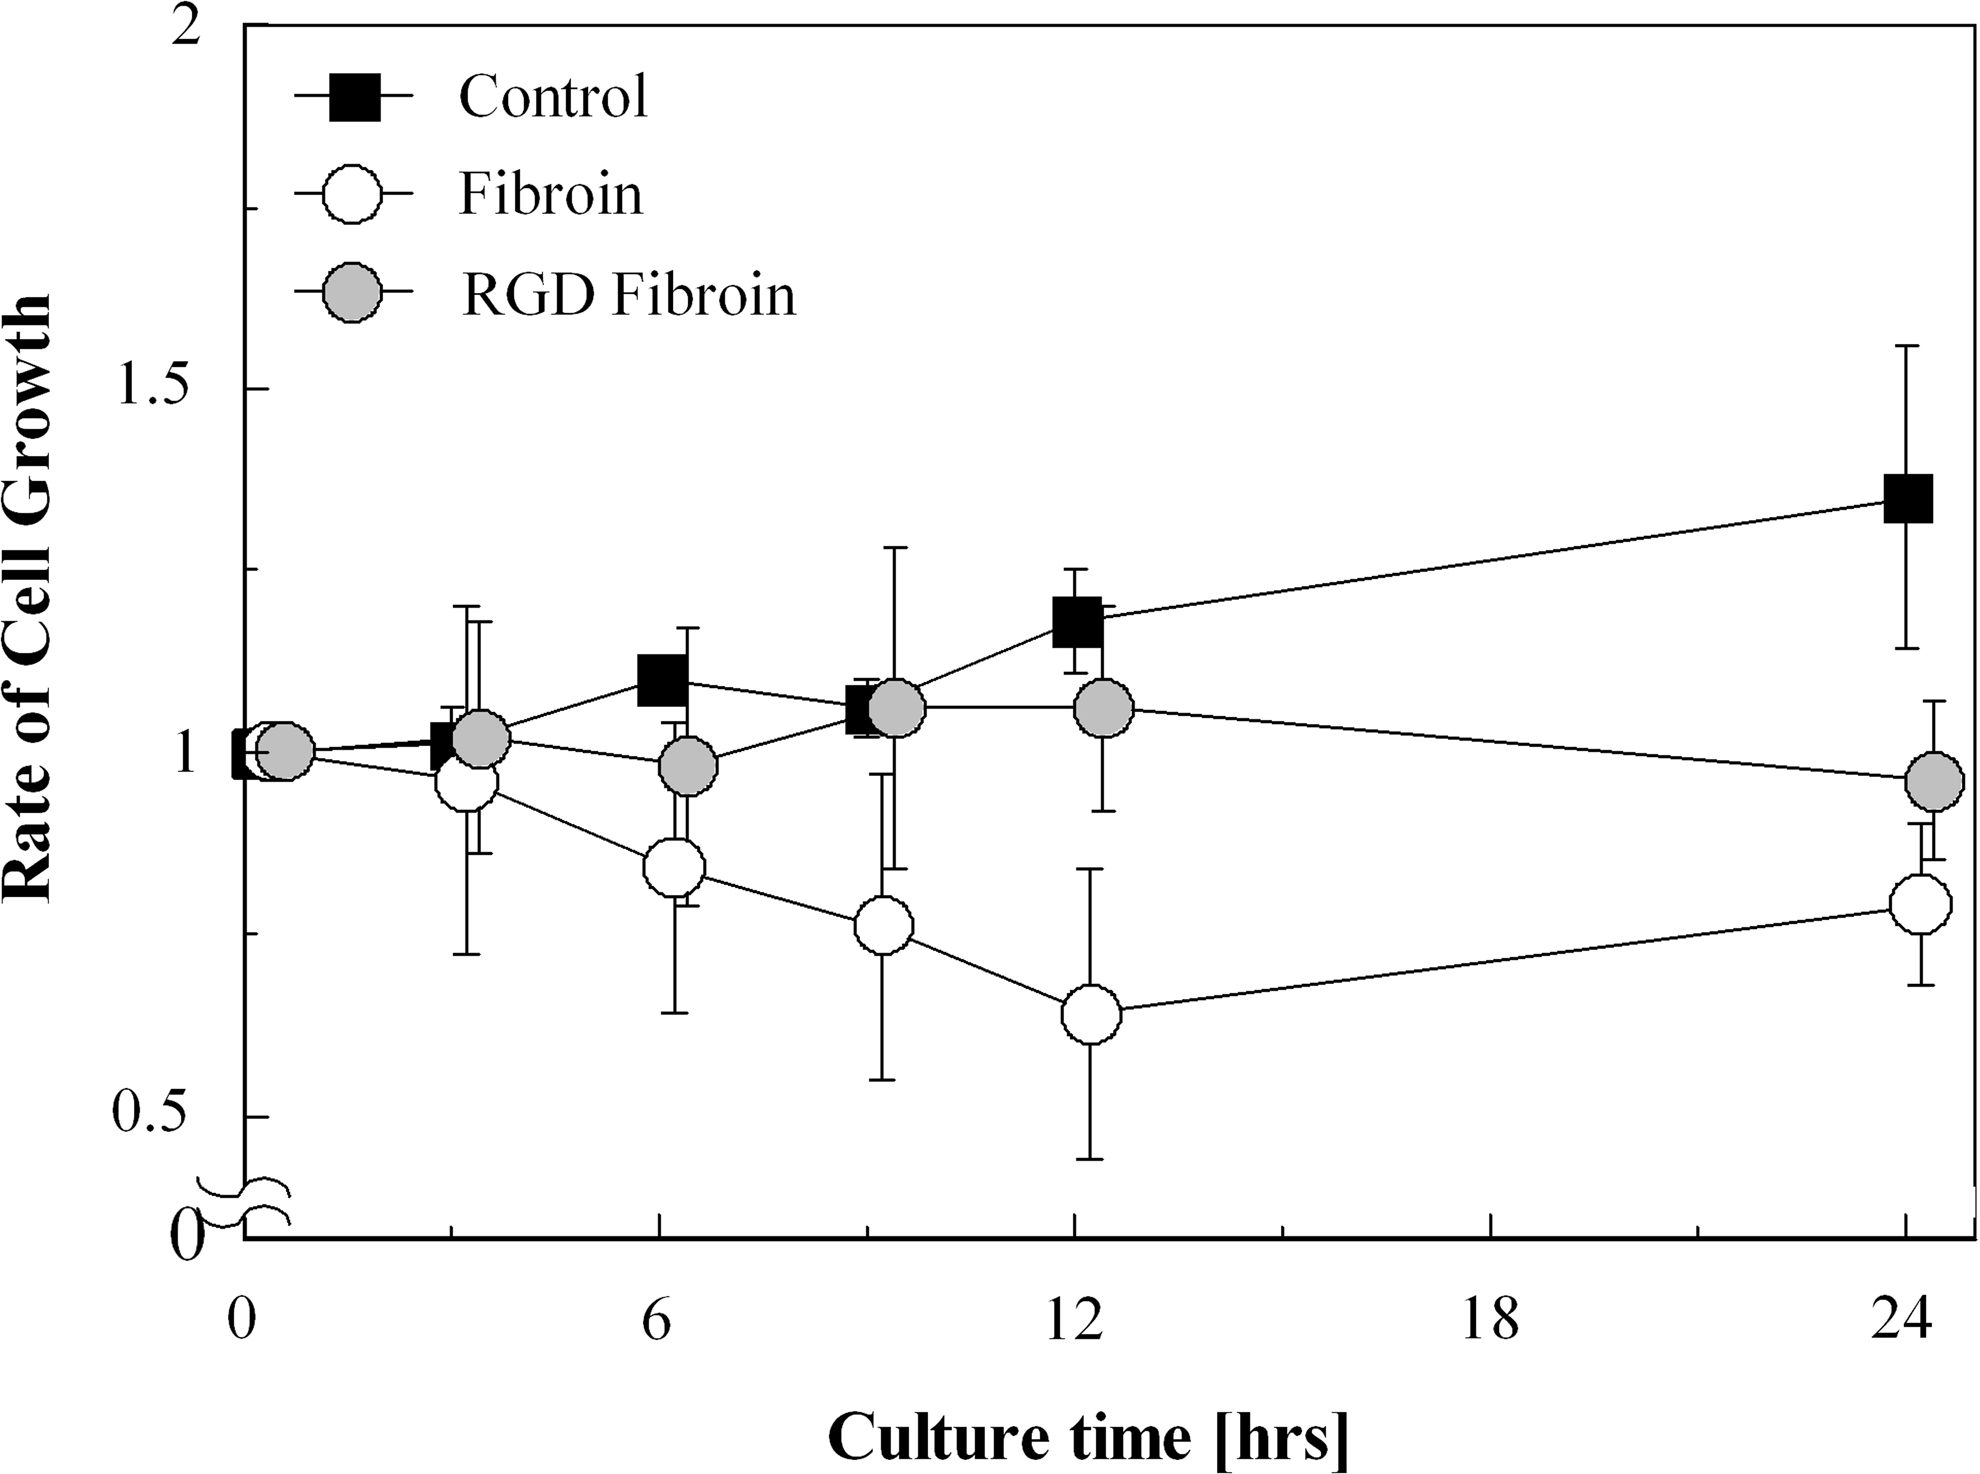
Temporal changes in chondrocyte growth rate on each substrate. The significant change in the number of observed chondrocytes was seen only on the collagen surface by one-way analysis of variance. Error bars indicate square distributions; n=3.
The time-dependent changes in RFav, RFH, and AD for chondrocytes grown on each substrate are shown in Figure 7. The initial value for each index was almost the same for each substrate, but the RFav and AD values for the FIB substrate and all three indices for the LRF substrate changed significantly over the 24-h culture period (p<0.05, one-way ANOVA). The absence of change in the indexes recorded for the CON substrates was probably caused by the cells lack of aggregation. Asymptotic exponential curves were fitted to the mean values of the AD index in a time-dependent manner for every substrate (Fig. 8) The relaxation time was 1.56 for the FIB substrate and 4.39 for the LRF substrate, and the AD values for the FIB and LRF substrates were fixed at 0.54 and 0.49, respectively, during the 24-h culture period.

Temporal changes in RFav
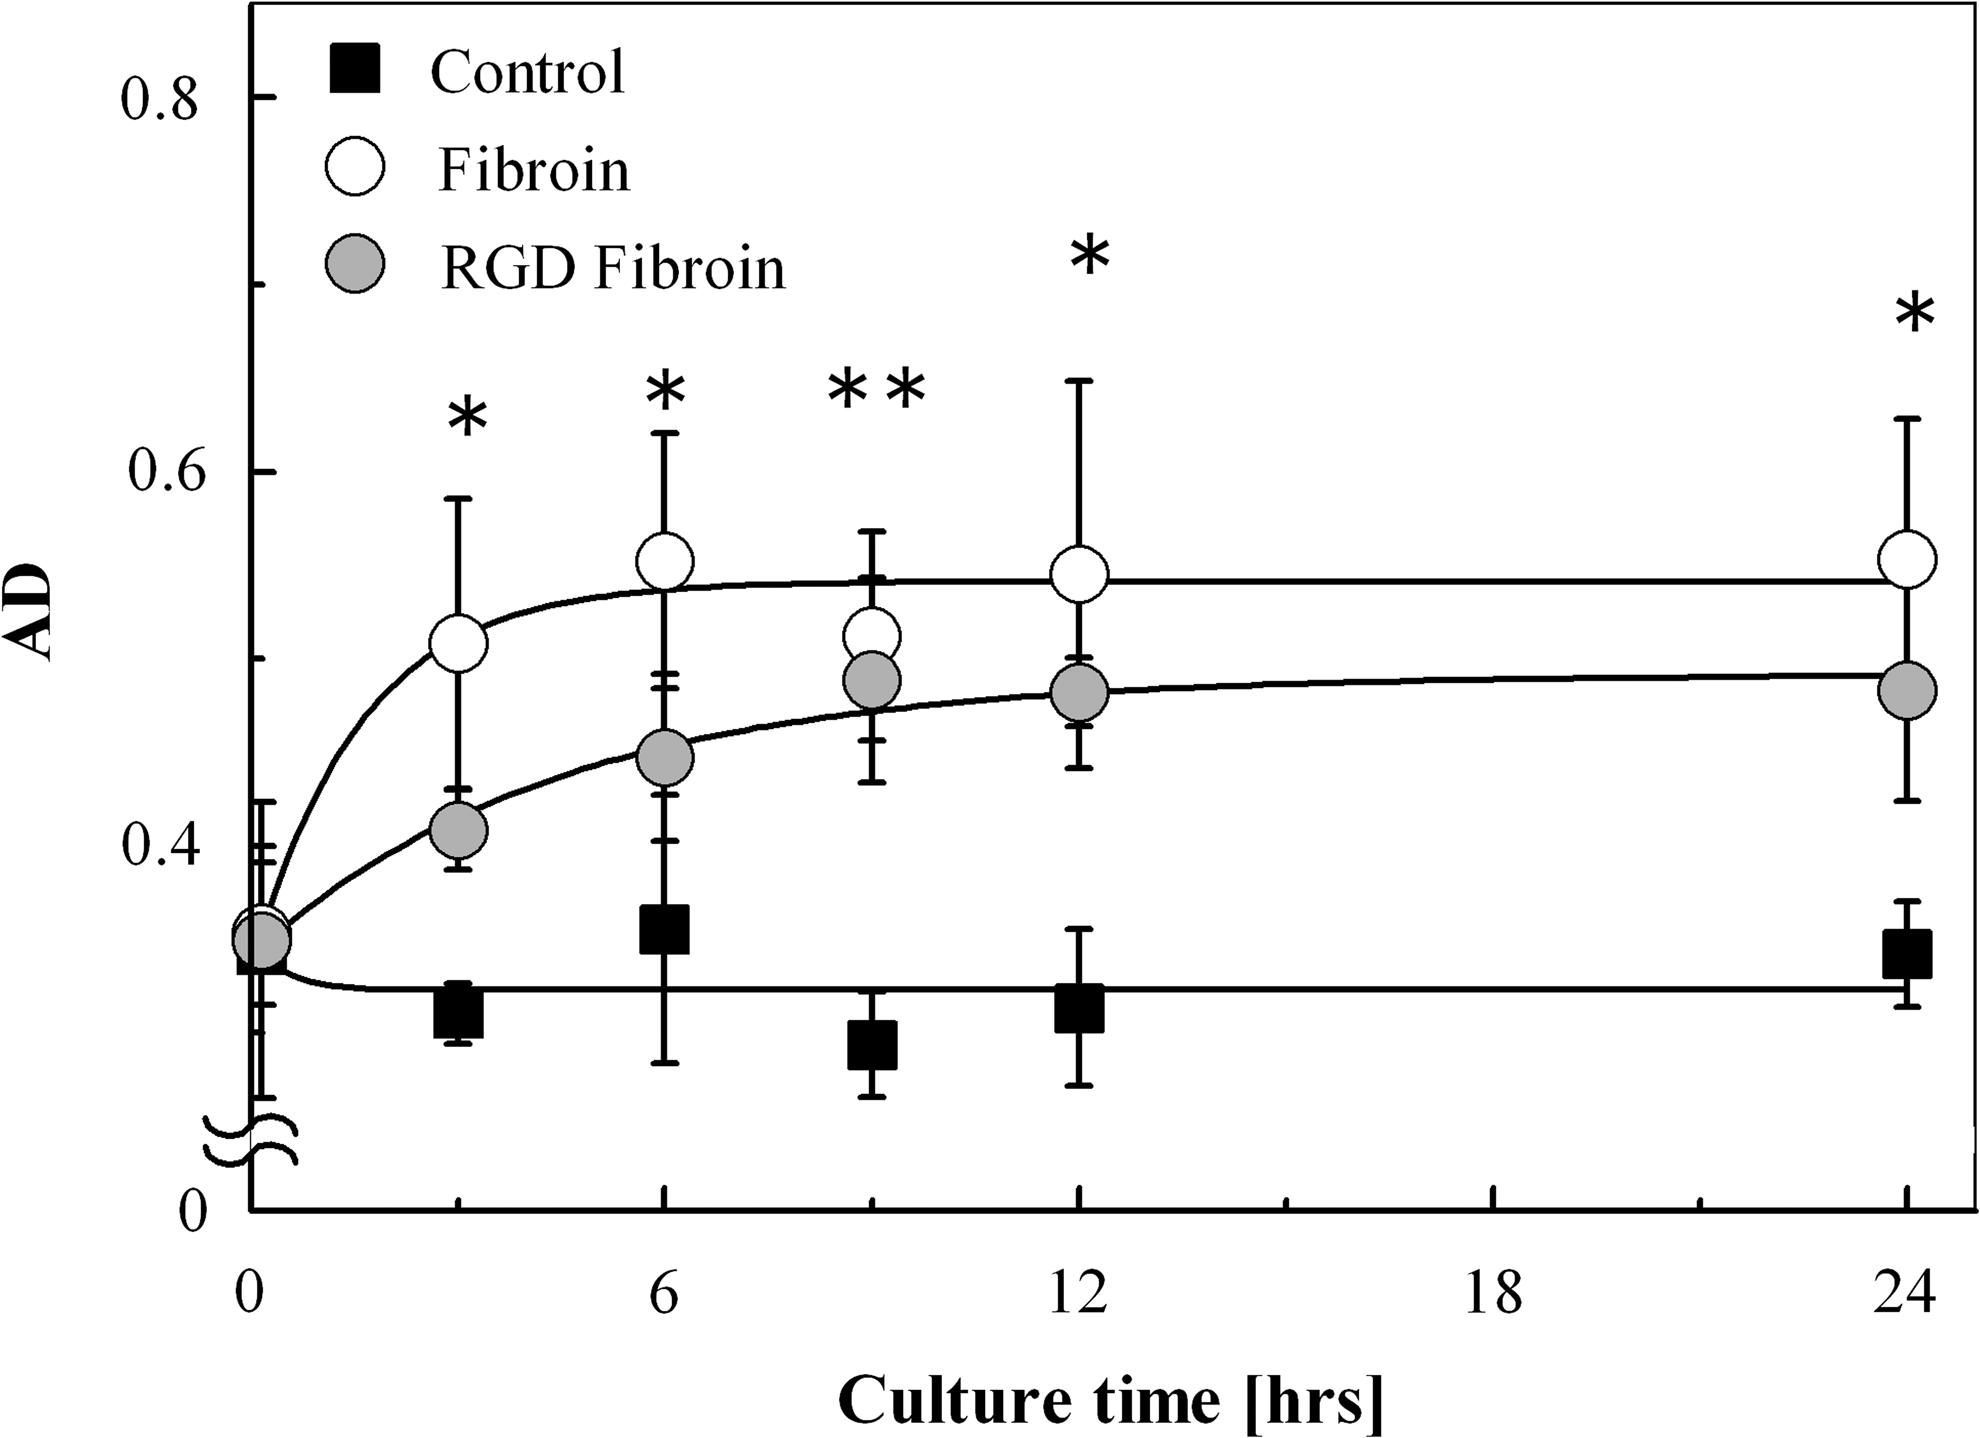
Regression analysis of temporal AD changes for each substrate, resulting in a fit with R2 of 0.13 (collagen), 0.96 (wild-type fibroin), and 0.99 (RGD fibroin). Each AD value converged to 0.32, 0.54, and 0.49, with a relaxation time of 0.44, 1.56, and 4.39 h, on collagen, wild-type fibroin, and RGD fibroin, respectively. *indicates significance between control and fibroin groups. *p<0.05, **p<0.01; by t-test.
Discussion
The purpose of this study was to investigate how best to quantitatively characterize cell populations in various culture conditions. The results of simulation testing showed that RFav and RFH were insensitive to the rate at which cells participated in aggregation and the number of cells involved in aggregation, respectively. However, there appeared to be a direct relationship between AD and the degree of aggregation, with increasing AD values observed for increasing cell aggregation. The significance of this relationship was confirmed statistically (Tukey–Kramer test, p<0.05). Using this information, the results of the in vitro experiments were analyzed and the cell aggregation behavior on the different substrates analyzed. According to the time-dependent changes in AD, the FIB surface seems to be quite different from the CON surface with respect to multicellular behavior. Promotion of cell aggregation seems to be one of the characteristics of FIB substrates, and has been reported in other studies as well.3,5 Using observational techniques, it is easy to qualitatively distinguish the differences between CON and FIB surfaces with respect to chondrocyte migration and population (Fig. 5a, b). However, it is quite difficult to determine whether wild-type FIB is different from RGD fibroin in terms of cell population, because this difference is too subtle to discern simply from observing photographic evidence (Fig. 5b, c). In that respect, the quantitative results of this study have demonstrated that multicellular behavior is affected by the coating substrate material, and have revealed different time-dependent processes.
There are few criteria for evaluating aggregated cell populations using a Voronoi diagram; so, three typical sets of cell population distribution were conducted in a simulation experiment. In the aggregation distribution model, all three indexes (AD, RFav, and RFH) changed according to the degree of cell density (type A), the degree of cell participation in aggregating (type B), and the number of cells in a single aggregate (type C). In types A and B, as the cells came closer to each other or as more cells became more aggregated, the cell density gap increased between crowded and barren areas, and subsequently led to an increase in AD and a decrease in RFH. Similarly, Marcelpoil and Usson suggested that an increase in AD signifies populations containing aggregates in particular locations, whereas a decrease in RFH signifies populations containing barren islets. 12 Moreover, Nawrocki Raby et al. defined the shift from initial distribution toward clustering as the increase of AD (from 0.33 to 0.57) in conjunction with the decrease of RFH (from 0.80 to 0.77). 9 In the in vitro experiments, AD, on average, increased significantly from 0.35±0.04 to 0.55±0.07 and from 0.35±0.02 to 0.48±0.06 for FIB and LRF substrates, respectively. On the other hand, RFH, on average, was decreased from 0.86±0.032 to 0.84±0.003 and from 0.88±0.007 to 0.86±0.002 for FIB and LRF substrates, respectively. Even though, RFH decreased for both FIB and LRF substrates, statistical significances were detected only for LRF.
There is one considerable reason why RFH did not change significantly. When less than half of the cells are in aggregation in simulation model type B, RFH values remain around 0.76, whereas RFH sensitively decreases when more than half of the cells are aggregated. In addition, it seems that cell density in a cluster can also affect RFH values. Based on the results above, the RFH index varies only in the latest phase of aggregation process when a majority of cells come close to each other. On the other hand, the AD index increases gradually with cell aggregation in model types A and B. So, as far as evaluating chondrocyte aggregation on FIB surfaces (like in Fig. 5), AD is more appropriate than RFH. In fact, temporal changes in AD matched well with the qualitative impressions observed experimentally.
The degree of aggregate formation has been expressed subjectively in the histomorphology field. The AD index seems to best characterize cell-aggregate populations among the three indexes of the Voronoi Diagram under the hypotheses that positive correlation with models A (H, M, and L) and B (0%, 25%, 50%, 75%, and 100%) together with no correlation with model C (AGG1, AGG2, and AGG3) agrees with the subjective criteria for aggregation. From time-lapse microscopy, most events in cell aggregation were observed during the first 12 h after seeding, with cell migration subsequently normalizing, followed by cell–cell adhesion. From this analysis, chondrocyte aggregation was supposed to be a relaxation process; hence, regression analysis was performed to fit the temporal AD changes recorded for each substrate into an asymptotic exponential model. As a result, the decrease in relaxation time between FIB and LRF suggests that regression analysis of AD can be used to assess whether culture substrates can affect the cell aggregation process. Interestingly, the aggregation speed was delayed from 1.56 to 4.39 h on the RGDSx2 peptide interfused FIB substrate.
An RGD amino acid sequence is the minimum unit of a cell–substrate adhesive activity domain, which is a ligand of integrin.15,16 Ryan et al. reported that decreasing substratum adhesiveness might lead to a slower rate of cell aggregation spreading over the substrate. 17 Moreover, Briggs et al. reported that the weakening of cell–substrate adhesion and the formation of cell aggregates were observed simultaneously and also accompanied the osteogenic differentiation of mesenchymal stem cells. 18 These results suggest that a balance between cell–cell and cell–substrate adhesion is one of the important factors in predicting cell aggregate formation/deformation. On the other hand, Kambe et al. reported that RGDSx2 peptide interfused into silk FIB significantly increased the cell adhesive force until 12 h after seeding. 19 Taking the above into consideration, it may be possible that cell–substrate adhesiveness decreases the tendency and speed of chondrocyte aggregate formation as the adhesive force of FIB increases.
AD analysis may be able to evaluate the motility of cellular aggregates, especially with respect to speed, which is not measured in qualitative observation. However, there are many hurdles that still remain to be cleared before this method is ready for use in tissue engineering. One of the most important problems that need to be addressed is how to translate multicellular behavior indices into design criteria for biological tissue growth. Certainly, the mechanisms underlying regeneration processes are regulated by not only by cytoskeletal-mediated force transmission factors, such as integrin and cadherin, but also by a network of genetic or biochemical signaling pathways. For the FIB scaffold design, it is still unclear how the chondrocyte aggregation process affects the maintenance of the cartilaginous phenotype during tissue regeneration; hence, genetical or histological surveys are needed in future studies. Moreover, cell aggregation must be assessed carefully, because cell motility and cohesion are phenomena that are central to cell organization within tissue scaffolds. Lauffenburger et al. stated that maximally useful engineering design principles for cell organization within tissue structures will require the most comprehensive models for cell motility behavior to be able to predict multicellular organization from quantifiable characteristics of cell–matrix and cell–cell interactions. 20 In this respect, AD is an unrefined, but easy-to-use tool for characterizing cell aggregation, and can be one of the approaches used to investigate spatiotemporal characteristics of cell–matrix and cell–cell interactions.
Conclusions
The findings obtained from this study are the following: (1) Three indexes (RFav, RFH, and AD) of the Voronoi diagram identified the differences in spatiotemporal changes between chondrocytes grown on FIB and CON surfaces; (2) The regression analysis of the AD index revealed the speed of cells during aggregation; and (3) Transgenic RGDS sequences reduced the aggregate formation of chondrocytes cultured on FIB.
Footnotes
Acknowledgments
We would like to thank Alex Turner for helping to improve the manuscript; the Kyoto University Venture Business Laboratory and the Institute for Frontier Medical Sciences of Kyoto University for use of their facilities. This work was supported by the Grant-in-Aid for the Creative Scientific Research from the Japan Science and Technology Agency; the Agri-Health Translational Project from the Ministry of Agriculture, Forestry and Fisheries, Japan; and the Student venture support system grant from the Advanced Scientific Technology and Management Research Institute of Kyoto.
Disclosure Statement
No competing financial interests exist.