
Abstract
The design of in vitro models that mimic the stratified multicellular hepatic microenvironment continues to be challenging. Although several in vitro hepatic cultures have been shown to exhibit liver functions, their physiological relevance is limited due to significant deviation from in vivo cellular composition. We report the assembly of a novel three-dimensional (3D) organotypic liver model incorporating three different cell types (hepatocytes, liver sinusoidal endothelial cells, and Kupffer cells) and a polymeric interface that mimics the Space of Disse. The nanoscale interface is detachable, optically transparent, derived from self-assembled polyelectrolyte multilayers, and exhibits a Young's modulus similar to in vivo values for liver tissue. Only the 3D liver models simultaneously maintain hepatic phenotype and elicit proliferation, while achieving cellular ratios found in vivo. The nanoscale detachable polymeric interfaces can be modulated to mimic basement membranes that exhibit a wide range of physical properties. This facile approach offers a versatile new avenue in the assembly of engineered tissues. These results demonstrate the ability of the tri-cellular 3D cultures to serve as an organotypic hepatic model that elicits proliferation and maintenance of phenotype and in vivo-like cellular ratios.
Introduction
There is a growing recognition that hepatic cell cultures should mimic the in vivo structure of the liver.12,13 In the liver, hepatic parenchymal cells are separated from NPCs by an interfacial region known as the Space of Disse. 1 This protein-enriched interface exhibits a thickness in the 0.5–1 μm range and plays a critical role in the transfer of signaling molecules and nutrients between hepatic cells.1,14 Approaches to recapitulate this three-dimensional (3D) structure include reconfigurable cell culture substrates, 12 multicompartmental cocultures, 15 magnetite beads, 16 and thermally responsive polymers. 17 We have previously demonstrated that polyelectrolyte multilayer (PEMs) can serve as a substitute for the Space of Disse.13,18,19 Multilayers were first self-assembled above a confluent layer of hepatocytes followed by endothelial cells. These 3D hepatic cultures exhibited enhanced protein secretion, detoxification and bile acid homeostasis.13,18–20 Although this approach was a significant advance, the deposition of a PEM on live cells posed constraints on tuning its properties.
We report the design of a novel 3D organotypic liver model assembled with three cell types (hepatocytes, LSECs and KCs) and a PEM that mimics the Space of Disse. The PEM was assembled offline, detached, and placed between layers of hepatic cells. These detachable 400–600 nm thick PEMs are optically transparent and exhibit a Young's modulus similar to in vivo values for liver. This liver model maintained the phenotype of all cell types over a 12 day period. Remarkably, each cell type proliferated in this model, while maintaining cellular ratios found in vivo. These trends were not observed in 2D cocultures of any combination of cell types.
Experimental Procedures
Dulbecco's modified Eagle's medium (DMEM), phosphate-buffered saline (PBS), Hank's buffered salt solution, Earle's balanced salt solution, penicillin, streptomycin, human plasma fibronectin, and trypsin-ethylenediaminetetraacetic acid were obtained from Invitrogen Life Technologies. Type IV collagenase, HEPES (4-[2-hydroxyethyl] piperazine-1-ethanesulfonic acid), glucagon, calcium chloride, hydrocortisone, sodium dodecyl sulfate, hydrogen peroxide, glutaraldehyde, dicumarol, 3-methylcholanthrene, calf thymus DNA, chitosan, and hyaluronic acid (HA) were purchased from Sigma-Aldrich. All other chemicals, unless otherwise noted, were used as received from Fisher Scientific.
Assembly of detachable polymeric Space of Disse
Chitosan (cationic) and HA (anionic) were used to assemble detachable PEMs. Chitosan was dissolved in 1% v/v acetic acid and HA in 18 MΩ cm water (Hydro). Their concentrations ranged from 1 to 5 mM. The pH of the polyelectrolyte (PE) solutions was maintained at 4.0 and 5.0 for chitosan and HA, respectively. PEMs were assembled on hydrophobic poly-tetrafluoroethylene (PTFE; McMaster-Carr) substrates using a robotic deposition system (NanoStrata). Water contact angle values (KSV Instruments) on clean PTFE substrates ranged from 111.9±4.2 (n=15). The assembly conditions of PEMs, such as the number of bilayers (BLs) (7.5–20) and the deposition time (20–40 min) were varied to optimize detachability. The PEMs were cross-linked with glutaraldehyde (8% w/v), rinsed, vacuum-dried, and tested for detachability. Before cell-culture, PEMs were sterilized under germicidal UV up to 1 h. The stability of PEMs in aqueous solutions was determined by placing PEMs in 1× PBS and monitoring the change in mass over a 10-day period.
Profilometry and optical properties
A Veeco Dektak 150 (Bruker AXS) profiler was used to determine the dry and hydrated thickness of PEMs. The scan length was maintained at 1000 μm. Thickness values reported were measured at three different locations per sample for three different samples. The transmission of light in the 400 to 900 nm range was measured using a UV/vis spectrophotometer (Perkin-Elmer Lambda 25) for dry and hydrated PEMs. Hydrated measurements were performed on PEMs maintained in PBS for 24 h, excess water was wicked away and measurements were performed within 5 min to prevent dehydration.
Atomic force microscopy measurements on surface topography and Young's modulus
The surface topography of the detachable polymeric membrane was measured through atomic force microscopy (Bruker ACS). Measurements were conducted using a conical silicon nitride DNP tip with a spring constant of 0.06 N/m (Veeco) in contact mode at a scanning rate of 1 Hz. The surface roughness was analyzed using Nanoscope™ software (Bruker AXS).
The Young's modulus of dried PEMs was obtained in contact mode using a pyramidal-tipped silicon nitride cantilever blunted with a half open angle of 36° with a spring constant of 0.24 N/m (Bruker AXS). Force curves were obtained at a scan rate of 2 Hz. A Hertz cone model was used to calculate the elastic modulus for indentations up to 5% of the overall PEM thickness. The force applied during indentation, F, was calculated using Hooke's Law:
where k is the spring constant of the cantilever, d is the deflection of the cantilever, and d0 is the deflection point during contact. The force applied can be related to the Young's modulus of the indented material through the Hertz model:
where α is the half open angle of the tip=36°, E is the Young's modulus of the material, ν is the Poisson's ratio (maintained at 0.35), 21 and δ is the indentation. PEMs were dried up to 48 h under vacuum at 50°C and rehydrated with 1× PBS to obtain measurements under dry and hydrated conditions, respectively.
Isolation and culture of hepatocytes and LSECs and KCs
Primary hepatocytes were isolated from female Lewis rats (Harlan; weighing 175–199 g) utilizing a two-step in situ collagenase perfusion method.2,3,13,18,19,22 Animal care and surgical procedures were conducted in accordance with the Virginia Tech's IACUC Committee. Hepatocyte yield ranged from 150–200×106 cells and their viability was determined to be 90%–95% based on trypan blue exclusion. LSECs, from the same isolation, were obtained using differential adhesion and were cultured on fibronectin coated flasks. 13 Cryopreserved primary rat KCs (Invitrogen Life Technologies) were maintained in DMEM supplemented with 10% (v/v) heat-inactivated fetal bovine serum, 100 U/mL penicillin, 100 μg/mL streptomycin, 10 μg/mL insulin, and 100 μM β-mercaptoethanol.
Assembly of multicellular hepatic cultures
Hepatocytes were initially cultured as monolayers up to 72 h in 12-well tissue culture polystyrene plates (BD,) coated with rat-tail type 1 collagen (BD Biosciences) (Fig. 1).13,18 For 2D multicellular cultures, only LSECs, KCs, or both were seeded, thereafter. For the 3D liver models, UV-sterilized detachable PEMs (12.5 or 15 BL) were placed above the layer of hepatocytes. The PEMs were hydrated in the presence of hepatocyte culture medium for 1 h. Thereafter, either 12,500, 25, 000, or 100,000 LSECs were seeded on the PEM. In cultures containing KCs, initially 50,000 cells were seeded on the PEM or to the 2D culture to obtain an initial ratio of 10:1 hepatocytes:KCs to emulate healthy livers. 11 All multicellular cultures (2D and 3D) were maintained in hepatocyte culture medium. Henceforth, cultures containing more than one cell type are noted as 3DHLK or 2DHLK, where 3D and 2D denote a 3D liver model and a 2D coculture, respectively, H denotes hepatocytes, L denotes LSECs, and K denotes KCs. For example, a 2D coculture of hepatocytes and LSECs is denoted by 2DHL. A 3D culture containing only hepatocytes and LSECs is denoted as 3DHL and as 3DHLK upon the addition of KCs.

Schematic of assembling a liver model. Color images available online at
Imaging LSECs, KCs and hepatic stellate cells
Hepatic cultures containing LSECs and KCs were fixed in glutaraldehyde/PBS (2% [v/v]), exposed to 0.1% Triton X-100, and placed in a 1% (w/v) BSA/PBS blocking solution. The cultures were exposed to the mouse sinusoidal endothelial −1 (SE-1) antibody (ImmunoBiological Laboratories) and a TRITC-conjugated secondary rabbit anti-mouse IgG antibody (Sigma-Aldrich). Thereafter, the cultures were incubated with a FITC-conjugated monoclonal CD163 antibody to identify KCs. The presence of hepatic stellate cells (HSCs), observed at very low concentrations in the purified hepatocyte fraction, was verified by the incorporation of Oil Red O (0.2%; Sigma-Aldrich). Imaging was conducted on a Zeiss LSM confocal microscope.
Separation of hepatic cells in 2D and 3D cultures
Multicellular hepatic cultures (2D and 3D) were exposed sequentially to Dynabeads® (CELLection™ Kit; Invitrogen Life Technologies) coated with SE-1 and CD163 antibodies. 23 LSEC and KC fractions were collected using a magnet (DynaMag™; Invitrogen Life Technologies).
Western immunoblotting of T-cadherin (CDH 13)
The hepatocyte fraction from HM, CS, 3DHL, and 3DHLK cultures were lysed and treated with a protease inhibitor cocktail (Sigma-Aldrich). Total protein in each sample was measured using a BCA protein assay (Thermo-Scientific). Electrophoresis and transfer were conducted on a 10% Tris-glycine gel (Invitrogen Life Technologies) and polyvinylidene fluoride membrane (Invitrogen Life Technologies), respectively. CDH13 was detected by exposure to the primary antibody for CDH13 (rabbit polyclonal anti-T-cadherin; Santa Cruz Biotechnology) and subsequent exposure to a secondary HRP-conjugated antibody (anti-rabbit IgG; Bio-Rad). The protein was detected by developing the membrane using a chemiluminescent HRP substrate (Immun-Star™ WesternC™; Bio-Rad). The membrane was scanned using the Chemidoc™ XRS+ system (Bio-Rad and analyzed using Image Lab™ software (Bio-Rad).
Statistical analysis
The urea and albumin assays are nondestructive. Therefore, measurements could be taken from the same sample on day 4 and on day 12, enabling the computation of the fold change for each sample. Since assays were done in triplicate, three fold change values were available for both the urea and albumin assays, allowing the use of the t-test to compare any pair of culture conditions. Since the CYP1A1 assay is destructive, measurements were taken from different samples on day 4 and on day 12. For each culture system, the average of the three measurements on day 12 were compared to those obtained on day 4 to compute the fold change, with the t-test used to compute the significance of the fold change. Bonferroni's correction was applied to adjust for multiple hypotheses testing.
Total RNA extraction
Total RNA was extracted from hepatocytes using an RNeasy mini kit (Qiagen). Samples in triplicate were labeled according to the Affymetrix Standard Target labeling process, and hybridized to the GeneChip Rat Genome 230 2.0 (Affymetrix). Complementary RNA synthesis, hybridization, and GeneChip scanning were performed at the Virginia Bioinformatics Institute Core Laboratory.
Gene expression analysis
Gene expression data were obtained and analyzed for HM, CS, 2DHL, 2DHLK, 3DHL, and 3DHLK on day 12. For each sample, three replicates were analyzed. All samples passed the quality controls imposed by the Simpleaffy package.
24
The samples were normalized using the GeneChip RMA (GCRMA) method.
25
For each of the contrasts, functional enrichment was performed on the normalized data using the Gene Set Enrichment Analysis (GSEA) package.
26
Please refer to the Supplementary Data for details (Supplementary Data are available online at
Results
Assembly of detachable, nanoscale PEMs
PEMs comprised of HA and chitosan were assembled on inert, hydrophobic substrates. The successful detachment of the PEM was facilitated by substrate hydrophobicity.27,28 The ease of detachment of PEMs was tested as a function of the number of BLs, PE concentration, and deposition time. To obtain 0.5–1 μm PEMs, the number of BLs was decreased, while increasing PE concentration and deposition times (Supplementary Table S1). Using this approach, nanoscale PEMs were obtained with 12.5 (400±30 nm) and 15 (654±18 nm) BLs under dry conditions (Table 1). These PEMs were easily detached and could be use to assemble liver models (Fig. 2A).

Properties of detachable 12.5 bilayer (BL) polyelectrolyte multilayers (PEMs).
BL, bilayers.
Due to the ionic nature of PEMs, they dissolved within 5 min when exposed to aqueous solutions. To increase their aqueous stability, PEMs were briefly cross-linked with glutaraldehyde. Upon extensive rinsing, the retention in mass was >85% and no cytotoxicity 28 was observed as a result of cross-linking chemistry. The surfaces were found to be essentially smooth for unmodified and cross-linked 12.5 and 15 BL PEMs with no pores. The average surface roughness ranged from 8 to 9 nm (Table 1 and Fig. 2B). Under hydrated conditions, cross-linked PEMs exhibited thicknesses of 751±29 nm (12.5 BL) and 1023±46 nm (15 BL), respectively, roughly 1.5 times that of non-hydrated PEMs (Table 1). These PEMs formed a polymeric interface whose height was virtually identical to the Space of Disse.1,14
An important criterion was ensuring the transparency of the polymeric Space of Disse, to facilitate the visual inspection and imaging of layers of cells above and below the PEM. The transmission of visible light increased from ∼85% for dried PEMs to greater than 99% upon hydration (Fig. 2C). Another critical parameter was tuning the mechanical properties of the PEM to match those reported for liver. 29 The modulus of bulk liver is reported to range from 40–100 kPa. 29 For unmodified dry PEMs, the Young's modulus was 52.16±14.31 (12.5 BL) and 49.01±16.67 MPa (15 BL), which increased two-fold upon cross-linking (Table 1). The modulus of cross-linked hydrated PEMs decreased to 41.79±3.65 kPa (12.5 BL) and 38.15±2.62 kPa (15 BL), yielding multilayers whose mechanical properties matched those of liver tissue. As a comparison between liver models and CS cultures, the Young's modulus of a hydrated collagen gel was found to be 94.42±1.54 kPa (n=3).
Assembly of 2D and 3D multicellular cultures
Urea production and albumin secretion were measured over a 12-day culture period to optimize cell numbers (2D and 3D cultures) and the number of BLs (3D cultures). To optimize hepatic function, the number of LSECs seeded was varied between 12,500 up to 100,000. Initial results indicated that PEMs with 12.5 BLs and 25,000 LSECs exhibited higher albumin production when compared to cultures with other LSEC concentrations (Supplementary Fig. S1). In addition, there was a better match between the thickness of the Space of Disse and the 12.5 BL PEMs. Therefore, subsequent investigations focused upon cultures that contained 12.5 BL PEMs started with 500,000 hepatocytes, 25,000 LSECs, and 50,000 KCs.
Assessing the phenotype of hepatic cells
Immunostaining was used to monitor the phenotype for LSECs and KCs on days 4 and 12 in all cultures. The phenotype of LSECs and KCs was confirmed through expression of the SE-1 antigen 12 and CD163, respectively. 30 HM and CS cultures did not exhibit fluorescence indicating the absence of LSECs or KCs (Supplementary Fig. S2). Monolayers of LSECs exhibited weak fluorescence only on day 4 and none on day 12 (Fig. 3A, B) matching previous studies.13,31 A similar trend was observed in 2D cocultures of hepatocytes with LSECs (2DHL and 2DHLK) (Fig. 3E, F). In contrast, LSECs in the 3D cultures (3DHL and 3DHLK) not only maintained SE-1 antigen expression over the 12-day culture period but also exhibited significant proliferation (Fig. 3I–L). KCs exhibited CD163 marker in monolayers (Fig. 3C, D), 2D (Fig. 3G, H) and 3D (Fig. 3K, L) multicellular cultures over the 12 day period, although their rates of proliferation varied significantly.
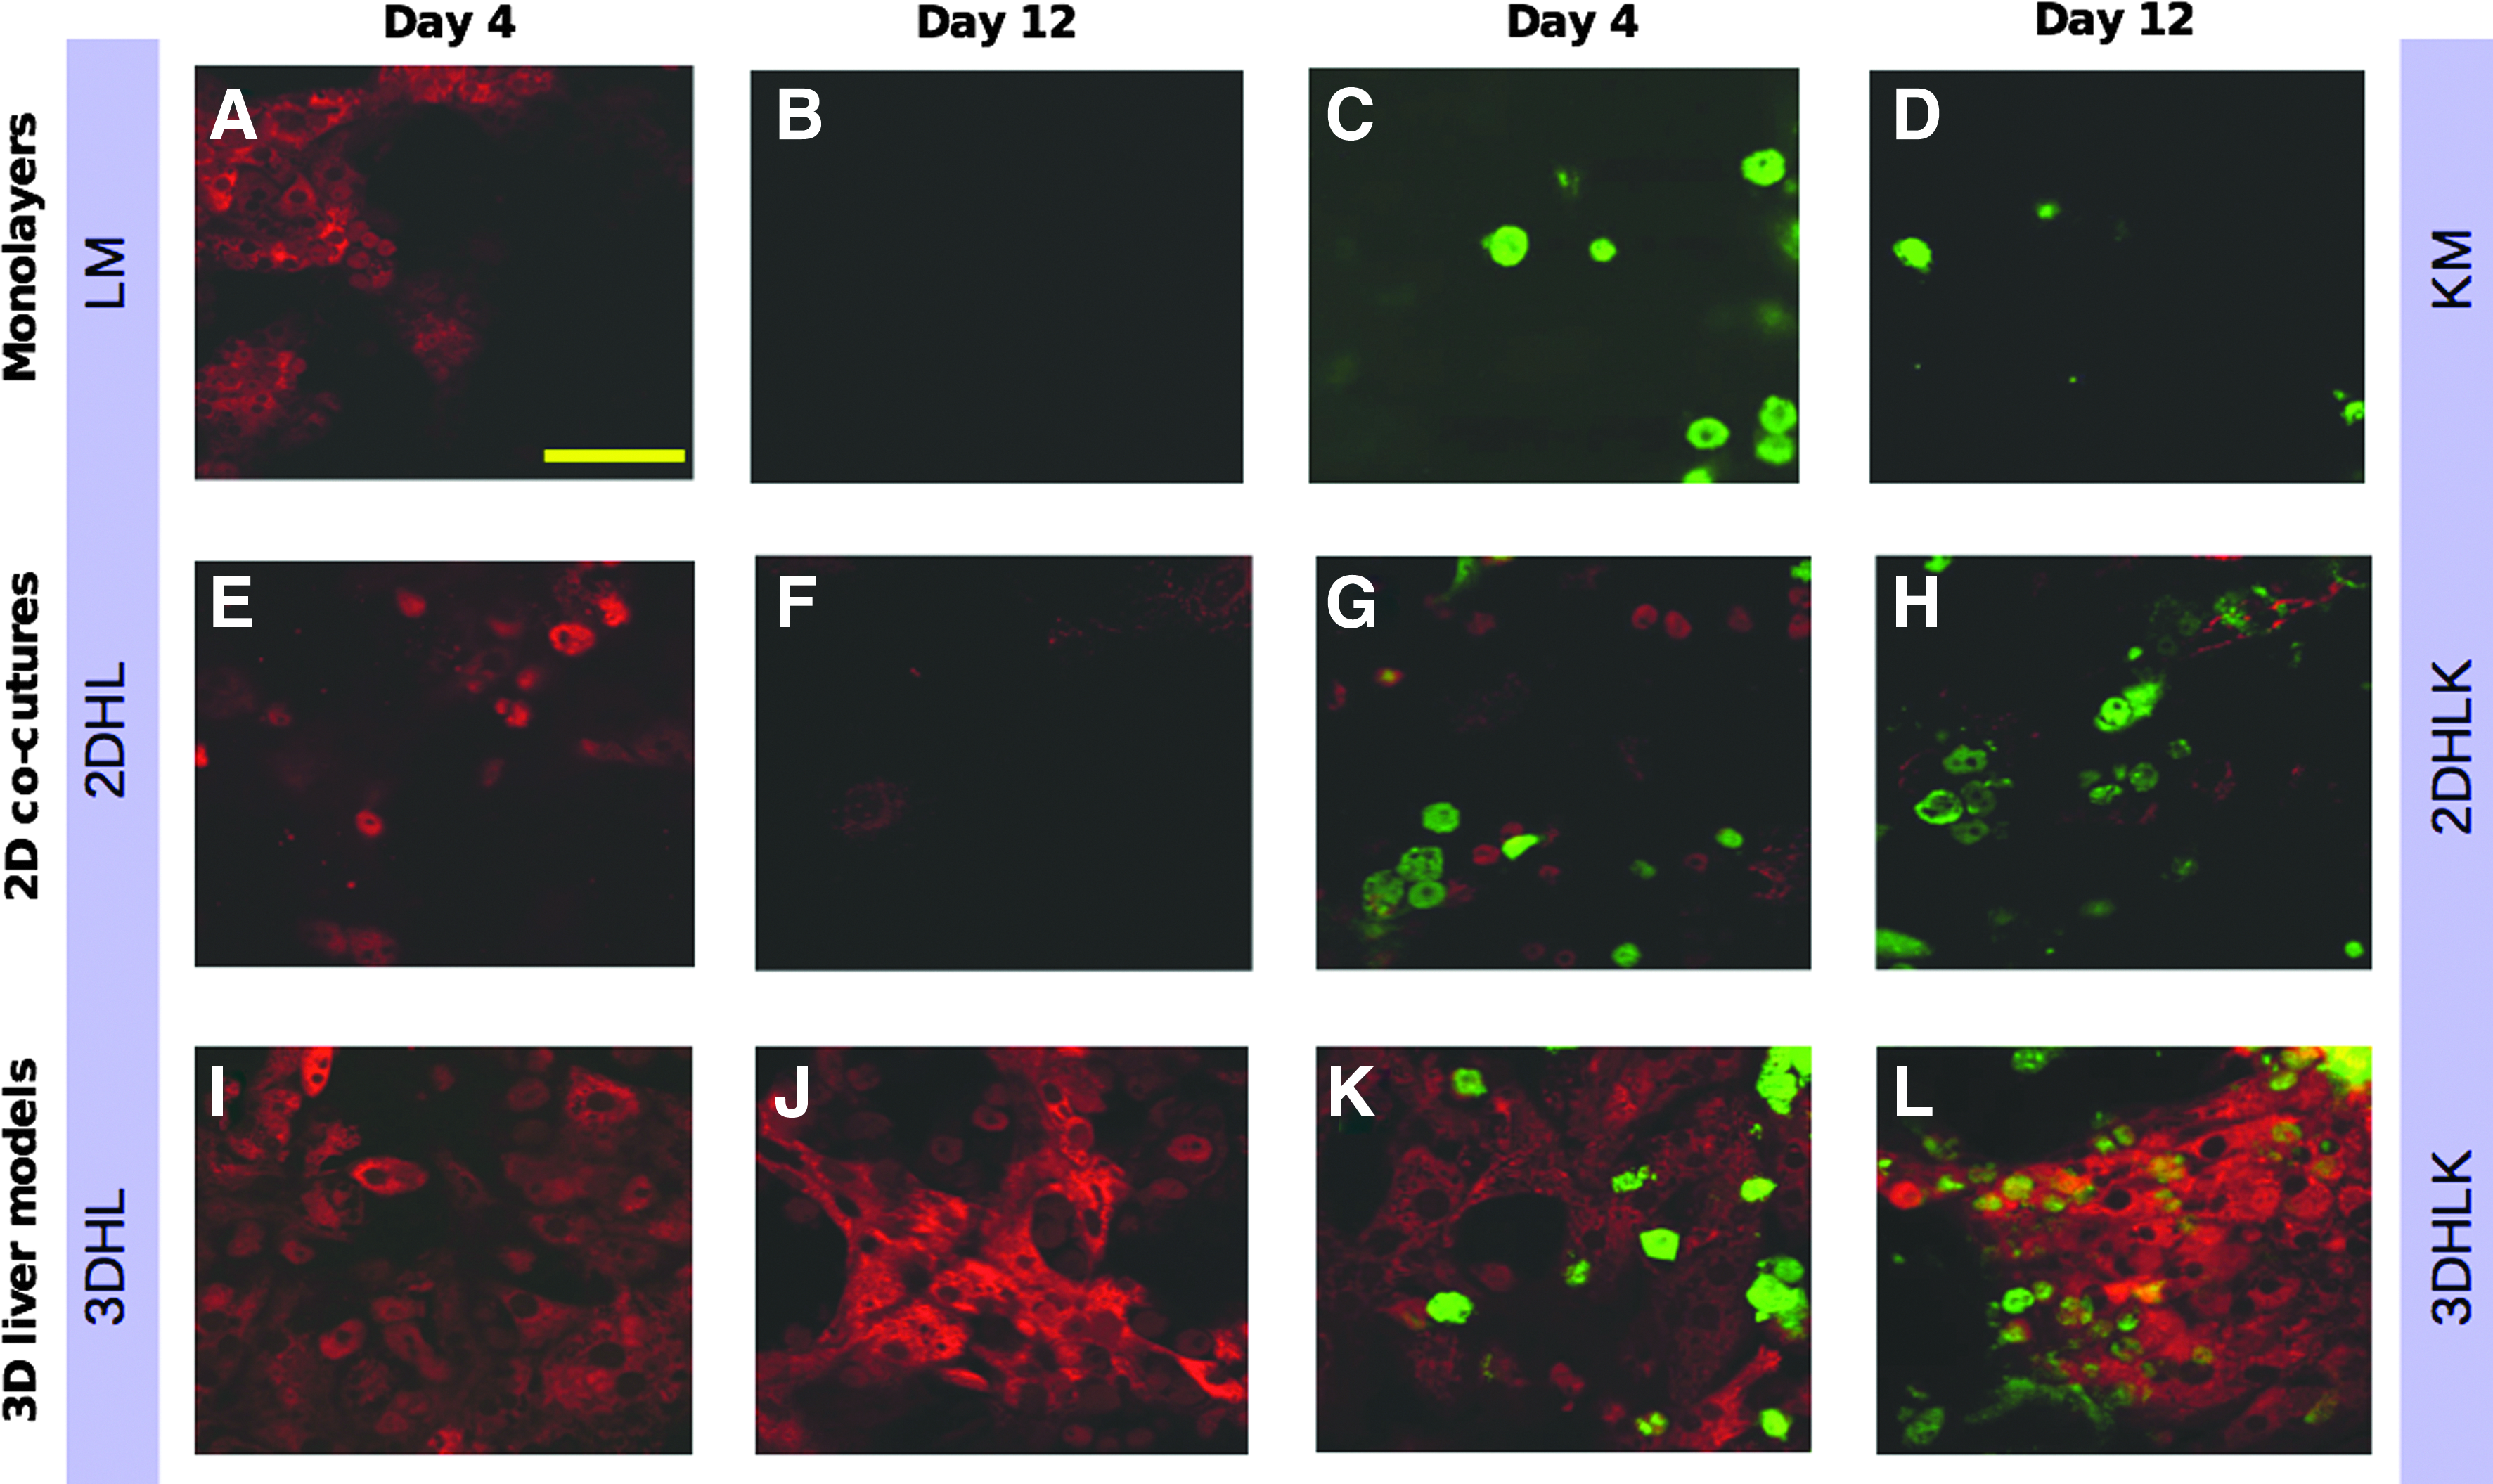
Immunofluorescence to assess the phenotype of liver sinusoidal endothelial cells (LSECs) (red) and Kupffer cells (KCs) (green). Merged fluorescence images obtained on day 4 in cultures
Investigating the migration of LSECs and KCs through the PEM
To investigate the potential migration of LSECs and KCs through the PEM into the hepatocyte layer, the PEM was removed on day 12 and the number of LSECs and KCs were counted by immunofluorescence imaging. These studies revealed that less than 1% of the cells below the PEM were LSECs or KCs (Table 2). Confocal imaging revealed no significant adhesion of hepatocytes on the bottom side of the PEM. Although HSCs were not included in the liver model, their number was also counted to identify the total NPC fraction present in the hepatocyte layer. Based upon Oil Red O staining, 32 HSCs accounted for <1% in 3DHL and 3DHLK cultures. These results demonstrated that the PEM served as an effective physical barrier.
LSECs, liver sinusoidal endothelial cells; KCs, Kupffer cell; HSC, hepatic stellate cells.
Measuring hepatic functions
Urea production, albumin secretion, and CYP1A1 activity were investigated to determine differences in hepatic function between 2D and 3D cultures. Overall, urea production remained stable in all cultures over the culture period (Supplementary Fig. S3). Albumin secretion remained stable in HMs and increased approximately twofold over the 12 day period in CS cultures (Fig. 4A). The 3D liver models exhibited higher albumin secretion in comparison to 2D cultures. Albumin secretion in 3DHLK cultures was statistically higher (p<0.05) than HM, CS, 2DHL, and 2DHLK and insignificant (p>0.05) in comparison to 3DHL.
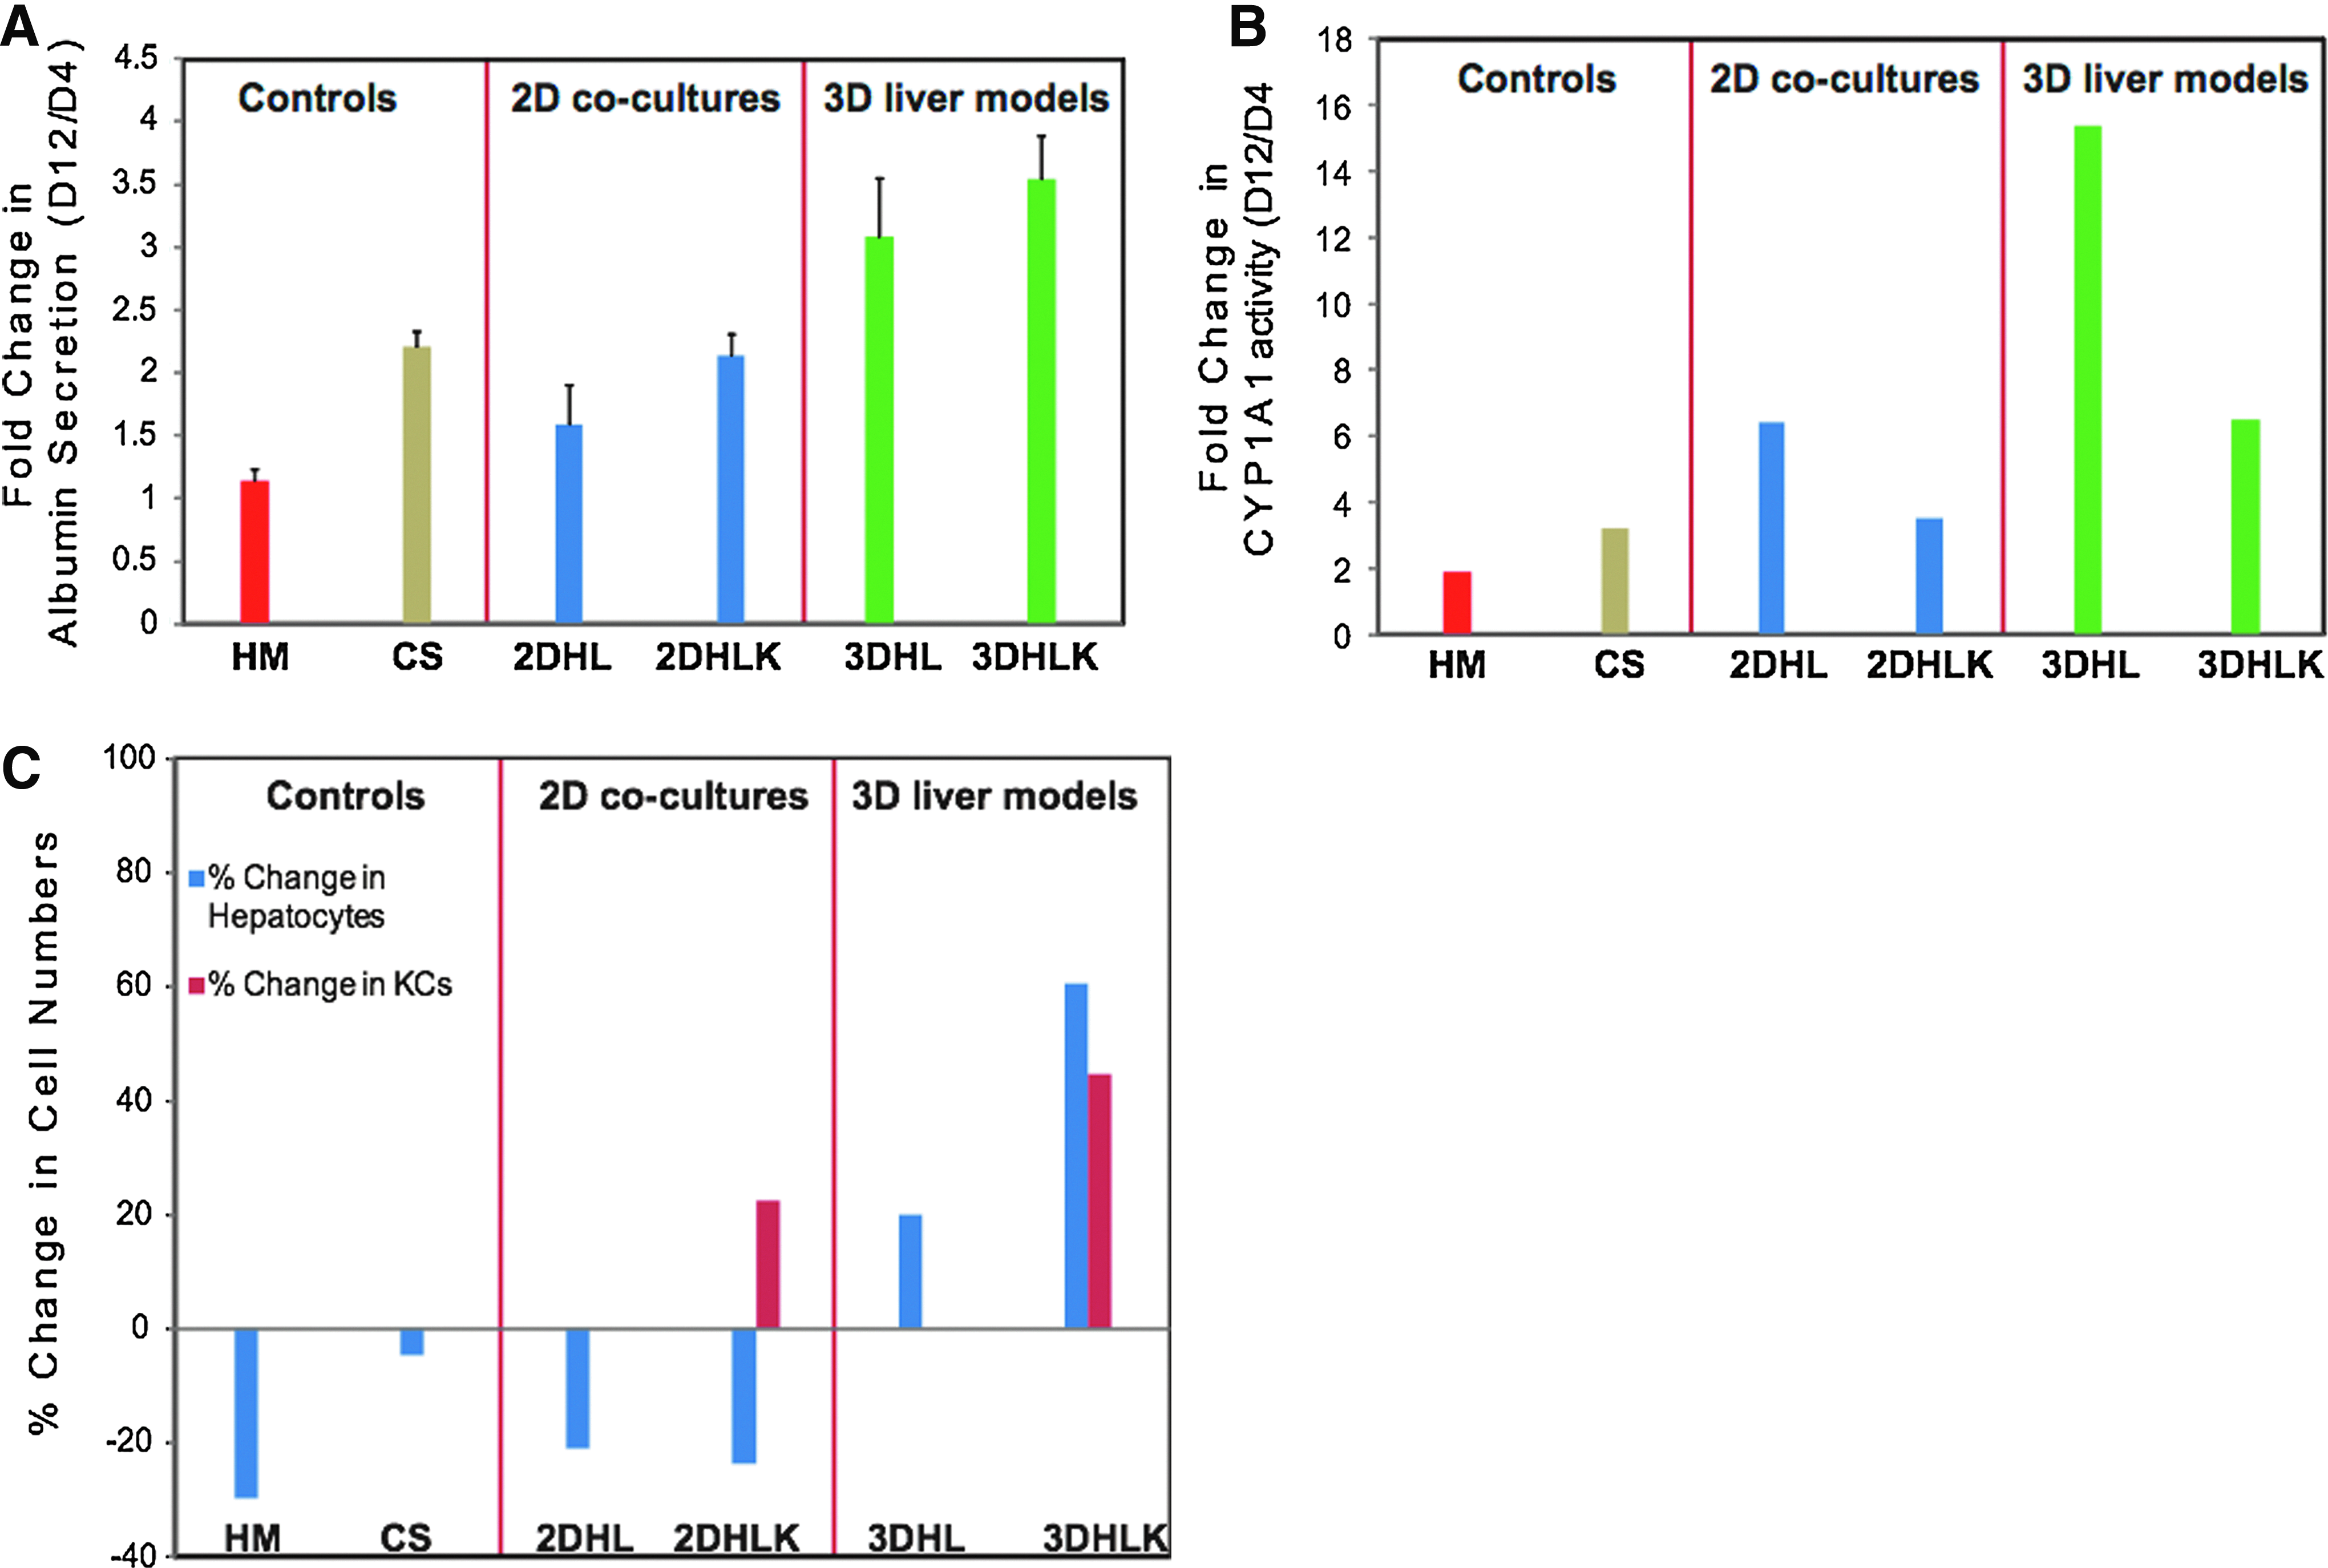
Measuring hepatic functions of 3D liver models.
HM and CS cultures exhibited only a moderate increase in CYP1A1 isoenzyme activity (Fig. 4B). In all cultures, the isoenzyme activity on day 12 was statistically higher than their day 4 values (p<0.05). 3DHL cultures exhibited the highest increase of ∼15-fold, at least twice as much as the other cultures. The presence of KCs in both 2D and 3D cultures reduced CYP1A1 activity by ∼50%. This decrease may be caused by the potential secretion of cytokines by KCs known to down regulate CYP function.11,33
Proliferation of hepatic cells and maintenance of in vivo cellular ratios
Significant differences in the numbers and ratios of hepatic cells were observed between 2D and 3D cultures. In addition to measuring cell counts on day 12, individual cell counts were also obtained at the later time point of day 16. A decrease in the number of hepatocytes was observed in HM (∼27%) and CS (∼5%) cultures. Approximately 21% and 23% of hepatocytes died in the 2D cocultures 2DHL and 2DHLK, respectively (Fig. 4C). In significant contrast, hepatocytes proliferated only in the 3D cultures (3DHL and 3DHLK). The 3D cultures exhibited up to a 60% increase in the number of hepatocytes by day 16. LSEC counts were five- to six-fold higher by day 16 in 2D and 3D cultures (Table 3). Although these data indicate that LSECs are proliferating in the 2D models, by day 12, these cells no longer exhibited expression of SE-1 antigen, suggesting that their phenotype is altered. The number of KCs increased by ∼22% and 45% in 2DHLK and 3DHLK cultures, respectively.
Bold numbers indicate ratios close to in vivo values.
It is remarkable that only the 3D liver models promoted the proliferation of all cell types, while maintaining cell ratios identical to those observed in vivo. In 3DHL and 3DHLK cultures, the ratio of hepatocytes:LSECs estimated to be 6:1 in vivo 33 was ∼6.7 on day 16, compared to ∼5 in the 2D models (Table 3). The in vivo ratio of hepatocytes:KCs is estimated to be 11:1 for a healthy liver 34 and 4:1 during inflammation. 11 In 2DHLK and 3DHLK cellular models, this ratio was found to be 9.9 and 10.9, respectively on day 4. However, by day 16, this ratio number of KCs in the 2DHLK cultures had increased to 7.9:1 suggesting a gradual progression towards inflammation. In contrast, this ratio was 12.3 in 3DHLK cultures on day 16, closer to a healthy hepatic cellular composition.
Transcriptional signatures corresponding to hepatocyte proliferation and phenotype in 3DHLK liver mimics
To obtain information on hepatocyte proliferation and enhanced function in 3DHL and 3DHLK, genome-wide gene expression data were obtained from hepatocytes in 3DHL and 3DHLK cultures and analyzed using GSEA (Fig. 5, Refer to Supplementary Data). Among the top thirty differentially expressed gene sets, we discuss those that support our earlier experimental observations (Fig. 6A).

Gene expression analysis of hepatocytes. The 30 most differentially expressed gene sets identified by Gene Set Enrichment Analysis (GSEA). The table shows the results for all pairs of culture conditions that were compared. Yellow highlights indicate gene sets discussed in the text.
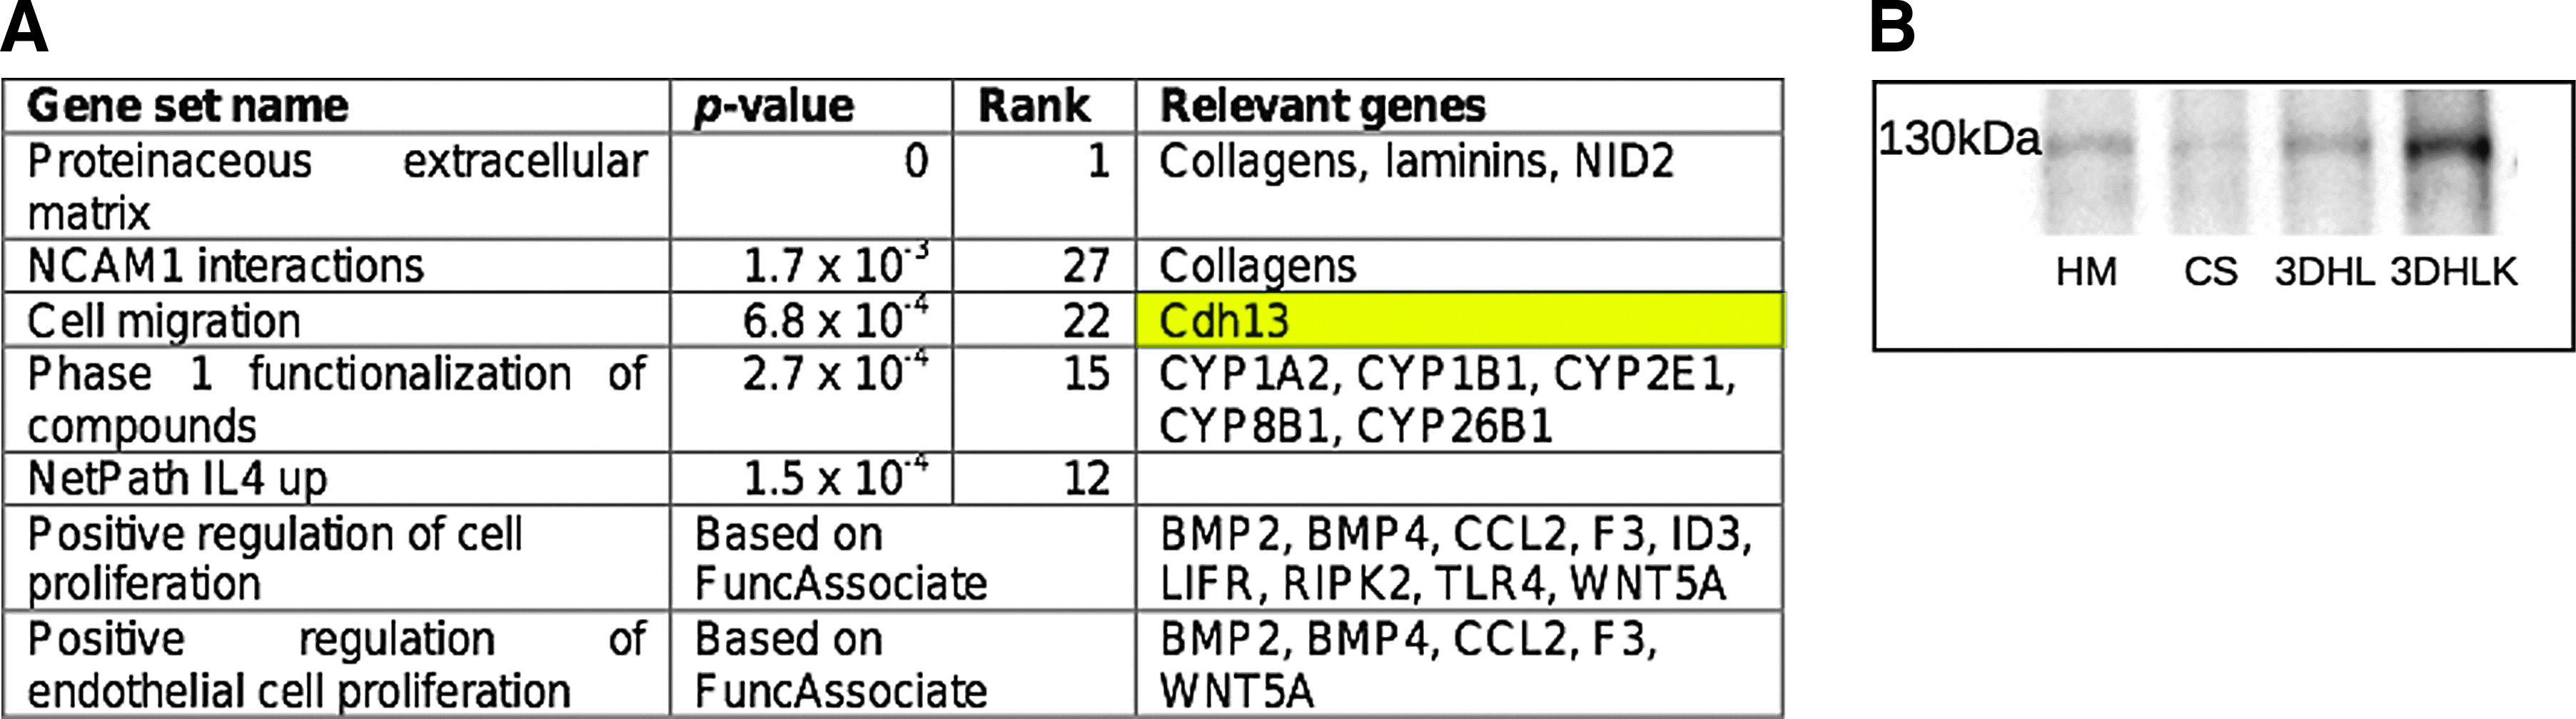
The gene set “Proteinaceous extracellular matrix” (GO: Gene Ontology 0005578) was highly up-regulated (p-value 0, rank 1). Leading edge genes annotated to this GO term include over seven types of collagen, nidogen 2, and laminins. These proteins are typically found in basement membranes. 35 For example, nidogen 2 is known to link collagen and laminin molecules. Although basement membranes are not usually associated with adult liver, they are expressed during hepatic regeneration and liver development.1,35 The Reactome pathway “NCAM1 interactions” (p-value 1.7×10⁻³, rank 27) was also upregulated. The neural cell adhesion molecule, NCAM1 is a surface glycoprotein belonging to the immunoglobulin family that plays a role in liver development. 36 While NCAM1 is itself not highly upregulated in the comparison between 3DHL and 3DHLK, the leading edge of this pathway includes several types of collagens, many of which are also members of the leading edge of “Proteinaceous extracellular matrix” gene set.
The gene set corresponding to the GO term “Cell migration” (GO:0016477, p-value 6.8×10⁻⁴, rank 22) is highly upregulated in hepatocytes in 3DHLK. Of particular interest in this leading edge, was the gene cadherin 13 (CDH13 or T-cadherin). Although this protein is shown to be very weakly expressed in normal hepatocytes, 37 a recent study has shown that hepatocellular functions are enhanced in the presence of CDH13. 38 Western blots for CDH13 demonstrated that its precursor protein (MW 130 kDa) was observed in 3DHLK but only weakly expressed in HM, CS and 2DHL cultures (Fig. 6B).
The Reactome pathway for Phase 1 functionalization of compounds is up-regulated with p-value 2.7×10⁻⁴ and rank 15. Phase 1 CYP enzymes are known to catalyze the detoxification of a wide range of compounds and they exhibit broad substrate specificity. Although the leading edge of this gene set contains several members of the cytochrome P450 family, CYP1A1 was not a member of this leading edge. In fact, it was among the highly downregulated genes in the comparison of 3DHLK to 3DHL cultures, corroborating our earlier observation that the presence of KCs decreased CYP1A1 activity.
Discussion
The hepatic microenvironment is a complex structure comprised of multiple cell types and well-defined cellular ratios. Although some liver functions can be elicited by CS and 2D cocultures, these systems either lack NPCs or do not maintain physiological cellular ratios. Moreover, several in vitro hepatic cultures have been shown to exhibit liver functions, but their physiological relevance is limited due to significant deviation from in vivo cellular composition. To the best of our knowledge, we are not aware of any other liver model that mimics the Space of Disse, incorporates more than two hepatic cell types, and simultaneously maintains their phenotypes and cellular ratios. In this study, detachable, nanoscale PEMs whose properties were tuned to those of the Space of Disse played a critical role in maintaining a physical barrier between hepatic parenchymal and NPCs. Remarkably, only the 3D organotypic hepatic model simultaneously exhibited proliferation of all cell types, while maintaining cell ratios observed in vivo. We hypothesize that this polymeric interface promoted heterotypic cellular interactions via soluble molecules. Future studies will focus on this hypothesis.
A significant and novel finding of this work was that hepatocytes expressed CDH13 in the 3DHLK liver models. The current study detected the precursor form of the CDH13 protein. Wide variations in molecular weights have been reported for this protein with sizes ranging from 45 to 130 kDa. 39 These variations have been attributed to tissue-specific stability, post-translational glycosylation, and variations in commercial antibodies to CDH13. 39 So far CDH13 has been detected only in proliferating hepatic carcinoma cells. 37 To the best of our knowledge, this is the first study in which this protein has been detected in healthy hepatocytes. In general, the role of T-cadherin in the liver and the mechanisms underlying its transcriptional control remain cryptic and merit further investigation.
The intricate patterns of intercellular signaling in the liver arising due to the spatial arrangement of hepatic cells cannot be recapitulated by monolayers or cocultures. The analysis of DNA microarray data suggested that inter-cellular signaling may be responsible for key observations in the present study. For example, the gene set “Netpath IL4 up” (rank 12, p-value 2×10⁻⁴) was notable. The genes in “Netpath IL4 up” are transcriptionally upregulated when the IL4 pathway is stimulated. The upregulation of this gene set indirectly suggests that the IL4 pathway is active in hepatocytes in 3DHLK but not in 3DHL cultures. Note that the “Netpath IL4” gene set itself is not considered to be enriched by GSEA (p-value 1), perhaps because proteins in the IL4 pathway may not be differentially expressed when the IL4 pathway is stimulated. FuncAssociate analysis revealed that the genes in the leading edge of “Netpath IL4 up” were themselves enriched in the closely related GO terms “positive regulation of endothelial cell proliferation” and “positive regulation of cell proliferation” (Fig. 4). Previous studies have not implicated these genes in LSEC proliferation. However, each of these genes is known to promote the proliferation of other endothelial cells.40–42 These data suggest that an intricate signaling pathway involving all three cell types may be activated in 3DHLK cultures: KCs may initiate this pathway by secreting IL4, causing the activation of the IL4 pathway in hepatocytes, upregulating the expression of numerous genes, including those whose protein products may cause the proliferation of LSECs. Although LSECs proliferate in all cultures, only the transcriptional data in 3DHLK cultures indicate that other hepatic cell types may play a role. These pathways merit further investigation. By modifying the chemical and physical properties of detachable PEMs, they can be substituted for basement membranes of any type of tissue. Such versatility promises to find applications in other areas of biomaterials and tissue engineering.
Footnotes
Acknowledgments
We gratefully acknowledge financial assistance from the National Institutes of Health (5R21DK077802, P.R.), National Science Foundation (DMR 090750, P.R.; CBET 0933225, P.R. and T.M.M.; DBI 1062380 T.M.M. and P.R.), US EPA (R834998, P.R. and T.M.M.), and the ICTAS Center for Systems Biology of Engineered Tissues, Virginia Tech (P.R. and T.M.M.). We thank Reisha Parham for assistance with experiments.
Disclosure Statement
No competing financial interests exist.
References
Supplementary Material
Please find the following supplemental material available below.
For Open Access articles published under a Creative Commons License, all supplemental material carries the same license as the article it is associated with.
For non-Open Access articles published, all supplemental material carries a non-exclusive license, and permission requests for re-use of supplemental material or any part of supplemental material shall be sent directly to the copyright owner as specified in the copyright notice associated with the article.